Article

How Climate Change and Land Use/Land Cover Change Affect Domestic Water Vulnerability in Yangambi Watersheds (D. R. Congo)

by
David Ushindi Chishugi
1,2,*,
Denis Jean Sonwa
3,
Jean-Marie Kahindo
4,
Destin Itunda
1,
Josué Bahati Chishugi
5,
Fiyo Losembe Félix
6 and
Muhindo Sahani
7
1
Faculty of Sciences, University of Kisangani, Kisangani P.O. Box 2012, Democratic Republic of the Congo
2
Higher Institute of Rural Development (ISDR), Fizi-Baraka, Baraka P.O. Box 3579, Democratic Republic of the Congo
3
Center for International Forestry Research (CIFOR), Yaoundé P.O. Box 2008 Messa, Cameroon
4
Department of Botany, University of Kisangani, Kisangani P.O. Box 2012, Democratic Republic of the Congo
5
Department of Geology, Official University of Bukavu, Bukavu P.O. Box 570, Democratic Republic of the Congo
6
Faculty of Renewable Natural Resources Management, University of Kisangani, Kisangani P.O. Box 2012, Democratic Republic of the Congo
7
Faculty of Agronomic Sciences, Catholic University of Graben, Butembo P.O. Box 29, Democratic Republic of the Congo
*
Author to whom correspondence should be addressed.
Land 2021, 10(2), 165; https://doi.org/10.3390/land10020165
Submission received: 15 December 2020 / Revised: 26 January 2021 / Accepted: 2 February 2021 / Published: 6 February 2021
(This article belongs to the Special Issue Impact of Land-Use Change on Water Resources)

Abstract

:
In the tropics, the domestic water supply depends principally on ecosystem services, including the regulation and purification of water by humid, dense tropical forests. The Yangambi Biosphere Reserve (YBR) landscape is situated within such forests in the Democratic Republic of Congo (DRC). Surprisingly, given its proximity to the Congo River, the YBR is confronted with water issues. As part of its ecosystem function, the landscape is expected to reduce deterioration of water quality. However, environmental consequences are increasing due to conversion of its dense forest into other types of land use/land cover (LULC) in response to human activities. It is therefore important to check how the physicochemical quality parameters of water resources are influenced by landscape parameters—and to know if the population can adapt to this water vulnerability. To do this, we analyzed the watershed typology (including morphometric and LULC characteristics) and the physical and chemical parameters of water within the principal watershed’s rivers. We also analyzed data from surveys and the Yangambi meteorological station. We found that some landscape indices related to LULC significantly influence water quality deterioration in Yangambi. On average, each person in the Yangambi landscape uses 29–43 liters of water per day. Unfortunately, this falls short of World Health Organization standards regarding some parameters. The best fitted simple linear regression model explains the variation in pH as a function of edge density of perturbed forest, edge density of crop land and patch density of dense forest up to 94%, 92% and 90%, respectively. While many researchers have identified the consequences of climate change and human activities on these water resources, the population is not well-equipped to deal with them. These results suggest that water management policies should consider the specificities of the Yangambi landscape in order to develop better mitigation strategies for a rational management of water resources in the YBR in the context of climate change.

1. Introduction

Many scientists are increasingly noting the influence of land use patterns on the degradation or improvement of water quality [1,2]. Among other types of land use/land cover (LULC), dense tropical forest has been found to help improve the physicochemical quality of water at the watershed level. In addition to other services, these forests also offer vital ecosystem services related to the regulation and purification of water resources. They also improve the supply and quality of water used for the different needs of forest households [3]. In 2006, for example, one study estimated that at least 77 million people depended directly or indirectly on these ecosystems for water supply for their different domestic demands in the Congo Basin [4].
Given that dense tropical rainforests cover three-quarters of the Democratic Republic of Congo (DRC) [5], the country should not experience water problems [6]. Indeed, DRC accounts for around 11% of total tropical rainforests worldwide and 60% in Africa [7]. This constitutes a major asset in terms of the regulation and renewal of its water resources. DRC alone has the most important hydrological resource in Africa—and in the world after the countries of the Amazon basin [6]. Its surface water represents about 35% and 52% of water reserves of the world and Africa, respectively [8]. Due to DRC’s low population density, its per capita water availability potential is very high: 15,000 to 70,000 m3 per person per year [9].
Unfortunately, as in most sub-Saharan African countries, the rate of access to safe water and sanitation remains paradoxically low [4]. Despite DRC’s large hydrological reserves, only 29% of its rural population and 79% of its urban population have access to quality water to meet their various basic needs, particularly those related to domestic use [9].
Mismanagement is often cited to explain water issues in sub-Saharan countries in general—and in DRC in particular [10]. In the past, water management in DRC focused mainly on the demands for urban supplies, irrigation and hydropower. This approach did not consider the potential impacts on the environment. Indeed, a good proportion of the population in rural areas lacked access to drinking water [4].
In Yangambi, an urban–rural area of Tshopo province in DRC, the National Rural Hydraulic Service (NRHS) is struggling to fulfill its mission because of a lack of funds and insufficient capacity to monitor the water resource. The few boreholes for standpipes in certain settlements (Bangala, Lumumba and Ekutsu), drilled in collaboration with partners, are no longer operational. Hence, access to quality water from the water points remains problematic. The population obtains water for its various domestic needs from springs and rivers, which are mostly unprotected.
A survey of 29 water suppliers in the United States by the Trust for Public Lands and the Spring Protection Committee showed that treatment costs are inversely related to the proportion of the watershed protected by forests, wetlands and other open space [11]. In many regions, loss of forest land leads directly to water quality degradation. Therefore, land conservation and pollution prevention have proven to be cost-effective strategies [11]. Unfortunately, research in DRC rarely aims to quantify the site-specific benefits and costs of land conservation. This is the case when it comes to YBR’s forest massif. It should function as a buffer zone to limit deterioration of water quality for domestic use, at a lower cost, as is the case in several places around the world [4]. However, it is getting more and more degraded. This massif is under intense pressure as a result of climate change [12] and the various livelihood activities linked to the demographic explosion in the zone [13]. Different land uses, mainly small-scale slash-and-burn agriculture, were reportedly responsible for an estimated 84% of forest disturbance in the Congo Basin from 2000 to 2014, fragmenting it into other new LULC types [14,15]. Most alarmingly, predictive models of forest cover in this area show the situation is likely to worsen [14].
This deterioration of primary forest cover into other LULC types is thus likely a danger to the sustainability of watersheds in terms of water quality regulation [16]. Integrated watershed management practices and their conservation strategies—including social, economic and ecological components—are important ways to improve water quality production and reduce environmental degradation in the territory [17]. Thus, it is getting more difficult for countries to promote development strategies in protected areas such as the YBR without demonstrating their importance for local communities and society in general, especially the links between protected areas and water resources. For example, in many countries, the linkage between domestic water use and drinking water must be integrated into the management of these areas [18].
Many reports by development agencies have noted the degradation of water quality in the region. In response, a careful assessment of the state of domestic water resources at the YBR (Yangambi Biosphere Reserve) is needed. This was proposed in a report by the Center for International Forestry Research (CIFOR) in 2018 [19]. Such an assessment must consider how different types of LULC at the watershed level can influence the quality of the resource. An accurate assessment of the water resource, which considers its various components, is vital to ensure successful water management [20,21].
Hence, the objectives of this study are (i) to typologize the watersheds in the Yangambi area in connection with the water physicochemical quality of the rivers in Yangambi; (ii) to verify whether the water physicochemical quality of the rivers in Yangambi meets World Health Organization (WHO) standards; and (iii) to analyze and assess the link between water and climate change adaptation (including vulnerability to climate change).

2. Materials and Methods
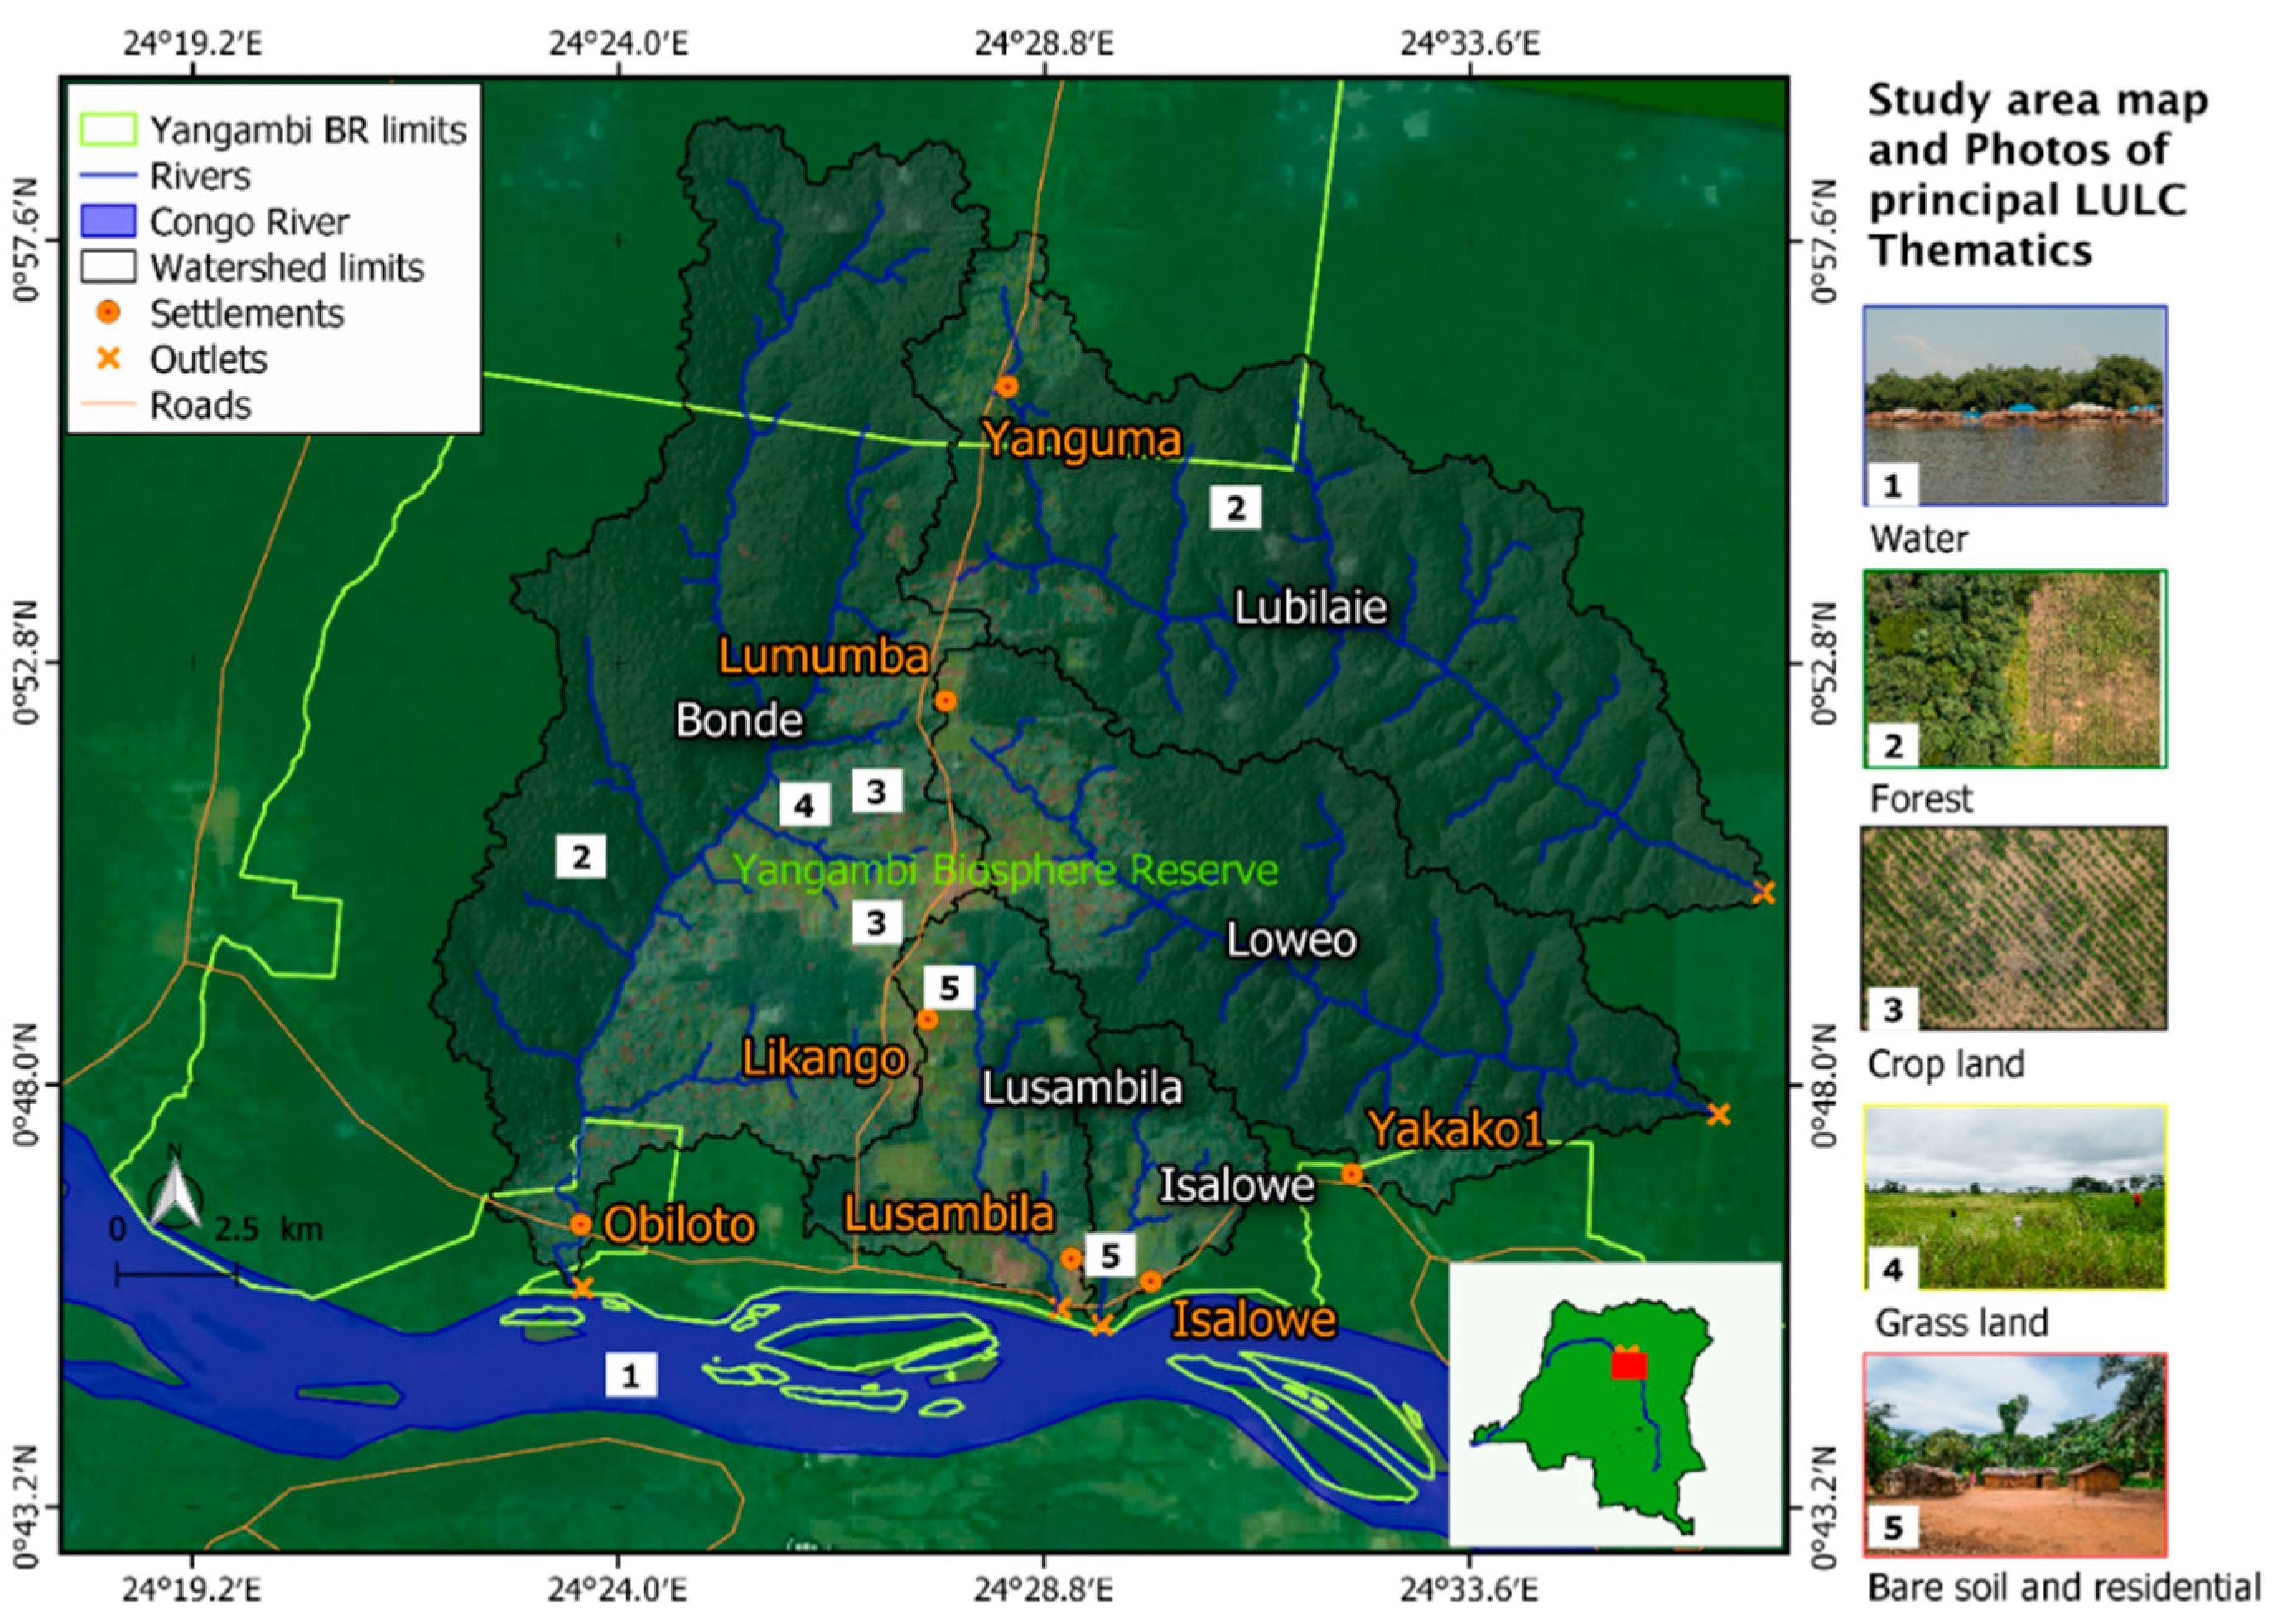
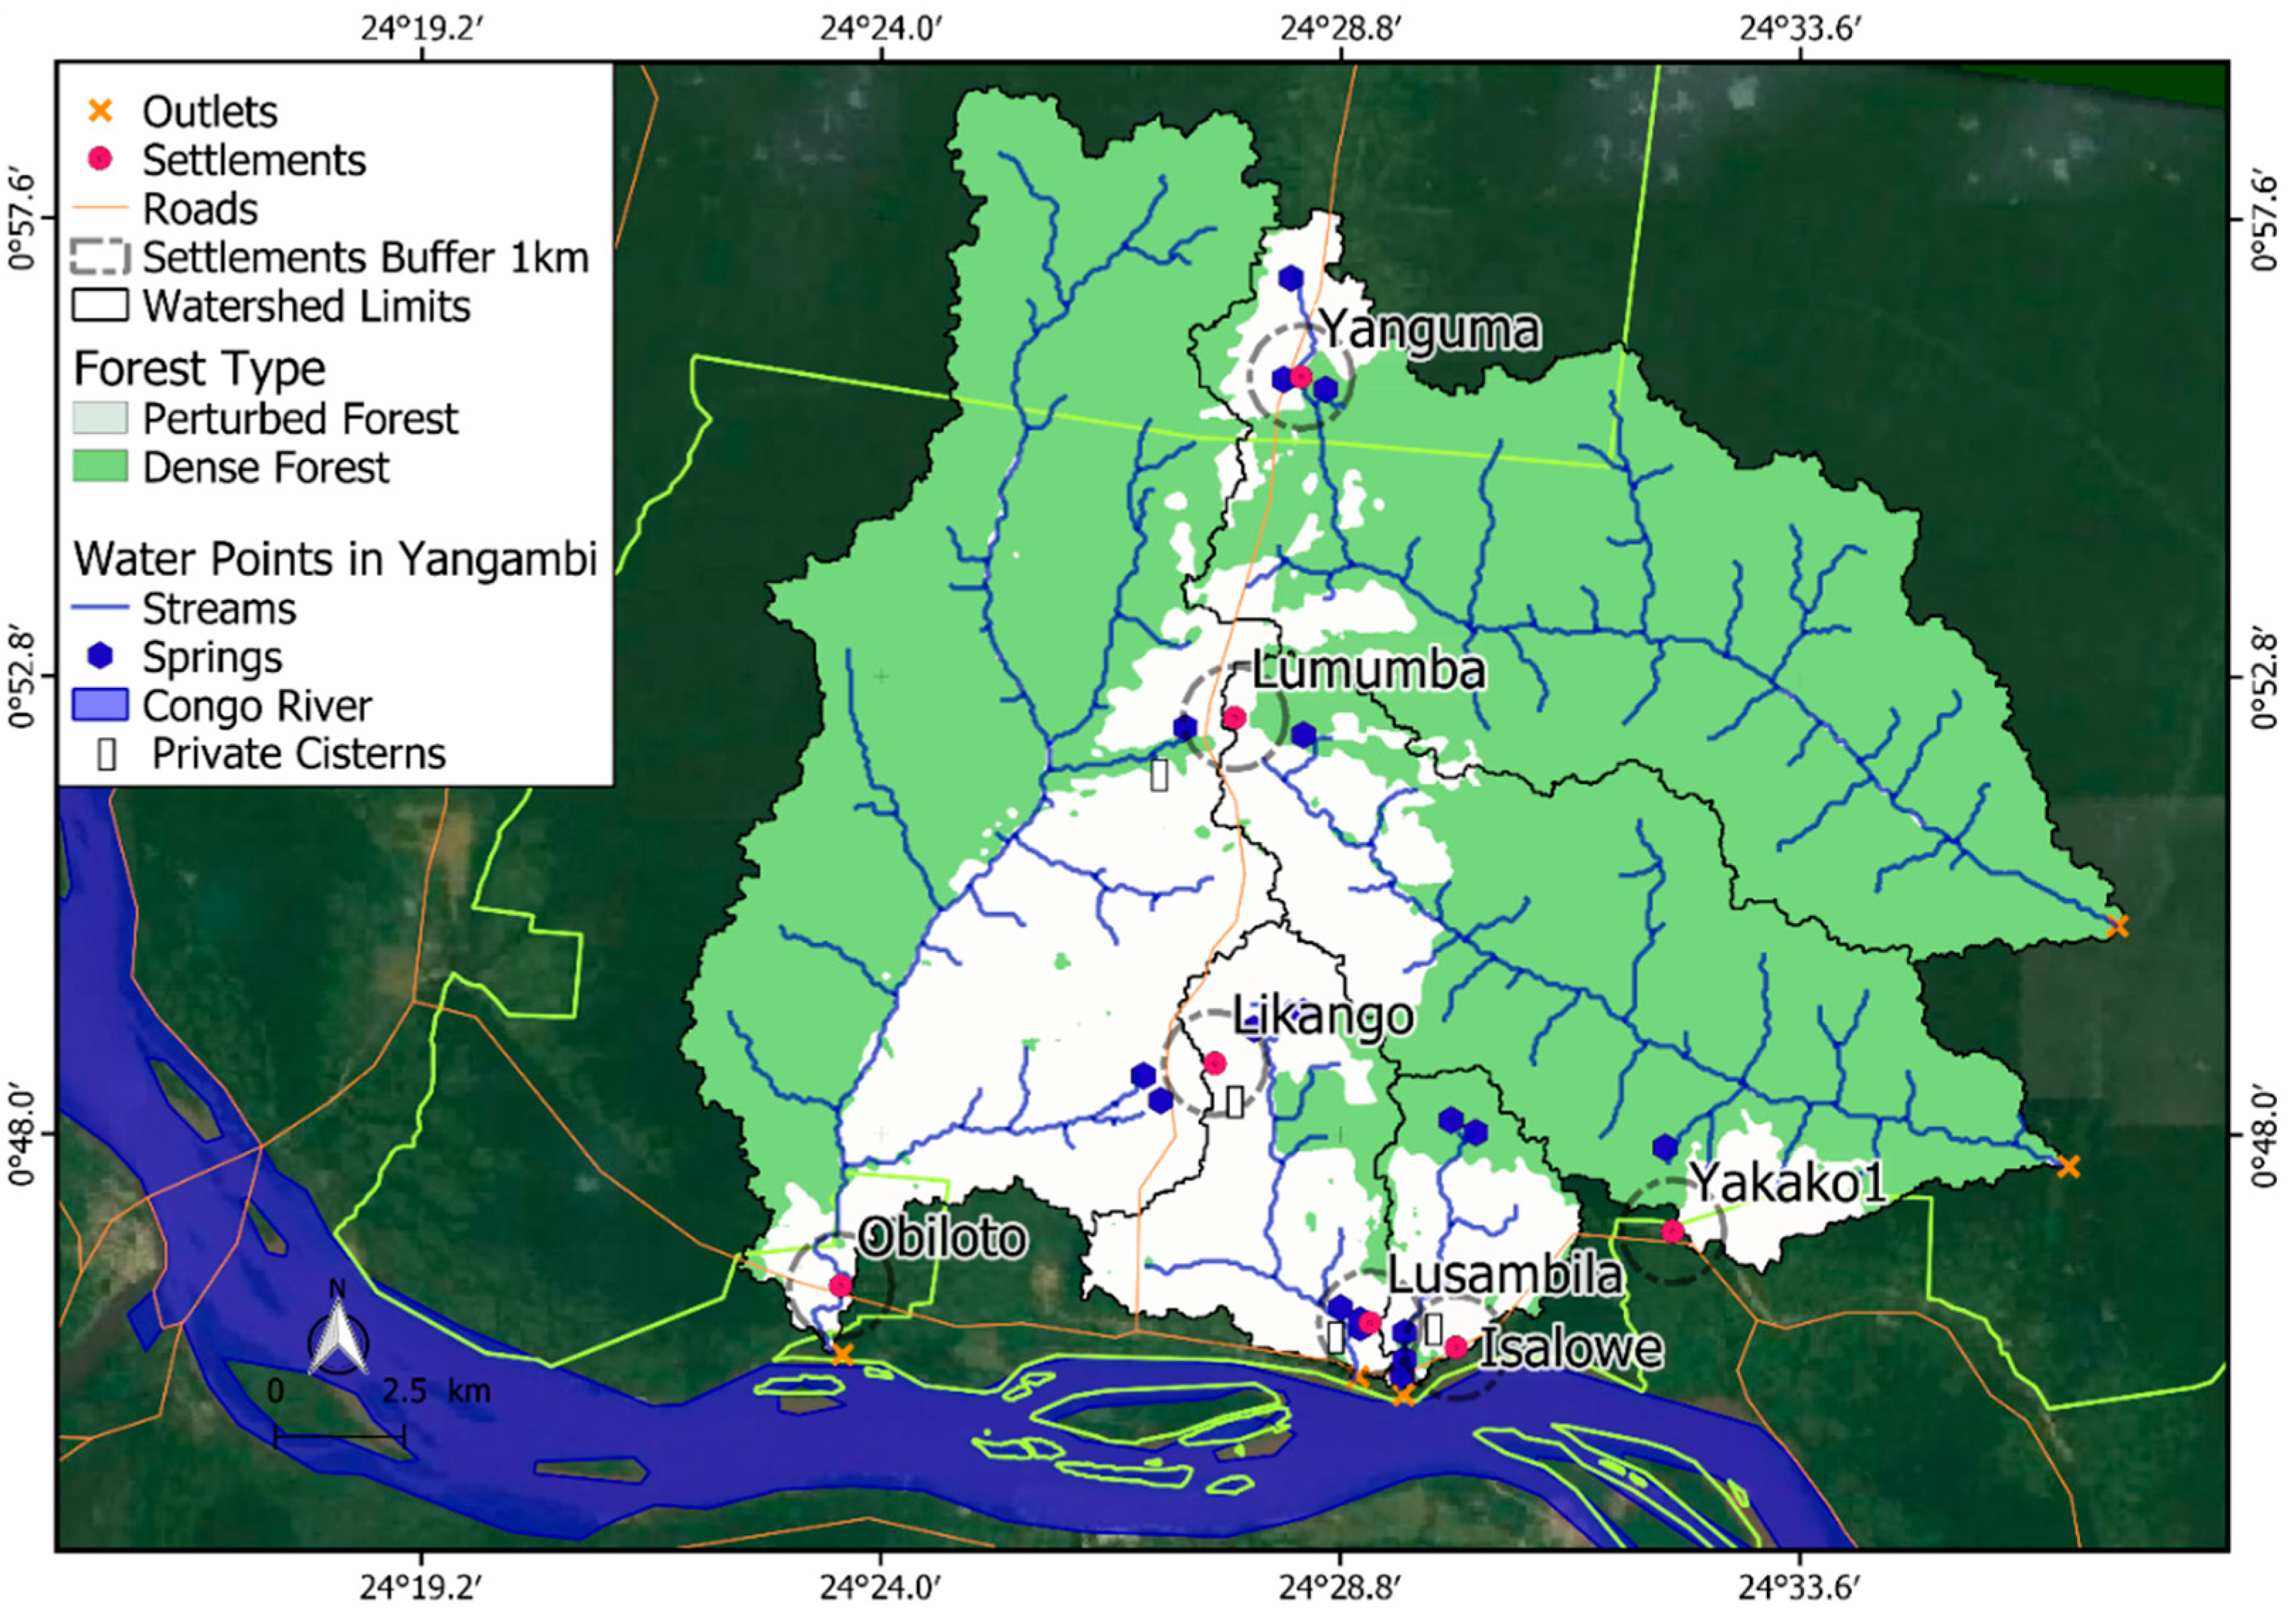
2.1. Study Site

The study site is in the watersheds (irrigated by the Lusambila, Isalowe, Bonde, Lubilaie and Loweo rivers) of Yangambi in Tshopo province of DRC. It extends over an area of about 430.2 km2. The geographical position is between 0°45′58.1″ north latitude and 24°4′6.13″ east longitude, approximately 100 km west of Kisangani. Five main rivers irrigate this study area, of which three (Lusambila, Isalowe and Bonde) are direct tributaries to the Congo River, while the two others (Lubilaie and Loweo) initially flow into the Lobilo stream before flowing into the Congo River (Figure 1). These watersheds are part of the larger Congo River watershed in the equatorial region, consisting mainly of dense rainforests [22].

2.2. Methods

2.2.1. Data Collection

(a) Watershed delineation and morphometric characteristics
To delineate the five main watersheds in the study area, we used a shuttle radar topography mission (SRTM) file to obtain a digital terrain model. From there, we generated flow directions, flow accumulation raster and talweg segments. With the coordinates of the outlet, these tools helped us produce the raster of the watershed limits. This was then polygonized, to transform it into vectors to bring out the watershed boundaries.
From this watershed vectors shapefile, we generated the morphometric characteristics. These included the area (km2), perimeter (km), Gravellius index (KG), average slope (%), stream length (km), drainage density (km/m2), altitude (m), equivalent rectangle [length (km) and width (km)] and the different altitudes for different areas (hypsometry) within watersheds.
(b) Land use at watershed level
We also produced landscape characteristics related to LULC in the watersheds from QGIS version 2.18.18 software. To detect differences in land cover within the watersheds, we downloaded two Sentinel_2B images for the complete study area from http://www.usgs.gov/ (accessed on 7 June and 1 September 2018) (United States Geological Survey). The processing of these two images consisted primarily in their correction. We assigned any clouds perceptible on the images—which could bias the quality of the classification—to the non-data class, i.e., without any appropriate theme. We then created virtual files of these two images. On the latter image, we carried out the random forest supervised classification to generate the different LULC in the Yangambi watersheds. Six training zones were created for each thematic class. The main land uses in Yangambi guided the choice of different training zones. These training zones and the images to be classified were imported into Monteverdi/OTB-6.2.0-Win64 software to generate the classification model and the confusion matrix. Based on this classification model, the Sentinel_2B image was classified into six different land use classes related directly to the different types of LULC in Yangambi. The confusion matrix allowed verification only of the accuracy of the classification performed by the computer. It was used to ensure no overlap between thematic classes. The latter had provided a precision rate of 96%, which was considered acceptable. Before carrying out the analyses, we checked the accuracy of the classification. To that end, we used 50 samples points produced randomly over the entire set of each polygon vector of the different types of LULC in the virtual classified image. We then imported these points into Google Earth to verify whether the thematic classes generated by the supervised random forest classification truly corresponded to the information that characterizes the study environment.
Finally, the LecoS 2.0.7 extension in QGIS version 2.18.18 allowed us to automatically produce landscape composition and configuration indices from the classified image. The following landscape indices were produced:
I.
Composition indices: dense forest (DF), perturbed forest (PF), crop land (CL), grass land (GL), and bare soil and residential (BSR).
II.
Configuration indices: edge density (ED), patch density (PD), great patch area (GPA), mean patch area (MPA) and number of patches for the different composition indices (Table 1).
(c) Analysis of physicochemical quality of water
Analysis focused mainly on the measurement of some physicochemical quality parameters, such as temperature, pH, conductivity, turbidity and dissolved oxygen. We recognized these parameters as basic or synthetic. However, parameter selection was constrained by lack of sufficient funds and the unavailability of materials to carry out more detailed analyses.
We carried out on-site analyses of pH, conductivity, dissolved oxygen and turbidity at the site of sample collection following the standard protocols and methods of the American Public Health Organization [23]. The temperature, conductivity, pH, dissolved oxygen and turbidity were measured using multiparameter HACH® Test Kits. We calibrated the instruments daily using standard solutions prior to taking samples. Each sample was poured in the sample holder and kept inside for a few minutes. After achieving reading stability, we recorded the value. We collected water samples at the springs, at the cisterns’ level 50 cm below the surface and at the rivers’ outlets, preferably in the morning (to test the samples under homogeneous conditions), over 17 days, from 20 June 2019 to 6 July 2019.
(d) Study of the water resource’s vulnerability in relation to climate change
We used two different approaches to analyze the climate change vulnerability of water resources in Yangambi: a qualitative approach (based on survey results) and a biophysical approach (based on the meteorological data analysis from the Yangambi station).
The qualitative approach consisted of a survey on the state of water resources (including access, availability, capacity, use and environment) in Yangambi. This was based on the Water Poverty Index (WPI) as proposed by Sullivan and colleagues in 2002 [20]. A sample size of 200 individuals was used for this purpose, based in the different settlements (Yakako, Yanguma, Isalowe, Lusambila, Likango, Obiloto and Lumumba) in the watersheds. The biophysical approach consisted of analyzing meteorological parameters such as wind speed, mean annual temperature and mean annual rainfall.

2.2.2. Data Processing and Statistical Analysis

The fieldwork data were encoded in an Excel spreadsheet. The processing and statistical analysis of the data were done using the same Excel spreadsheet, R software (version R x 64 3.5.1) and QGIS software (version 2.18.18, extension LecoS 2.0.7).
We generated descriptive statistics, including mean, mode, standard deviation and coefficient of variation from the survey data. We performed the Shapiro and Kolmogorov tests to verify the normality and distribution of the data. We then compared the averages of the physicochemical parameters of the water points in the different watersheds based on an analysis of variance (ANOVA). To understand the influence of LULC parameters on water physicochemical quality, we used the Pearson correlation test and simple linear regression (SLR) models. Data with non-normal distribution were log transformed.

3. Results

3.1. Watershed Typologies in Yangambi

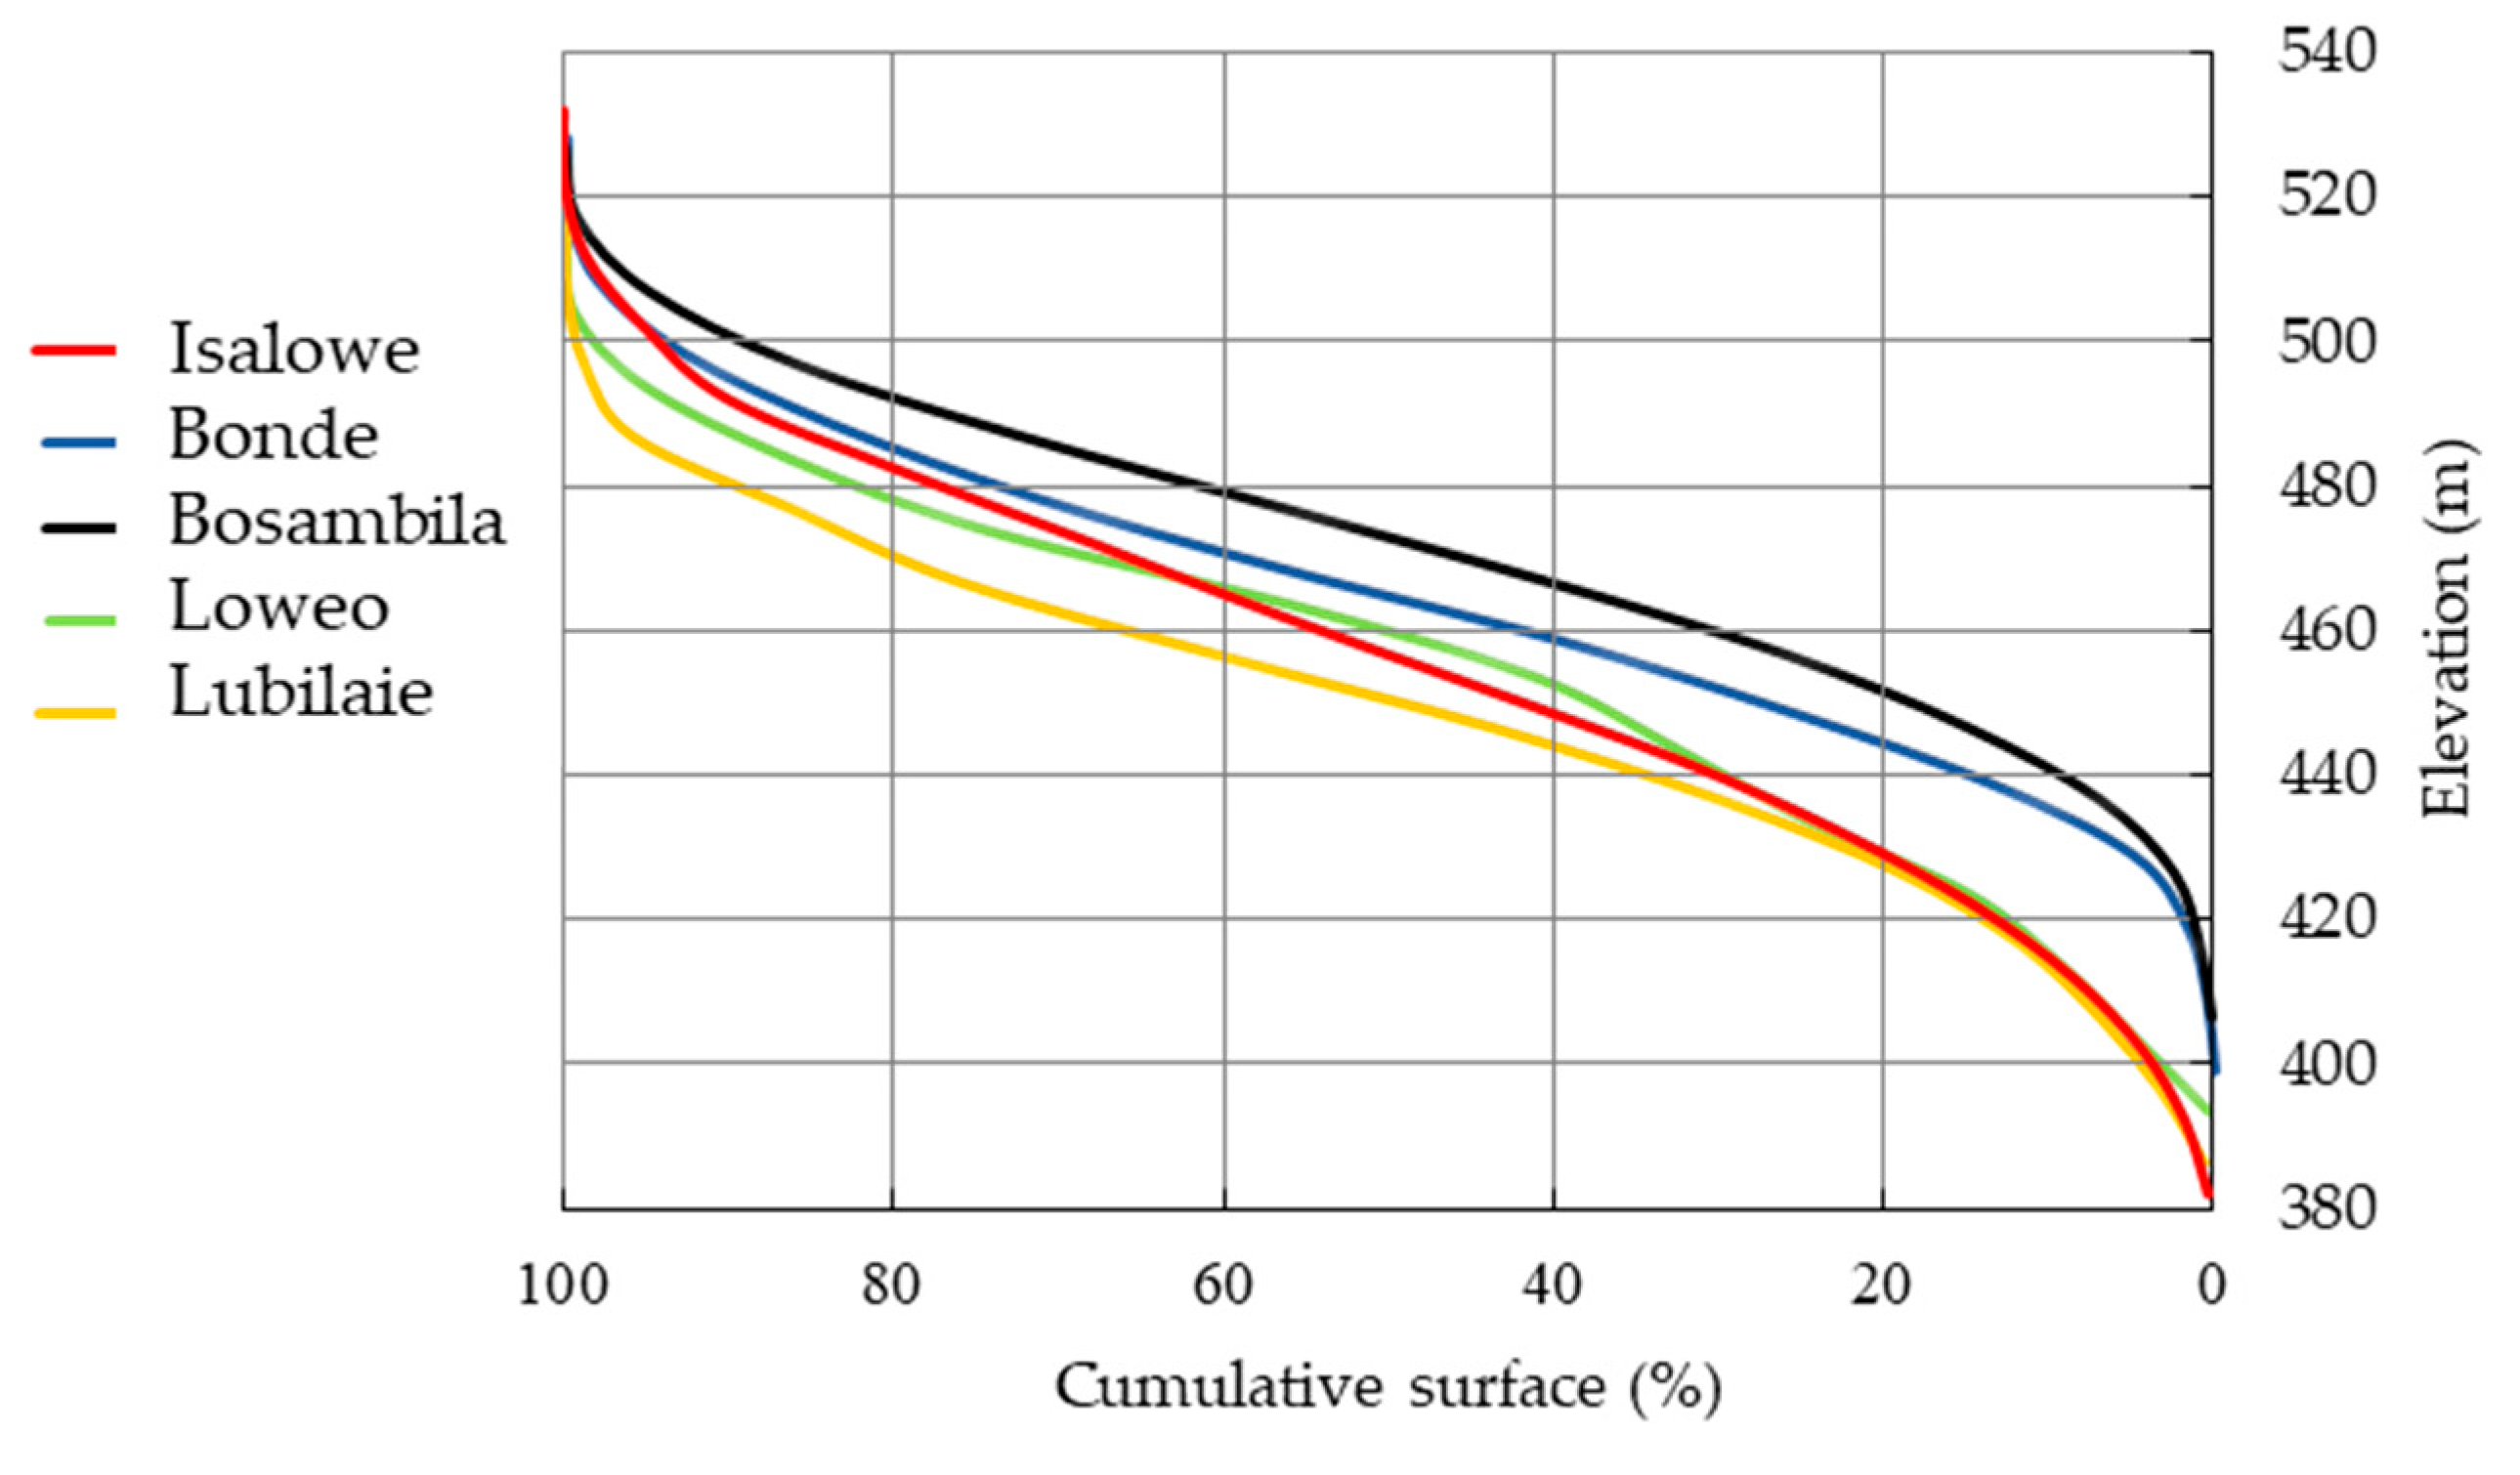
3.1.1. Morphometric Characteristics

The drainage density for all the watersheds varies between 0.5 and 0.6 km/m2, with a Gravellius compacity index (KG) value ranging from 1.8 to 2.5 (see Table 2), conferring an elongated shape for most of these watersheds. Only the Isalowe watershed tends toward a circular shape, with a KG value of 1.8. The watershed mean slope varies between 7.3–9.2% (Table 2), with lowest and highest values at Loweo and Isalowe watersheds, respectively.
All five watersheds are geomorphologically mature as is shown by the general aspect of the hypsometric curves (Figure 2)—i.e., with soft plains around their main stream channels, where the variations in altitude are small despite their large surface area. This could also indicate that at basin scale, the erodibility is negligible. However, the Lusambila and Bonde watersheds are steeper than those of Isalowe, Loweo and Lubilaie. They are less mature, and therefore have a higher probability of erosion and impact on river water quality compared to others (Figure 2).

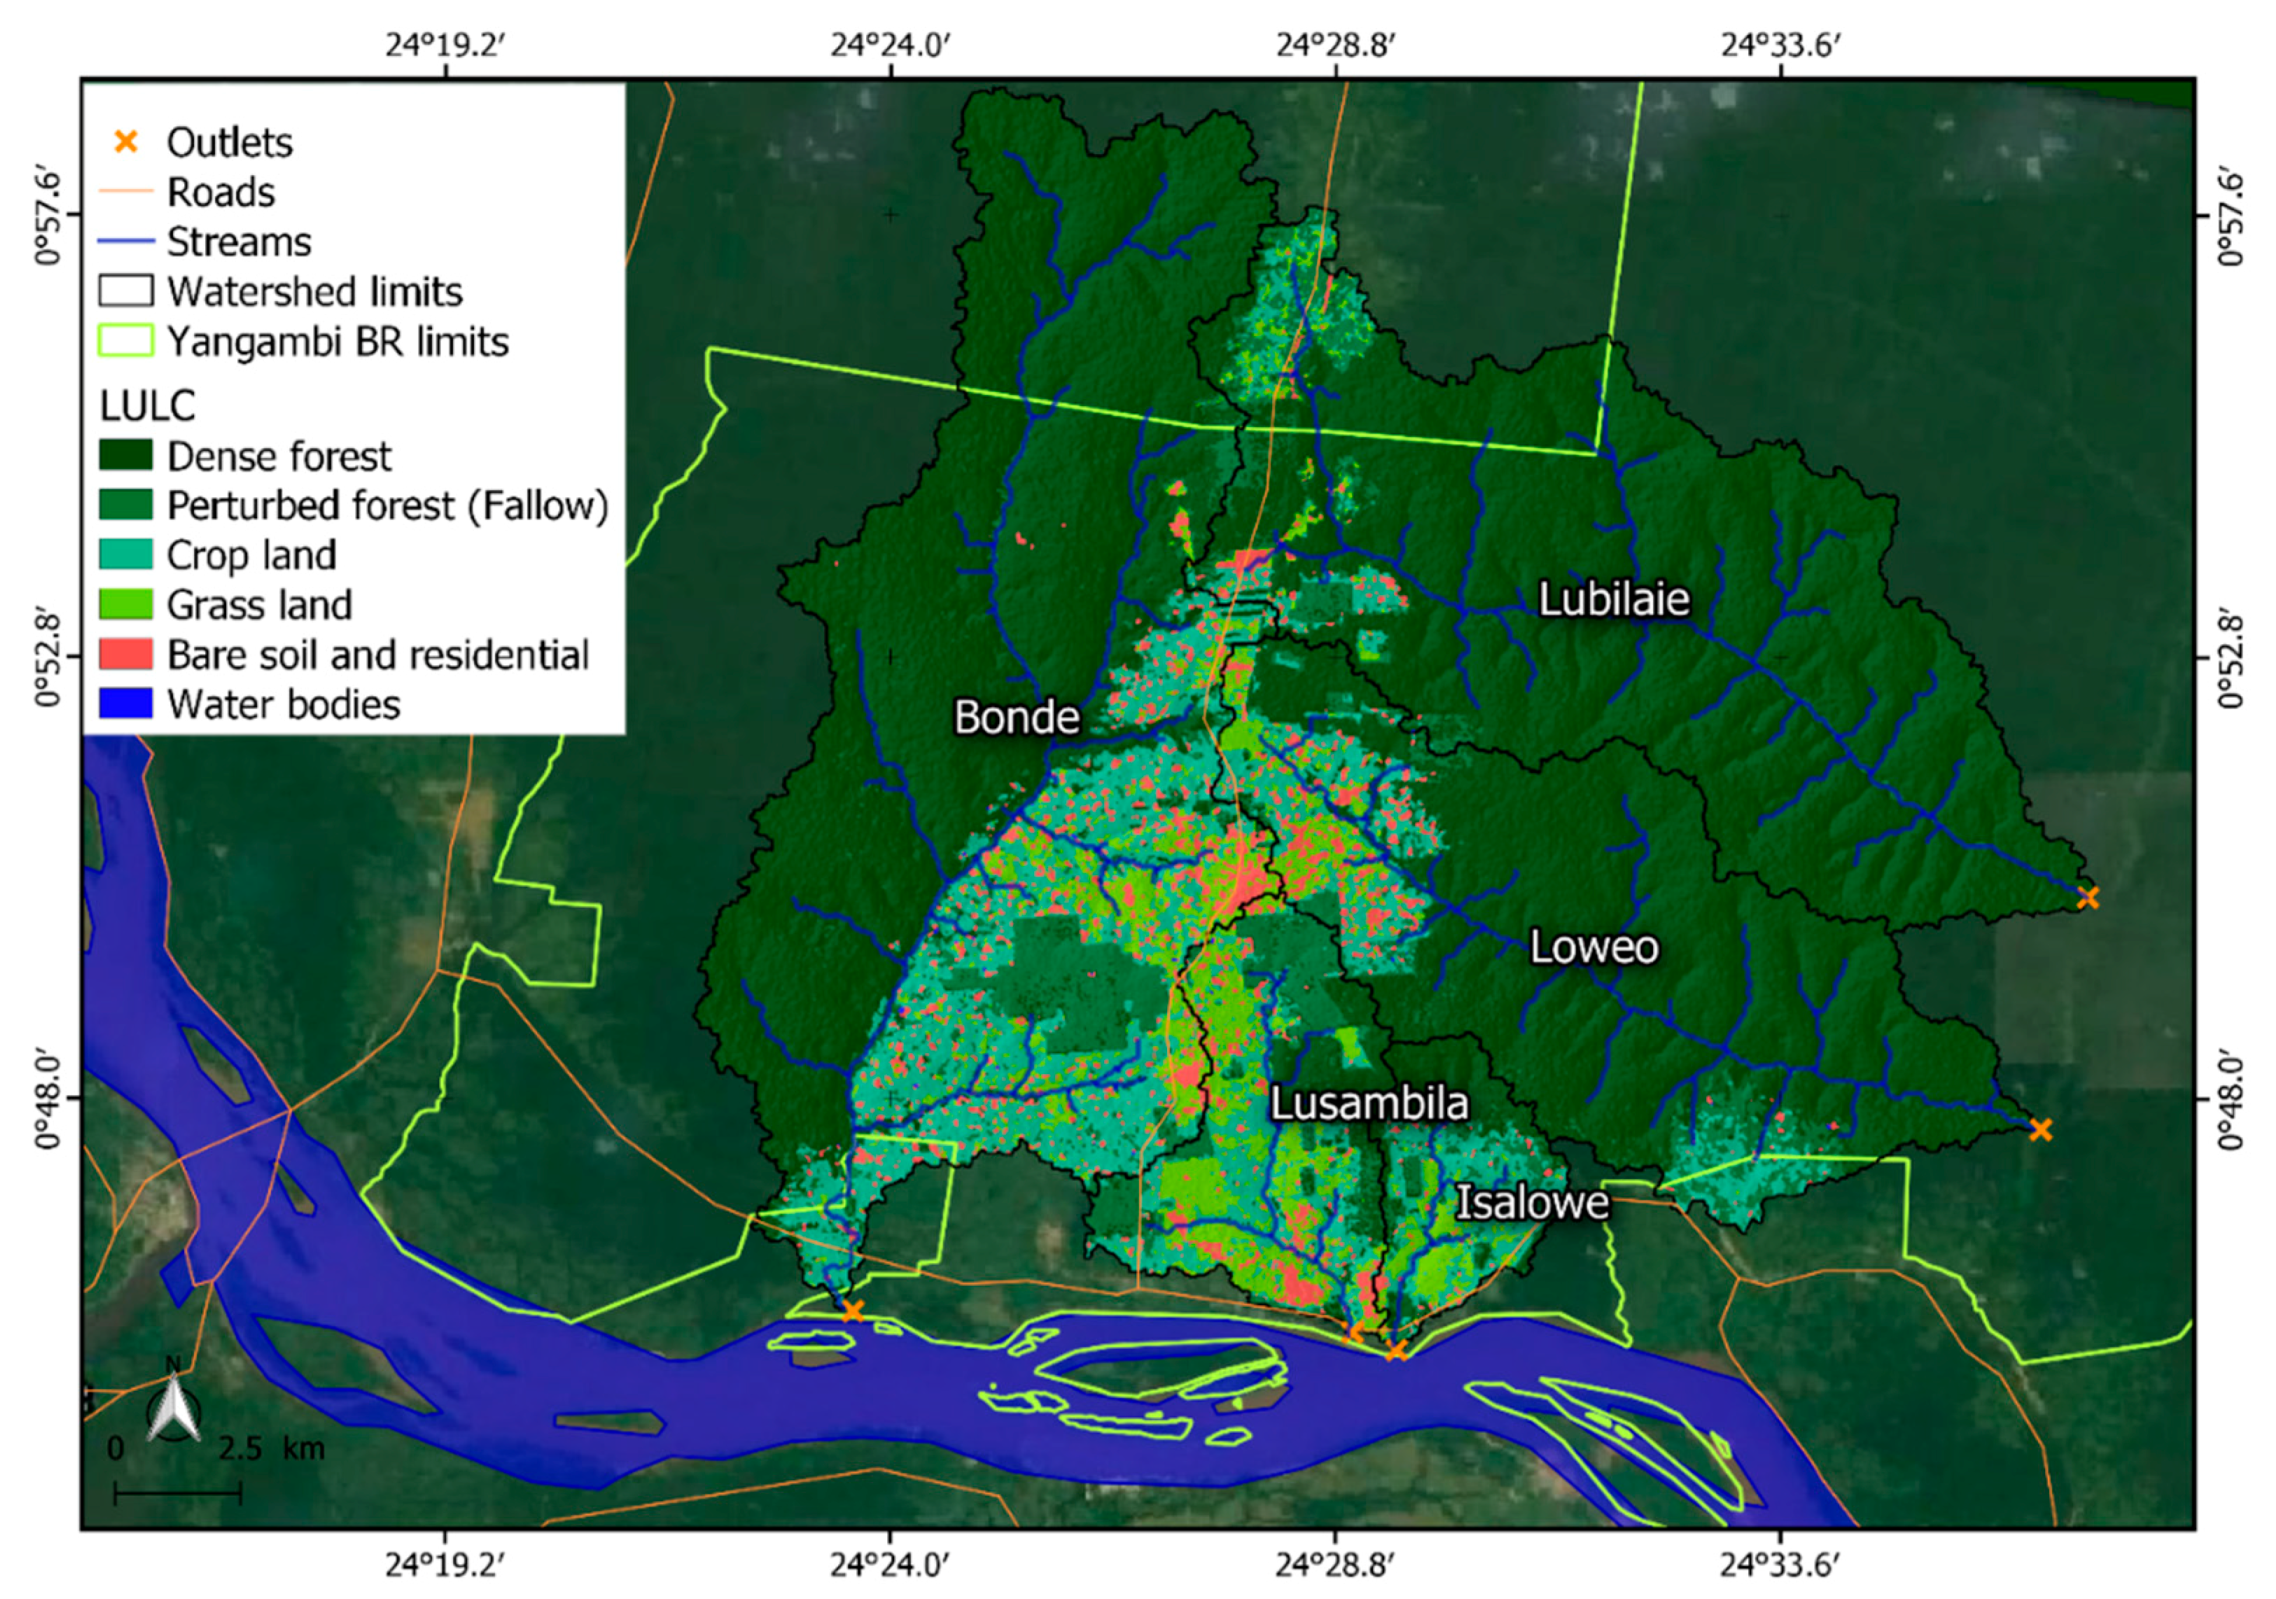
3.1.2. LULC Patterns Related to Anthropization in the Different Watersheds in Yangambi

The classification of the Sentinel 2B satellite image into different LULC types identified five main thematic classes in the five watersheds selected for this study (Figure 3). DF was the dominant thematic class for all the watersheds, while BSR represented the smallest proportion. Lusambila and Lubilaie had the largest and smallest proportion of BSR areas, respectively (Figure 3).

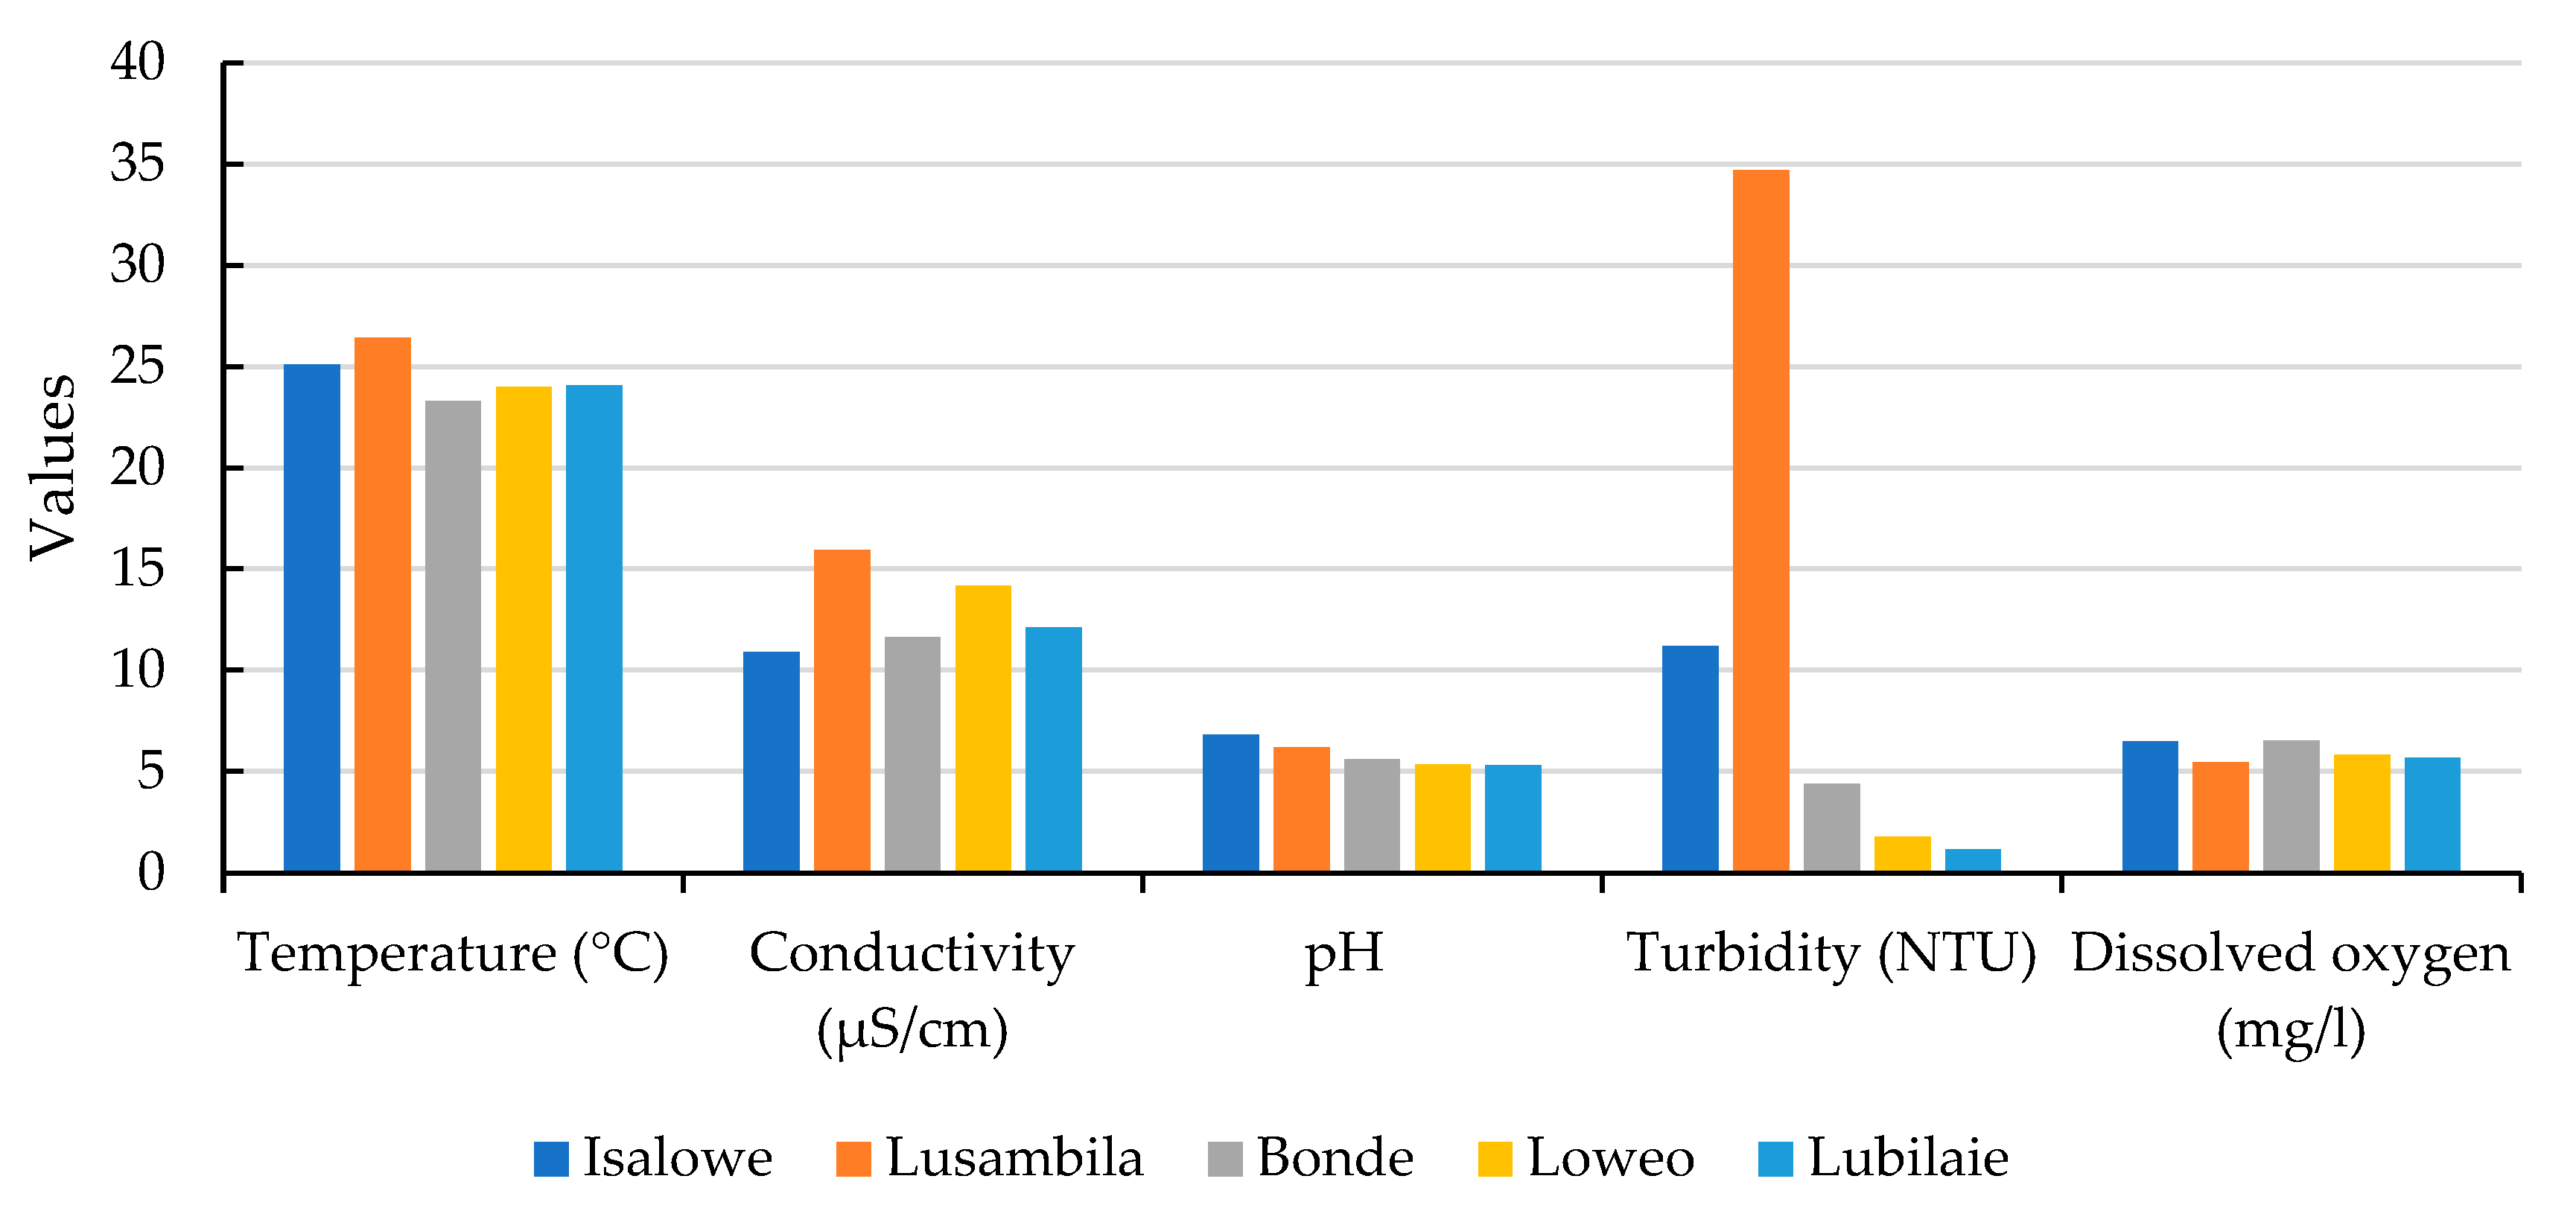
3.2. Water Quality in Yangambi for the Main Domestic Water Supplies in the Different Watersheds

Most of the analyzed physical and chemical parameters of water from springs, rivers and cisterns in Yangambi meet WHO standards for drinking water. The exceptions are the acidic pH and turbidity values in surface water and unimproved water sampled from all the watersheds (Table 3). More acidic pH and small turbidity values were found in the Lubilaie and Loweo, which are the most dominated by DF cover. This could be explained by two factors; first, humic acid is released from the forest and drained to the rivers and vadose zones (discharging into the springs) through runoff; second, hypodermic water flux from the forested areas dominate in most of these watersheds. There were significant differences in pH for different water supplies throughout the study area (Table 4). Temperature and conductivity show significant differences (for all water points considered together) across the five watersheds (p-value < 0.05) (Table 4). At the spring level, there were no significant differences for any of the parameters in the different watersheds. However, rivers showed significant differences in conductivity and turbidity (Table 4). Values that did not meet WHO standards for drinking water for turbidity were found in Lusambila and Isalowe (Table 3), which are watersheds with a smaller proportion of DF (Figure 4).

3.3. Relationship between the Physicochemical Quality of Stream Water Based on Indices of Landscape Configuration and Composition in Watersheds

The linearity analysis showed no significant linear relationships between the different water physicochemical parameters, except for turbidity and temperature, which showed a strong positive correlation (r = 92%). However, there were positive, nonsignificant relationships between almost all the variables of physicochemical water parameters. The exceptions were for temperature and dissolved oxygen, and also for conductivity and pH, where the linearity correlation was negative (Table 5).
The linear correlation test results between the different landscape indices (configuration and composition) and the different river water quality parameters revealed a significant correlation (p-value < 0.05), especially for turbidity, pH and temperature. However, almost all landscape indices were not significantly dependent (p-value > 0.05) on conductivity and dissolved oxygen, except for MPA_PF and MPA_CL, respectively. Only turbidity was negatively correlated with the proportion of DF and MPA of perturbed forests (Table 6.).
The best SLR model, which explained the effect of each landscape parameter on different water physicochemical parameters, is that of pH as a function of ED-DF. Using this model, ED-DF explained up to 97% of the observed variability in pH (AIC, Akaike information criterion = −3.2; p-value > 0.05) (Table 7).

3.4. Analysis of Domestic Water Resources Vulnerability to Climate Change

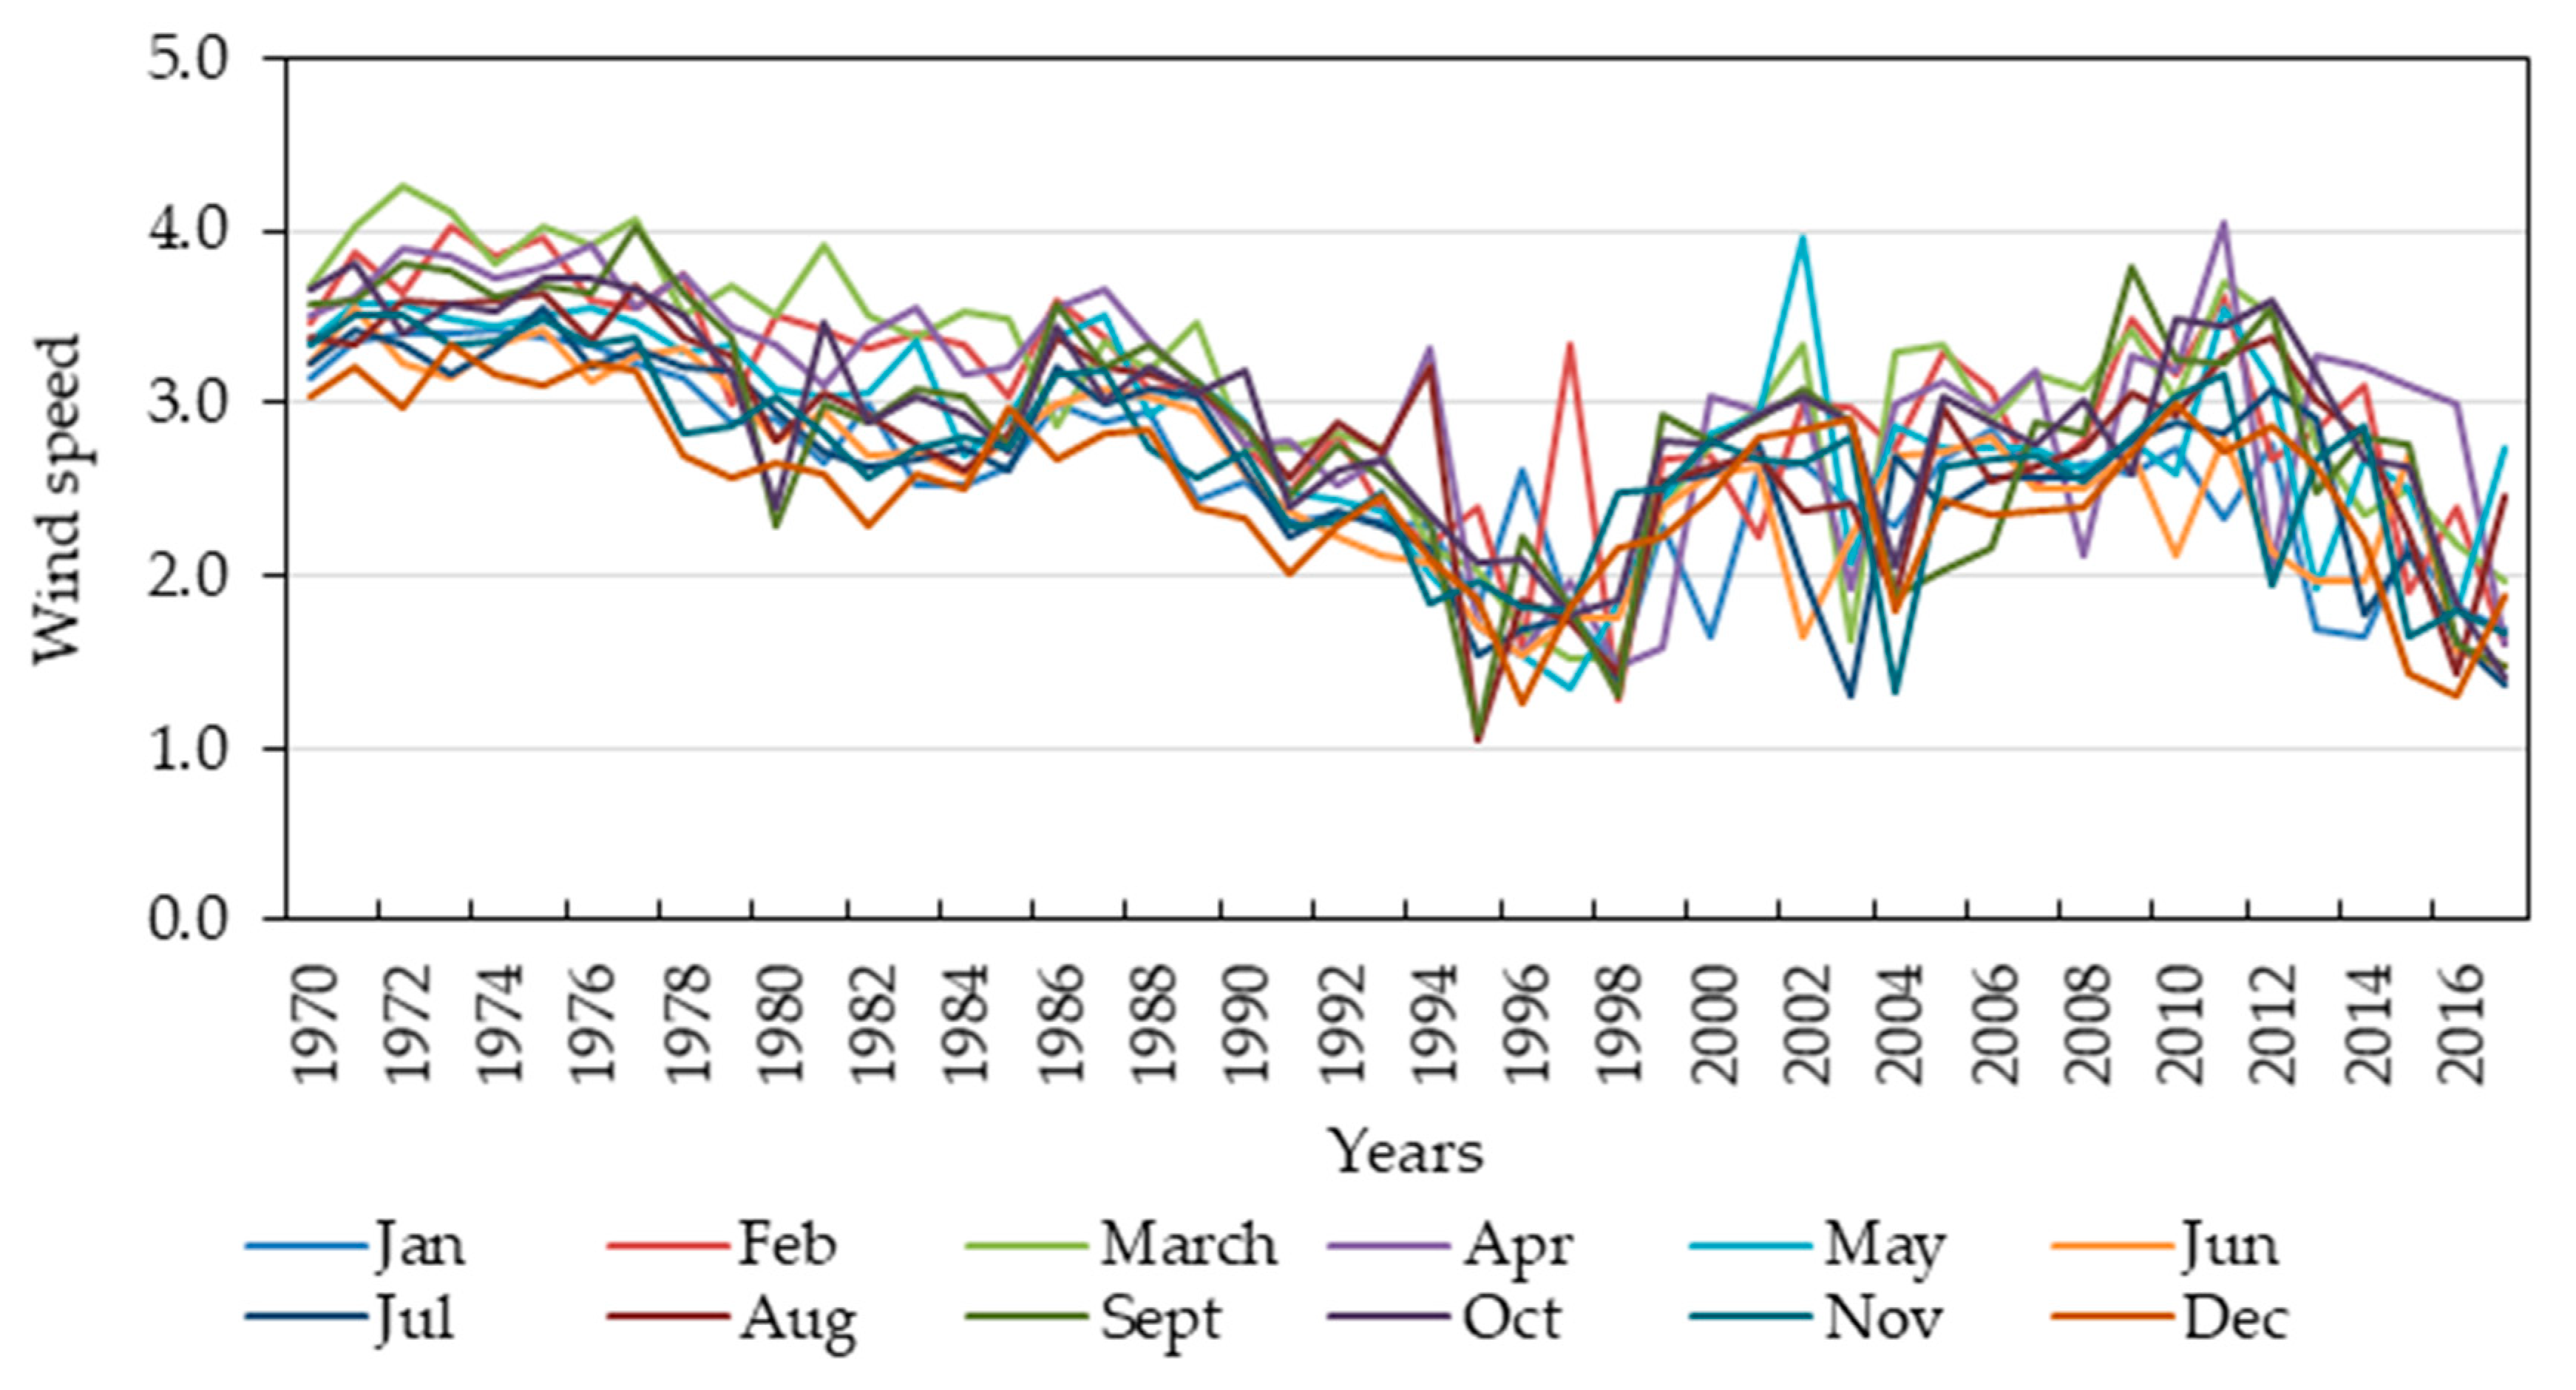
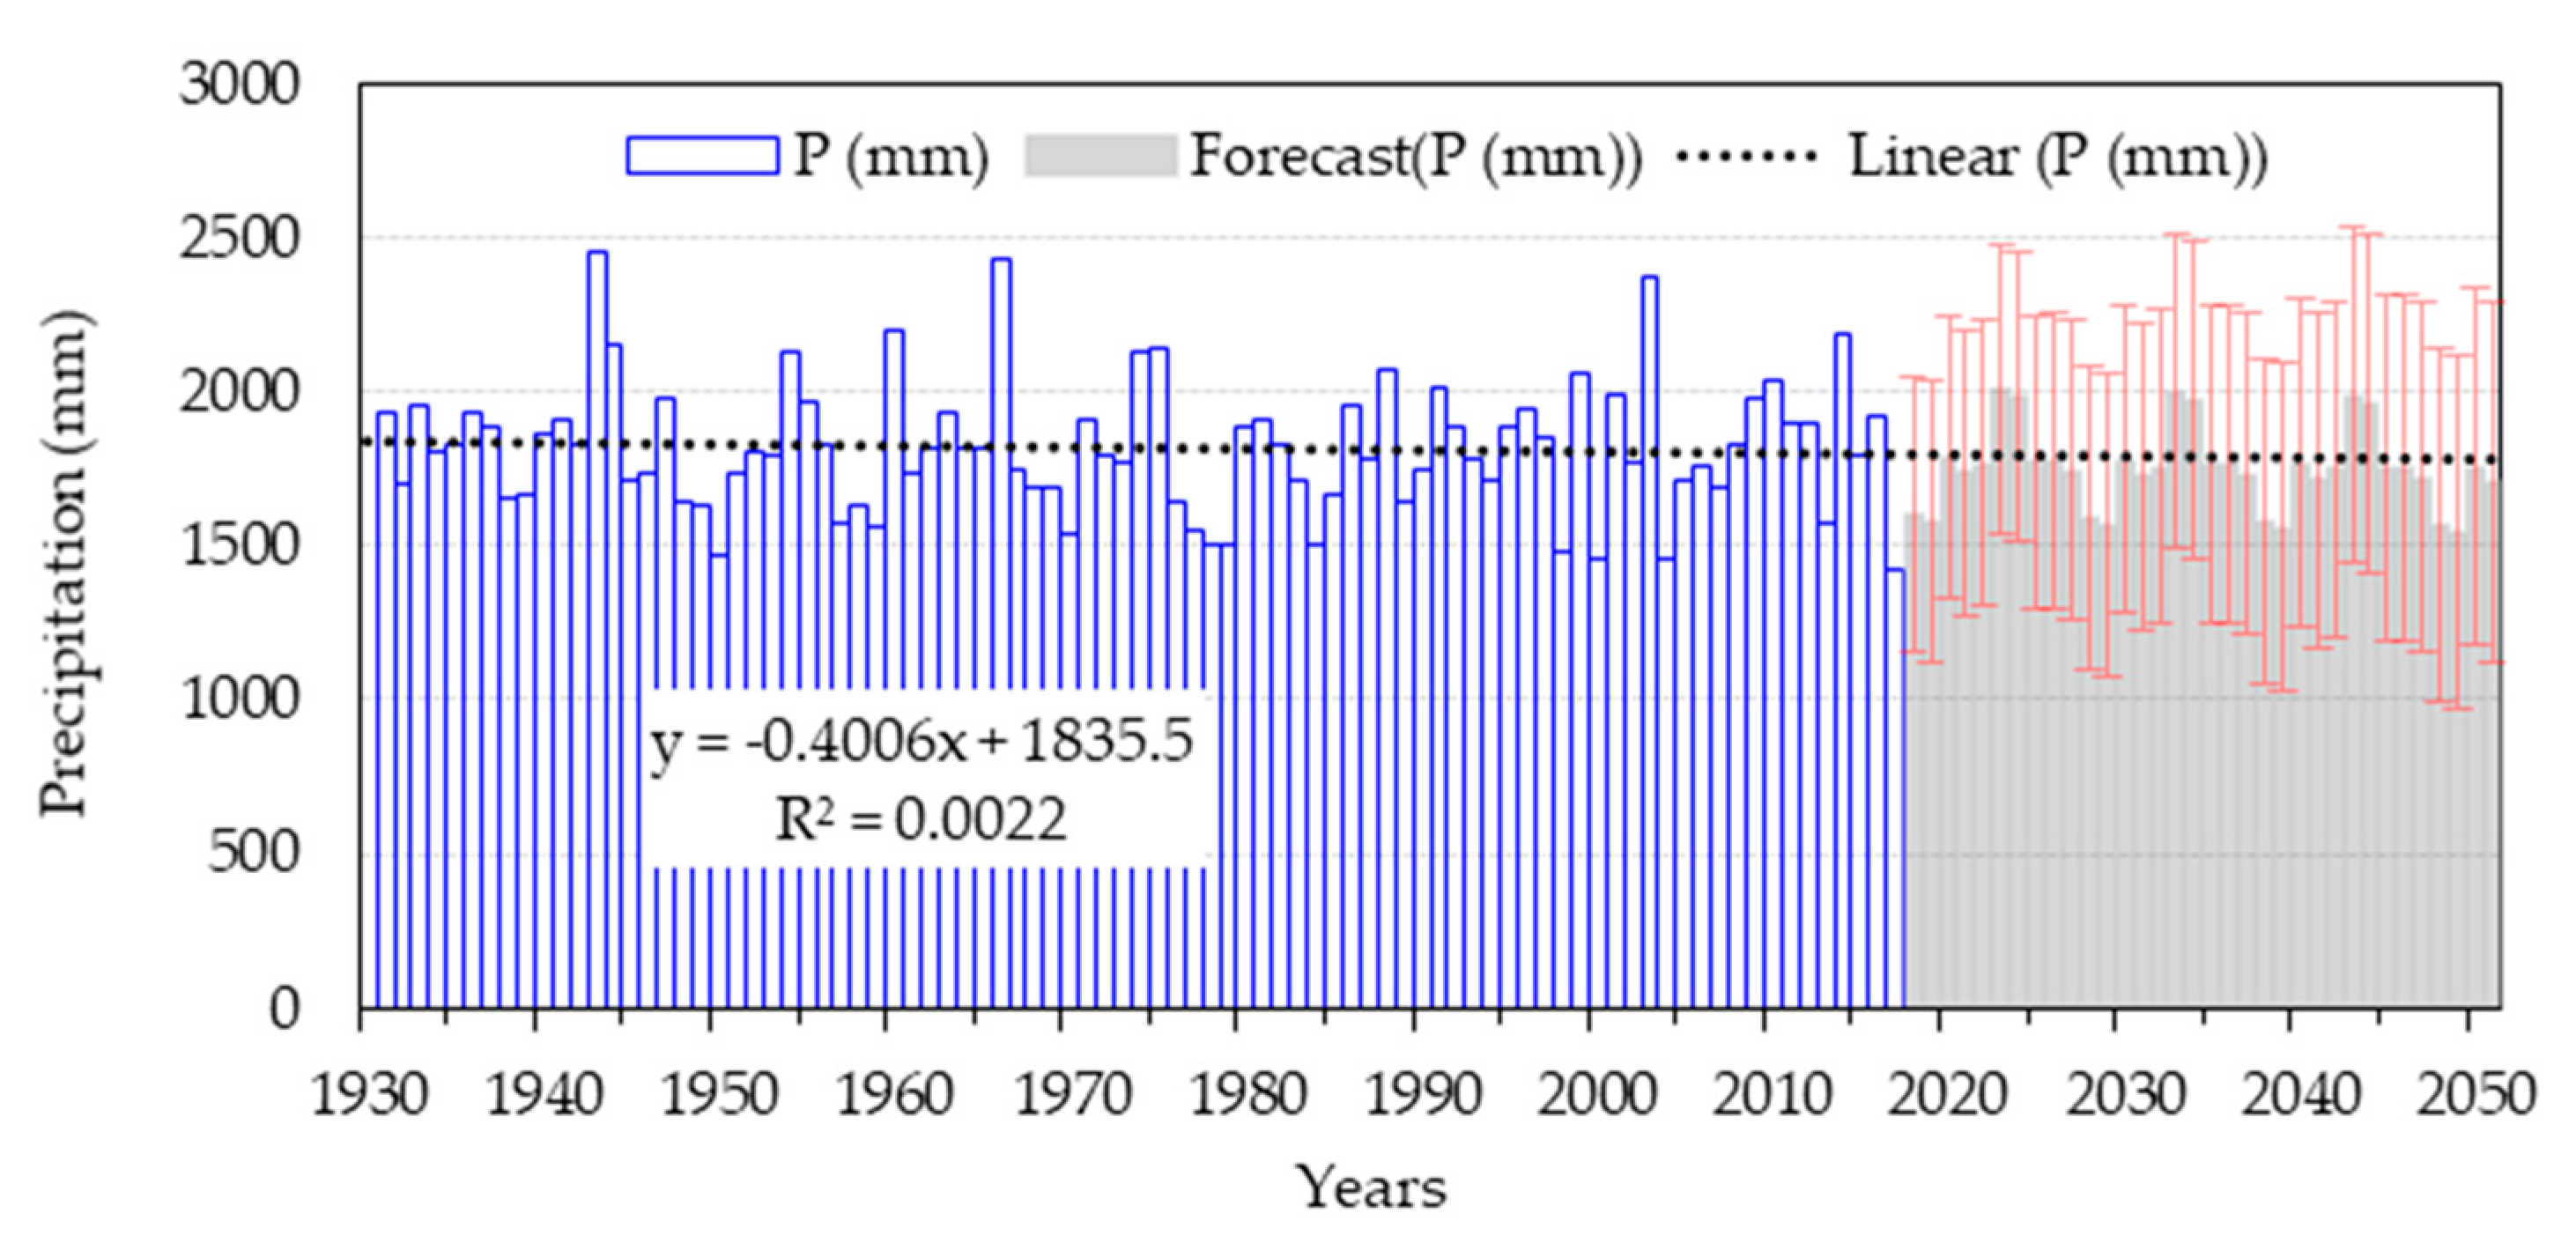
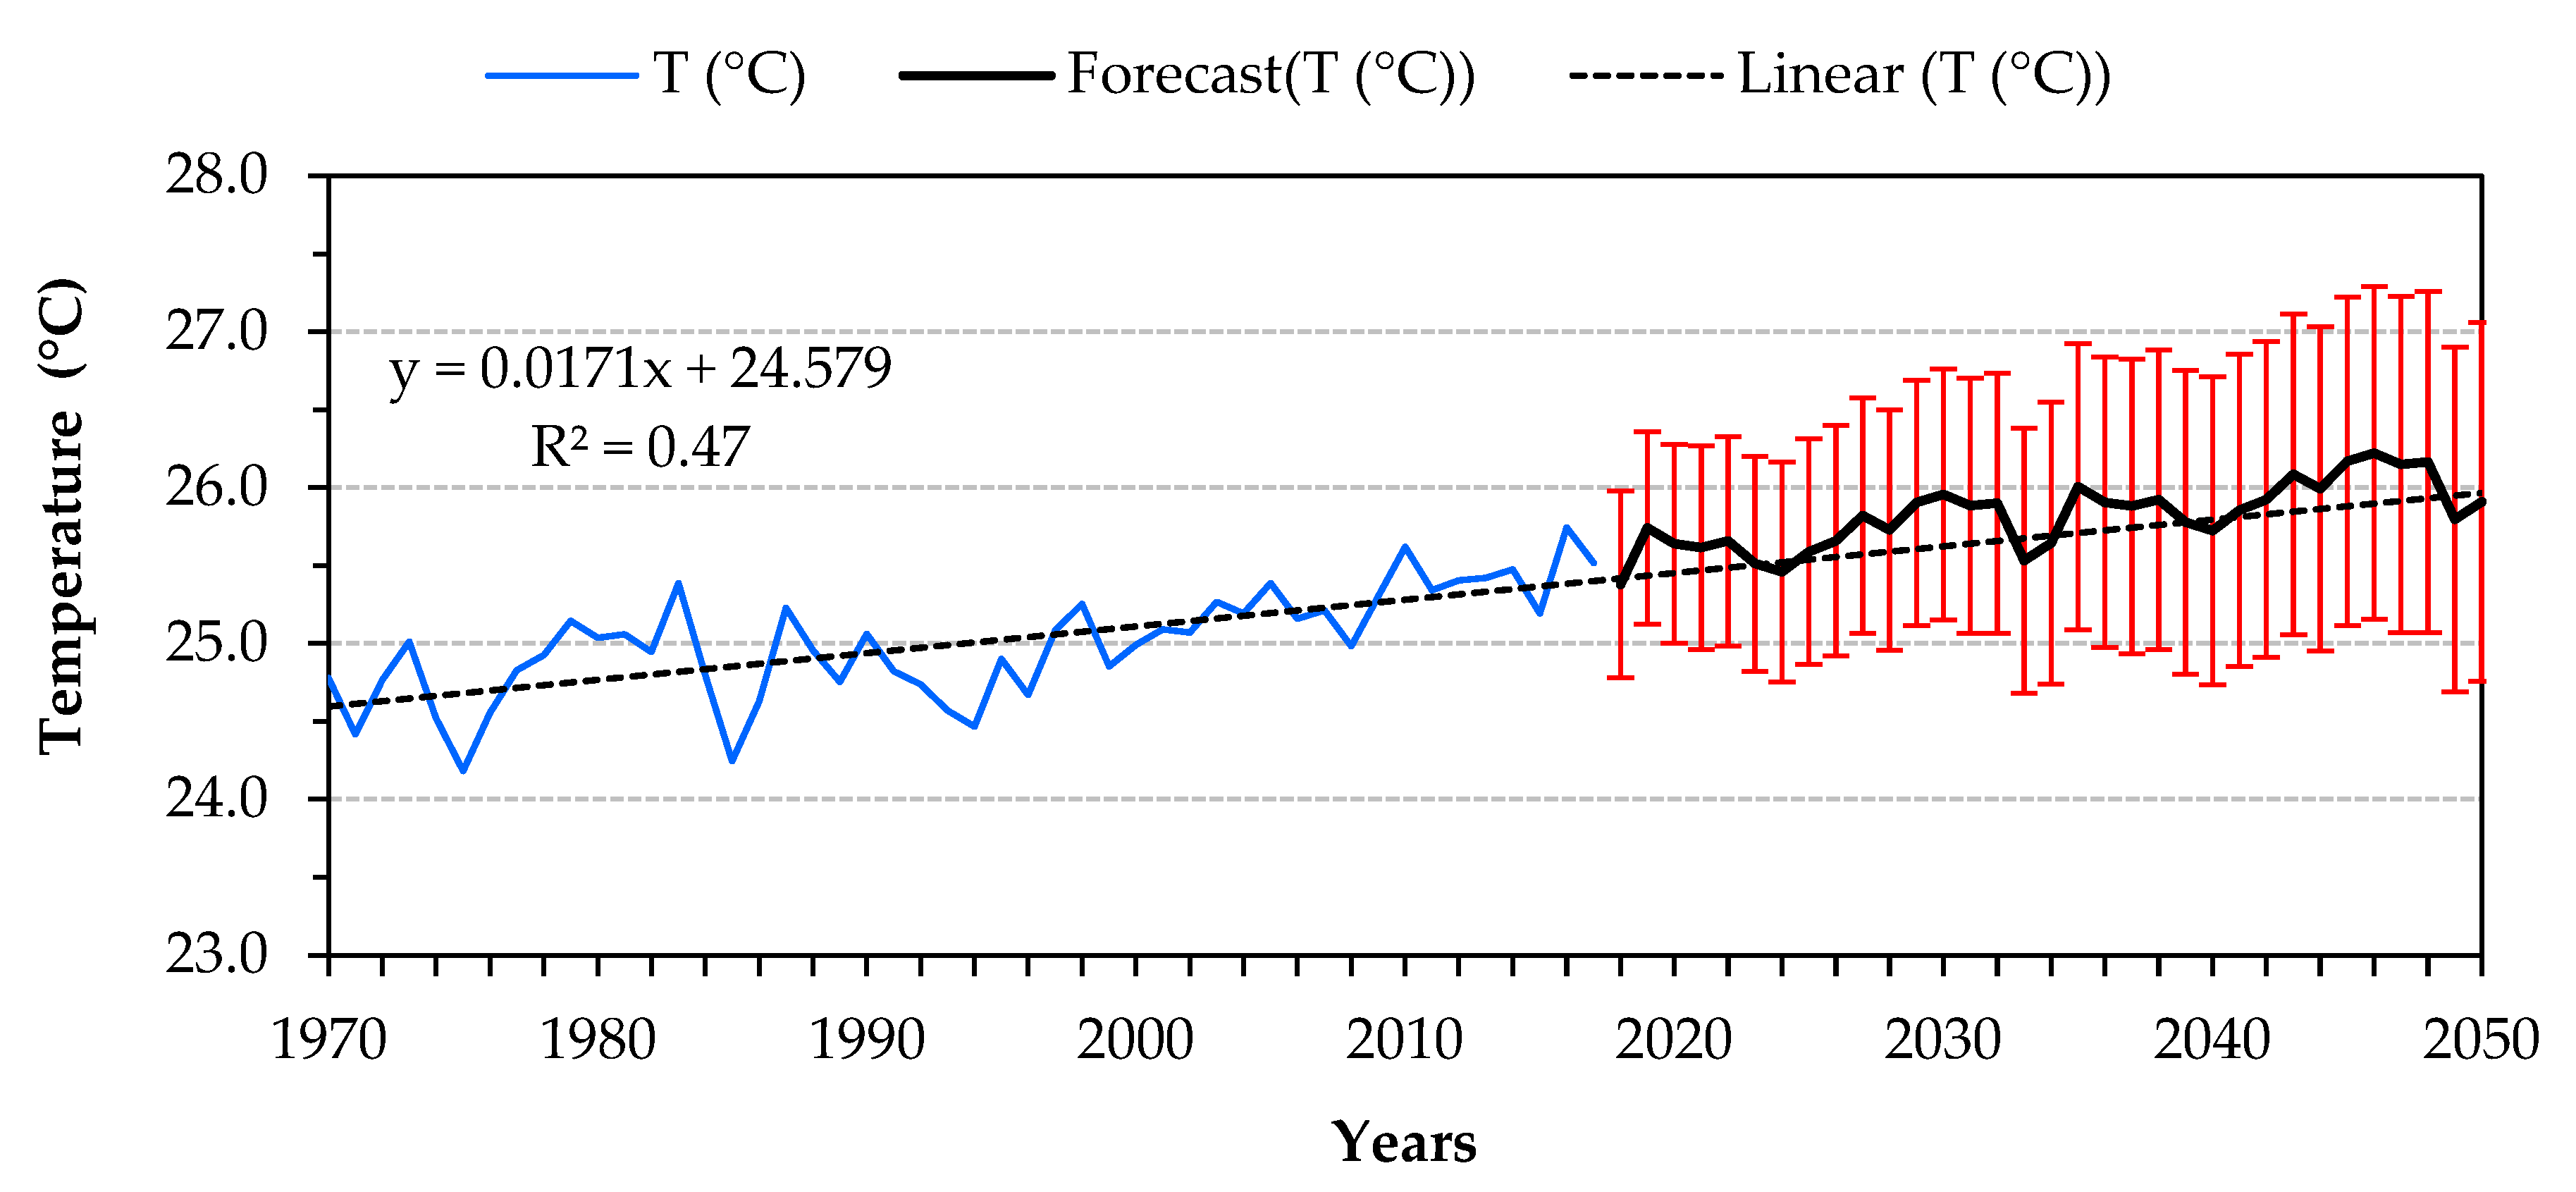
3.4.1. Analysis of the Yangambi Weather Station Climatic Parameters

In the Yangambi’s watersheds, annual average rainfall decreased by 11 mm between 1931 and 2017 (Figure 5). Annual average temperatures also increased between 1970 and 2017 by 0.8 °C. The average annual temperature was 24.5 °C before 2001, and rose to 27.3 °C after 2001 (Figure 6). There is also a strong interannual variability in wind speed, with a decreasing trend between 1970–1994 and 2006–2016 (Figure 7).
A simple forecast of precipitation and temperature for 30 years in the future (2050) was performed using the available data (Figure 5 and Figure 6). The results are statistically acceptable with a symmetric mean absolute percentage errors (SMAPE) of 0.13 and 0.01 for precipitation and temperature, respectively. The predictions for the year 2050 showed a decrease in precipitation of 3% and 2% as compared to the mean precipitation of the periods 1931–2017 and 1970–2017, respectively. As for the temperature, an increase of 4% Celsius degrees is predicted for the year 2050, as compared to the initial mean temperature of 25.0 °C for the period 1970–2017. These values seem minimal as numbers, but their influence on the hydrology, water resource availability and supply within the Yangambi watershed may be huge.

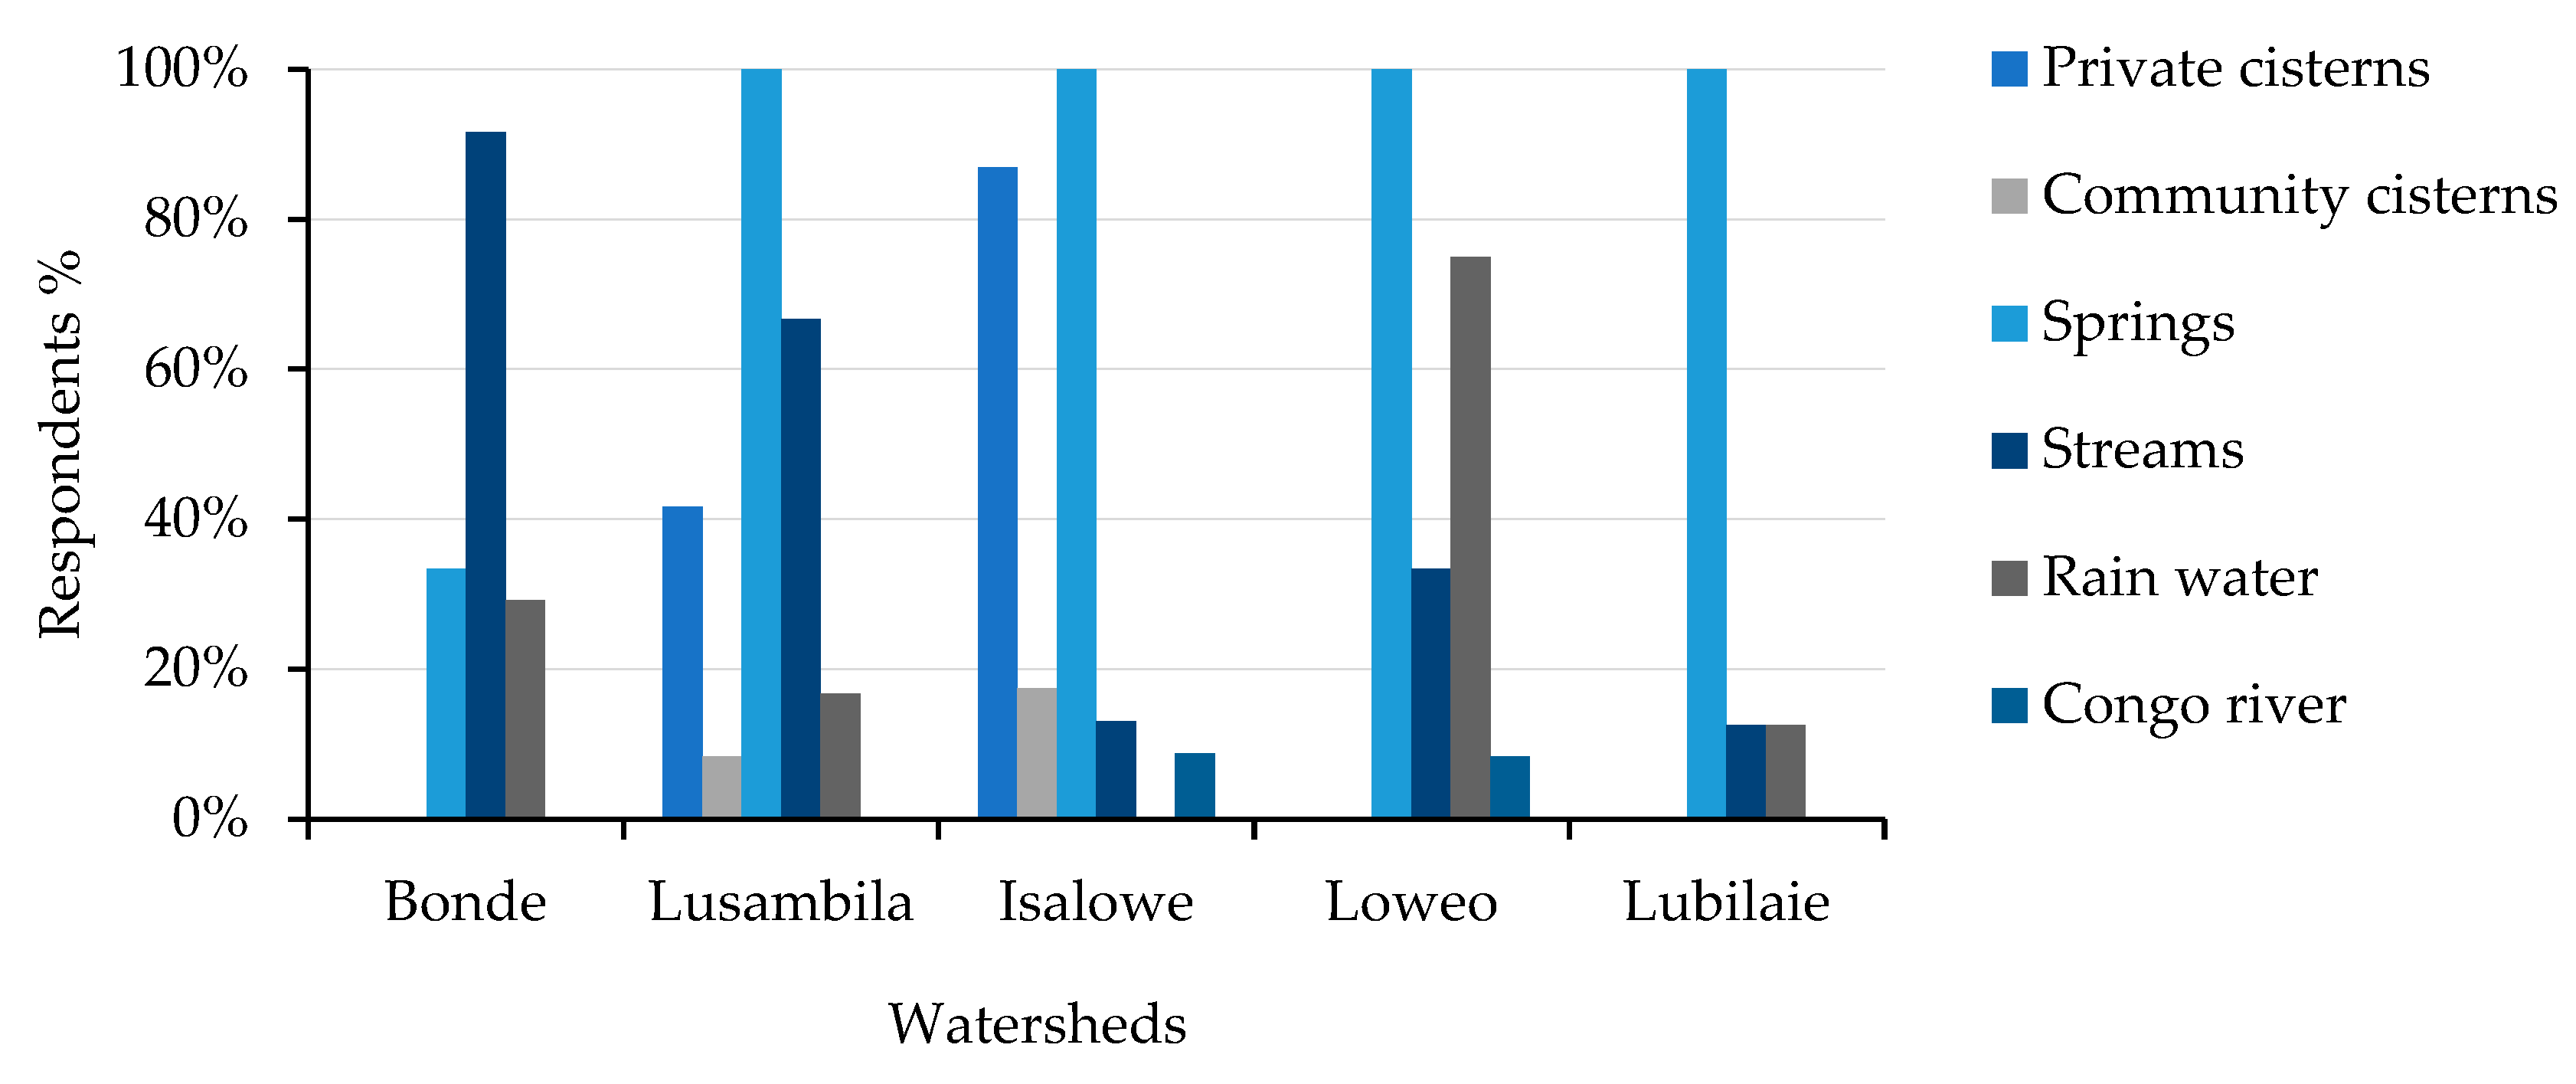
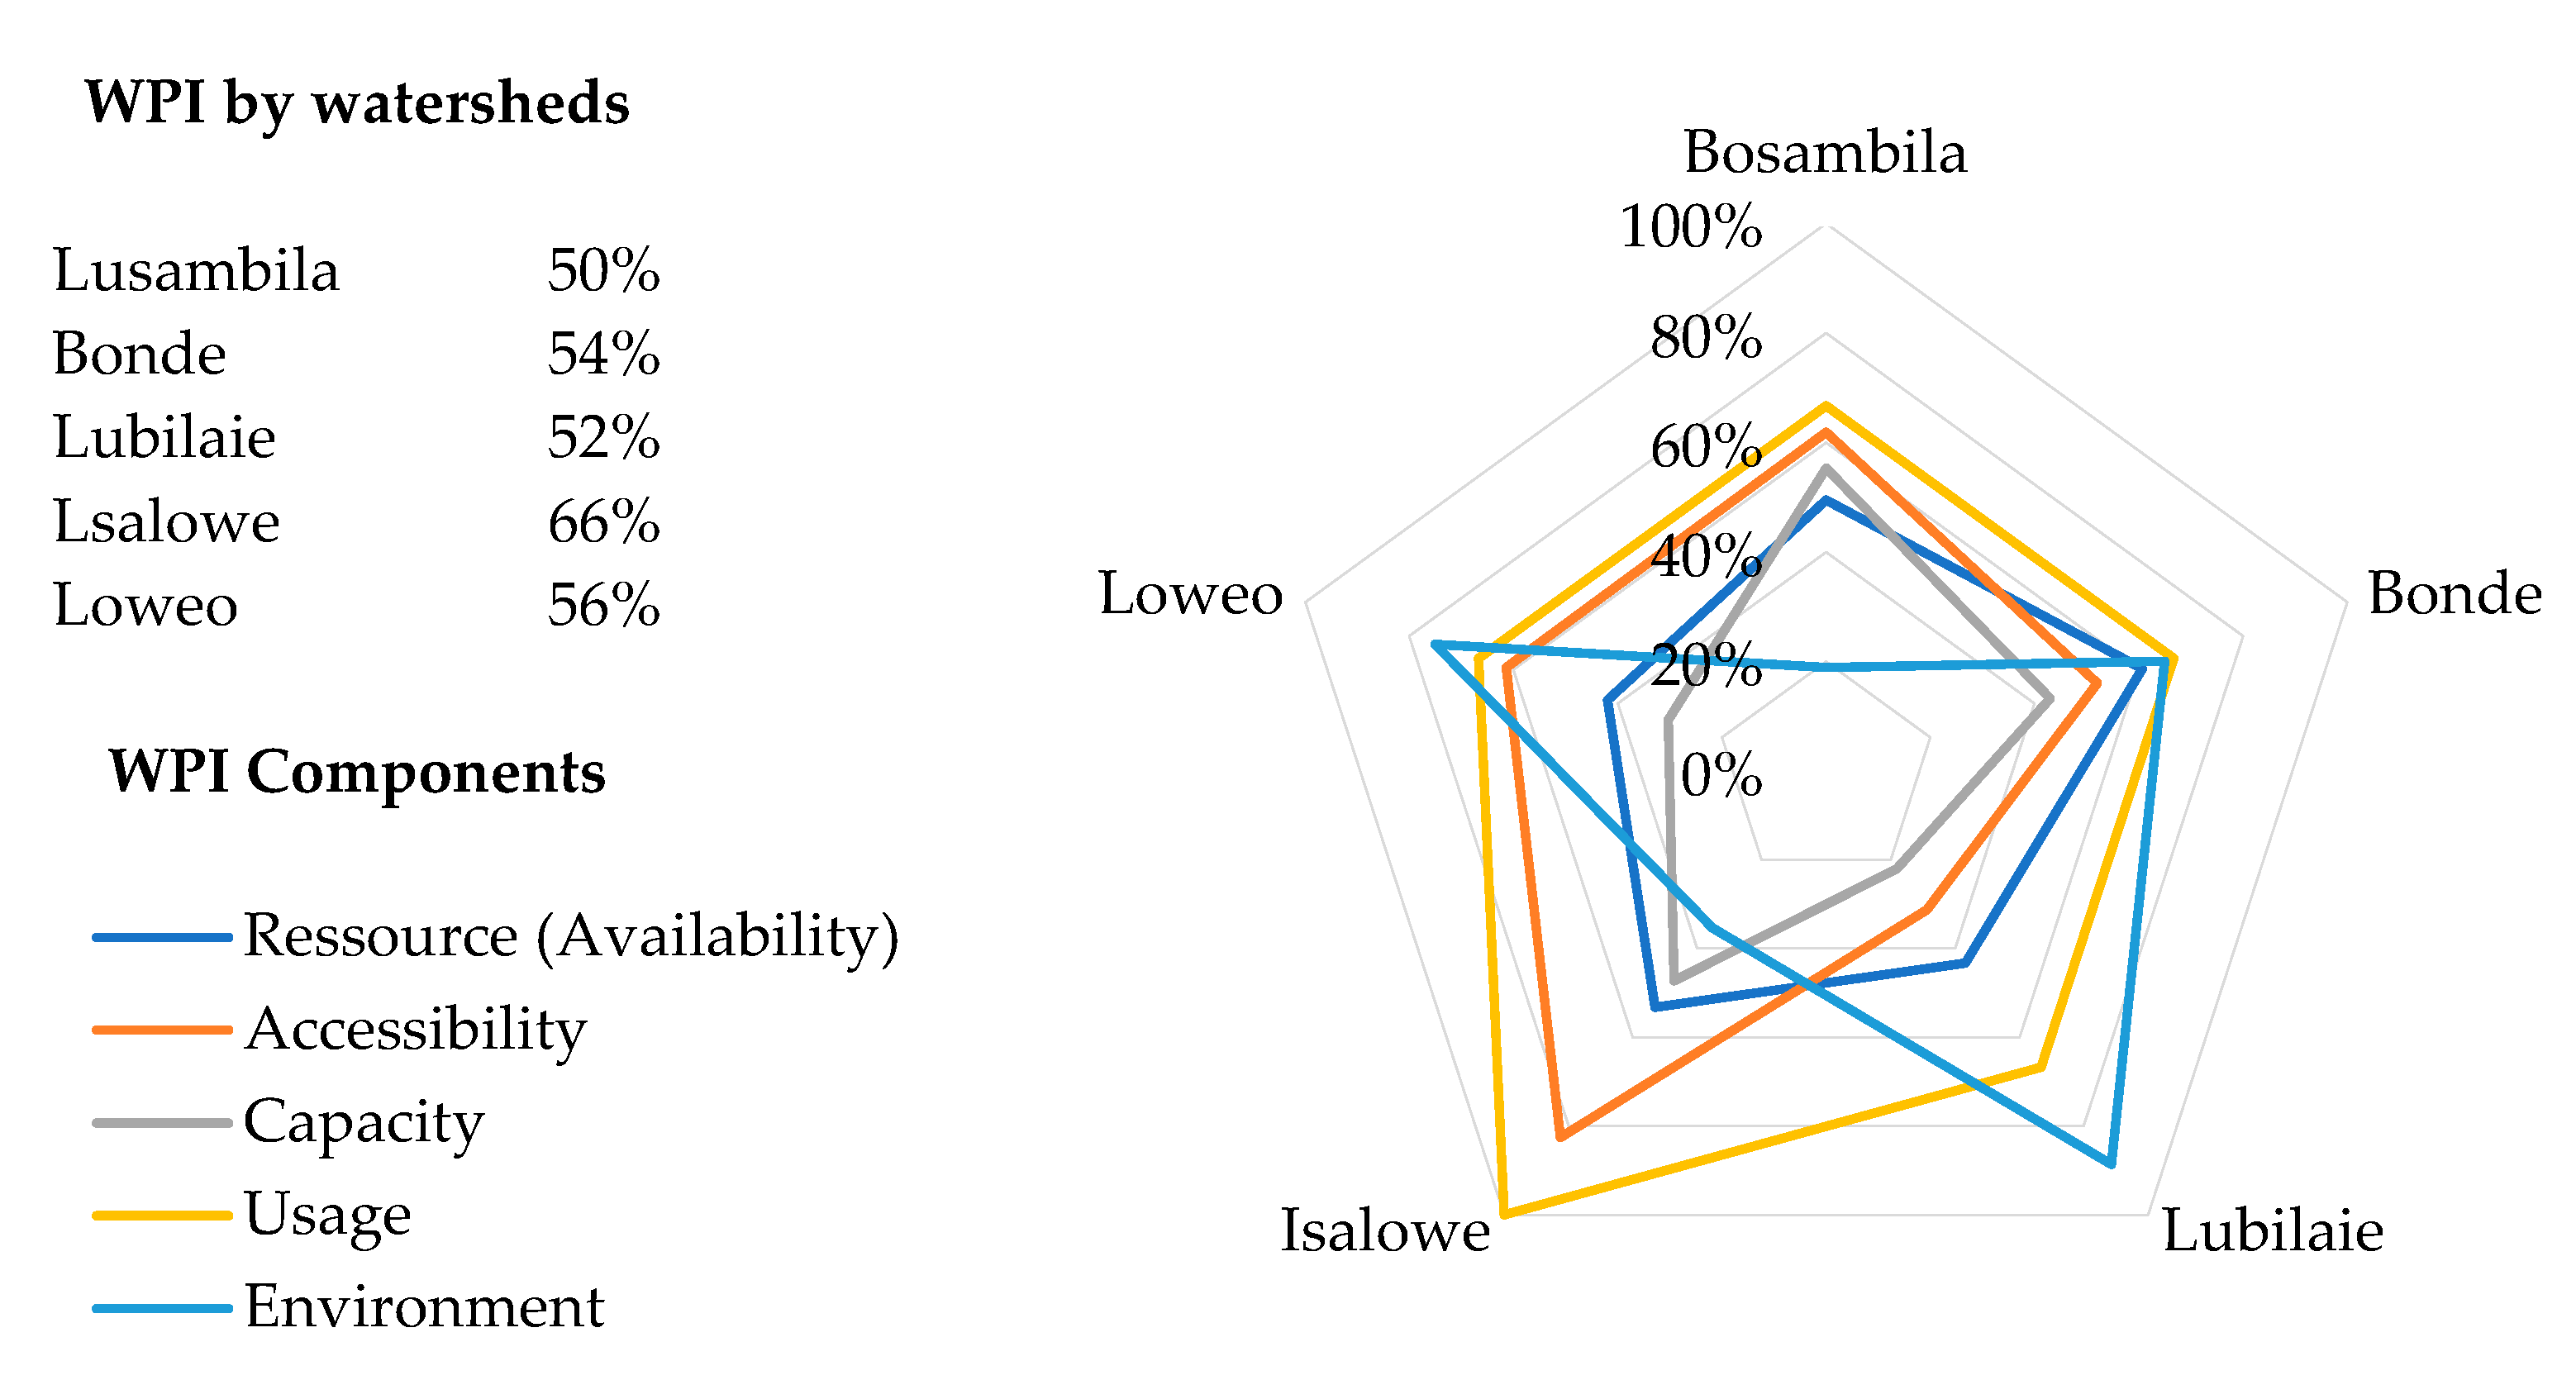
3.4.2. Availability, Accessibility, Use and Management Capacity of Water Resources in Yangambi

Yangambi water supply points are located mainly around the urban–rural areas and villages. Nevertheless, several springs are located inside the forest, far from the residential areas. They were not considered in this study, as the Yangambi population barely uses them for water supply. There are only three wells, dug by the NRHS in Bangala, Likango and Ekutsu, but they are not operational. Cisterns are present exclusively in Isalowe, Lusambila and Lumumba (Isalowe, Lusambila and Loweo watersheds). These cisterns and wells are less than 1 km from settlements (Figure 8).
The survey results showed that the population of Yangambi in the different watersheds gets water for domestic use from: (i) springs, (ii) rivers, and (iii) community or private cisterns. Almost all respondents in the different watersheds reported using spring water, while only respondents in Isalowe and Lusambila used cisterns as springs. Water from the Congo River was rarely used (Figure 9).
In the different watersheds under study, on average, more than half of respondents said they lived at least 1000 m (1 km) from springs. In Lubilaie, only 25% said they lived more than 1 km from springs. In terms of distance from rivers, 63% of respondents in Lusambila said they lived more than 1 km from rivers used as water supplies. In Bonde and Lubilaie, respectively, more than 84% and 100% of respondents said they lived less than 1 km from the rivers (Table 8). The average distance between households and water cisterns was less than 5 m (personal observation from the field).
The daily water consumption per person in all the watersheds studied was more than 20 liters (L) per person. The highest water consumption per person was in Isalowe (49 L per person per day) and the lowest (29 L per person per day) in Lubilaie (Table 8).
Water is mainly used for domestic purposes in Yangambi, mostly for (i) toilets, (ii) bathing, (iii) dishwashing, (iv) laundry, (v) cooking and (vi) drinking. Water from streams, cisterns and rainfall is used less for drinking and cooking, and more for toilets, bathing, dishwashing and laundry. On the other hand, water from springs and streams is used for everything, with a preference for spring water for drinking. In some settlements and villages at larger distances from springs, such as Obiloto and Yanguma (in the Bonde watershed), people sometimes use water from rivers or rainwater for drinking. Most households do not pretreat their water before using it for domestic purposes. Only a few households, especially in Isalowe and Lusambila, use clean cloths as filters, or purifying products such as chlorine, or boil drinking water before its use (Table 9).
In the different settlements and villages, most people are poor and live in mud houses. In Isalowe and Lusambila, many houses are built with hard brick and have metal roofs. In Lubilaie, Loweo and Bonde, on the other hand, mud houses predominate (Table 9). Some shelters have mud walls with roofs mostly made from flowering plants (of the Marantaceae family) or leaves of oil palm trees.
The percentage of illiterate household heads was moderately low in all the watersheds, where the education level is, on average, limited to secondary school. The exceptions were in Loweo (where most household heads did not go beyond primary school), and in Lusambila and Isalowe (where several household heads attained university educations) (Table 9). Additionally, most respondents said they had never received any training related to water. A few respondents in Isalowe, Lusambila and Loweo said they had attended some form of water-related training in the past. The survey results showed there were no organizations (governmental or non-governmental) actively involved in water management in Yangambi city, nor were there any well-known water point management committees during the study period.
The five watersheds have a Water Poverty Index (WPI) score varying between 50% and 66% (Figure 10). The Isalowe and Lusambila watersheds have the highest scores in terms of water use and accessibility. The surveys revealed that water resource management capacity in Yangambi is generally low. The exception is the Isalowe watershed, which exceeds the 50% score (Figure 10).

4. Discussion

4.1. LULC Dynamics in the Yangambi Watersheds

Most of the five watersheds have DF as the highest proportion of LULC. The proportions of DF are much lower in the Isalowe and Lusambila watersheds, where they have a significant proportion of BSR, compared to Lobilo and Loweo watersheds. Analysis of the linear correlation between different landscape parameters in the five watersheds in Yangambi showed a negative relationship between the proportion of DF and most of the landscape parameters related to bare soil and residential, CL and GL. This means that as the PD of CL, ED of bare soil and residential and MPA of GL increase, the proportion of DF patches tends to decrease in the watersheds. The CL, BSR, GL and PF landscape parameters also change positively with those showing an increase in forest landscape fragmentation (ED and PD), but also a decrease in its proportion in Yangambi.
Brandt and colleagues confirmed these relationships in 2016 [25]. They showed that the phenomenon of anthropization in the Congo Basin forests was generally accompanied by a conversion of the forest into other types of LULC. This is because the Congo Basin population depends mainly on slash-and-burn agriculture for subsistence. Hence, areas colonized by people are often characterized by intensive clearing for agriculture purposes [15]. These cropping areas then evolve either into fallow or other types of LULC dominated by herbaceous species, especially grasses (when the regeneration capacity of forest species is severely reduced by burning). This can also be explained by the location of the urban–rural area of Yangambi—largely within the YBR. The population only carries out its activities on small areas granted by the Institut National d’Etudes et de Recherches Agronomiques (INERA), and areas where there are repeated burnings on the same land. In 2016, Mikwa and colleagues [14] reported a decrease in the proportion of forest cover in Yangambi due principally to demographic pressure. The decrease could also be accentuated by management rules for preservation of the YBR, which are unclear and poorly enforced.

4.2. Water Quality in Yangambi According to WHO Standards

Apart from turbidity and pH, the physicochemical parameter analysis of the different Yangambi water points met WHO standards for drinking water [24]. Similar results in compliance with WHO standards were found in Haiti by Orelien in 2017 [26]. In the case of Haiti, of 29 physicochemical parameters analyzed, 28 complied with WHO and European Union standards. Nevertheless, possible sources of contamination influenced the quality of some water points in the YBR. These included agricultural practices, the discharge of livestock excrement into open areas, lack of demarcation of the water supply points for human consumption and animal watering, and deterioration of cisterns and roofs of houses. Also, all the interviewees confirmed the lack of well-organized facilities for household waste management.
Comparison of the averages of the physicochemical parameters of rivers did not show any significant difference between watersheds (p-value < 0.05), except for conductivity and turbidity (p-value <0.05). The significant differences observed between the averages for turbidity and conductivity between watersheds can be explained by LULC types in Yangambi. Mwayi and Naito in 2019 found that forest massifs in Malawi could reduce sedimentation caused by watershed runoff to supply major water points [27]. This suggests the presence of the biosphere reserve in Yangambi may be the basis for the few results we found, in line with WHO standards, in the watersheds predominated by forest LULC.

4.3. Physicochemical Parameters of River Waters’ Nexus Landscape Parameters in the Yangambi

The correlation analysis between different physicochemical parameters of rivers showed a positive relationship. The only exceptions were pH and conductivity—which were negatively correlated with each other—and temperature and dissolved oxygen (Table 5). This collinearity between the physicochemical parameter variables of stream water was confirmed by Xiao and Ji in 2007 [28]. Thus, only a few variables taken as indicators were needed to characterize the impact of LULC types on stream water quality. Pratt and Chang observed the negative correlation between temperature and dissolved oxygen in 2012 [29]. These authors identified biodegradable discharges in rivers as the possible cause of observed temperature rise. In fact, water quality is affected both by the biodegradable nature of these discharges and the degree of pollution by organic matter. Since microorganisms thrive on organic matter, their metabolism is largely responsible for the increase in water temperature and the decrease in dissolved oxygen in the water. Thus, the high temperatures of river waters in the highly anthropized watersheds (Lusambila and Isalowe) compared to those in the less anthropized watersheds (Bonde, Loweo and Lubilaie) could be related to the high rate of deposition of organic matter in the Lusambila and Isalowe rivers. Other factors for the rise in temperature could include atmospheric temperature at the time of water sample collection. Fortunately, our study collected samples in the morning hours during the rainy season (June–July).
The positive correlation between turbidity and pH was not significant, but could still be linked to the ferralitic soil type predominating in Yangambi, which usually undergoes deep leaching [30]. As hydrolysis is strong in equatorial environments, soluble elements such as silica and other cations are leached and transported to rivers by rainwater. The dissolution of atmospheric CO2 and silica thus leads to the formation of bicarbonate dissolved in stream water. Bicarbonate, due to its amphoteric nature, plays a buffer role in maintaining the pH of the water around a more or less neutral value [31]. This would explain why stream water with a less acidic pH and high turbidity is found when the MPA landscape indices of bare soil increase at the watershed level (Lusambila and Isaloe) (Figure 4).
Thus, as the proportion and MPA of DF increased, water at the watershed level became less turbid. A similar relationship with the proportion of DF was not significant, possibly due to other sources of variability not considered in this study. On the other hand, the increase in PD, MPA, ED, CL, bare soil and GL increased turbidity significantly.
The pH was positively influenced by almost all landscape parameters related to DF fragmentation, including ED_FD and PD_FD. These last two indices give an idea of the level of degradation of the DF cover. All landscape indices favoring other types of LULC (configuration and composition), other than those favoring DF, tend to make the pH of stream waters less acidic than those watersheds with high proportions of forests. This would explain why the Isalowe and Lusambila watersheds have less acidic pH and more turbid stream waters with high temperatures (Figure 4). In Loweo, Bonde and Lubilaie it is the opposite. They have more acidic pH, less turbid stream waters and lower temperatures. Therefore, the turbidity, pH and temperature of river waters in Yangambi are all influenced by the LULC types at the watershed level in Yangambi.
In a 2015 study [32] on the characterization of the Congo River waters, experts associated the acidic increase in water quality with the predominance of humic acids in forest environments. This explains the characteristic dark red coloring—due to the presence of decomposing forest organic matter—of rivers within watersheds with a large forest area. Conversely, waters in highly anthropized environments (BSR, CL, GL and PF) are less acidic with a tendency to be alkaline. The latter are referred to as white water (Figure 11).
The only significant SLR models that reflected the evolution of conductivity and dissolved oxygen with the change in landscape parameters in these watersheds were those of MPA_PF and MPA_C. Unfortunately, it has been difficult to explain these two relationships. Other sources of variability not considered in this study may give more insight. Producing meaningful SLR equations for all of these variables has been difficult.
Three SLR models best explained the variability of the analyzed physicochemical parameters of river water according to landscape parameters by referring to the AIC. These models explain the variation in pH as a function of ED_PF (94%), ED_crop land (92%) and PD_DF (90%) (Table 7). This suggests that landscape fragmentation in Yangambi has a significant and already noticeable effect on stream water quality.

4.4. Water Vulnerability and Climate Change in Yangambi

As previously discussed in the results section, it appears that different water supplies are used in Yangambi. In the old settlements constructed around the houses of INERA workers, especially in Lusambila and Isalowe, the presence of cisterns and improved water springs is noticeable. In the other watersheds (Bonde, Loweo and Lubilaie), people obtain water mostly from rivers and springs, even if these sources are not improved. Indeed, the history of Yangambi city shows that water collection infrastructures (mainly cisterns), inherited from the colonial period, are exclusively located in certain watersheds within the administrative districts of the INERA Yangambi city. These settlements are much closer to urban than rural areas. A similar situation is observed almost everywhere in sub-Saharan Africa, where lack of infrastructure is a major problem for water accessibility, especially in peri-urban and rural areas [10]. This explains the discrepancies in terms of access to quality water between rural and urban areas [9]. Also, water management policies in DRC have not paid sufficient attention to rural environments in the past. Hence, few initiatives in the framework of the establishment of hydraulic infrastructures by the NRHS or the Régie de distribution d’eau have been implemented in these areas [4]. As a result, a significant proportion of rural areas do not have water supply infrastructure. Certain characteristics of settlements in the different watersheds can explain this variability of the resource. These characteristics would explain the great diversity of water supply sources in such a small area as Yangambi.
The spatial distribution of surveyed water points using GIS shows that water sources vary in the five watersheds. Although there are several water points in Yangambi, some are in the middle of the forest (in the YRB), far away from houses (Figure 8). People use water points closest to their homes. Thus, some watersheds are more accessible than others, depending on the available hydraulic possibilities. These hydraulic possibilities can be evaluated in terms of the number of water points close to settlements in the watersheds. This means that accessibility is good, especially in watersheds with cisterns, as they are close to houses. At the same time, in some villages, people walk more than 1 km to get water from springs or rivers. In other settlements, where the springs are far from homes and there are no cisterns, people depend exclusively on river water for all their needs, including drinking. For example: in Obiloto in the Bonde watershed, people depend mainly on river water for all their domestic needs; use in Isalowe varies between cisterns, springs and rivers. This situation affects the accessibility and the amount of water used per person per day in the different watersheds. That is why Isalowe and Lusambila are among the watersheds with the highest scores in terms of water use and accessibility.
The surveys revealed that water resource management capacity in Yangambi is generally low, except for the Isalowe watershed, which exceeds the 50% score (Figure 10). This situation is observed in many rural areas of developing countries [33,34]. In most of these countries, as well as in Yangambi (DRC), water is available, but the capacity to manage the resource is lacking [20]. Indeed, the Congolese population in rural areas lacks access to information, education and the basic infrastructure essential to their well-being [6]. Settlements in Isalowe and Lusambila have more capacity to manage the water resource than other settlements and villages; for example, they host some INERA employees, who have a certain social status.
Similarly, in terms of the water resource use component (amount of water consumed per person per day), the Isalowe watershed has the highest score. This advantage is probably due to the water collection infrastructure—especially the cisterns, and the high density of springs and rivers close to homes (Figure 5)—facilitating water accessibility and use. However, the same characteristics that favor Isalowe and Lusambila for water resources are at the root of their high population density. This puts strong pressure on the Yangambi forest compared to the Loweo, Lubilaie and Bonde catchment areas, whose population density is much lower. Based on different ways to assess the WPI, the vulnerability of water resources in the different watersheds varies in Yangambi. That is to say, the different socioeconomic and environmental characteristics of each village or settlement in the studied watersheds influence the different aspects of water resources in Yangambi. Other researchers have confirmed these results [21,22,34,35], showing that many parts of the world have high variability of water resources at different scales. The analysis of water resource variability based on meteorological parameters partly confirms that of Aguilar and colleagues in 2009 [36]. Based on climate data for 1955–2006, this study showed that, overall, the East Central African region had experienced a significant decline in total annual rainfall. Jemmali (2018) [37] published similar results. It identified irregularities and seasonality of rainfall as important components of the sub-Saharan climate responsible for drought and flooding in the region. The availability and accessibility of water in this region is often compromised when irregularities and seasonality are not considered. In turn, the global climate predictions in the fifth report of the Intergovernmental Panel on Climate Change and the Commission Internationale du Bassin Congo-Oubangui-Sangha [32] predict that temperatures will rise over this century, and that rainfall disruptions and prolonged periods of drought will be more frequent.
Figure 12 summarizes the vulnerability impact chain of water resources in Yangambi.

5. Conclusions and Recommendations

This study aimed to analyze the vulnerability of domestic water resources in the Yangambi context. We based the assessment of the impact of LULC types on the physicochemical quality parameters of stream water and whether the population would be able to adapt to this vulnerability in the context of climate change. The physicochemical parameters of stream water within the watersheds showed that water for domestic use no longer meets WHO standards for drinking water. This situation is amplified by the conversion of DF cover to other types of land use (linked to anthropization). These practices, in turn, deteriorate physicochemical parameters such as turbidity, pH and temperature of stream water. Unfortunately, the population in Yangambi has a low capacity to manage this resource, which results in high vulnerability for climate change adaptation. This vulnerability is already apparent through climate parameters recorded at the INERA Yangambi meteorological station based in this area. Therefore, we recommend an analysis of the state of the water resource by watershed to determine the best options for water resource management in Yangambi. At the same time, an exhaustive hydrological data sampling is needed to understand the different types of LULC contributions to the variability of water resource quality in Yangambi. The installation of gauging stations at different rivers in Yangambi will be important for better monitoring of the water resource. Finally, the installation of infrastructures that can help supply water to the communities while preserving the DF within the YBR is a priority, as water quality and quantity highly depend on it. A qualitative and quantitative evaluation of the impact of LULC change on water resources’ quality and availability would be interesting. It could consider detailed analyses of physicochemical (organic ions, major inorganic ions, trace elements, etc.) and biological parameters of water, as well as the variation of streamflow data within the YBR catchments.

Author Contributions

Conception: D.J.S., J.-M.K., and M.S.; Data Curation: D.U.C. and D.I.; writing—original draft: D.J.S., J.-M.K., M.S., D.U.C., D.I., J.B.C., F.L.F.; writing—review and editing: D.J.S., J.-M.K., M.S., D.U.C., D.I., J.B.C., F.L.F. All authors have read and agreed to the published version of the manuscript.

Funding

This research was funded by the European Union (Contract FED/2016/381-145) and NORAD Grant agreement code No: NOR114.

Acknowledgments

The authors would like to thank the European Union and CIFOR for funding through the Training and Research in Tshopo (FORETS: Formation, Recherche, Environment dans la Tshopo) project. We also thank the Resources & Synergies Development design office for its logistical support. This research was carried out to partially complete the requirements of a master’s degree, but also as part of the CIFOR GCS-REDD+ project funded by the Norwegian Agency for Development Cooperation (NORAD).

Conflicts of Interest

The authors declare no conflict of interest.

References

  1. Uuemaa, E.; Roosaare, J.; Mander, Ü. Scale dependence of landscape metrics and their indicatory value for nutrient and organic matter losses from catchments. Ecol. Indic. 2005, 5, 350–369. [Google Scholar] [CrossRef]
  2. Zhu, X.J.; Yu, G.R.; Wang, Q.F.; Hu, Z.M.; Zheng, H.; Li, S.G.; Sun, X.M.; Zhang, Y.P.; Yan, J.H.; Wang, H.M.; et al. Spatial variability of water use efficiency in China’s terrestrial ecosystems. Glob. Planet. Chang. 2015, 129, 37–44. [Google Scholar] [CrossRef]
  3. FAO. Global Forest Resources Assessment 2010; Food and Agricultural Organization: Rome, Italy, 2010; ISBN 978-92-5-106654-6. [Google Scholar]
  4. Brummett, R.; Tanania, C.; Pandi, A.; Ladel, J.; Munzini, Y.; Russell, A.; Stiassny, M.; Thieme, M.; White, S.; Davies, D. Ressources en Eau et Biens et Services Liés à L’écosystème Forestier; Les forêts du bassin du Congo—Etats des forêts 2008; Office des publications de l’Union européenne: Luxembourg, 2008; pp. 145–161. Available online: http://carpe.umd.edu/ (accessed on 15 December 2020).
  5. de Wasseige, C.; Tadoum, M.; Eba’a Atyi, R.; Doumenge, C. Les forêts du Bassin du Congo—Forêts et Changements Climatiques; Weyrich: Neufchâteau Belgium, 2015; 127 p, ISBN 978-2-87489-356-8. [Google Scholar]
  6. Partow, H. Water Issues in the Democratic Republic of the Congo: Challenges and Opportunities; UNEP: Nairobi, Kenya, 2011. [Google Scholar]
  7. Mayaux, P.; Pekel, J.F.; Desclée, B.; Donnay, F.; Lupi, A.; Achard, F.; Clerici, M.; Bodart, C.; Brink, A.; Nasi, R.; et al. State and evolution of the African rainforests between 1990 and 2010. Philos. Trans. R. Soc. B Biol. Sci. 2013, 368, 20120300. [Google Scholar] [CrossRef] [Green Version]
  8. Chishugi, J.; Xu, Y. Water supply and sanitation in the Democratic Republic of the Congo. In Sustainable Groundwater Resources in Africa; CRC Press: Cap Town, South Africa, 2009; pp. 205–220. [Google Scholar] [CrossRef]
  9. IMF. Issues in Managing Water Challenges and Policy Instruments: Regional Perspectives and Case Studies; Tech Companion Note; IMF: Washington, DC, USA, 2015; pp. 1–22. [Google Scholar]
  10. Dieng, M. L’eau en Afrique, Les Paradoxes D’une Ressource Très Convoitée. 2011, p. 3. Available online: https://www.idrc.ca/sites/default/files/sp/Documents%20FR/ict4d-article-water-dieng-fr.pdf (accessed on 15 December 2020).
  11. Barten, P.K.; Ernst, C.E. Land conservation and watershed management for source protection. Am. Water Work Assoc. 2004, 96, 121–135. [Google Scholar] [CrossRef]
  12. Sonwa, D.J.; Farikou, M.O.; Martial, G.; Félix, F.L. Living under a fluctuating climate and a drying Congo basin. Sustainability 2020, 12, 2936. [Google Scholar] [CrossRef] [Green Version]
  13. Garcia-Chevesich, P.A.; Neary, D.G.; Scott, D.F.; Benyon, T.R. Forest Management and the Impact on Water Resources: A Review of 13 Countries; UNESCO: Paris, France, 2017. Available online: https://www.fs.usda.gov/treesearch/pubs/54133 (accessed on 17 December 2020).
  14. Mikwa, N.; Masimo, K.; Kahindo, J.; Nshimba, H. Analyse prospective de la déforestation estimée par télédétection dans la réserve de biosphère de Yangambi. Int. J. Innov. Sci. Res. 2016, 24, 236–254. [Google Scholar]
  15. Tyukavina, A.; Hansen, M.C.; Potapov, P.; Parker, D.; Okpa, C.; Stehman, S.V.; Kommareddy, I.; Turubanova, S. Congo Basin forest loss dominated by increasing smallholder clearing. Sci. Adv. 2018, 4, eaat2993. [Google Scholar] [CrossRef] [Green Version]
  16. Sood, A.; Ritter, W.F. Developing a framework to measure watershed sustainability by using hydrological/water quality model. Water Res. Prot. 2011, 3, 788–804. [Google Scholar] [CrossRef] [Green Version]
  17. Babur, E.; Kara, Ö. The Turkish Journal of Occupational/Environmental Medicine and Safety. Turkish J. Occup. Environ. Med. Saf. 2004, 1, 4711. Available online: http://dergipark.gov.tr/download/article-file/324842 (accessed on 15 December 2020).
  18. Stolton, S.; Dudley, N. Managing forests for cleaner water for urban populations. Unasylva 2007, 58, 39–43. [Google Scholar]
  19. Center for International Forestry Research. Améliorer l’accès à l’eau et à l’éléctricité—Diagnostic des Potentialités Solaires et Options Hydrauliques Dans le Paysage de Yangambi; Center for International Forestry Research: Bogor, Indonesia, 2015; p. 4. [Google Scholar]
  20. Sullivan, C. Calculating a water poverty index. World Dev. 2002, 30, 1195–1210. [Google Scholar] [CrossRef]
  21. Manandhar, S.; Pandey, V.P.; Kazama, F. Application of water poverty index (WPI) in Nepalese context: A case study of Kali Gandaki River Basin (KGRB). Water Res. Manag. 2012, 26, 89–107. [Google Scholar] [CrossRef]
  22. Mohymont, B.; Demarée, G.R. Courbes intensité-durée-fréquence des précipitations à Yangambi, Congo, au moyen de différents modèles de type Montana. Hydrol. Sci. J. 2006, 51, 239–253. [Google Scholar] [CrossRef]
  23. American Public Health Association, American Water Works Association, Water Environment Federation. Standard Methods for the Examination of Water and Wastewater, 22nd ed.; American Public Health Association, American Water Works Association, Water Environment Federation: Washington, DC, USA, 2012; Volume 5, p. 186. [Google Scholar]
  24. WHO. Guidelines for Drinking-Water Quality: Fourth Edition Incorporating the First Addendum; World Health Organization: Geneva, Switzerland, 2017. [Google Scholar]
  25. Brandt, J.S.; Nolte, C.; Agrawal, A. Deforestation and timber production in Congo after implementation of sustainable management policy: A response to Karsenty et al. (2017). Land Use Policy 2018, 77, 375–378. [Google Scholar] [CrossRef]
  26. Orelien, F. Etude de la Qualite de L’eau Destinee a la Consommation Humaine Dans le Sous-Bassin Versant de Ravine Diable (Anse-A-Veau). Master’s Thesis, Université de Liège, Liège, Belgique, 2017. Available online: http://hdl.handle.net/2268.2/3245 (accessed on 15 December 2020).
  27. Mapulanga, A.M.; Naito, H. Effect of deforestation on access to clean drinking water. Proc. Natl. Acad. Sci. USA 2019, 116, 8249–8254. [Google Scholar] [CrossRef] [PubMed] [Green Version]
  28. Xiao, H.; Ji, W. Relating landscape characteristics to non-point source pollution in mine waste-located watersheds using geospatial techniques. J. Environ. Manag. 2007, 82, 111–119. [Google Scholar] [CrossRef] [PubMed]
  29. Pratt, B.; Chang, H. Effects of land cover, topography, and built structure on seasonal water quality at multiple spatial scales. J. Hazard. Mater. 2012, 209–210, 48–58. [Google Scholar] [CrossRef]
  30. Jones, A.; Breuning-Madsen, H.; Brossard, M.; Dampha, A.; Deckers, J.; Dewitte, O.; Gallali, T.; Hallett, S.; Jones, R.; Kilasara, M.; et al. Soil Atlas of Africa; European Commission, Publications Office of the European Union: Luxembourg, 2013; 176p, ISBN 978-92-79-26715-4B. [Google Scholar]
  31. Kombele, B. Caractéristiques pédologiques comparées de termitières sous forêts primaires du plateau de Yangambi en cuvette centrale congolaise. Tropicultura 2002, 20, 76–82. [Google Scholar]
  32. CICOS. Schéma Directeur d’Aménagement et de Gestion Des Eaux de La CICOS (SDAGE); Commission Internationale du Bassin Congo-Oubangui-Sangha: Kinshasa, Democratic Republic of the Congo, 2016. [Google Scholar] [CrossRef]
  33. Garriga, R.G.; Foguet, A.P. Improved method to calculate a water poverty index at local scale. J. Environ. Eng. 2010, 136, 1287–1298. [Google Scholar] [CrossRef] [Green Version]
  34. Awojobi, O. Water poverty index: An apparatus for integrated water management in Nigeria. Int. J. Innov. Appl. Stud. 2014, 8, 591–599. [Google Scholar]
  35. Jemmali, H. Mesures de la pauvreté en eau: Analyse comparative et développement de l‘indice de pauvreté en eau. VertigO 2013, 13. [Google Scholar] [CrossRef]
  36. Aguilar, E.; Aziz Barry, A.; Brunet, M.; Ekang, L.; Fernandes, A.; Massoukina, M.; Mbah, J.; Mhanda, A.; Do Nascimento, D.J.; Peterson, T.C.; et al. Changes in temperature and precipitation extremes in western central Africa, Guinea Conakry, and Zimbabwe, 1955–2006. J. Geophys. Res. Atmos. 2009, 114, 1–11. [Google Scholar] [CrossRef]
  37. Jemmali, H. Water poverty in Africa: A review and synthesis of issues, potentials, and policy implications. Soc. Indic. Res. 2018, 136, 335–358. [Google Scholar] [CrossRef]
Figure 1. Study area.
Land 10 00165 g001
Figure 2. Yangambi watersheds’ hypsometric curves.
Land 10 00165 g002
Figure 3. Yangambi watershed land use/land cover (LULC) maps.
Land 10 00165 g003
Figure 4. Water physicochemical parameters in watersheds.
Land 10 00165 g004
Figure 5. Average annual precipitation (1930–2017) and forecast for the year 2050. The error bars map the confidence interval of the forecast at 95%.
Land 10 00165 g005
Figure 6. Average annual temperatures (1970–2017) and forecast for the year 2050. The error bars map the confidence intervals of the forecast at 95%.
Land 10 00165 g006
Figure 7. Wind speed (1970–2016).
Land 10 00165 g007
Figure 8. Distribution map of water points in the five watersheds in Yangambi.
Land 10 00165 g008
Figure 9. Households surveyed by watershed and type of water supplies.
Land 10 00165 g009
Figure 10. Water Poverty Index (WPI) components pentagram for different watersheds in Yangambi.
Land 10 00165 g010
Figure 11. From left to right, (a) outlets of the Lusambila stream (water with a white color tendency) and (b) the Bonde stream (water with a reddish shade).
Land 10 00165 g011
Figure 12. Vulnerability impact chain of water resources in Yangambi.
Land 10 00165 g012
Table 1. Description of the landscape configuration indices.
IndicesDescriptions
Edge densityTotal length of all edge segments per unit of area for the thematic class under consideration.
Patch densityNumber of patches per unit of area, for a given thematic class
Great patch areaThe area of the largest patch for a given thematic class
Mean patch areaAverage area of patches for a given thematic class
Number of patchesNumber of patches for a given theme class
Table 2. Watersheds’ morphometric characteristics.
WatershedsBondeLoweoIsaloweLusambilaLubilaie
Surface area (km2)167.291.116.132.2122.6
Perimeter (km)117.275.126.541.893.5
Gravellius Index (KG)2.52.21.82.12.4
Average slope (%)7.87.39.27.68.0
River length (km)90.756.39.017.773.5
Drainage density (km/m2)0.50.60.60.60.6
Altitude (m)458468448450478
Equivalent rectangle:
Length (km)56.135.312.019.444.3
Width (km)3.02.61.31.72.8
Table 3. Water quality in Yangambi for the main domestic water supplies.
Water PointsPhysicochemical ParametersLusambilaBondeLubilaieIsaloweLoweoMean ± SDWHO Standards
Rivers
(n =7 water points)
Temperature (°C)26.423.324.0525.124.524.8 ± 0.6<30
Conductivity (µS/cm)15.9211.6412.09510.8812.3629 ± 17.5<400
pH6.2 *5.6 *5.3 *6.85.5 *5.3 ± 0.56.5–8.5
Turbidity (NTU)34.7 *4.39 1.165 11.2 *1.46 2.3 ± 2.5<5
Dissolved oxygen (mg/L)5.446.53 5.6656.48 4.675.6 ± 0.6-
Improved springs
(n =7 water points)
Temperature (°C)24.825.2-24.1-24.7 ± 0.6<30
Conductivity (µS/cm)28.329.5-22.3-26.7 ± 3.9<400
pH5.2 *5.1 *-5.3 -5.2 ± 0.1 *6.5–8.5
Turbidity (NTU)0.20.3-1.2 -0.56 ± 0.6< 5
Dissolved oxygen (mg/L)3.95.7-5-4.8 ± 0.9-
Unimproved springs
(n = 8 water points)
Temperature (°C)24.923.325.524.424.124.4 ± 0.8<30
Conductivity (µS/cm)27.211.657.111.522.326 ± 18.7<400
pH5.3 *5.6 *4.6 *5.5 *5.3 *5.3 ± 0.46.5–8.5
Turbidity (NTU)1.9 4.4 2.1 10 *1.2 3.9 ± 3.6< 5
Dissolved oxygen (mg/L)66.5 6.5 6.156.02 ± 0.6-
Cisterns
(n = 44 water points)
Temperature (°C)24.3--25.8-25 ± 0.1<30
Conductivity (µS/cm)42.2--80.4-61 ± 27<400
pH6.3 *--6.0 *-6.1 ± 0.26.5–8.5
Turbidity (NTU)14.8 *--2.8 -8.8 ± 8.5<5
Dissolved oxygen (mg/L)3.36--3.3-3.4 ± 0.01-
Legend: SD (Standard Deviation), Physicochemical parameters values that do not meet WHO criteria are marked with an asterisk * [24].
Table 4. Mean comparison of physicochemical parameters per watershed.
ParametersBetween Types of Water pointsBetween WatershedsBetween Springs in a WatershedBetween Rivers
in a Watershed
Temperature0.1620.0323 *0.2960.121
Conductivity0.6870.00 ***0.1160.0187 *
pH0.0297 *0.450.2590.0734
Turbidity0.730.3920.8720.00 ***
Dissolved oxygen0.5120.05890.9490.85
Significant p-values are followed by an asterisk * for < 0.05 and *** for < 0.001.
Table 5. Pearson’s correlation between the different physicochemical parameters.
ParametersTemperatureConductivitypHTurbidityDissolved Oxygen
Temperature10.580.660.92 *−0.49
Conductivity 1−0.140.660.81
pH 10.560.32
Turbidity 10.42
Dissolved oxygen 1
Significant values are followed by an asterisk * at the thresholds of 0.1.
Table 6. Correlation coefficient (r) between landscape parameters and physicochemical parameters of water samples.
TemperatureConductivitypHTurbidityDissolved Oxygen
DF_prop −0.99
PF_prop0.95 0.96
CL_prop 0.96
GL_prop0.93 0.97
ED_DF 0.99
PD_DF 0.950.94
MPA_DF −0.93
ED_PF 0.97
PD_PF 0.91
MPA_PF 0.94
ED_CL 0.960.91
PD_CL0.97 0.89
MPA_CL 0.93
ED_GL0.91 0.99
PD_GL 0.930.95
MPA_GL0.9 0.92
ED_BSR 0.93
MPA_BSR 0.89
Legends: The abbreviations in the table refer, respectively, to: DF_prop (Proportion of Dense Forest), PF_prop (Proportion of perturbed forest), CL_prop (Proportion of crop land), GL_prop (Proportion of grass land), BSR_prop (Proportion of bare soil and residential), ED_DF (edge density of dense forests), PD_DF (patch density of dense forests), MPA_DF (mean patch area of dense forests), GPA_DF (great patch area of dense forests), ED_PF (edge density of perturbed forest), PD_PF (patch density of perturbed forest), MPA_PF (mean patch area of perturbed forest), ED_CL (edge density of crop land), PD_CL (patch density of crop land), PD_GL (patch density of grass land), MPA_CL (mean patch area of crop land), ED_GL (edge density of grass land), PD_GL (patch density of grass land), MPA_GL (mean patch area of grass land), GPA_GL (great patch area of grass land), ED_BSR (edge density of bare soil and residential), PD_BSR (patch density of bare soil and residential) and MPA_BSR (mean patch area of bare soil and residential). Only significant values (p-value < 0.05) are listed.
Table 7. Best fitted simple linear regression models (p-value < 0.05).
Response Variable YExplicative Variable XFitted SLR ModelsR2AIC
TemperatureGrass landY = 23.4 + 10.3902X0.867510.9
PD_Crop landY = 22.94 + 53100X0.93627.2
ED_Grass landY = 23.2 + 418.0151X0.819812.4
MPA_Grass landY = 22.83 + 0.0000705X0.815112.5
ConductivityMPA_Perturbed forestY = 8.7 + 0.0002183X0.883815.5
pHED_Dense forestY = 4.2 + 464.98X0.97153.2
PD_Dense forestY = 4.8 + 294000X0.90492.9
ED_Perturbed forestY = 4.4 + 399.02X0.94580.1
PD_Perturbed forestY = 4.79 + 152000X0.8345.7
ED_Crop landY = 4.9411 + 180.3973X0.92681.6
PD_Grass landY = 4.71 + 311000X0.86174.8
MPA_BSRY = 7.65 − 0.000198X0.79656.7
TurbidityDense forestY = 4.3208 − 4.7445X0.97952.8
MPA_Dense forestY = 2.94 − 0.00000405X0.866712.2
Dissolved oxygenMPA_Crop landY = 5.26 + 0.0000112X0.87121.8
AIC: Akaike information criterion.
Table 8. Household proportion by distance to nearest stream and nearest springs and amount of water used per person per day by watershed.
WatershedDistance (m)Household Proportion by Water Point DistanceWater Consumed/ Person/Day
Springs (%)Rivers (%)Quantity (L)
Bonde
(n = 60 individuals)
<1000128433
≥1000505
≥20003811
Lusambila
(n = 30 individuals)
<100081333
≥10005063
≥20004224
Isalowe
(n = 57 individuals)
≤5009-43
<1000467
≥100065-
≥20002233
Loweo
(n = 33 individuals)
≥1000505031
≥20005050
Lubilaie
(n = 20 individuals)
≤5007510029
≥100025-
Table 9. Management capacity of water resources by using proxy variables.
WatershedsBonde
(n = 60 Individuals)
Lusambila
(n = 30 Individuals)
Isalowe
(n = 57 Individuals)
Loweo
(n = 33 Individuals)
Lubilaie
(n = 20 Individuals)
Proportion of household by water treatment methods (%)
No treatment9683399287
Filter4173900
Boiling000813
Chlorine002200
Proportion of heads of households by level of education (%)
Illiterate880813
Primary42849225
Secondary506791063
University017400
Household proportion by type of dwelling (%)
Rural house6717083100
Durable house3383100170
Publisher’s Note: MDPI stays neutral with regard to jurisdictional claims in published maps and institutional affiliations.

