Article

Graphene Nanoplatelets Suspended in Different Basefluids Based Solar Collector: An Experimental and Analytical Study

by
Omer A. Alawi
1,*,
Haslinda Mohamed Kamar
1,*,
Abdul Rahman Mallah
2,
Hussein A. Mohammed
3,*,
Mohd Aizad Sazrul Sabrudin
1,4,
Omar A. Hussein
5,
Salim Newaz Kazi
2 and
Gholamhassan Najafi
6
1
Department of Thermofluids, School of Mechanical Engineering, Universiti Teknologi Malaysia, 81310 UTM Skudai, Johor Bahru 81310, Malaysia
2
Department of Mechanical Engineering, University of Malaya, Kuala Lumpur 50603, Malaysia
3
School of Engineering, Edith Cowan University, 270 Joondalup Drive, Joondalup, WA 6027, Australia
4
PROTON Holdings Sdn Bhd, HICOM Industrial Estate, Batu 3, P.O. Box 7100, Shah Alam 40918, Malaysia
5
Department of Mechanical Engineering, College of Engineering-Alsharkat, Tikrit University, Tikrit 34001, Iraq
6
Department of Biosystem Engineering, Tarbiat Modares University, Tehran 14115-111, Iran
*
Authors to whom correspondence should be addressed.
Processes 2021, 9(2), 302; https://doi.org/10.3390/pr9020302
Submission received: 11 January 2021 / Revised: 26 January 2021 / Accepted: 30 January 2021 / Published: 5 February 2021
(This article belongs to the Special Issue Recent Advances in Processed Materials for Energy Applications)

Abstract

:
A flat plate solar collector (FPSC) was analytically studied, with functionalized graphene nanoplatelets (f-GNPs) as its working fluid. Four samples (wt % nanofluids) were prepared in different base fluids such as ethylene glycol (EG), distilled water (DW):EG (70:30), and DW:EG (50:50). Experimental results (via DW) were used to verify the effectiveness of the analytical model. Some of the operating conditions were taken into account in this research, including temperatures, power, and mass flow rates. Experimental techniques were used to elucidate the modified nanofluids’ physicochemical properties, such as its particle sizes, stability, and morphology, involving electron microscopes (EMs), UV–VIS, and X-ray techniques. Differential scanning calorimetry (DSC) and thermogravimetric analysis (TGA) were applied to test the thermal analysis. The findings confirmed that the use of f-GNPs nanofluids enhanced the performance of the FPSC relative to the use of base fluids for all testing conditions. The maximum enhancement of the collector’s effectiveness at a mass flow rate of 1.5 kg min−1 and a weight concentration of 0.1 wt %, increased to 12.69%, 12.60%, and 12.62% in the case of EG, DW:EG (70:30), and DW:EG (50:50), respectively. The results also confirmed an improvement in both the heat gain (FR(τα)) and heat loss (FRUL) coefficients for the f-GNPs nanofluid.

1. Introduction

Solar collectors are devices/mediums that convert incident solar energy into thermal energy via working fluids. There are many solar collectors, and the flat plate solar collector (FPSC) represents its most basic form, which carries out the energy conversion process via an absorbing plate [1,2,3,4]. An absorbing plate is made of black-colored materials or coated surfaces, which is to increase the absorption of incident solar rays [5]. The absorbed solar rays are then converted to heat via heat transfer fluids (HTFs), channeled to the absorbing plate via a network of collector pipes. Direct absorption solar collectors (DASCs) represent another type of solar collector where the radiation is absorbed via the heat carried by fluids, instead of the heat collected on the plate’s surface [6,7].
The physicochemical intricacies of a standard HTF are admittedly inferior to solid nanoparticles (NPs), which means that rays are translated into heat at lower heat transfer rates when using the former [8,9]. The efficiency of FPSCs can be enhanced [10,11] by eliminating HTFs from the system and using nanofluids which have superior thermal property.
The literature has several studies involving the use of carbon-based nanofluids as HTFs within FPSCs. Yousefi et al. [12,13,14] used a 2 m2 FPSC to determine the impacts of Al2O3–distilled water (DW), multiwalled carbon nanotubes (MWCNTs)–DW, and pH variation with MWCNTs–DW in the context of energy efficiency. The nanofluids flowed at 1–3 L min−1. The greatest improvement in the FPSC’s thermal efficiency was 28.3% at 0.2 wt % Al2O3–DW, with a surfactant [12]. The values of heat gain and loss coefficients increased by 65.51% and 45.84%, respectively, relative to the DW for the 0.4 wt % MWCNTs [13]. The use of 0.2 wt % MWCNTs at a pH value of 3.5 resulted in higher FPSC thermal performance relative to the use of 0.2 wt % MWCNTs at a pH value of 6.5 [14]. The effects of using 0.2 wt % and 0.4 wt % MWCNTs-DW nanofluids on decreasing the dimensions of an FPSC were reported in [15], where the size of the FPSC decreased by ~37% with the use of MWCNTs-DW nanofluid compared to that using distilled water as a base fluid. Said et al. [16] examined different nanofluids (SWCNTs, SiO2, TiO2, and Al2O3) to improve the effectiveness of FPSCs. SWCNTs-DW performed better than metal oxide nanofluids. When using SWCNTs–DW, the entropy generation and heat transfer coefficient decreased by ~4.34% and increased by ~15.33%, respectively, compared to those by using distilled water. Said et al. [17] increased the energy and exergy efficiencies of the FPSC–SWCNTs by ~95.12% and ~26.25%, respectively, which were higher than the values reported when using water (~42.07% and ~8.77%, respectively). The energy efficiency of an FPSC improved by ~33% via the addition of 0.005 wt % grapheme nanoplatelets (GNPs) to DI water as HTFs [18]. Ahmadi et al. [19] reported enhanced FPSC efficiency by ~12.19% and ~18.87% at 0.01 wt % and 0.02 wt % GNPs, respectively. Vincely and Natrajan [20] outlined an improvement in the GO-DW nanofluids’ thermal efficiency at a rate of 7.3% relative to that of the base fluid at a weight percent of 0.02 and a mass flow rate of 0.0167 kg s−1. Enhancements in the performance of the FPSC were 23.47%, 16.97%, 12.64%, 8.28%, 5.09%, and 4.08%, corresponding to the MWCNTs-DW, Gr-DW, CuO-DW, Al2O3-DW, TiO2-DW, and SiO2-DW, respectively [21]. Akram et al. [22] determined the improvement in the thermal performance of an FPSC to be 78% at a weight percent of 0.1 wt % CGNPs and a mass flow rate of 0.0260 kg s−1. Alawi et al. [23] analyzed the thermo-performance of FPSCs with GNPs as HTFs and reported that relative to the DW, the efficiency of the FPSCs increased by 10.7%, 11.1%, and 13.3% for the PEG-GNPs nanofluid in the case of multiple mass flow rates. In the case of metal oxides, GNPs, and SWCNTs nanofluids, the efficiency was directly proportional to the fraction of NPs, as the improved thermal properties mitigated hydrodynamic losses caused by high viscosity laminar flows [24]. The efficiency of the FPSC was directly proportional to both the weight concentration and specific surface area (SSA), up to 10.53% relative to that of the increase brought about by water [25]. Experimental work using hybrid MWCNT + Fe3O4/water nanofluids improved the absorber by 28.09% at 0.3 vol. % at 13:00 h daytime and a Reynolds number of 1413 relative to those using base fluid [26].
Studies on suspending GNPs in distilled water and ethylene glycol lack the primary literature. Therefore, this paper aims twofold with an experimental part and an analytical part. Different tools were used in the experimental section, such as differential scanning calorimetry (DSC), thermogravimetric analysis (TGA), UV–VIS, zeta potential, particle size, HR-TEM, SEM, and energy-dispersive X-ray spectroscopy (EDX) to examine the functionalized graphene nanoplatelets. The analytical section included a variety of operating conditions on three base fluids: the weight percentages of functionalized graphene nanoplatelets (f-GNPs), mass flow rates, input temperatures, and input rates (of heat). A deeper understanding of these parameters’ effects would help significantly enhance the operational efficiency of FPSCs.

2. Methodology

This work is divided into two distinct phases: the experimental phase comprising of preparing f-GNPs nanofluids, the determination of the density and specific heat capacity of the NPs, the evaluation of the long-term stability of the nanofluids using multiple characterization techniques such as UV–Vis, zeta potential, NP analysis, electron microscopy (SEM and HR-TEM), and EDX analysis. This work’s theoretical phase consisted of mathematical modeling via MATLAB for quantifying the thermal performance of base fluids infused with f-GNPs.
Firstly, the theoretical model was verified using experiments with DW [23] and an average error of ±3.53% was obtained (see Figure 1). The analytical approach (theoretical analyses) involved utilizing different base fluids containing f-GNPs for comparative analysis. Three base fluids were used in the mathematical model, which were ethylene glycol (EG), DW:EG (70:30), and DW:EG (50:50).

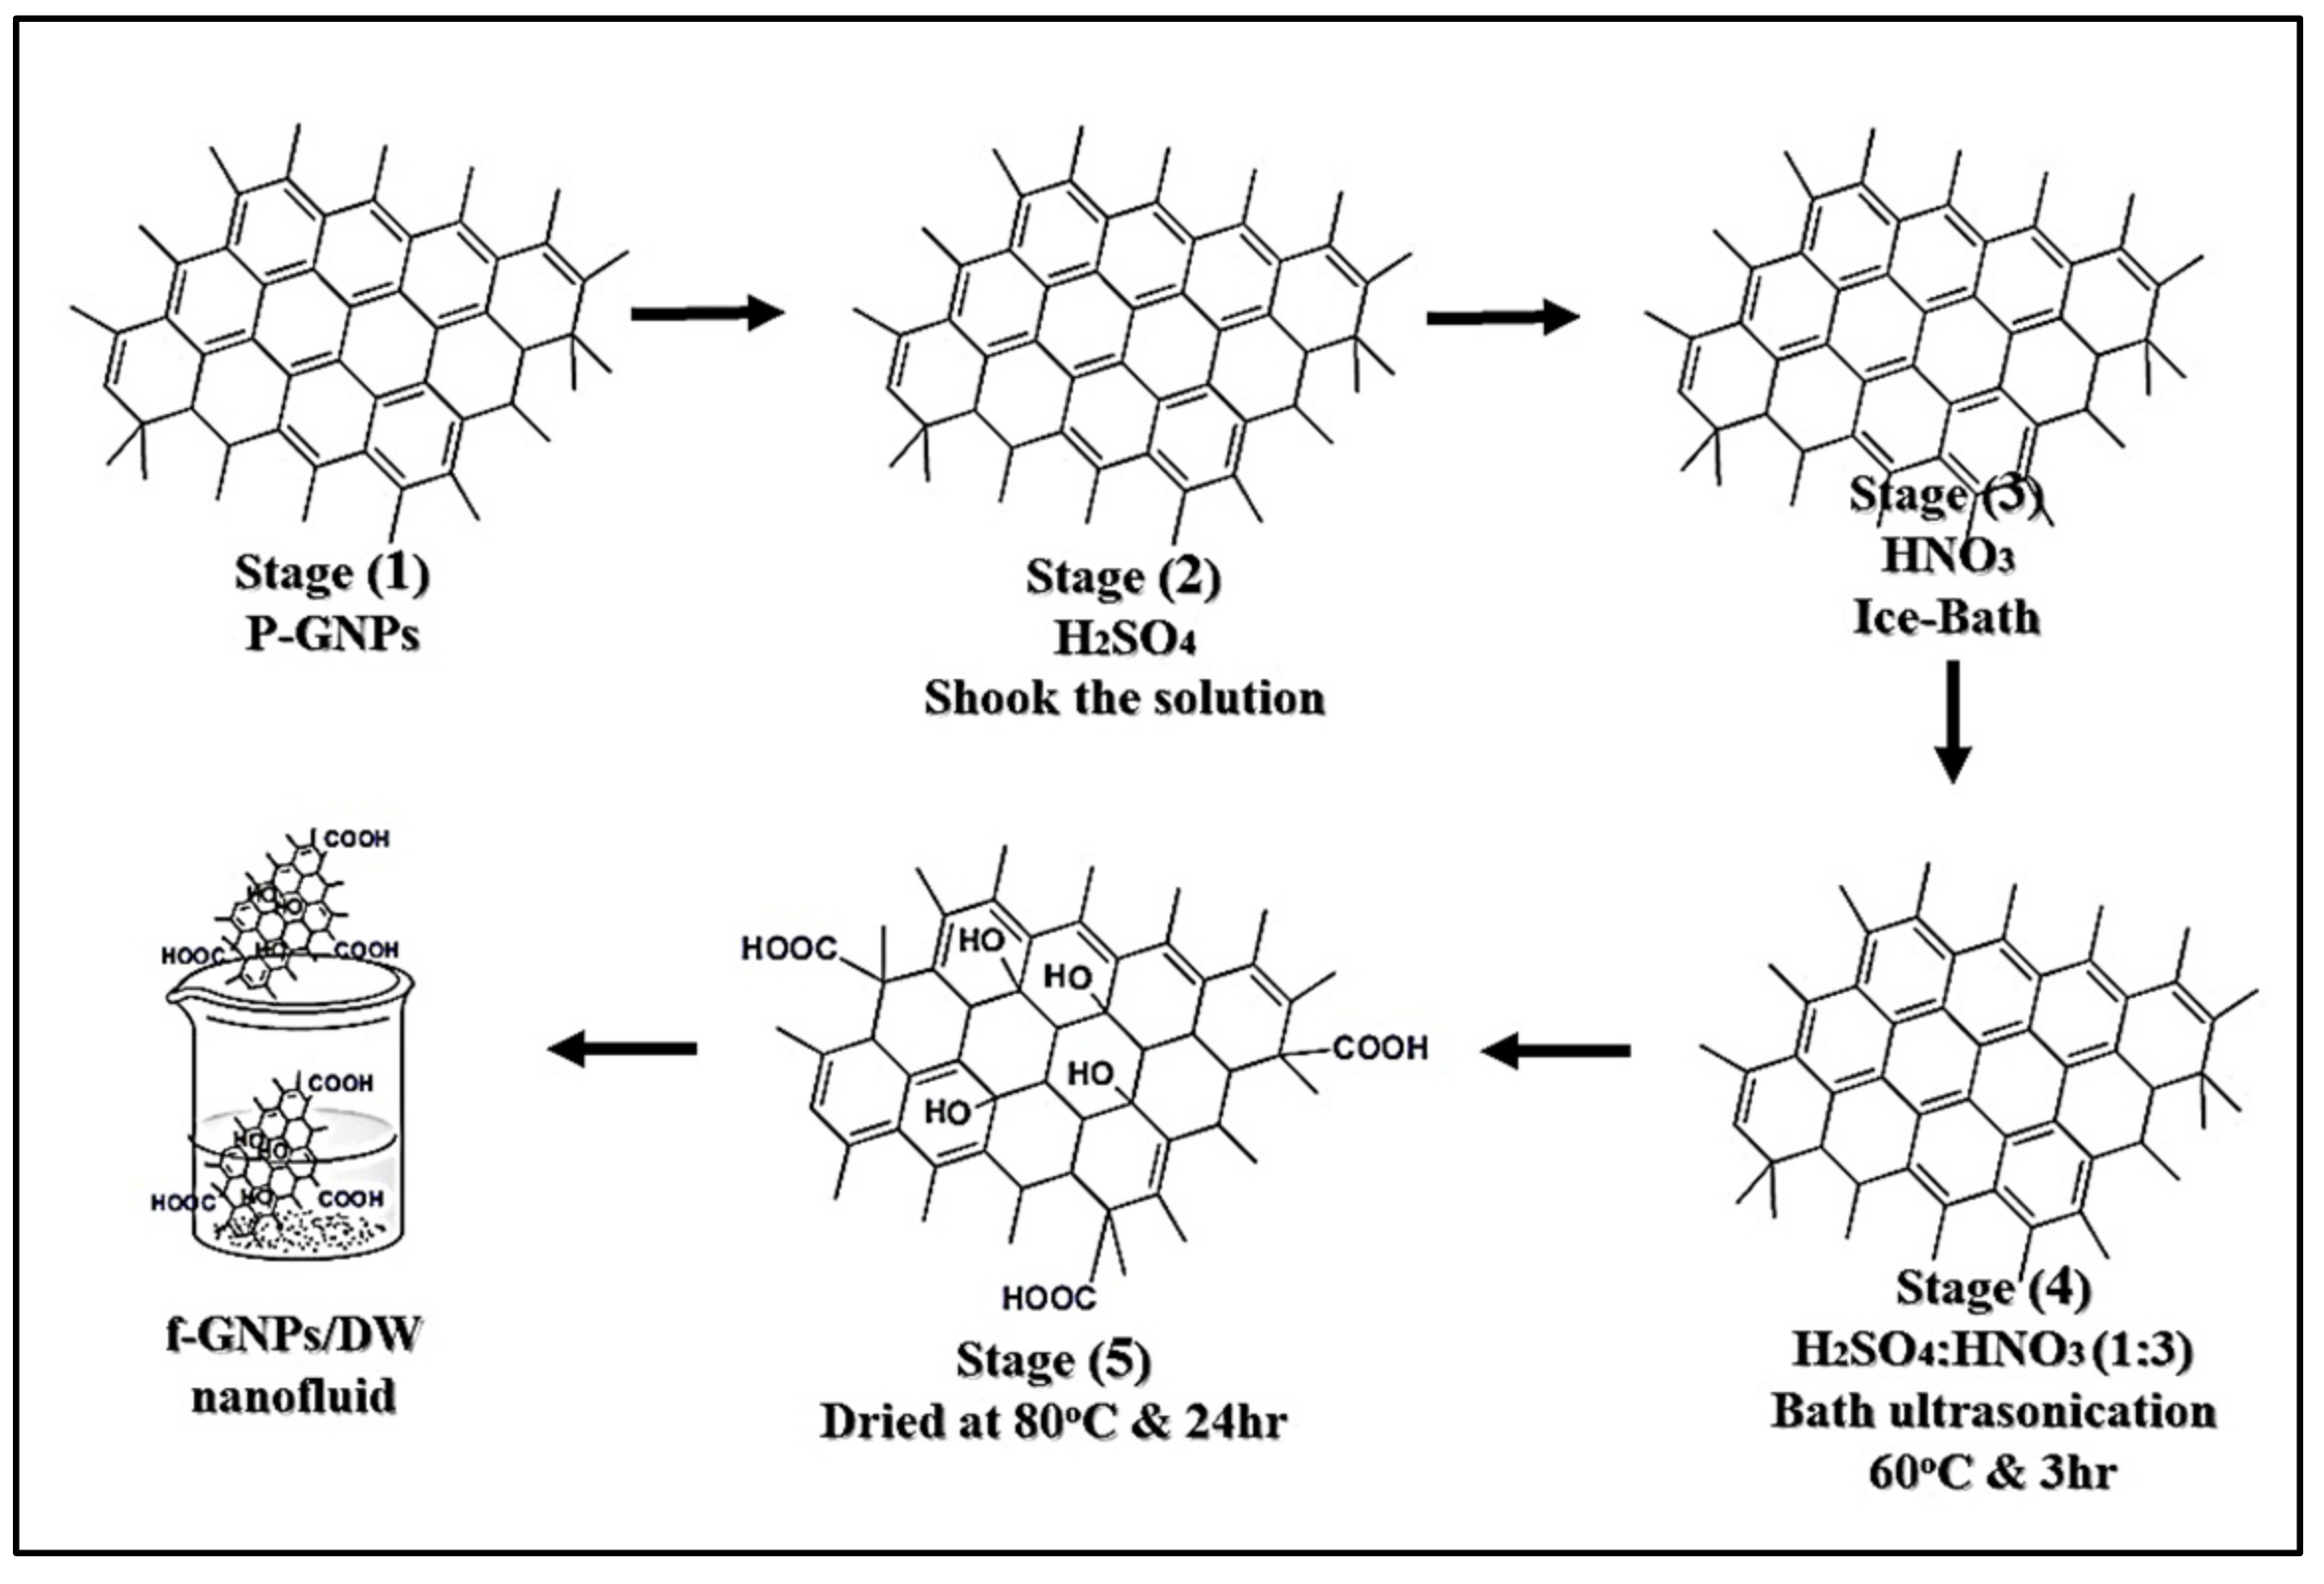
2.1. Preparation Method and Characterization

The image of the covalent-treated graphene nanoplatelets (f-GNPs) is shown in Figure 2. A high-power ultrasonication probe (Sonics Vibra Cell, Ningbo Kesheng Ultrasonic Equipment Co., Ltd., Ningbo, China) having a 20 kHz frequency power supply, a 1200 W output power, and bath ultrasonication (Powersonic, Digital Ultrasonic, UB-410) was used for the preparation of nanofluids. In addition, an industrial hot plate (HTS-1003 Hotplate Stirrer, LMS) was essentially needed for the synthesis process. The light absorbance of a suspension by UV–VIS spectroscopy represented a quantitative characterization of colloidal stability. The UV–VIS used in this work was a Shimadzu UV-spectrometer, operating within 190–3300 nm (UV-750, Lambda PerkinElmer, Waltham, MA, USA). The thermal properties were tested with a thermogravimetric analyzer in the range of 30 °C to 900 °C using PerkinElmer (TGA 4000, Waltham, MA, USA). Litesizer 500-Anton Paar was used for zeta potential and particle size determination following the principle of electrophoretic light scattering (ELS). The nanomaterials’ surface structure and morphology were determined using the Tescan Analytics (SEM; VEGA3) and high-resolution transmission electron microscopy system (HR-TEM; JEM-2100F), respectively.

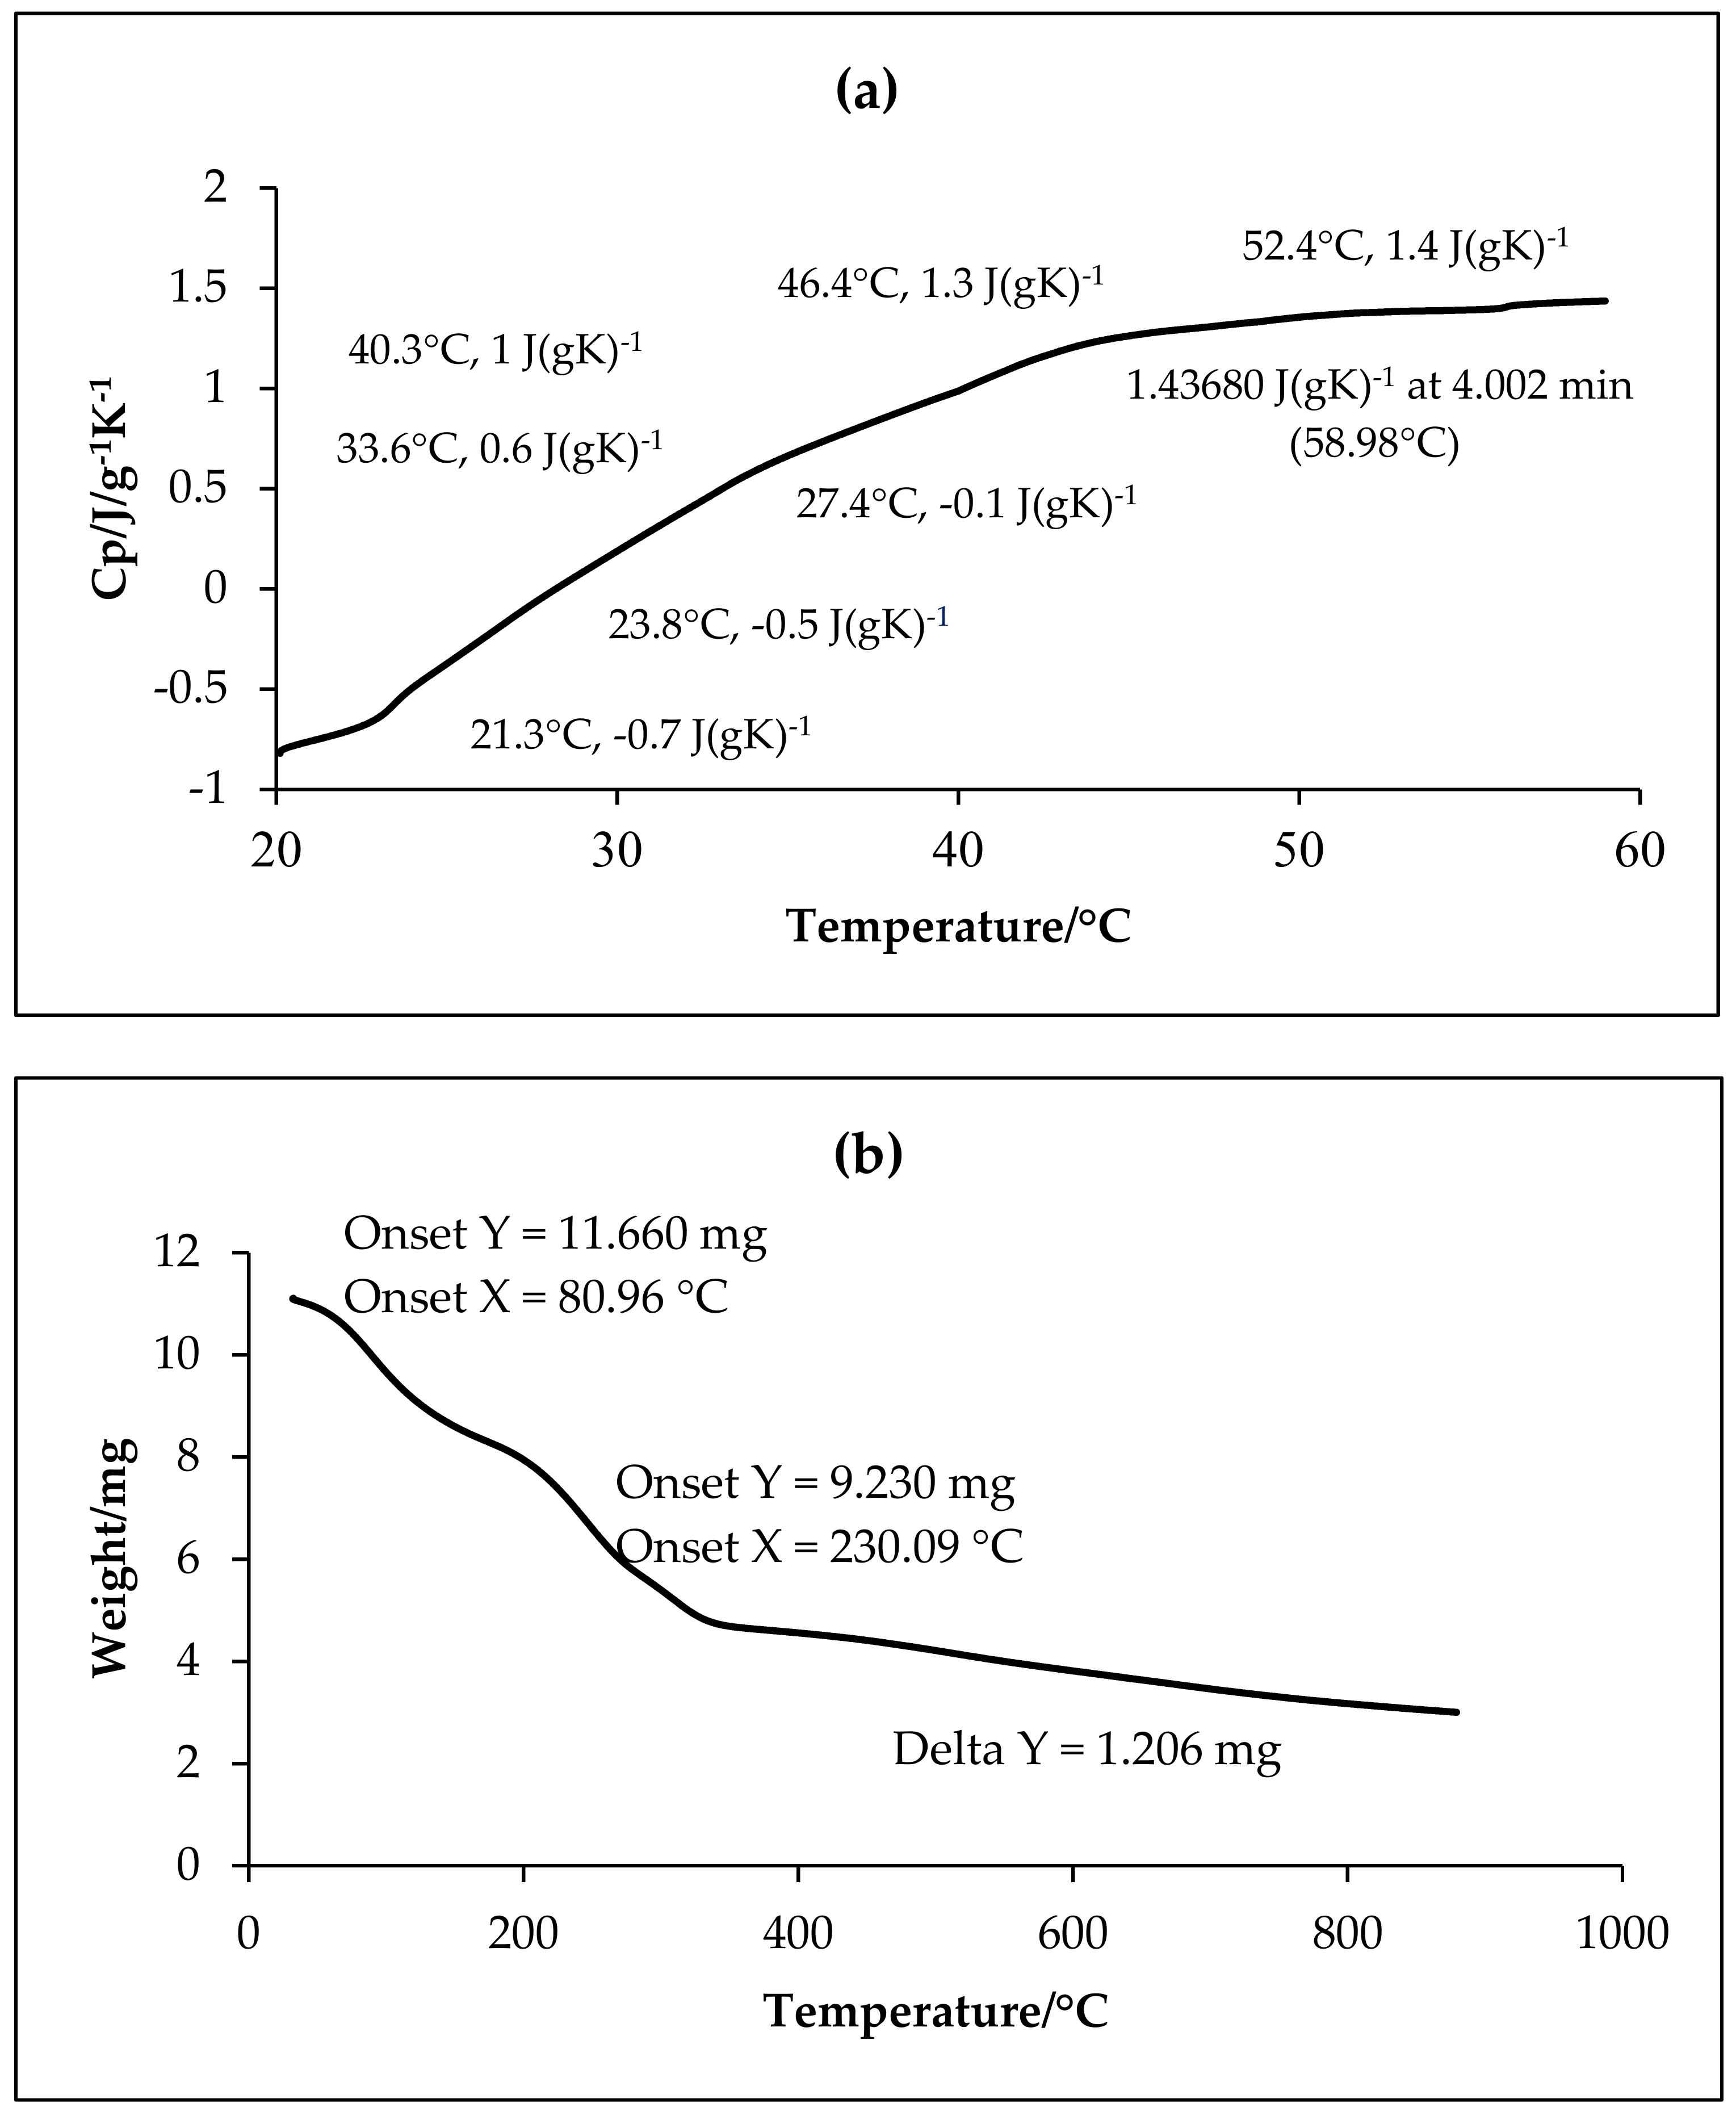
2.2. Density and Specific Heat Capacity Measurements

The densities and specific heats of the samples were measured and detailed as below:
(i).
Solid NPs: DM40-density meter (Mettler Toledo, Columbus, OH, USA) to determine densities and Linseis’ differential scanning calorimeter (1000-/C) to determine specific heats with a temperature range of −50 °C to 550 °C;
(ii).
Base fluids: densities and specific heats were obtained from the National Institute of Standards and Technology (NIST);
(iii).
f-GNPs nanofluids: densities and specific heats were determined using the equations reported by Pak and Cho [27].

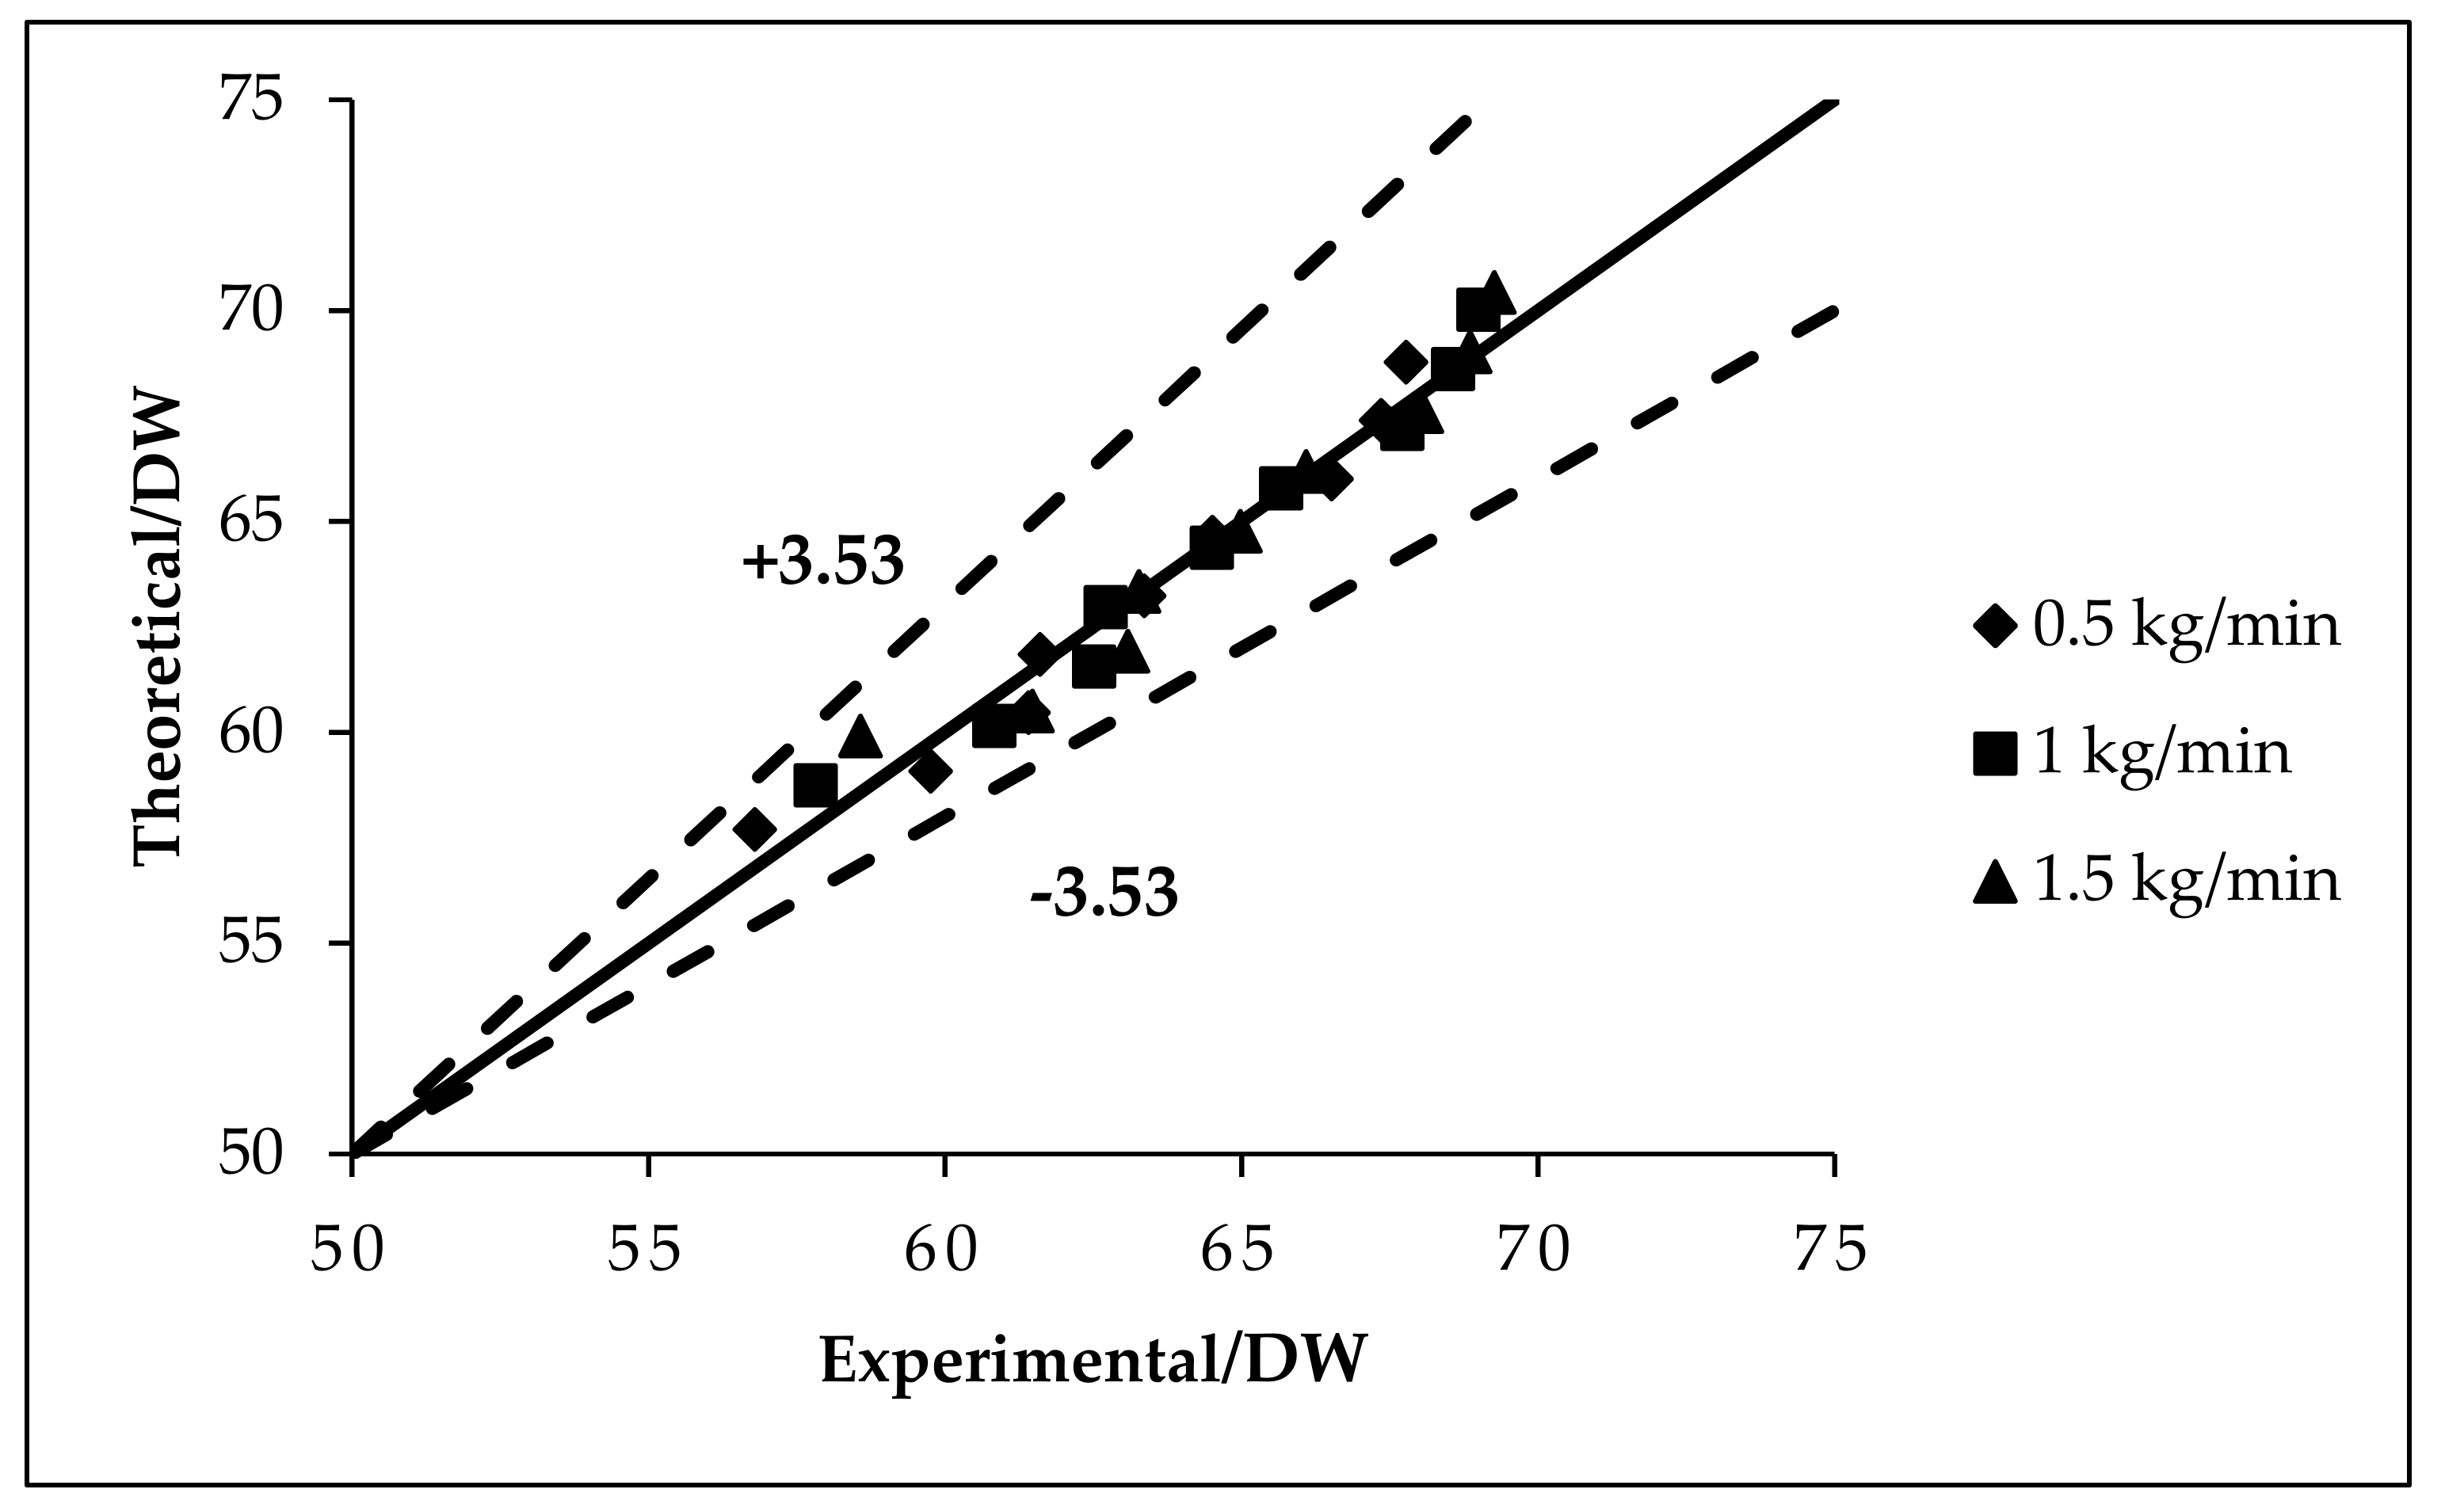
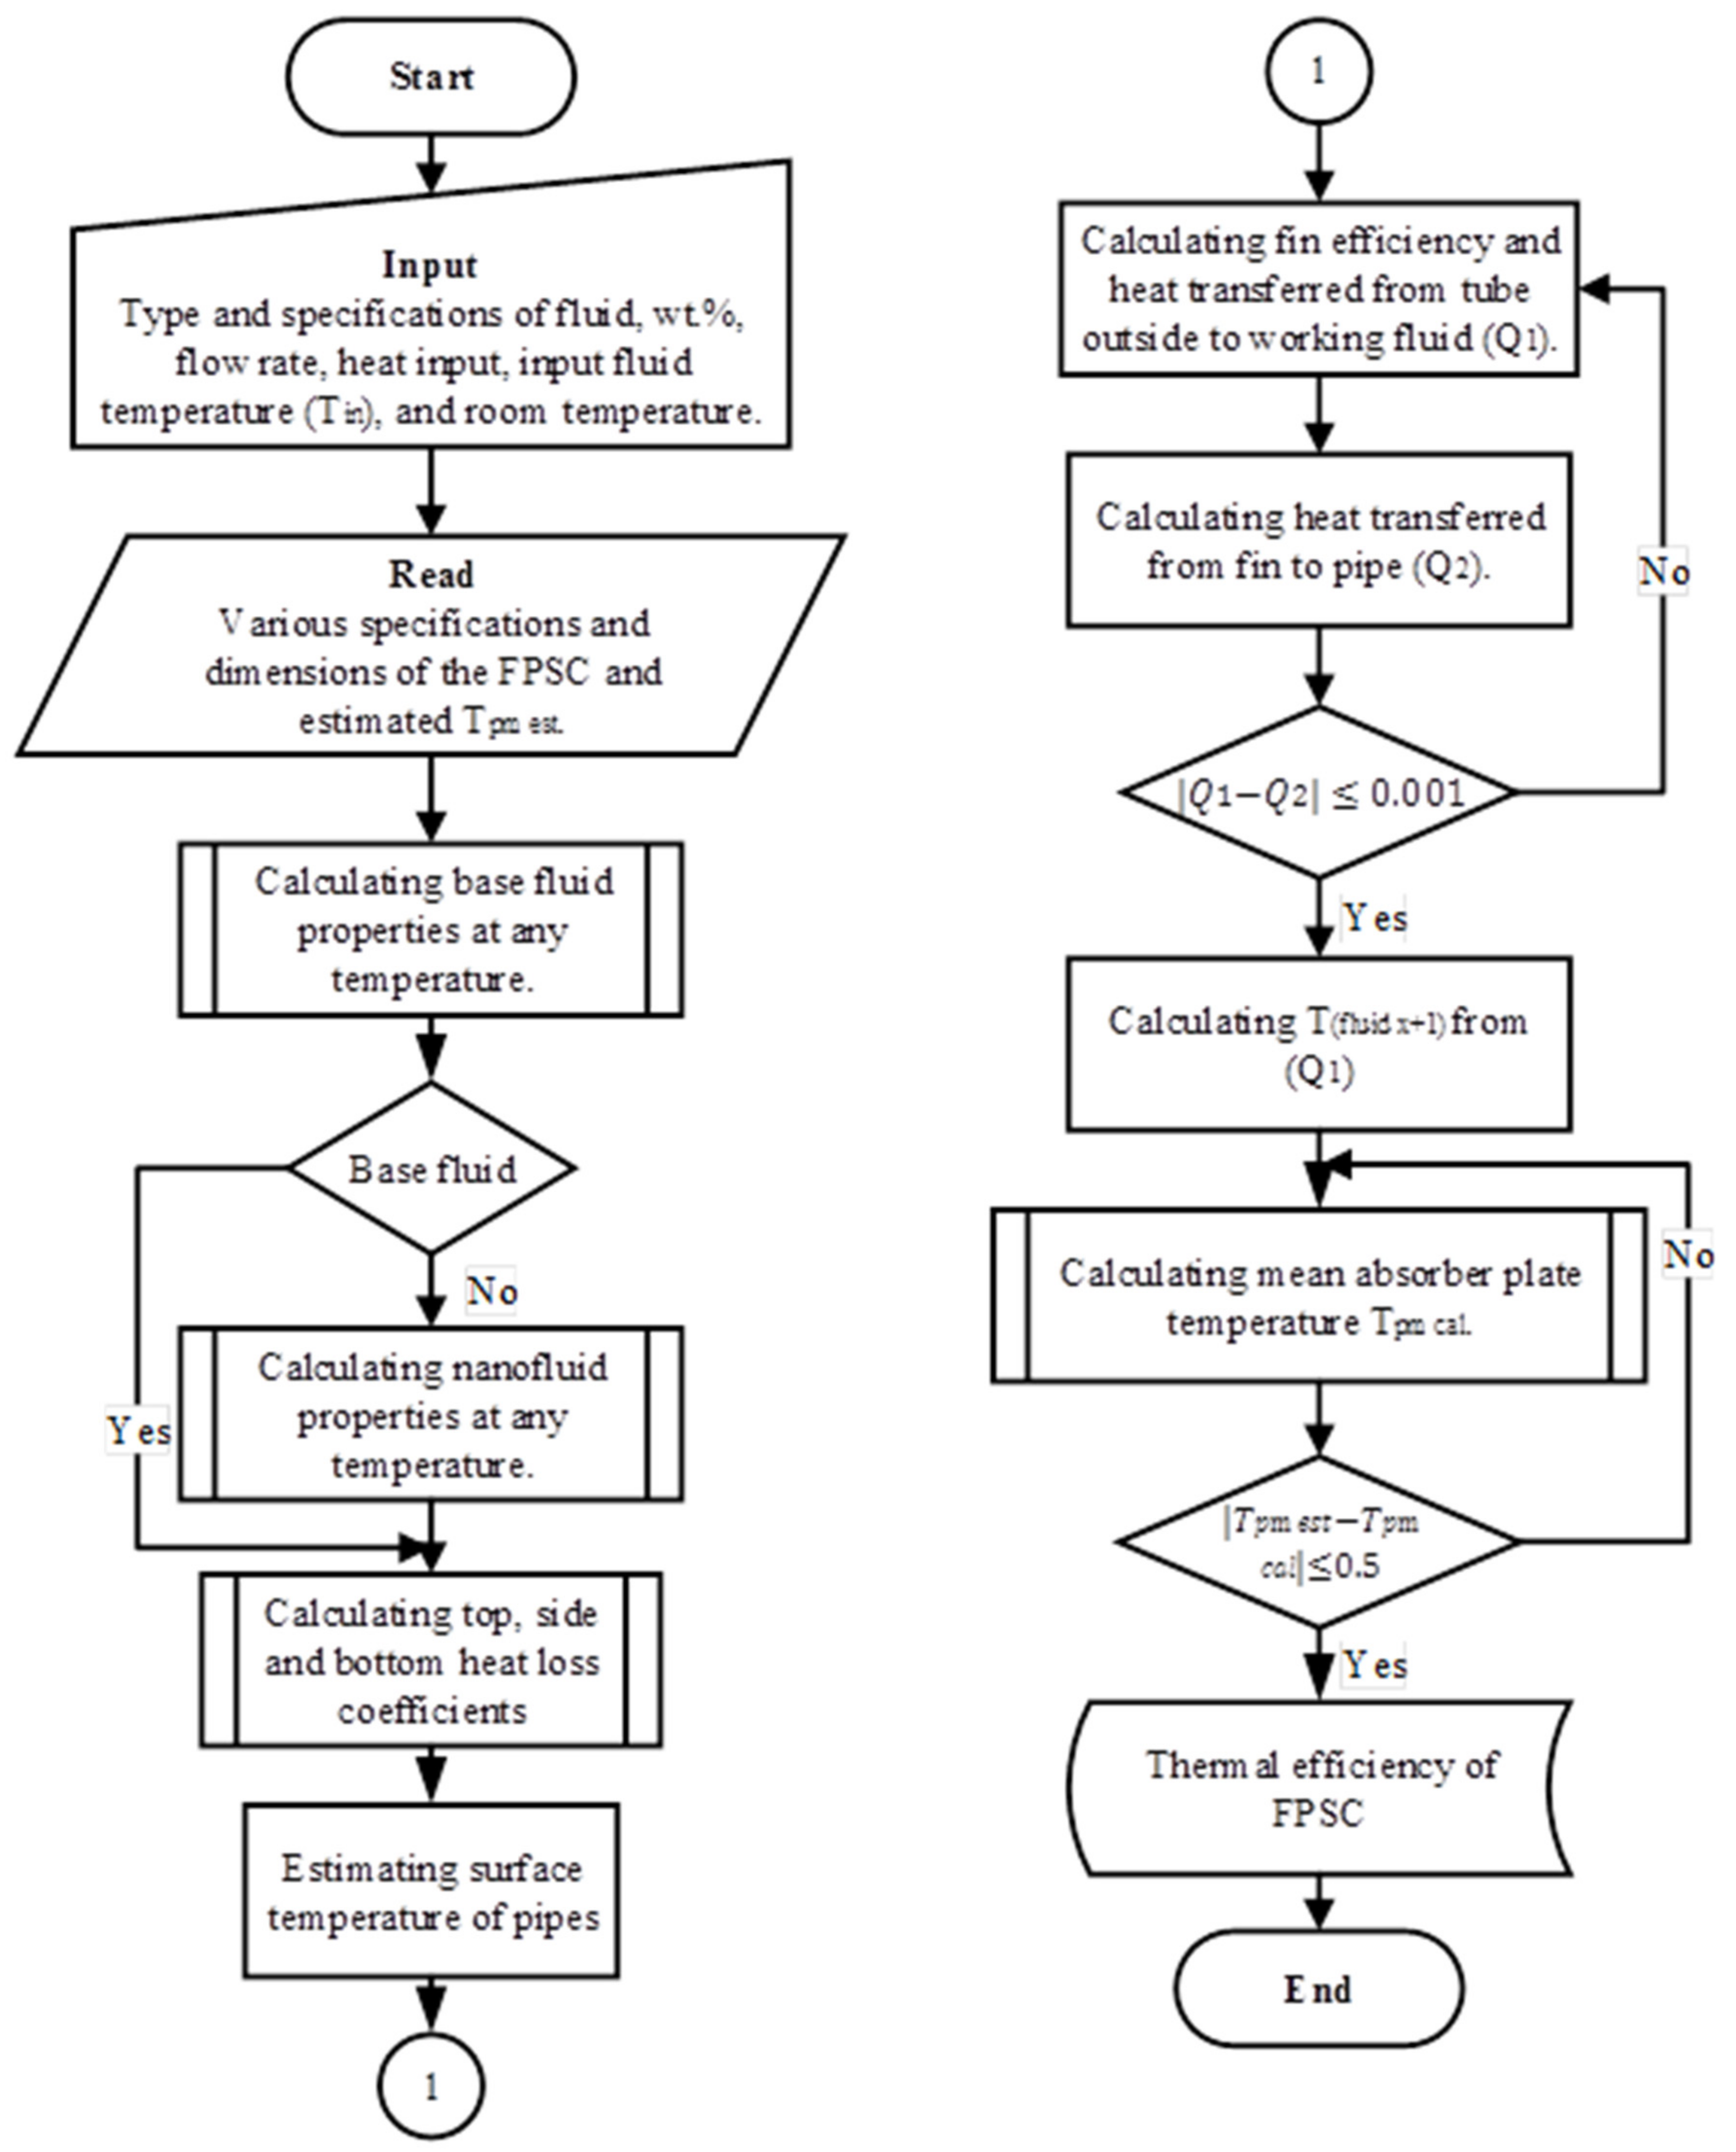
2.3. Theoretical Approach and MATLAB

The model constructed for determining the energy efficiency of the FPSC infused with nanofluids used the Hottel–Whillier principles reported by Duffie and Beckman [5], which was also slightly modified to align it with the objectives of this work (refer to Table 1). Some of the assumptions made when constructing the model were that it was designed to elucidate the performance of the FPSCs while keeping their fundamental values intact. The model was also designed to simulate the nanofluid-based FPSC in MATLAB, as outlined in Figure 3. However, in the mathematical/analytical model, only one of the tubes was assumed to experience a uniform fluid flow via all of the riser pipes within the parallel channel system.

2.4. Data Processing

The total collector heat loss encompasses the top heat loss via a glass cover and a back as well as the edge heat loss via the back and edge insulations. The losses were measured at a similar mean plate temperature (Tpm). The total heat loss from the collector was written as follows [5,28]:
Q l o s s = U L A c T p m T a ,
Q l o s s = Q t + Q b + Q e ,
where UL is the total loss coefficient of the collector, Ac is the area of the collector, and T p m T a is the temperature gradient between the mean plate and its surrounding atmosphere and the subscripts (t, b, and e) represent the top, back, and edge, respectively.
The following empirical equation can be used for manual and analytical calculations to determine the top collector loss coefficient (Ut), [5]:
U t = N c c T p m T p m T a N f f e e + 1 h w 1 + σ T p m T a T p m 2 + T a 2 1 ε a p + 0.00591 N h w + 2 N + f f 1 + 0.133 ε a p ε g N ,
where ff is written as (1 − 0.089hwind + 0.1166h2windεp) (1 + 0.078661N), CC is described as 520 × (1 − 0.000051 φ2), ee is written as 0.430 (1 − 100/Tpm), and N, σ, εg, εap, and hw are the number of glasses, the Stefan–Boltzmann constant, the emittance of glass, the emittance of the absorber plate, and the wind-heat transfer coefficient, respectively.
The following equations can be used to determine the back and edge heat losses [5,28]:
Q b = k b L b A b T p m T a ,
Q e = k e L e A e T p m T a ,
where kb, Lb, and Ab are the thermal conductivity, thickness, and back insulation area, respectively, while ke, Le, and Ae are the thermal conductivity, thickness, and area of edge insulation, respectively.
The following equation can be used to determine the useful energy (Qu) [29,30,31]:
Q u = m ˙ C p T o T i ,
where Cp is the specific heat capacity of the HTFs.
The specific heat and density of the nanofluid can be determined using Equations (7) and (8) [27,32]:
C p n f = 1 φ ρ b f C p b f + φ ρ n p C p n p 1 φ ρ b f + φ ρ n p ,
ρ n f = 1 φ ρ b f + φ ρ n p ,
where the subscripts (nf, bf, and np) represent the nanofluid, base fluid, and NPs, respectively.
Another indication for the rate of useful energy gained by the difference between the absorbed power and heat losses of the FPSC is as following [29,30,31]:
Q u = F R A c G T τ α U L T i T a ,
where FR is the heat removal factor, GT is the global solar radiation, τα is the product of absorptance and transmittance, (Ti – Ta) is the difference between the input/ambient temperatures, and η is the thermal efficiency of the collector, generally referred to as the Hottel–Whillier–Bliss equation, which can be written as [29,30,31]:
η = Q u A C G T = m ˙ C p T o T i A C G T ,
η = F R τ α F R U L T i T a G T .

3. Results and Discussion

3.1. Thermal Analysis

The TGA and DSC analyses of the f-GNPs are shown in Figure 4. At the range of 0–100 °C, the initial weight loss reflected in the f-GNPs was individually 11% in virtue of adsorbed moisture. The second slight weight loss for the f-GNPs was reported by 16% from 100 to 500 °C, which is attributable to the occurrence of −OH and C=O groups. In the range of 500–800 °C, the f-GNPs suffered another slight weight loss of nearly 24%, which is ascribable with the breakdown of the graphitic carbon structures in the air.

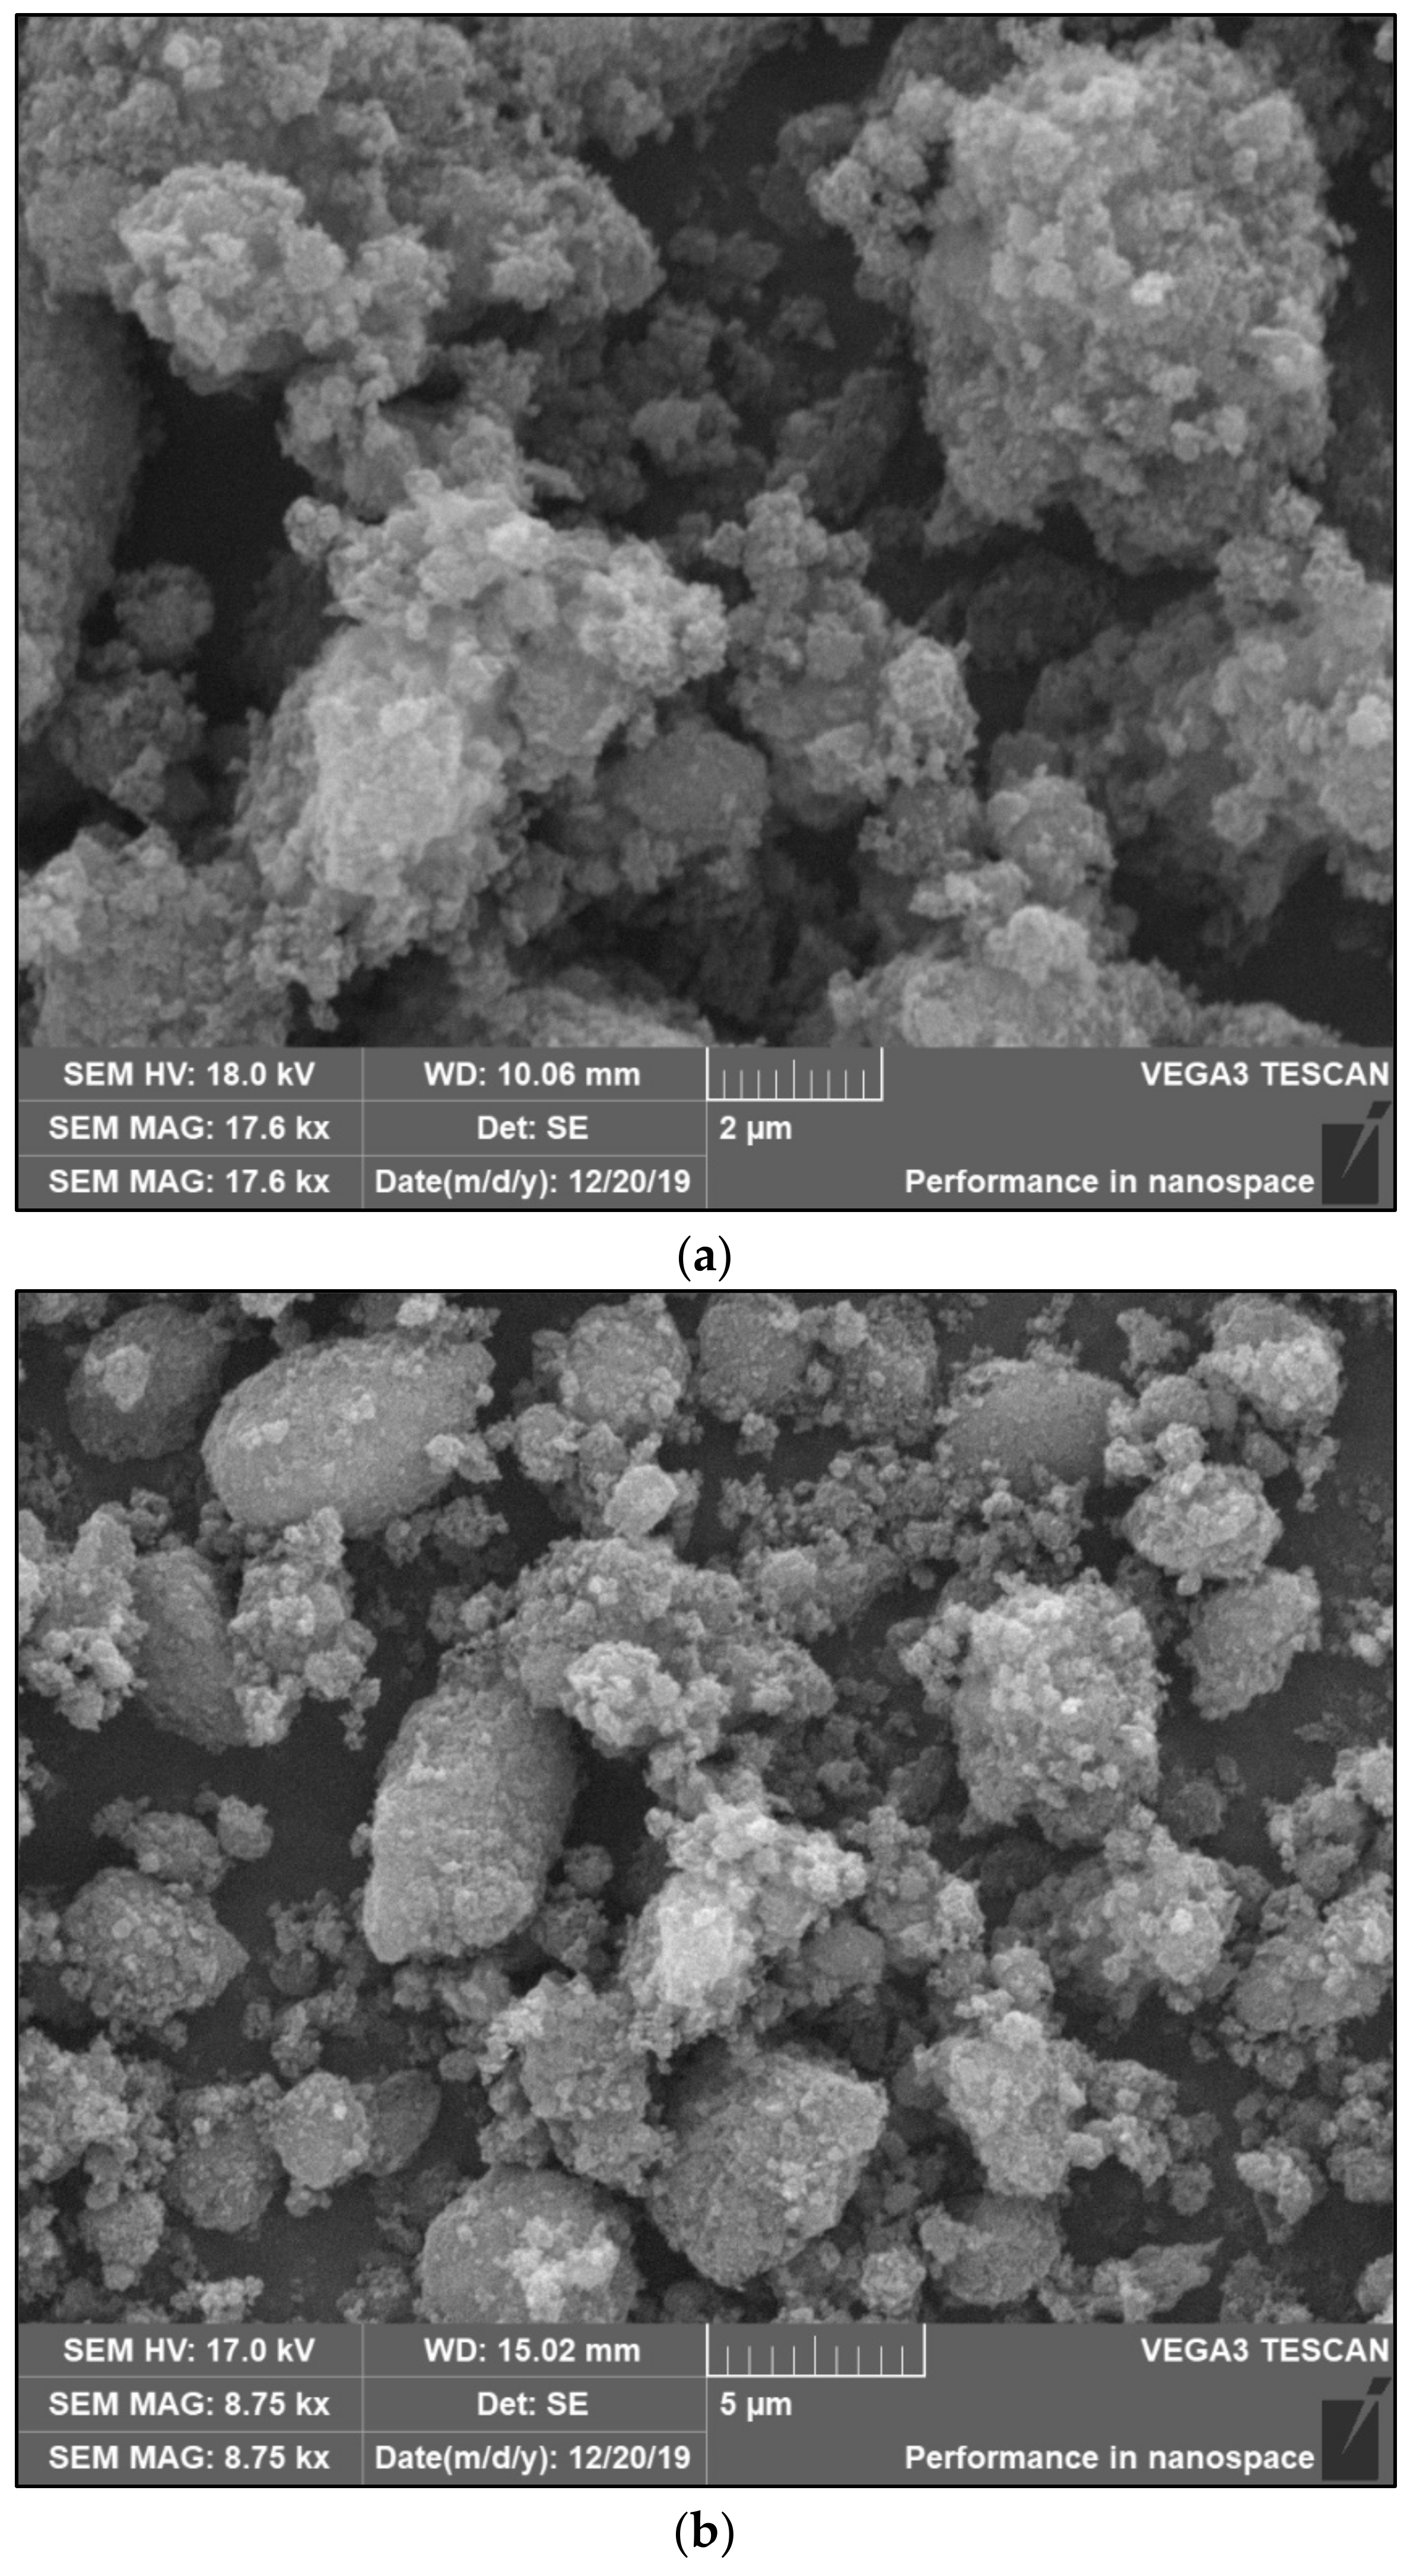
3.2. Stability and Morphological Analysis

Figure 5 illustrates the UV–VIS spectra of the f-GNPs suspended in DW at different sonication times. The sharp absorption peak located at a wavelength of ~283 nm is correlated with the π→π* transition of the C=C double bonds for the GNPs. The enlarged peak intensity resulting from the increasing particle percentages of the nanofluids directly complied with the Beer–Lambert law.
Zeta potential is defined as the measure of the effective electrical charge on NPs’ surface. Its magnitude represents particle stability; higher magnitudes mean increased stability from the (more) pronounced electrostatic repulsion between NPs [33,34]. Generally, NPs with zeta potentials of ≥30 mV or ≤30 mV are expected to be stable for the long term. Dispersions with zeta potentials of ≤25 mV or ≥25 mV will agglomerate due to interparticle (secondary) interactions [35]. The stability of the f-GNP suspensions in distilled water was elucidated using its zeta potential values and size distributions (Figure 6 and Figure 7). Figure 6 shows the zeta potential and polydispersity index (PDI) of the f-GNPs at a pH value of 7. Both factors are representative of the nature of the electrostatic interactions between the colloidal NPs and can be indicative of the state of stability of the overall solution(s). A more negatively charged (−39.4 mV) solution was reported postsonication for 1 h with the f-GNPs at a temperature of 25 °C. The size distributions of the f-GNPs solutions were determined using the concept of dynamic light scattering (DLS), and the results are shown in Figure 7, where the average particle size of the f-GNPs was 442 nm. The size distribution of the f-GNPs was 83.9–1318.6 nm, and its PDI was 0.255 (low).
The pristine GNPs had a multilayered structure with a smooth surface and edges (low edge defects) within aggregations, as per Figure 8a. Contrarily, surfactal features of the f-GNPs were rough and riddled with defects and wrinkles due to the prevalence of covalent functionalization (see Figure 8b). Postfunctionalization, the acid treatment, and the carboxyl group on the edges and surfaces of GNPs resulted in crumpled and wrinkled sheets, showcasing a minimal blur effect. The morphological and functional group analyses confirmed the strong reactions between the acid molecules and the GNPs–COOH, while the defective folded flakes and rough edges represented the successful occurrence of the covalent functionalization method. The lines evident in the HR-TEM images were wrinkles on the GNPs surface, caused by the inherent stability in the 2D structures. The functionalization method resulted in increased amounts of these lines during sonication, which was further exacerbated from prior wrinkling/waviness.
The dispersion and the stabilizing effect of the f-GNP nanofluids were determined using SEM. The surfactant-stabilized nanofluids were placed onto a silicon wafer for SEM imaging purposes. Figure 9 shows that the GNPs were flat and smooth flakes with sharp corners of various in-plane sizes. The SEM micrographs suggested that the covalent synthesis of the f-GNPs resulted in a significantly wrinkled structure. The results of the f-GNPs analyses using the energy-dispersive X-ray spectroscopy is detailed in Figure 9, where it encompassed carbon (C), oxygen (O), silicon (Si), sulfur (S), and zirconium (Zr). It can be seen that the carbon content was 88.95% and the atomic oxygen content was 10.94%. The atomic contents of Si, S, and Zr corresponded to 0.05%, 0.05%, and 0.01%, respectively. The results confirmed the formation of high-quality materials and are in excellent agreement with other works reported in the literature [36,37,38].

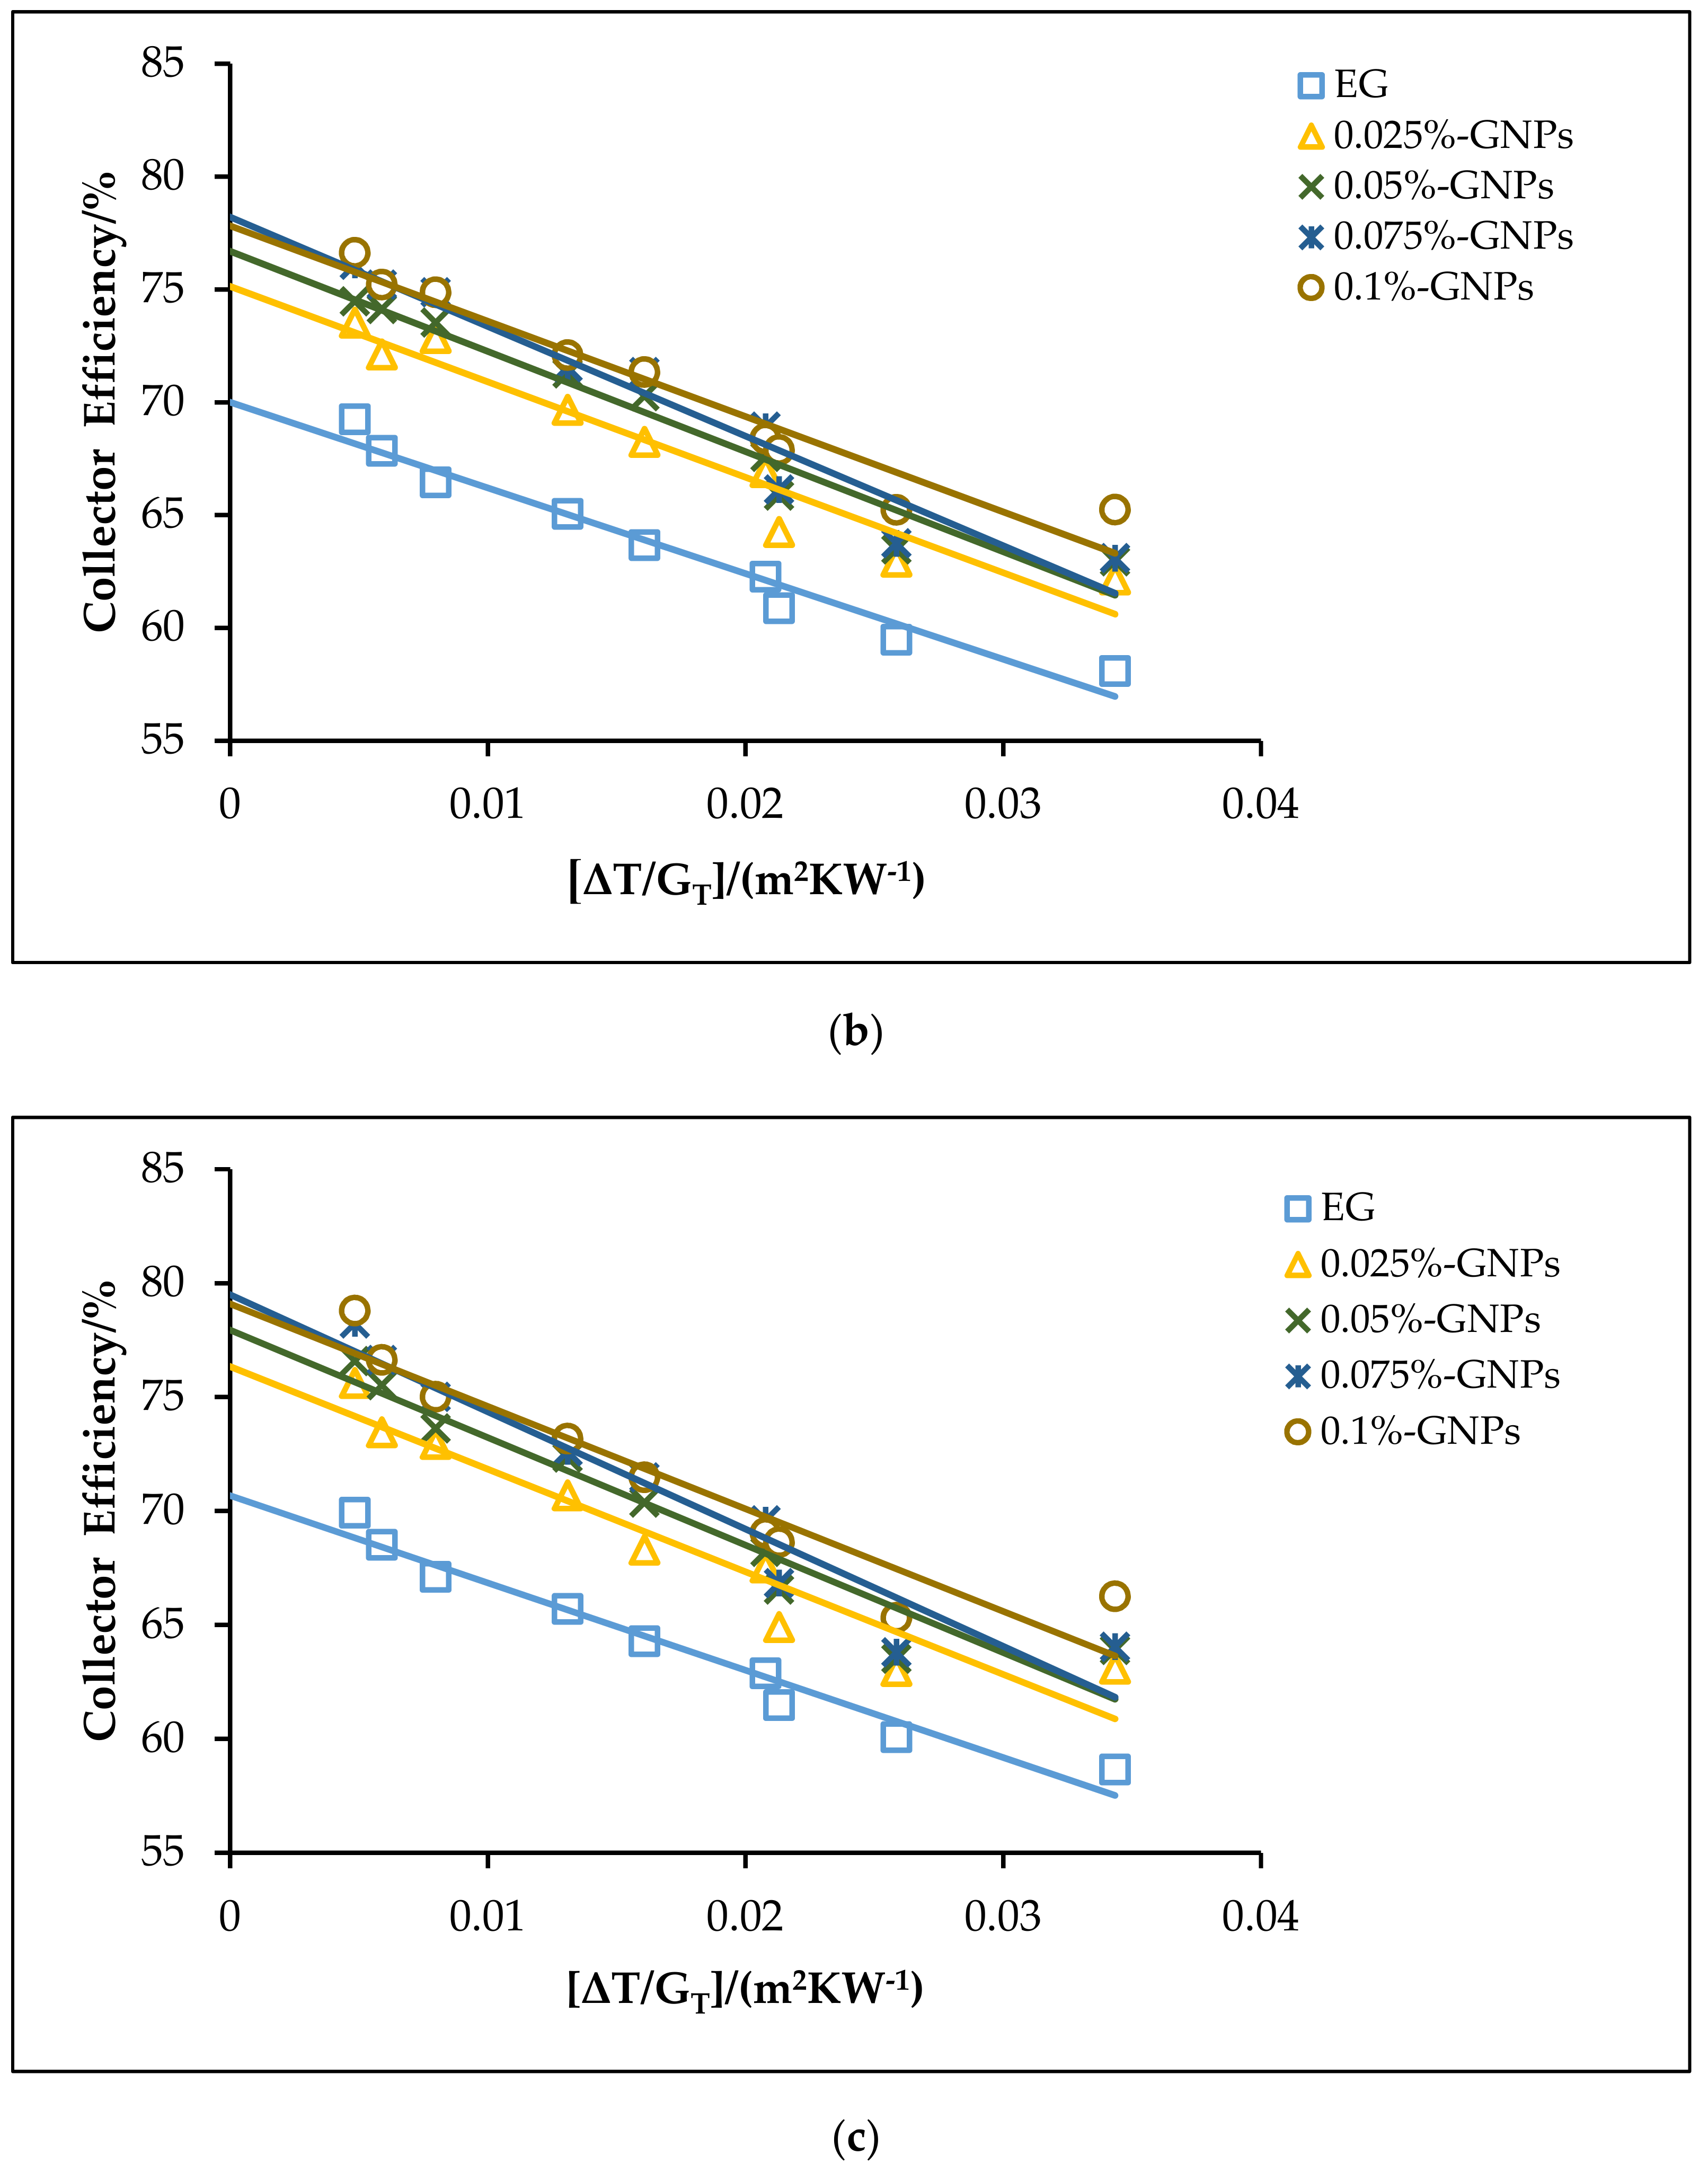
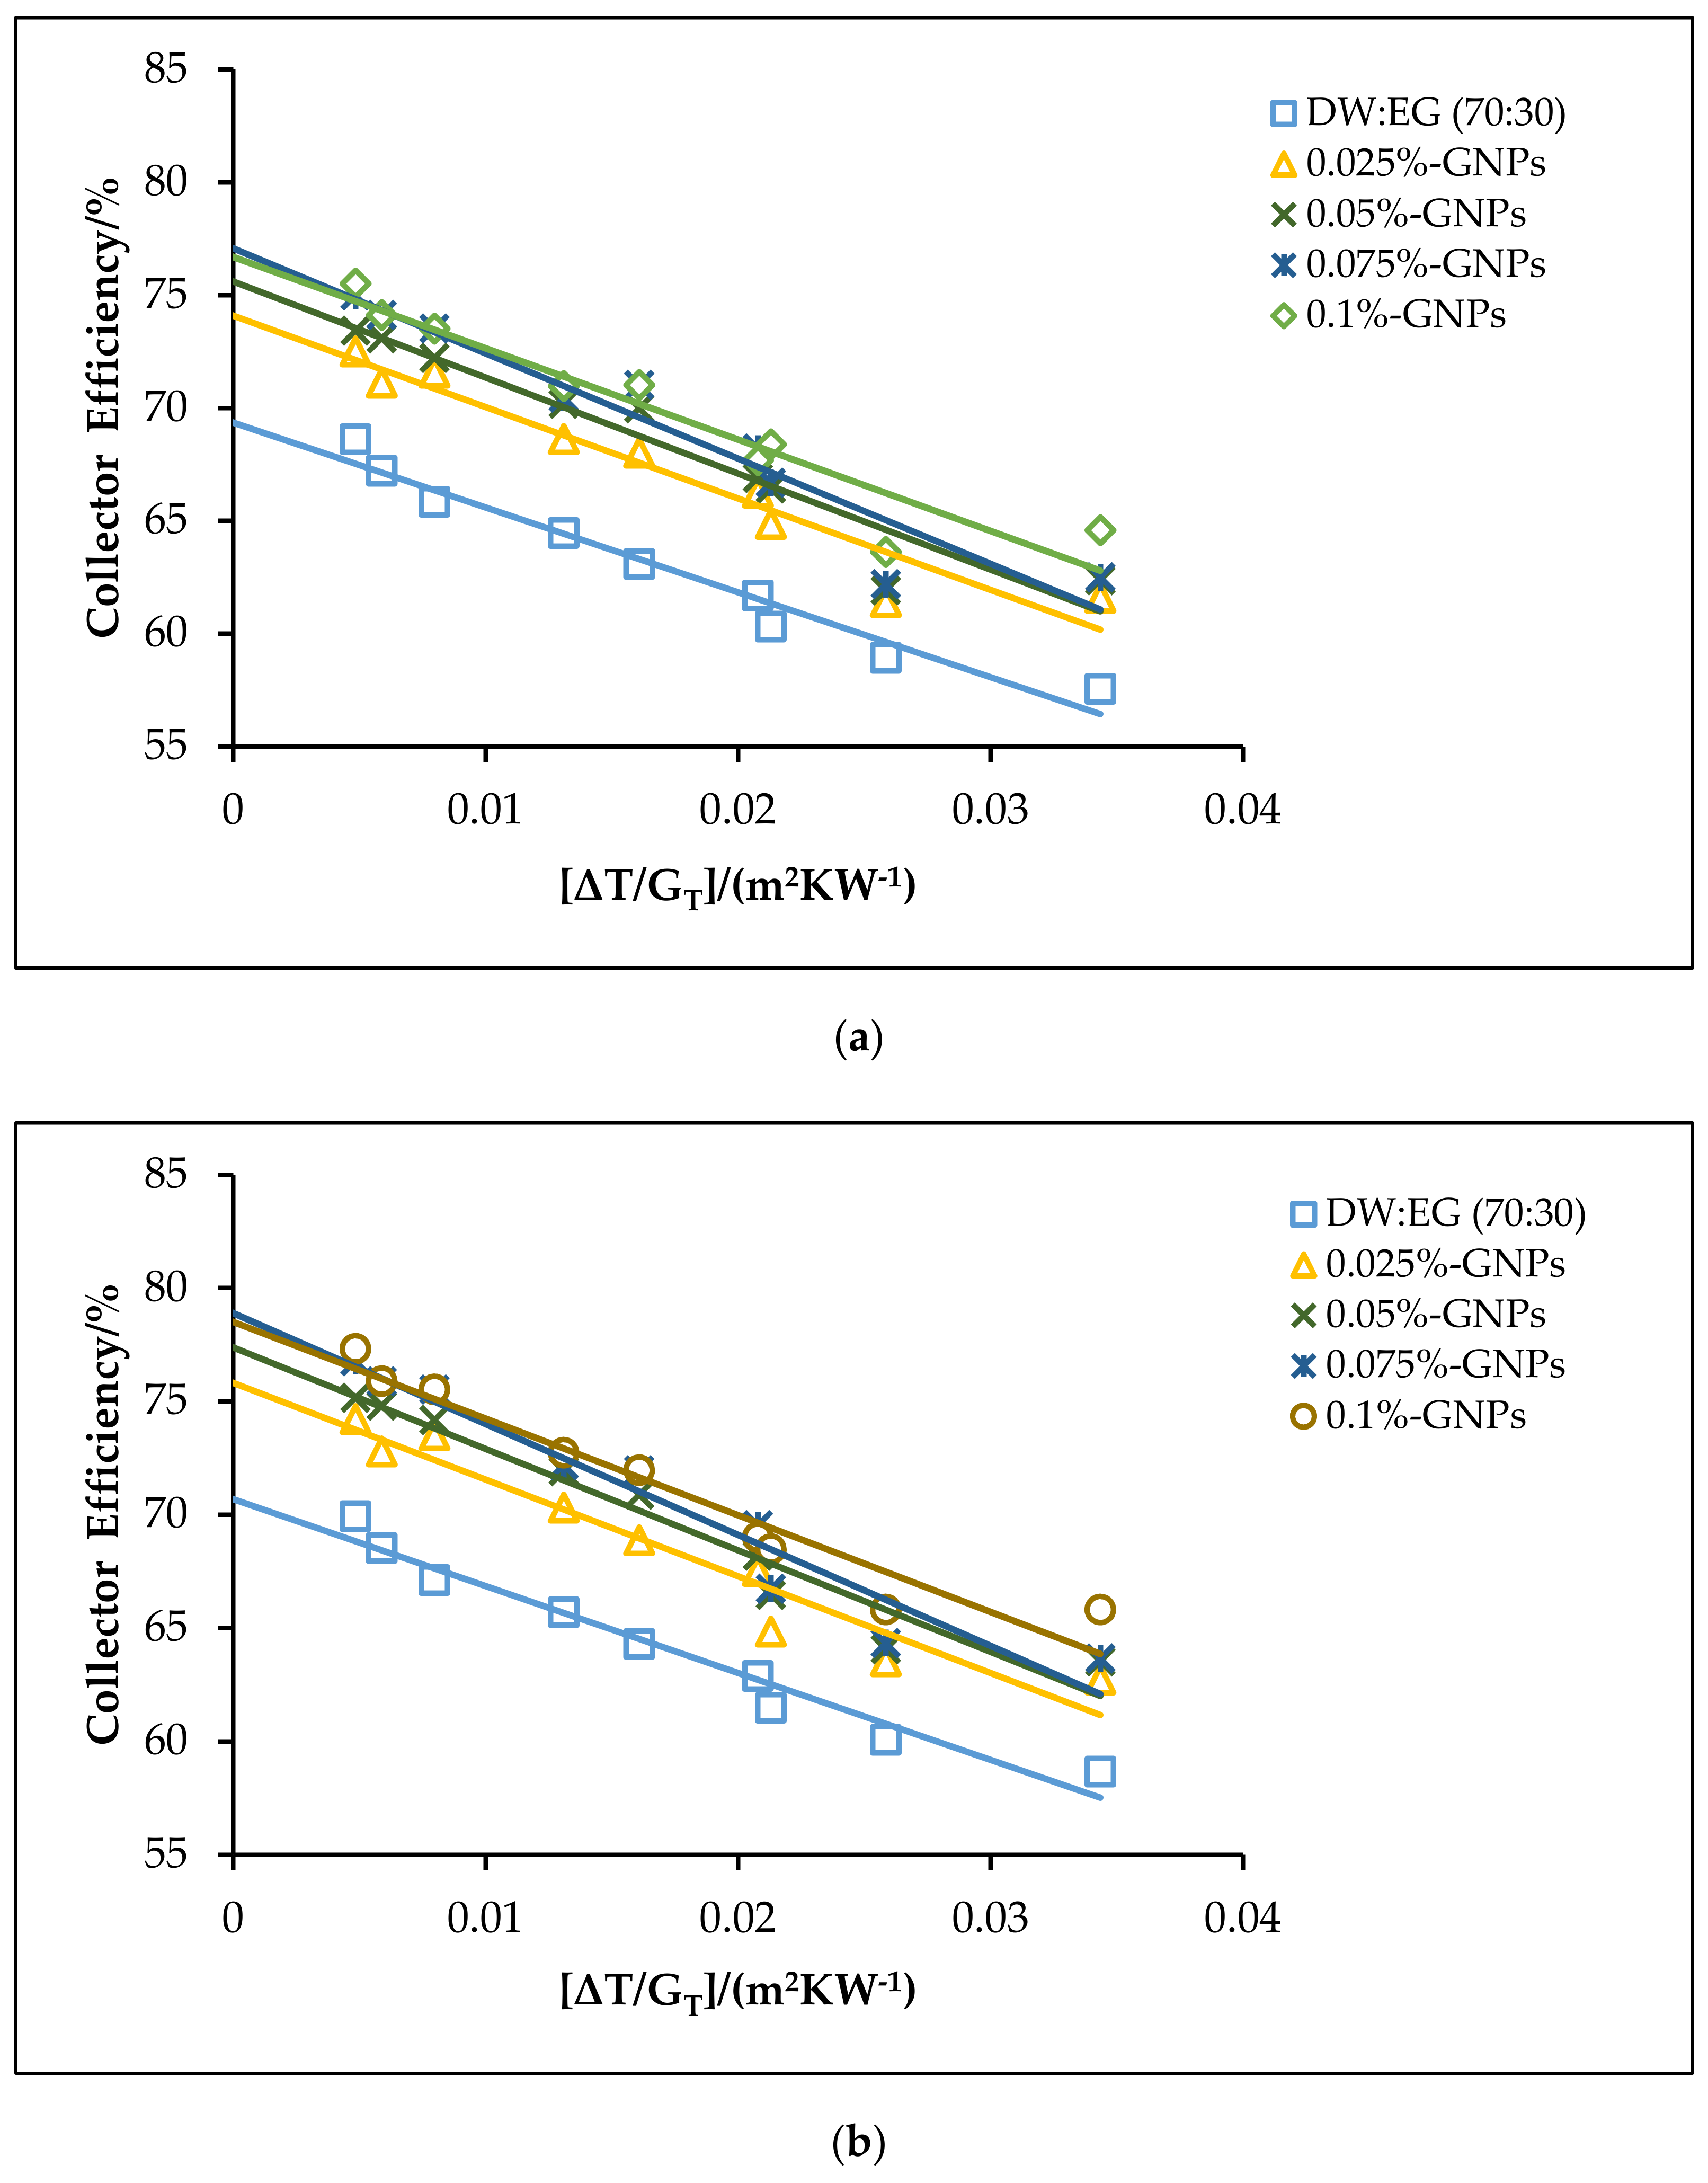
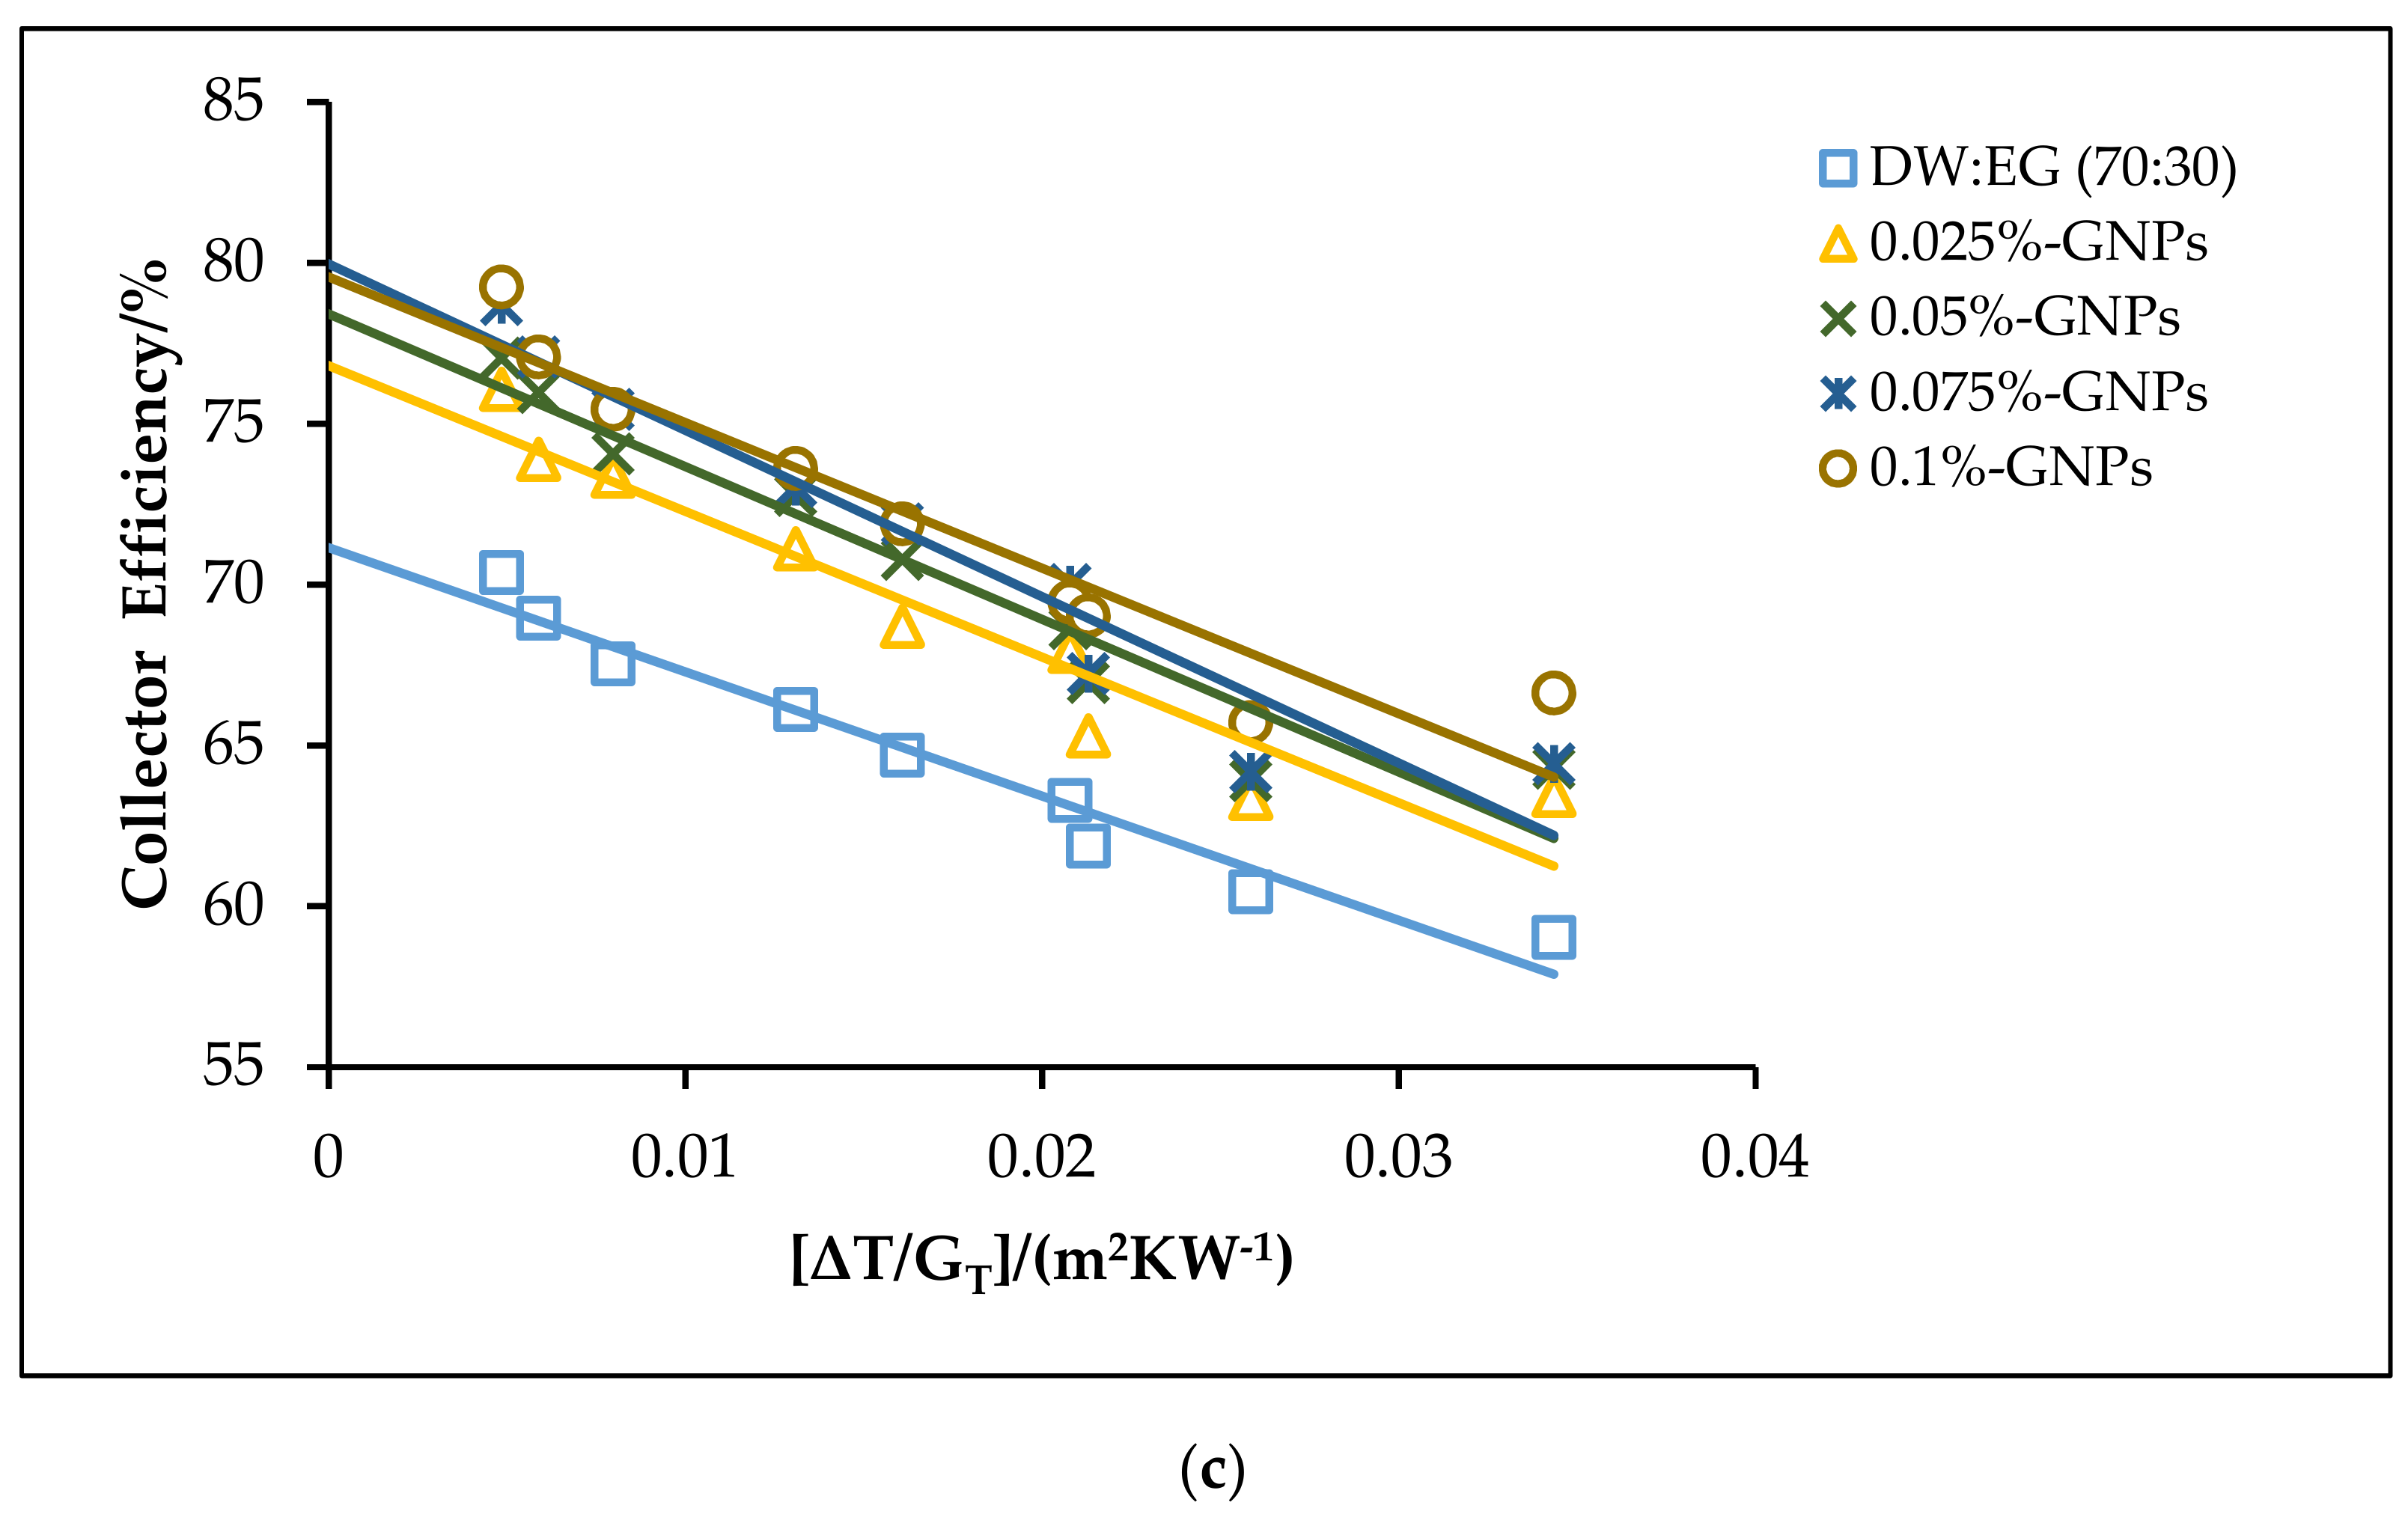
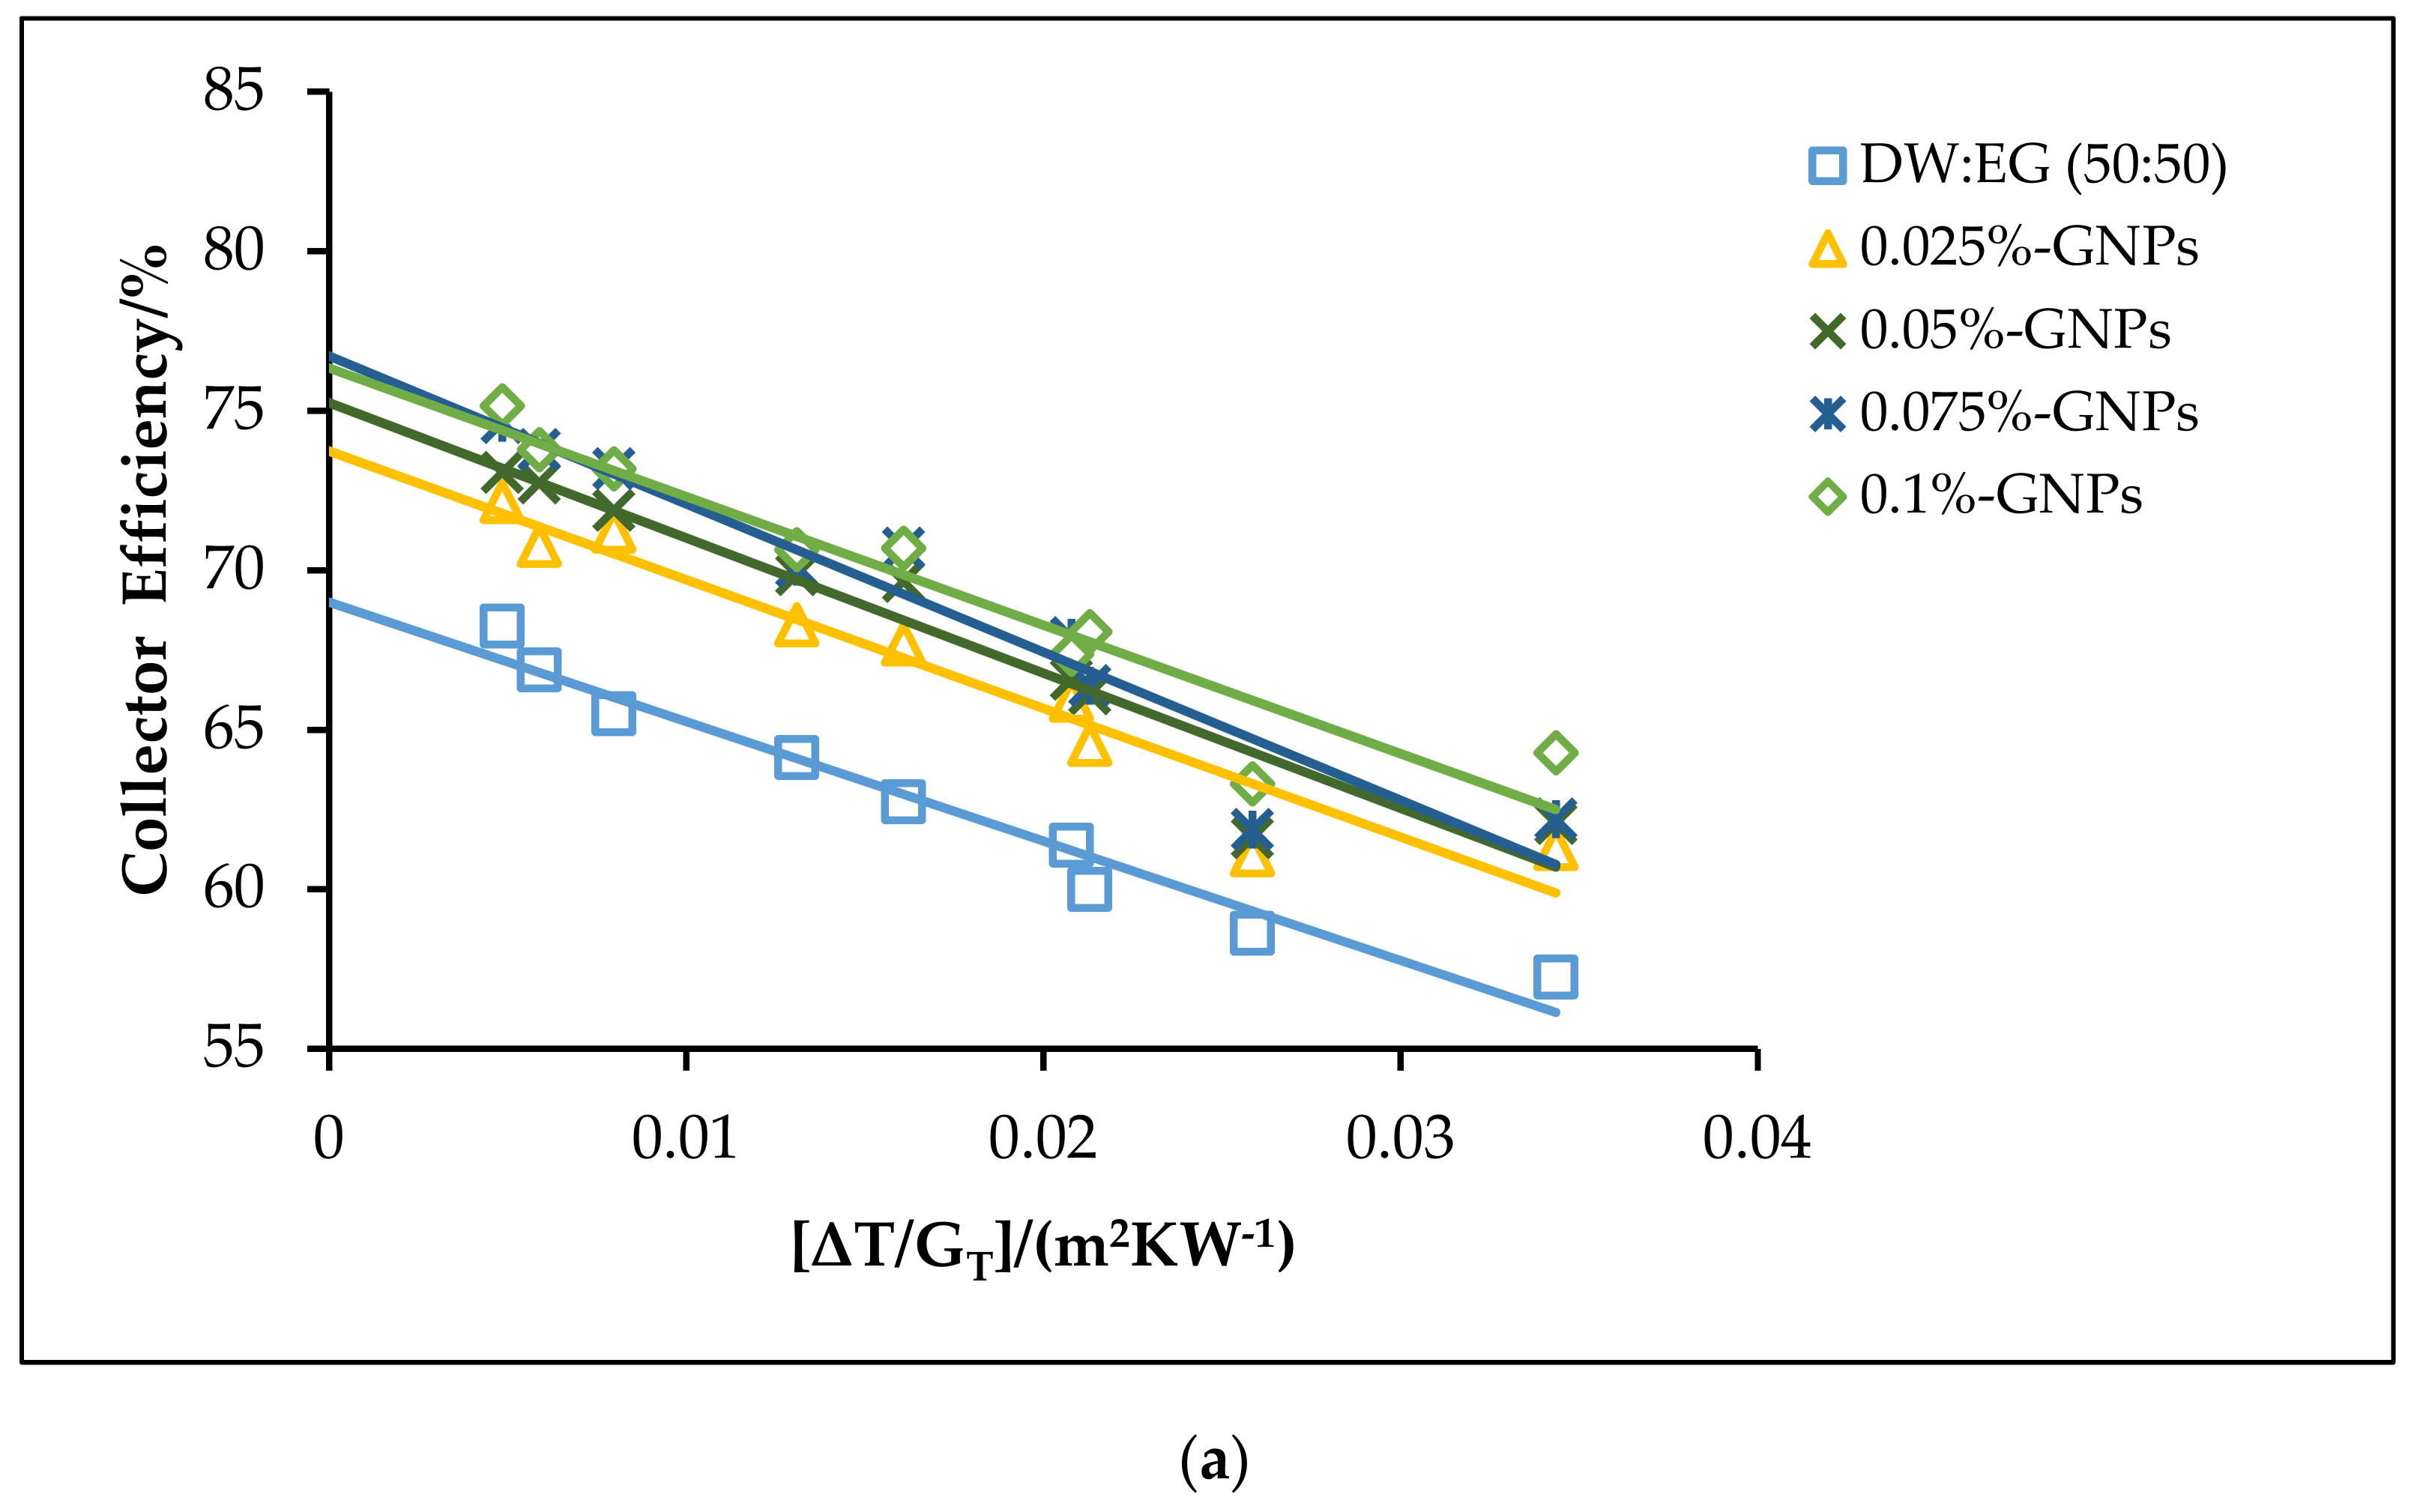
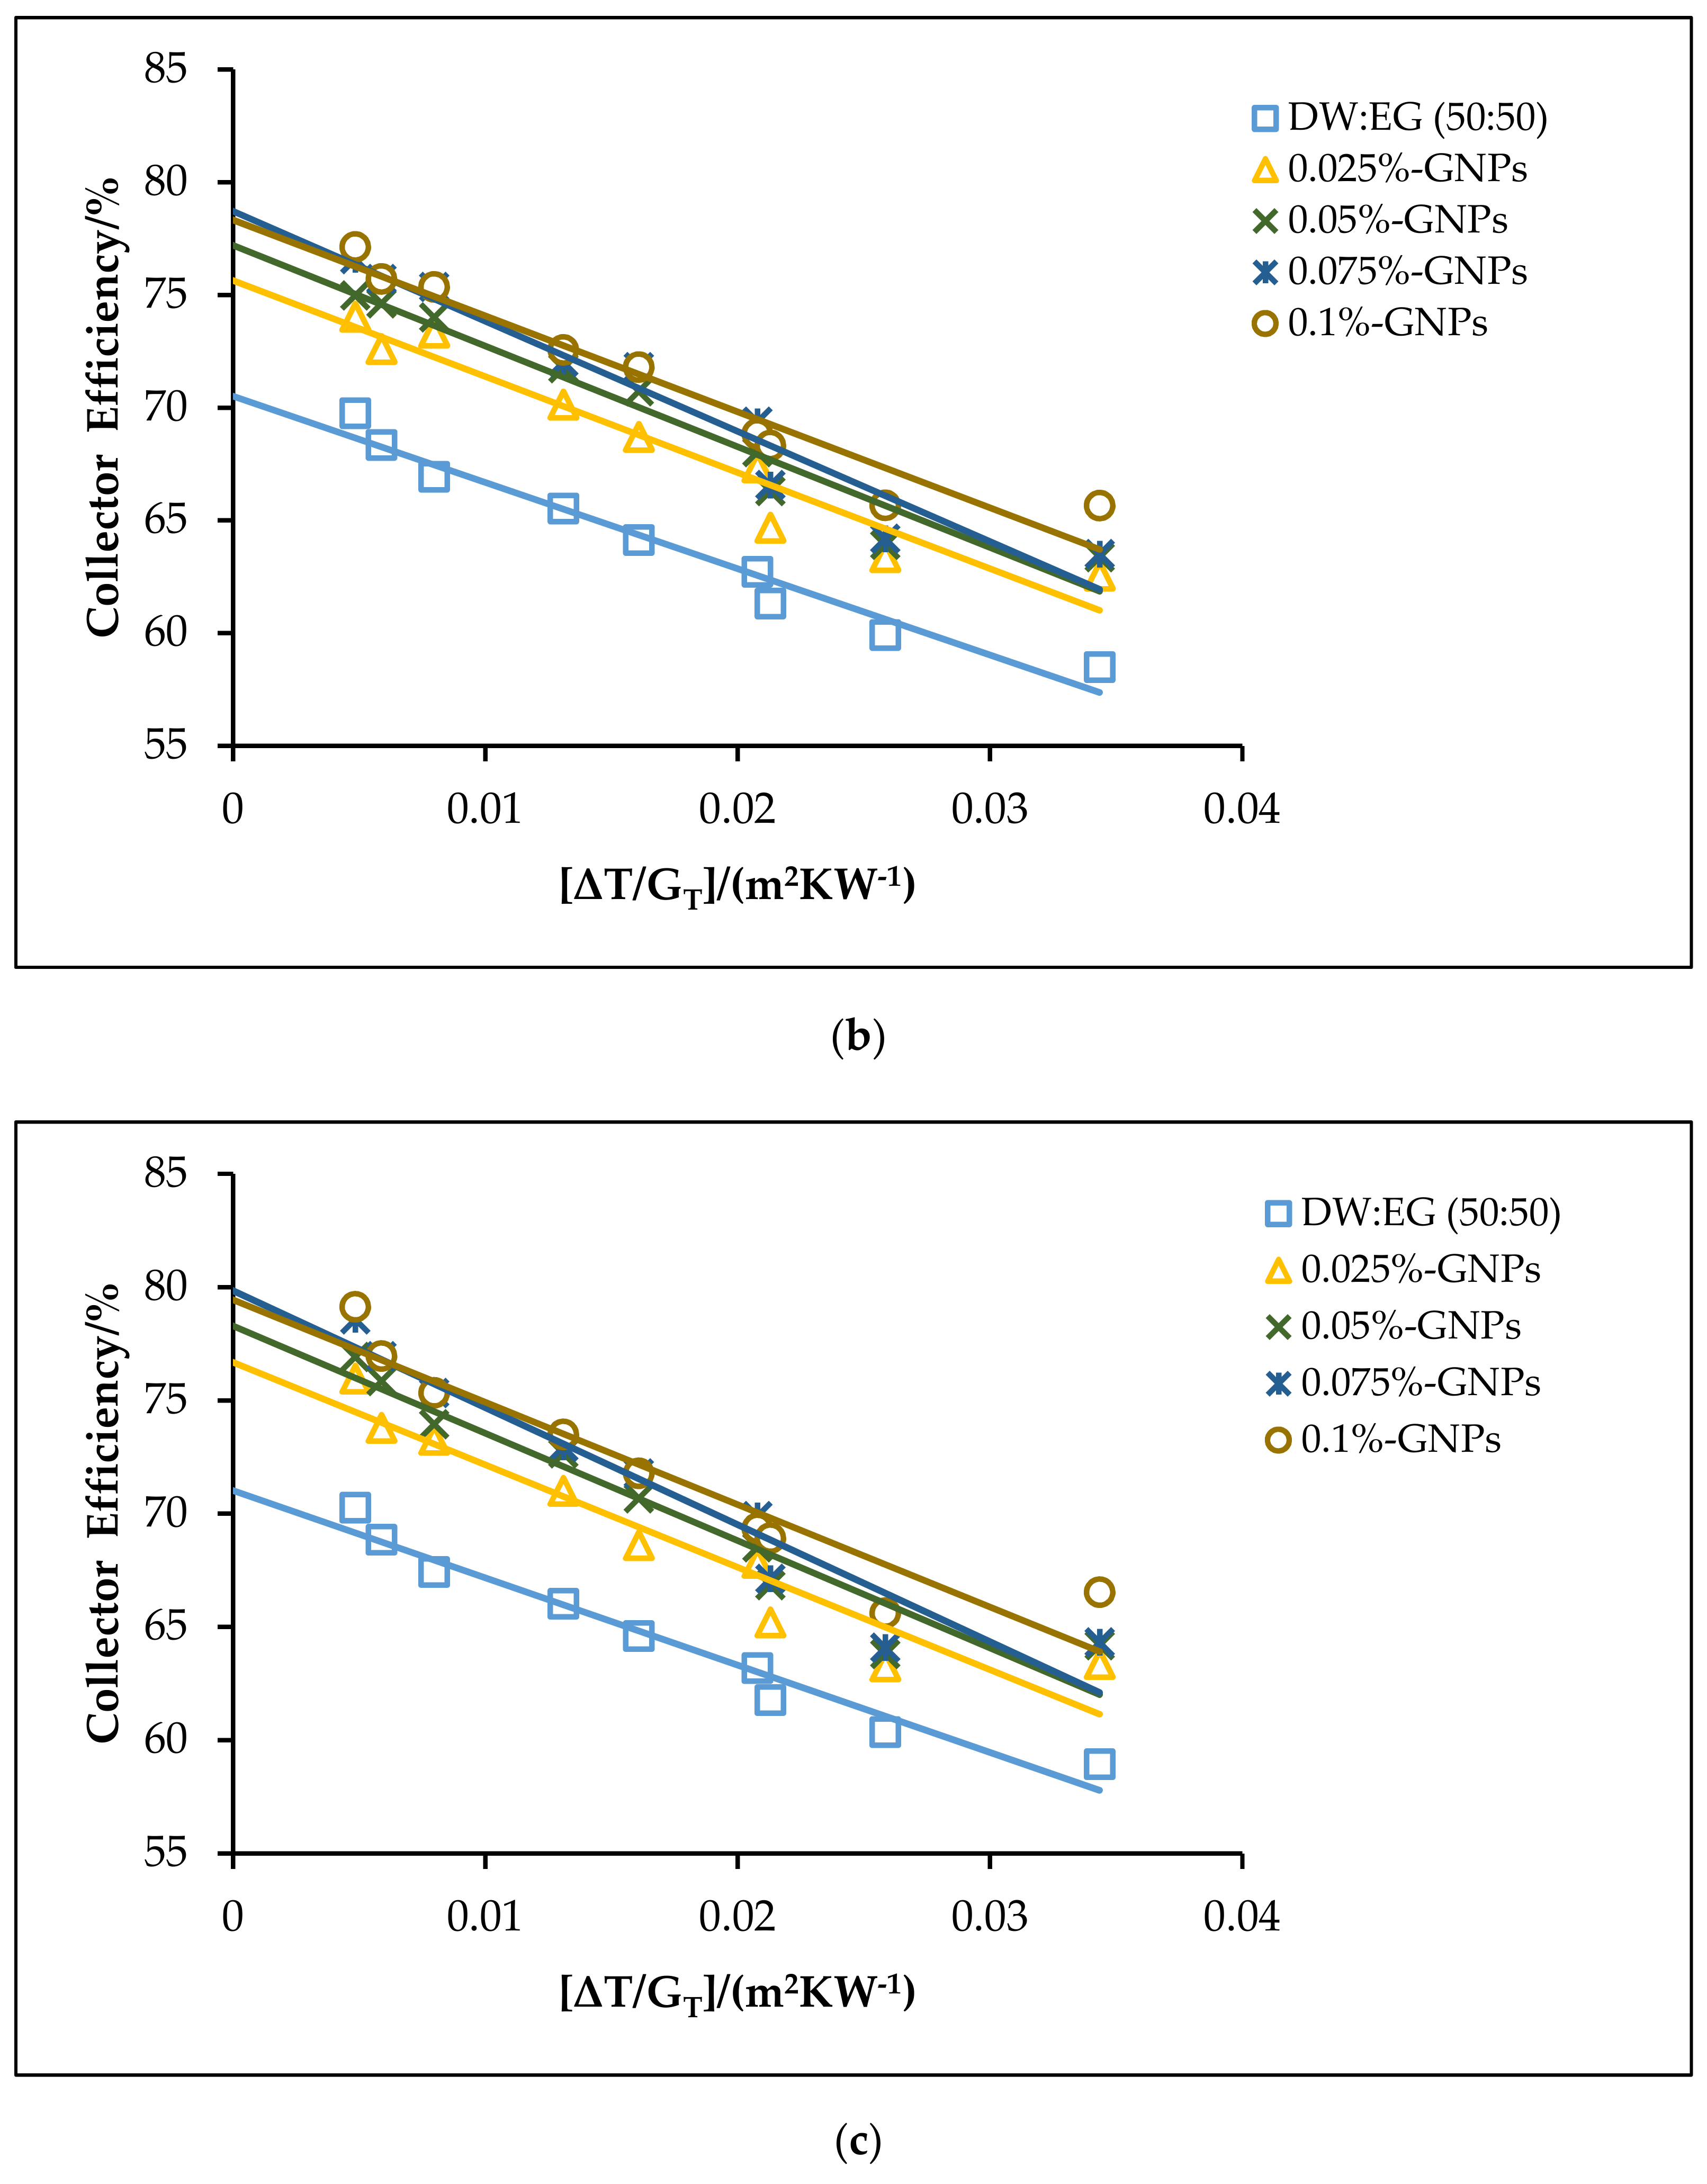
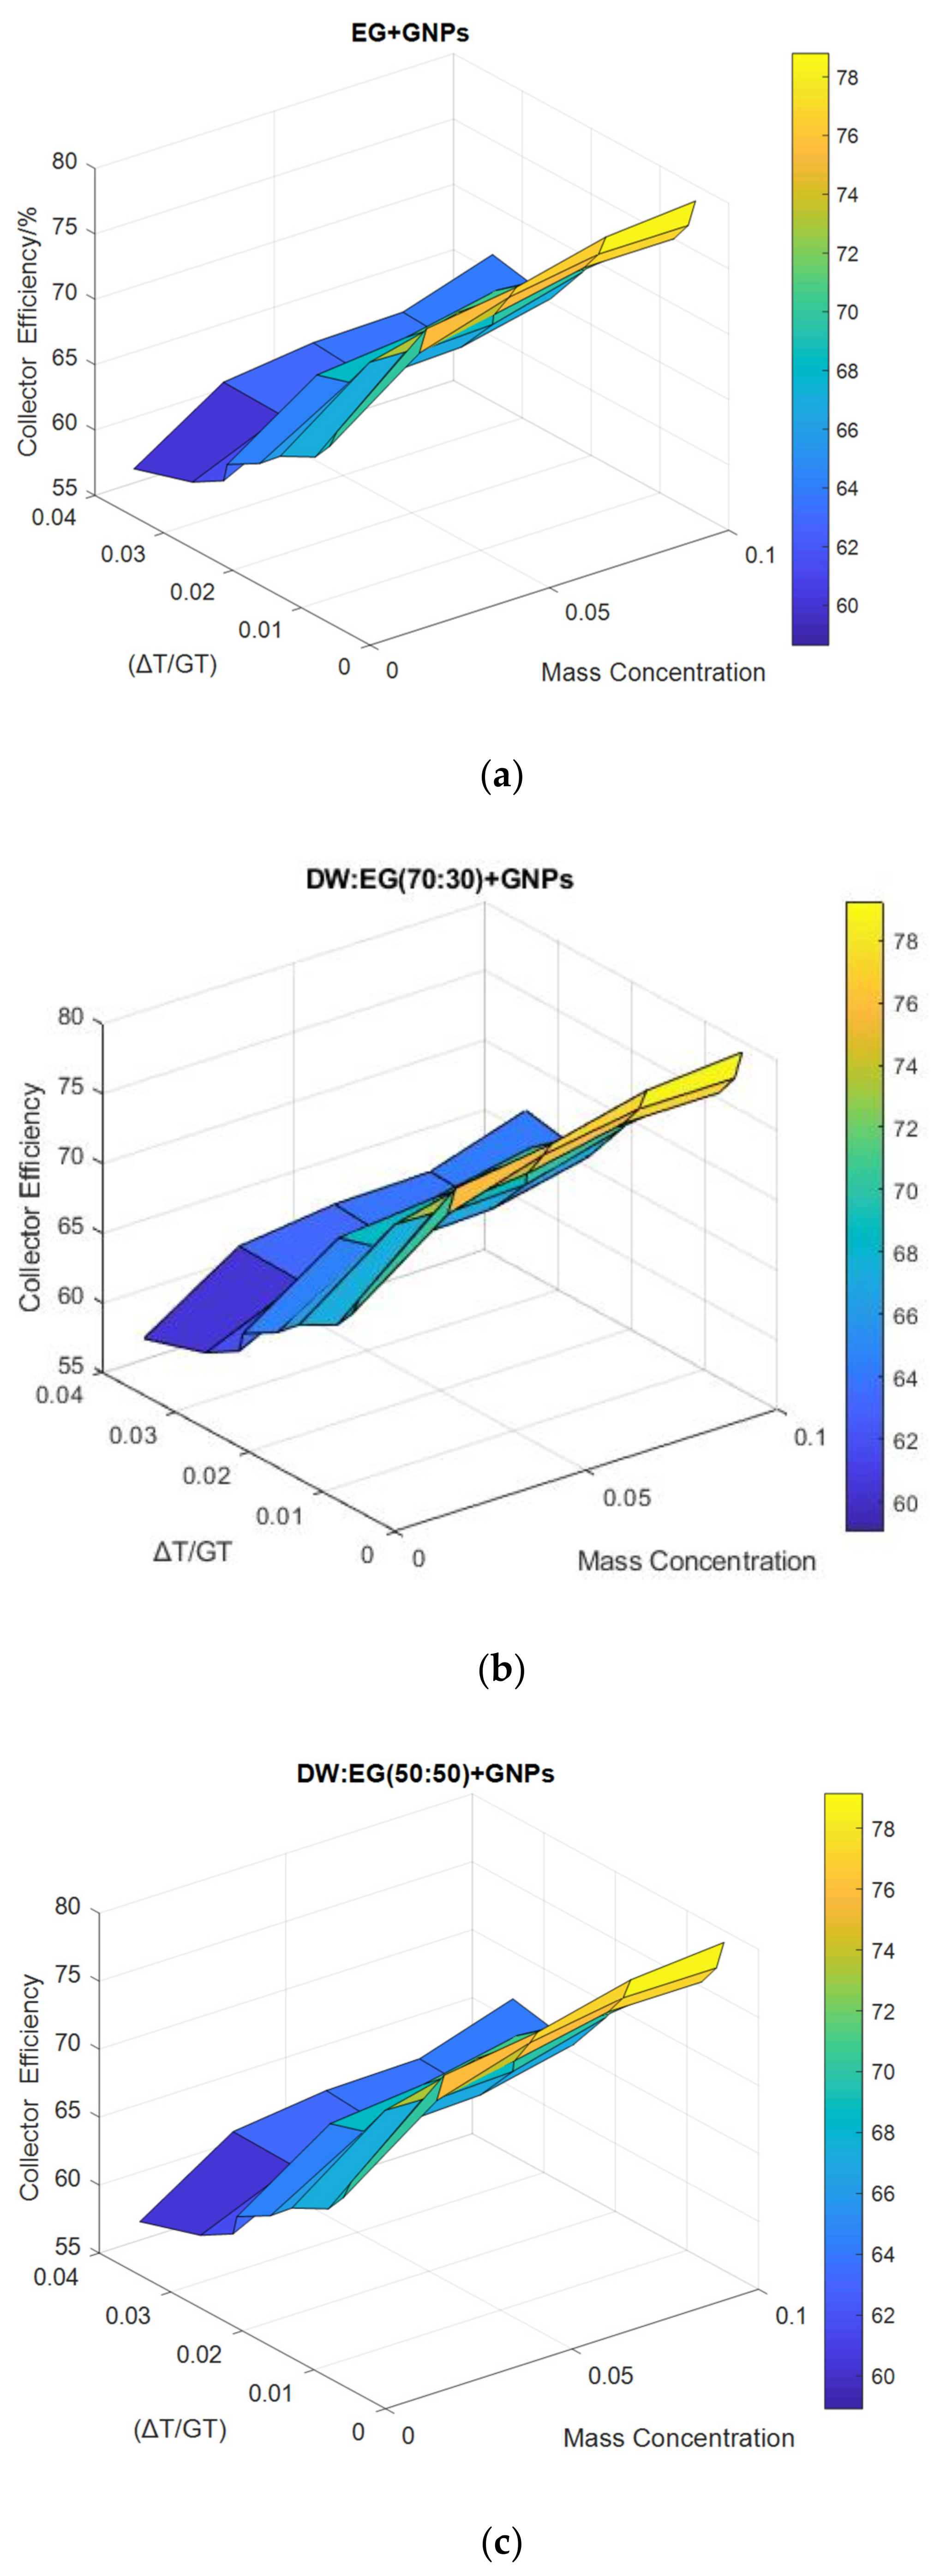
3.3. Thermal Performance of Nanofluids

The effects of using the f-GNPs nanofluids with multiple weight fractions (0.025, 0.05%, 0.075%, and 0.1%) wt % as HTFs within the FPSC system are shown in Figure 10, Figure 11, Figure 12 and Figure 13. Zero-loss efficiency enhancements at a flow rate of 0.5 kg min−1 were 5.81%, 7.16%, 9.49%, and 10.26%, respectively, and the enhancements at a flow rate of 1 kg min−1 were 6.19%, 7.55%, 9.88%, and 10.65%, respectively, for the f-GNPs-EG nanofluids in the case of multiple weight concentrations (herein the values of the weight concentrations being 0.025, 0.05%, 0.075%, and 0.1%) relative to the base fluid, as per Figure 10. The efficiency enhancements at a flow rate of 1.5 kg min−1 were 8.15%, 9.53%, 11.90%, 12.69% for the f-GNPs-EG nanofluids in the case of multiple weight concentrations, respectively. For DW:EG (70:30)-based f-GNPs nanofluids in the case of multiple weight concentrations, the efficiency enhancements at a flow rate of 0.5 kg min−1 were 5.70%, 7.03%, 9.31%, 10.06%, and the efficiency enhancements at a flow rate of 1 kg min−1 were 6.13%, 7.47%, 9.78%, and 10.55%, respectively, as can be seen in Figure 11. The enhancements at a flow rate of 1.5 kg min−1 were 8.09%, 9.46%, 11.82%, 12.60% for DW: EG (70:30) based f-GNPs nanofluids in the case of multiple weight concentrations, respectively. Finally, the enhancements at a flow rate of 0.5 kg min−1 are 5.73%, 7.06%, 9.35%, and 10.12% and the enhancements at a flow rate of 1 kg min−1 were 6.14%, 7.49%, 9.81%, and 10.58%, respectively, for the DW:EG (50:50)-based f-GNPs nanofluids in the case of multiple weight concentrations, respectively, as per Figure 12, while the enhancements at a flow rate of 1.5 kg min−1 were 8.11%, 9.48%, 11.84%, and 12.62% for the DW:EG (50:50)-based f-GNPs nanofluids in the case of multiple weight concentrations, respectively. These observations are in excellent agreement with the results reported in [39,40,41], where the higher flow rates of the f-GNPs resulted in the increased absorption of a heat flux, which enhanced the overall performance of the FPSC. Heat absorption was uniform via the fluid layer, when the f-GNPs flowed at a lower mass fraction, which means that the heat loss rate at the boundaries was lower than that in the case of a higher f-GNPs weight fraction. The majority of heat absorption occurred at the top layer of the nanofluid, resulting in a high-temperature region near the top wall, which increased heat losses and subsequently decreased the efficiency of the FPSC [42].
The heat gain (FR (τα)) and heat loss (FRUL) coefficients are listed in Table 2, Table 3 and Table 4, and the values are in a good agreement with those reported in [43,44,45] on the increase of the (FR (τα)) and (FRUL) factors of the f-GNPs nanofluids. At a flow rate of 1.5 kg min−1 and concentrations of 0.025–0.1 wt %, the heat gain parameter for EG increased by 8.01%, 10.28%, 11.91%, and 12.48%, respectively (Table 2), while the heat losses increased by 17.38%, 17.47%, 23.11%, and 34.25% at a flow rate of 1.5 kg min−1 and a NPs’ concentration of 0.025 to 0.1 wt %. Moreover, it can be seen in Table 3 that the flow of the f-GNPs at 1.5 kg min−1 and NPs concentration of 0.025 to 0.1 wt % increased the FR (τα) of DW:EG (70:30) by 7.96%, 10.21%, 11.83%, and 12.40%, respectively, and the corresponding values of FRUL improved by 17.26%, 17.35%, 22.95%, and 34.01%, respectively, at similar operating conditions. Finally, Table 4 shows that the heat gains for DW:EG (50:50) at a flow rate of 1.5 kg min−1 and f-GNPs concentrations of 0.025 to 0.1 wt % increased by 7.97%, 10.23%, 11.85%, and 12.42%, respectively, while the respective values of the heat loss parameter increased by 17.30%, 17.39%, 22.99%, and 34.08% at 1.5 kg min−1 and NPs concentrations of 0.025 to 0.1 wt %.

4. Conclusions

This study discussed the development of well-dispersed graphene nanoplatelets (f-GNPs) for the analytical assessment of the impact of utilizing nano-coolants as absorbing mediums upon the energy efficiency of an FPSC. The covalent functionalization approach’s effectiveness was determined using HR-TEM and SEM. The effects of many variables were elucidated during the analyses, encompassing base fluids, weight concentrations, fluid flow rates, input fluid temperatures, and input heat rates. The analysis leads to the following conclusions:
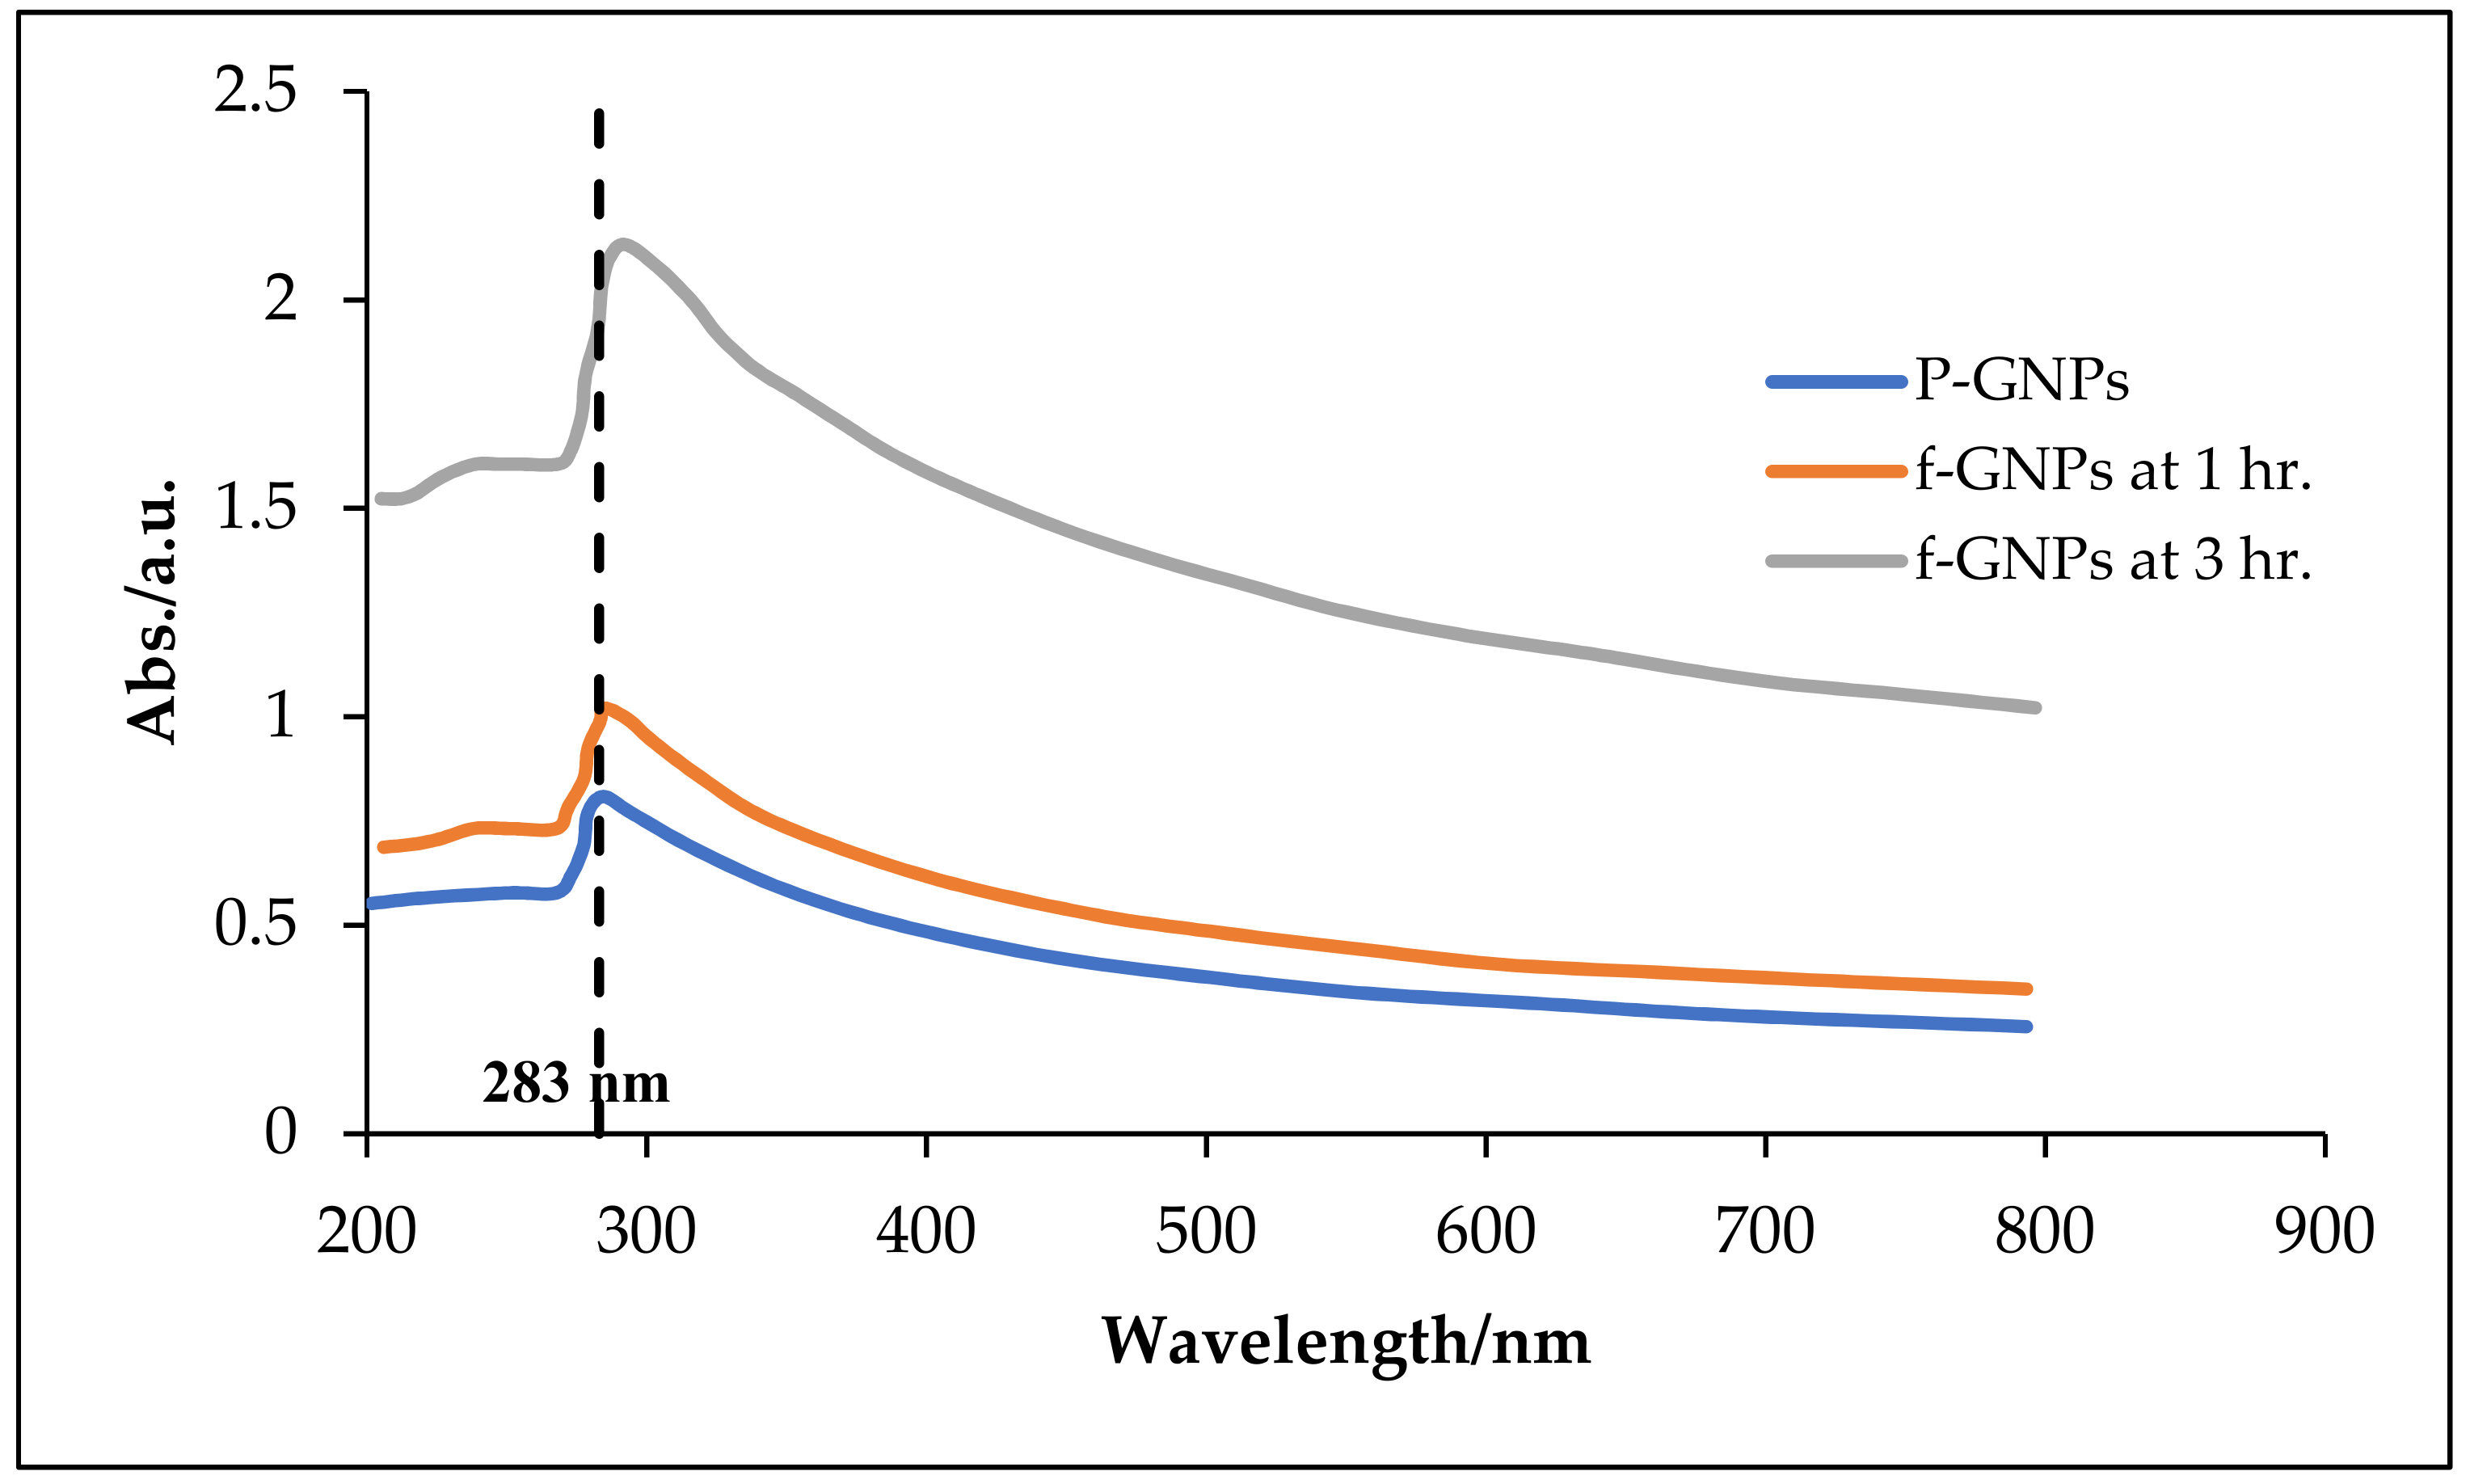
  • The UV–VIS spectra showed a sharp absorption peak at a wavelength of ~283. In the temperature range of 500–800 °C, f-GNPs suffered from a weight loss of nearly 24%, which was attributable to the breakdown of the air’s graphitic carbon nanostructures.
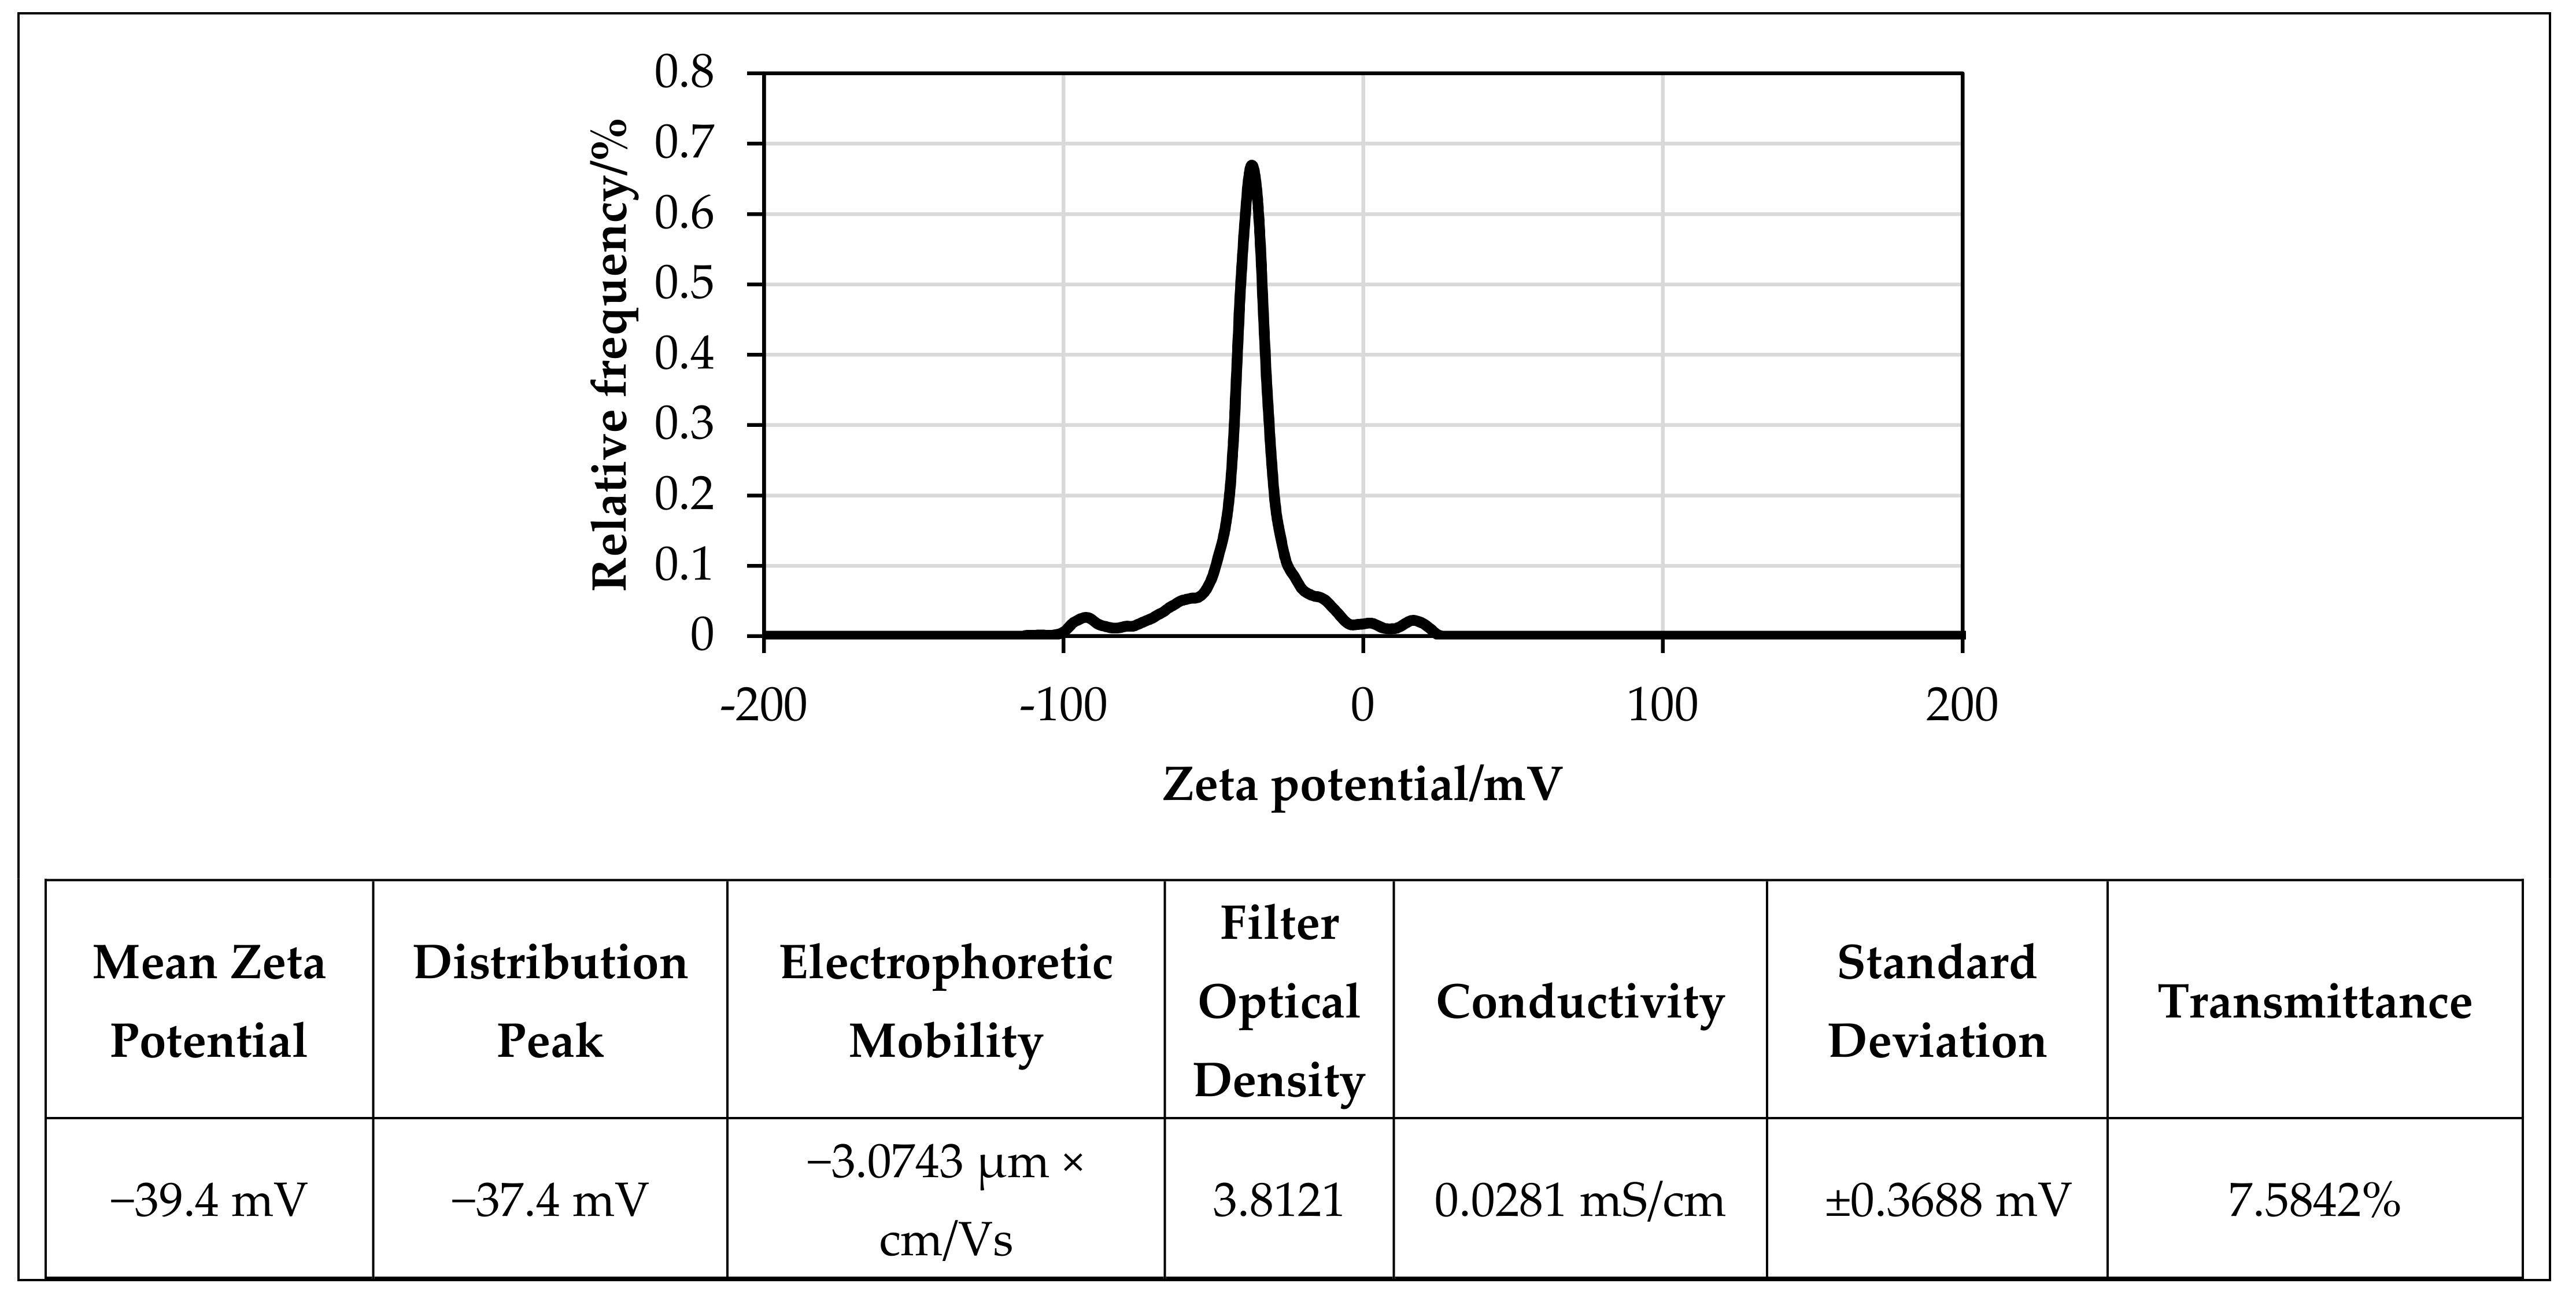
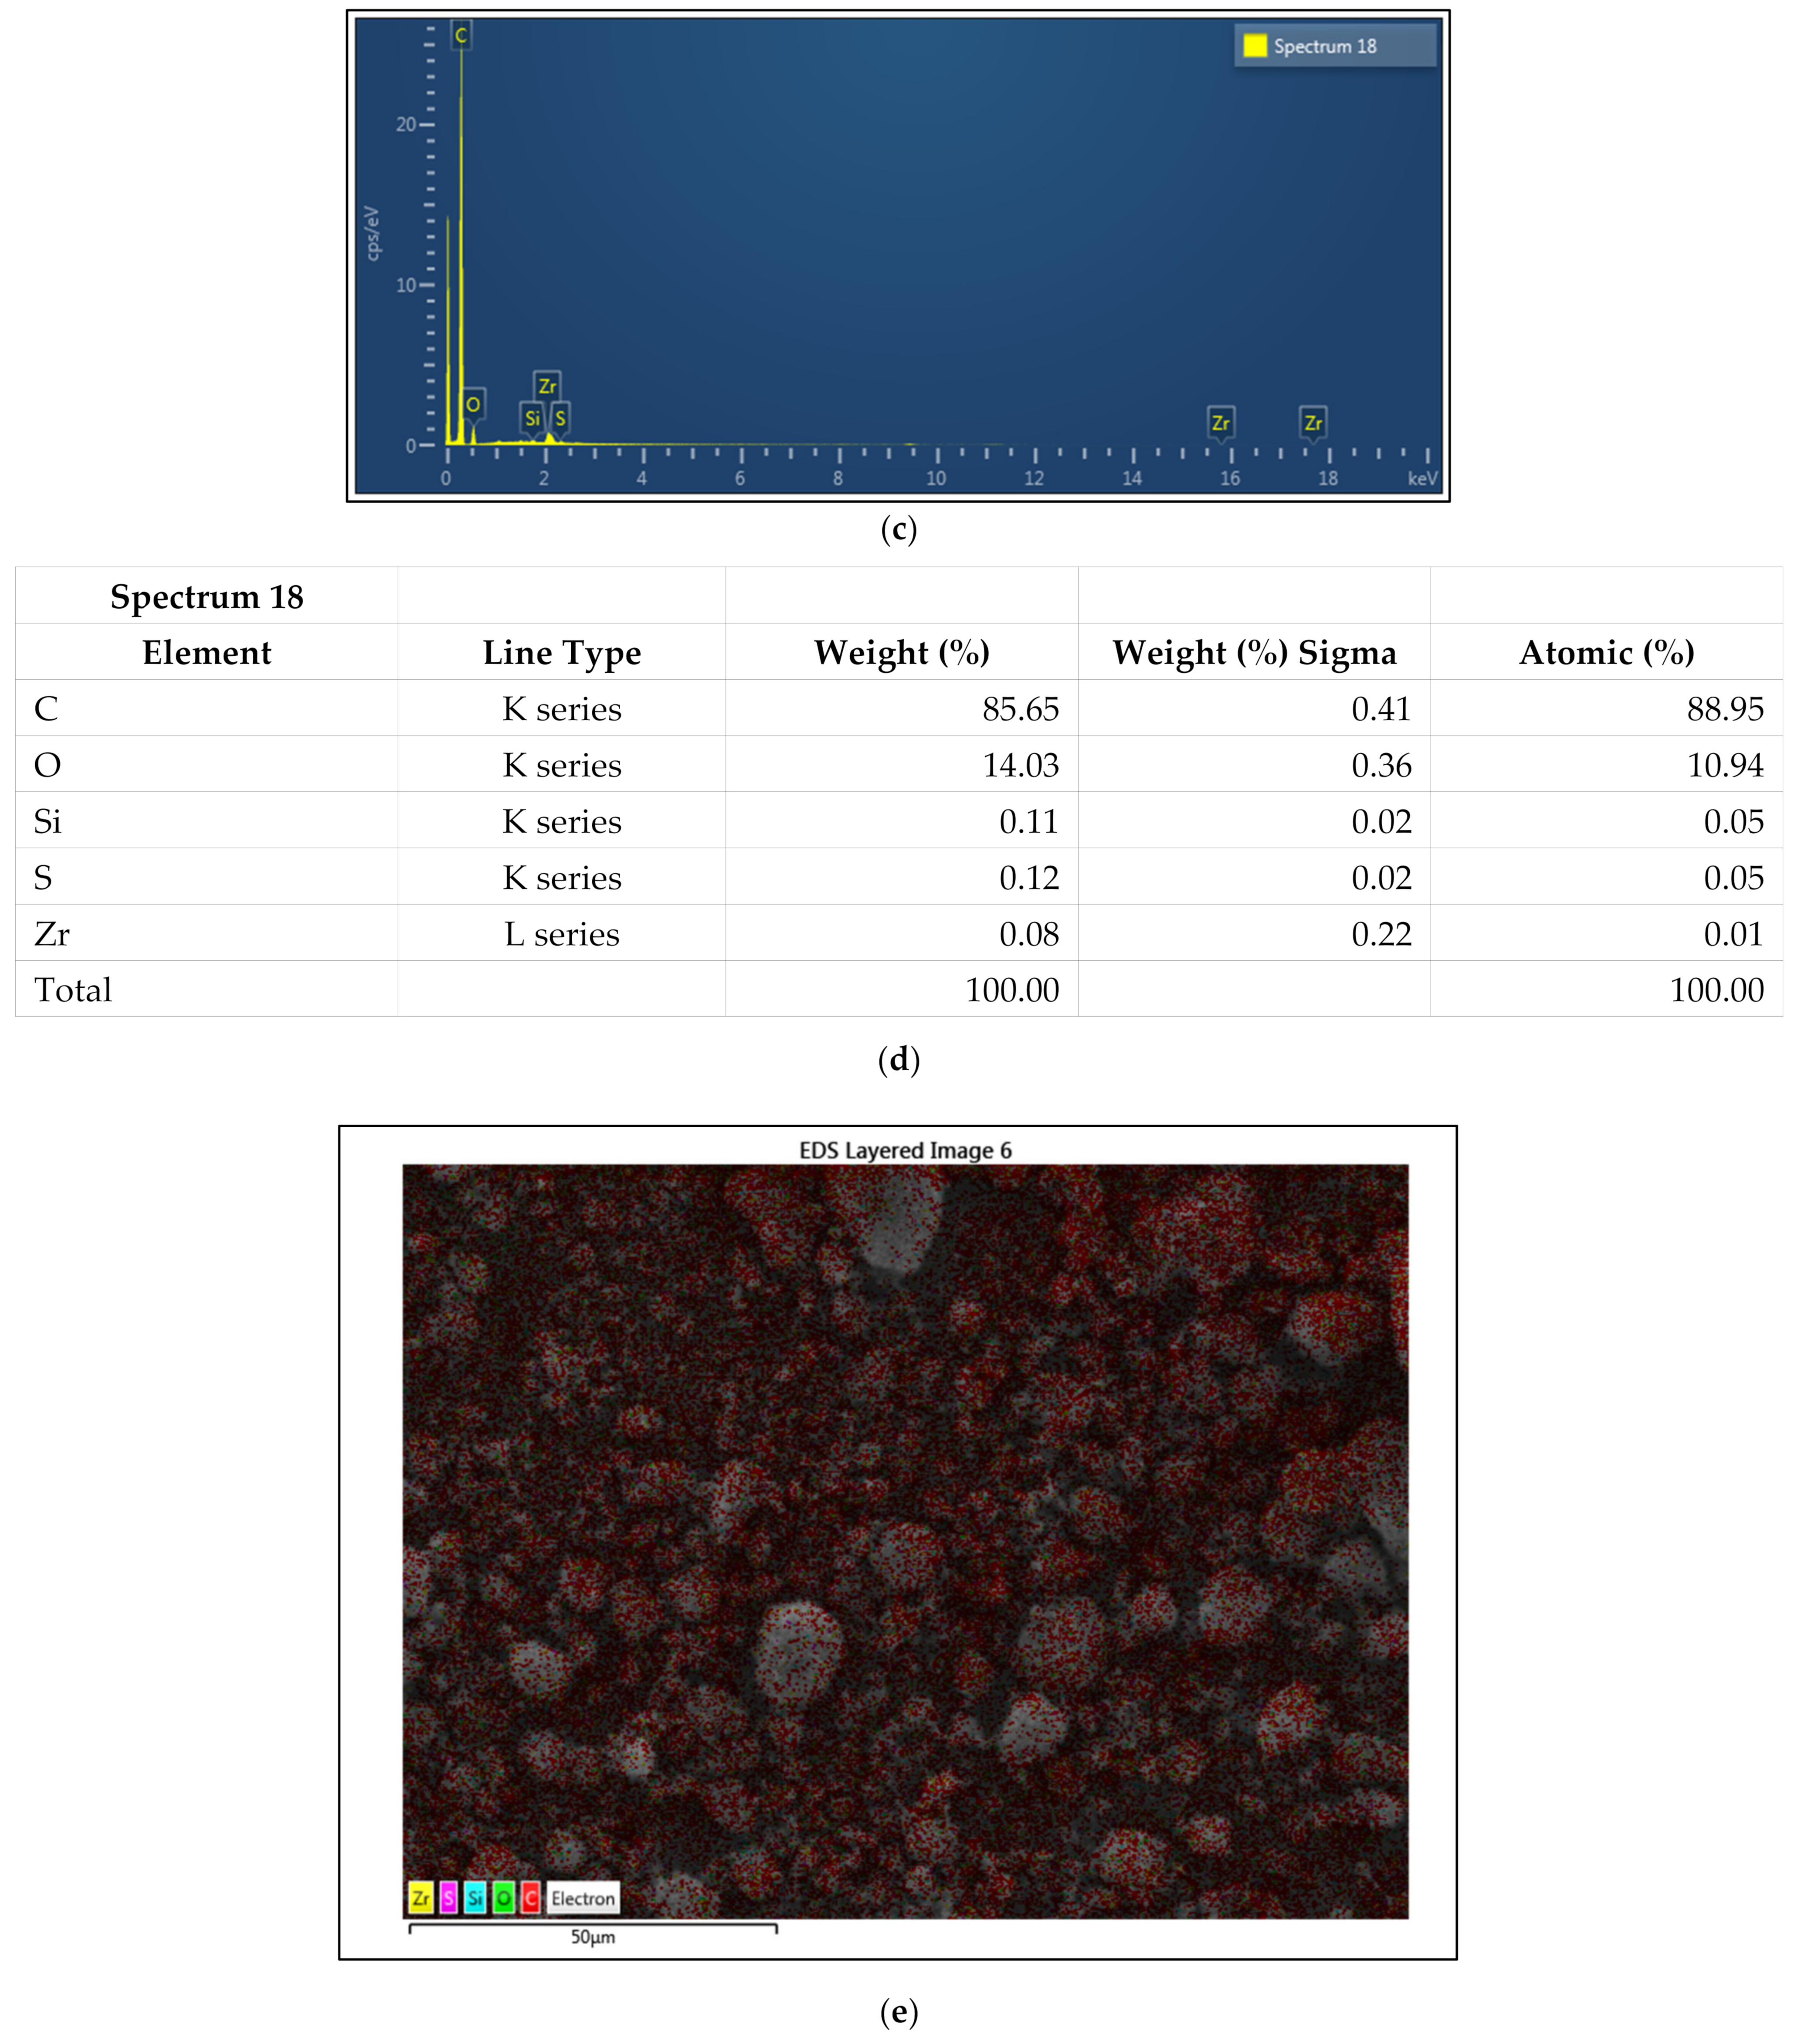
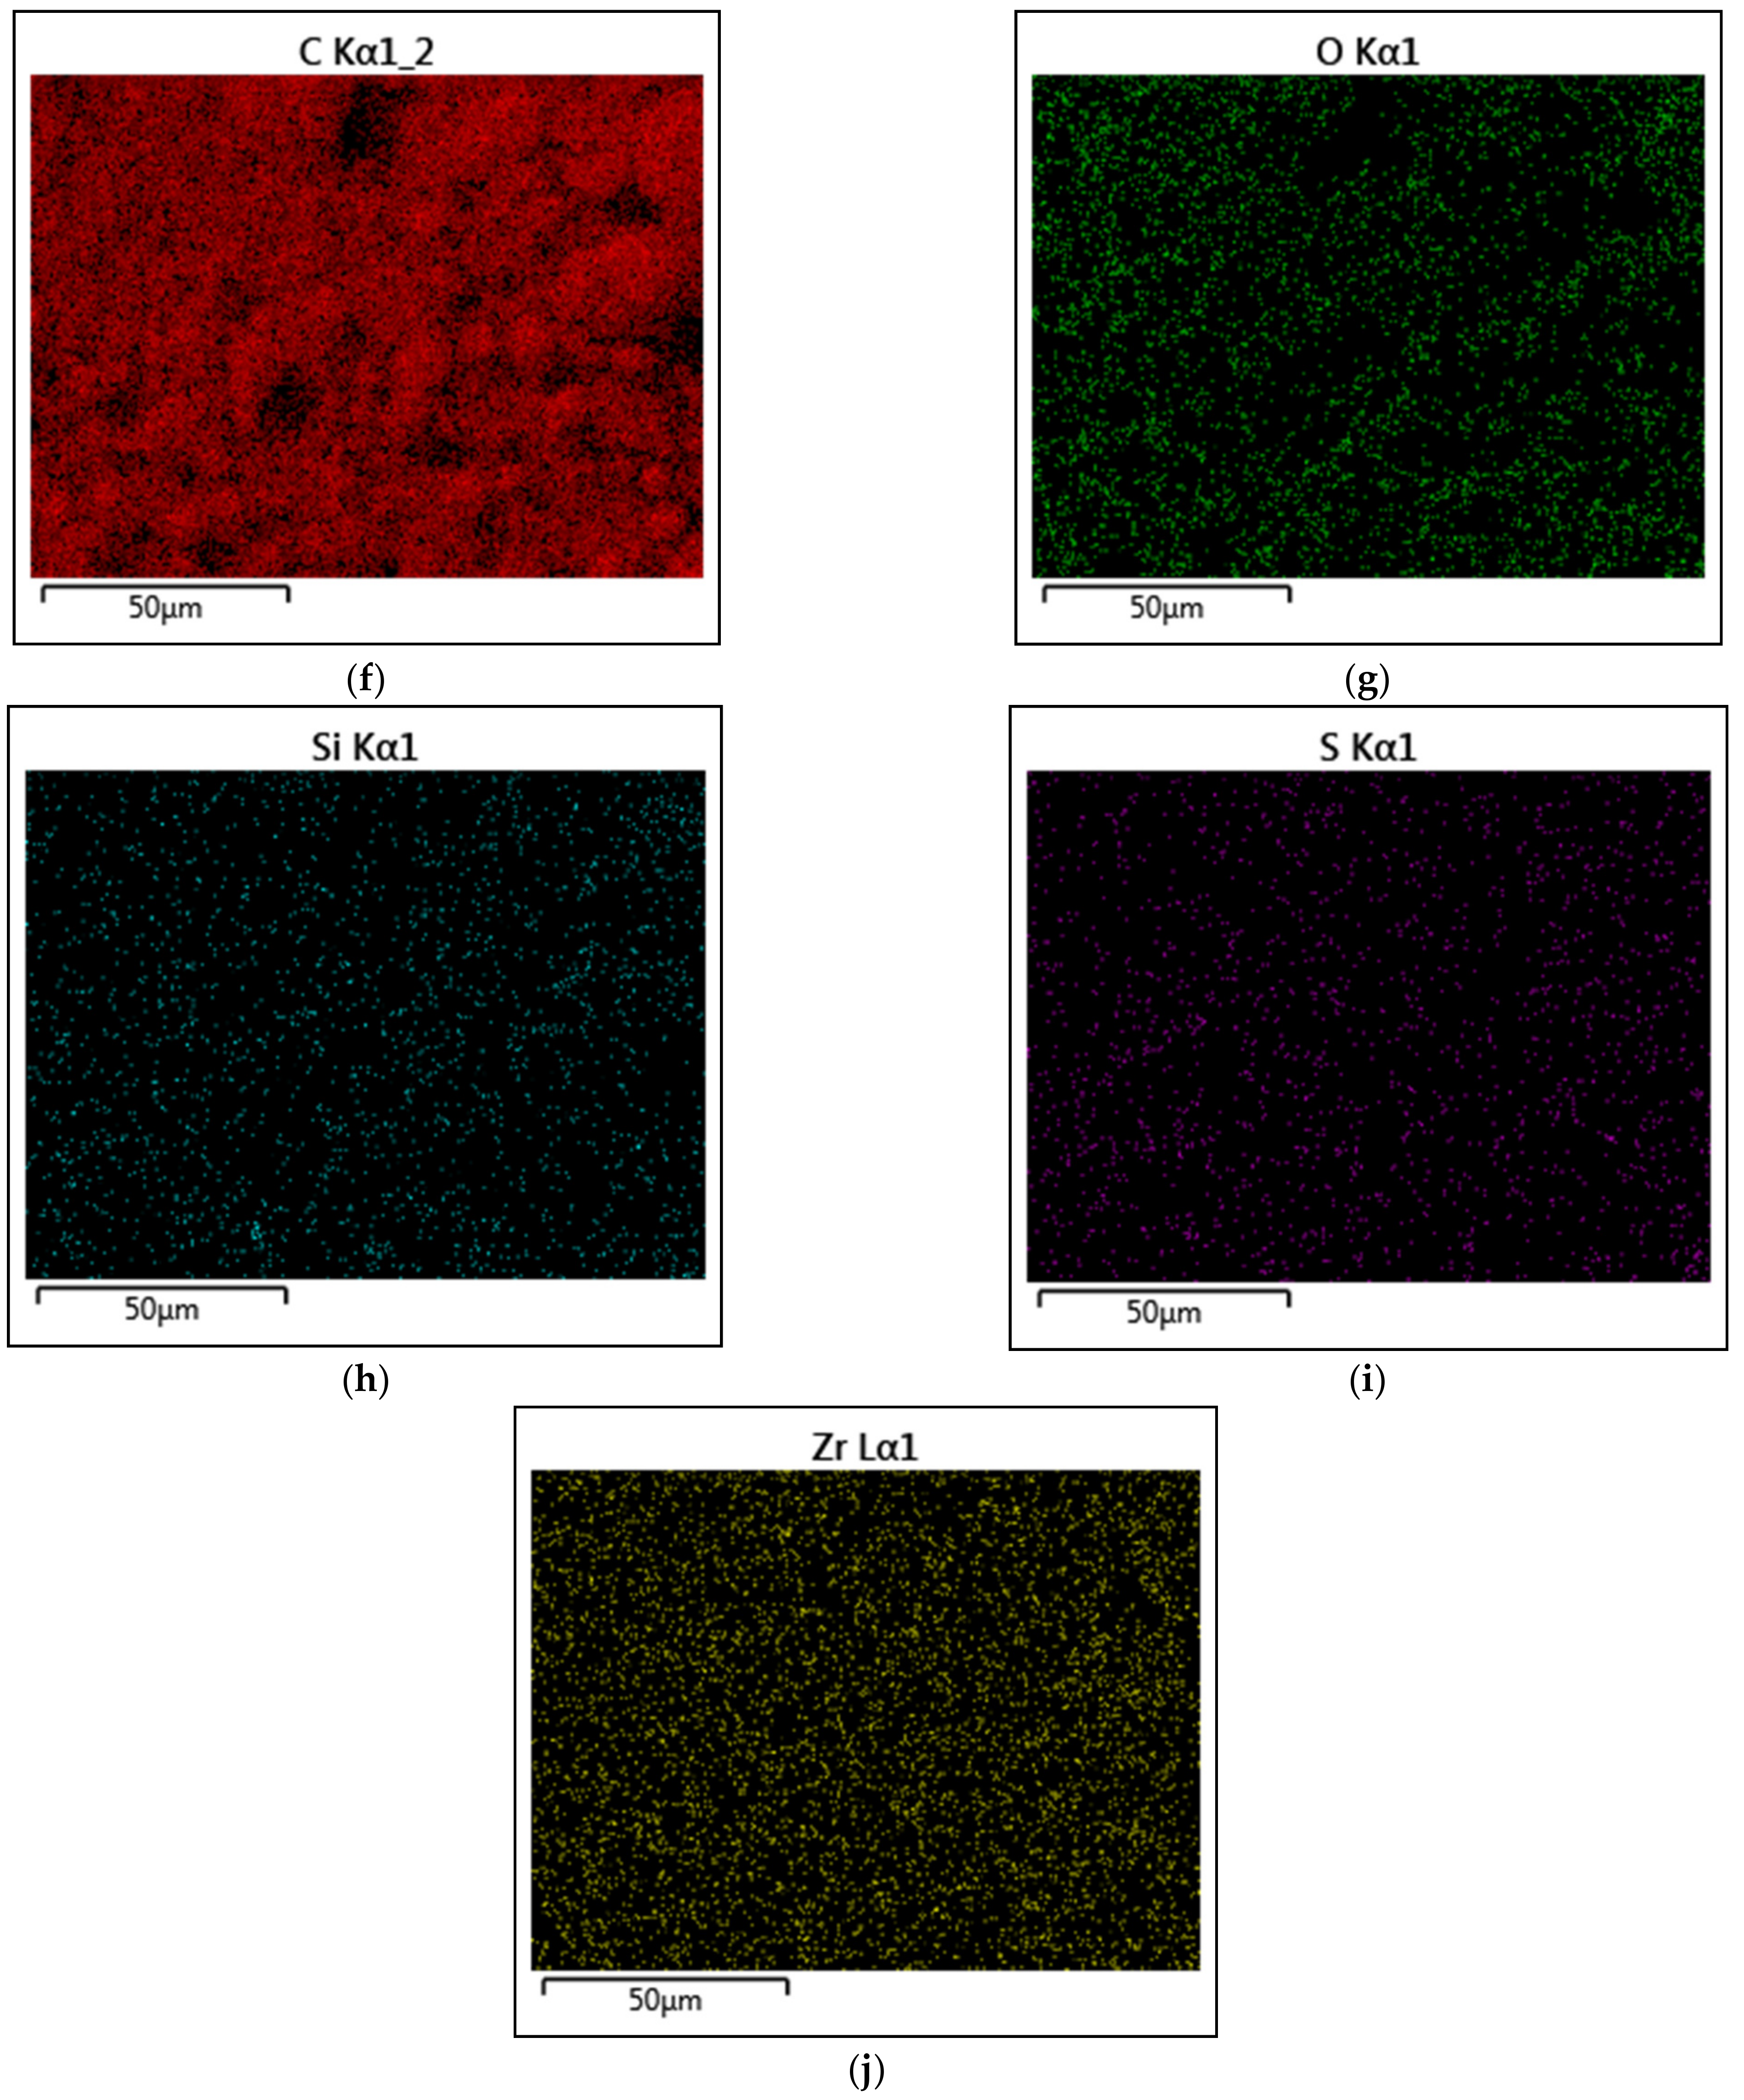
  • The zeta potential of the prepared f-GNPs had a negative charge of −39.4 mV. The EDX analyses of the GNPs confirmed its high carbon content of 88.95% and lower atomic oxygen content of 10.94%. The atomic contents of Si, S, and Zr were 0.05%, 0.05%, and 0.01%, respectively.
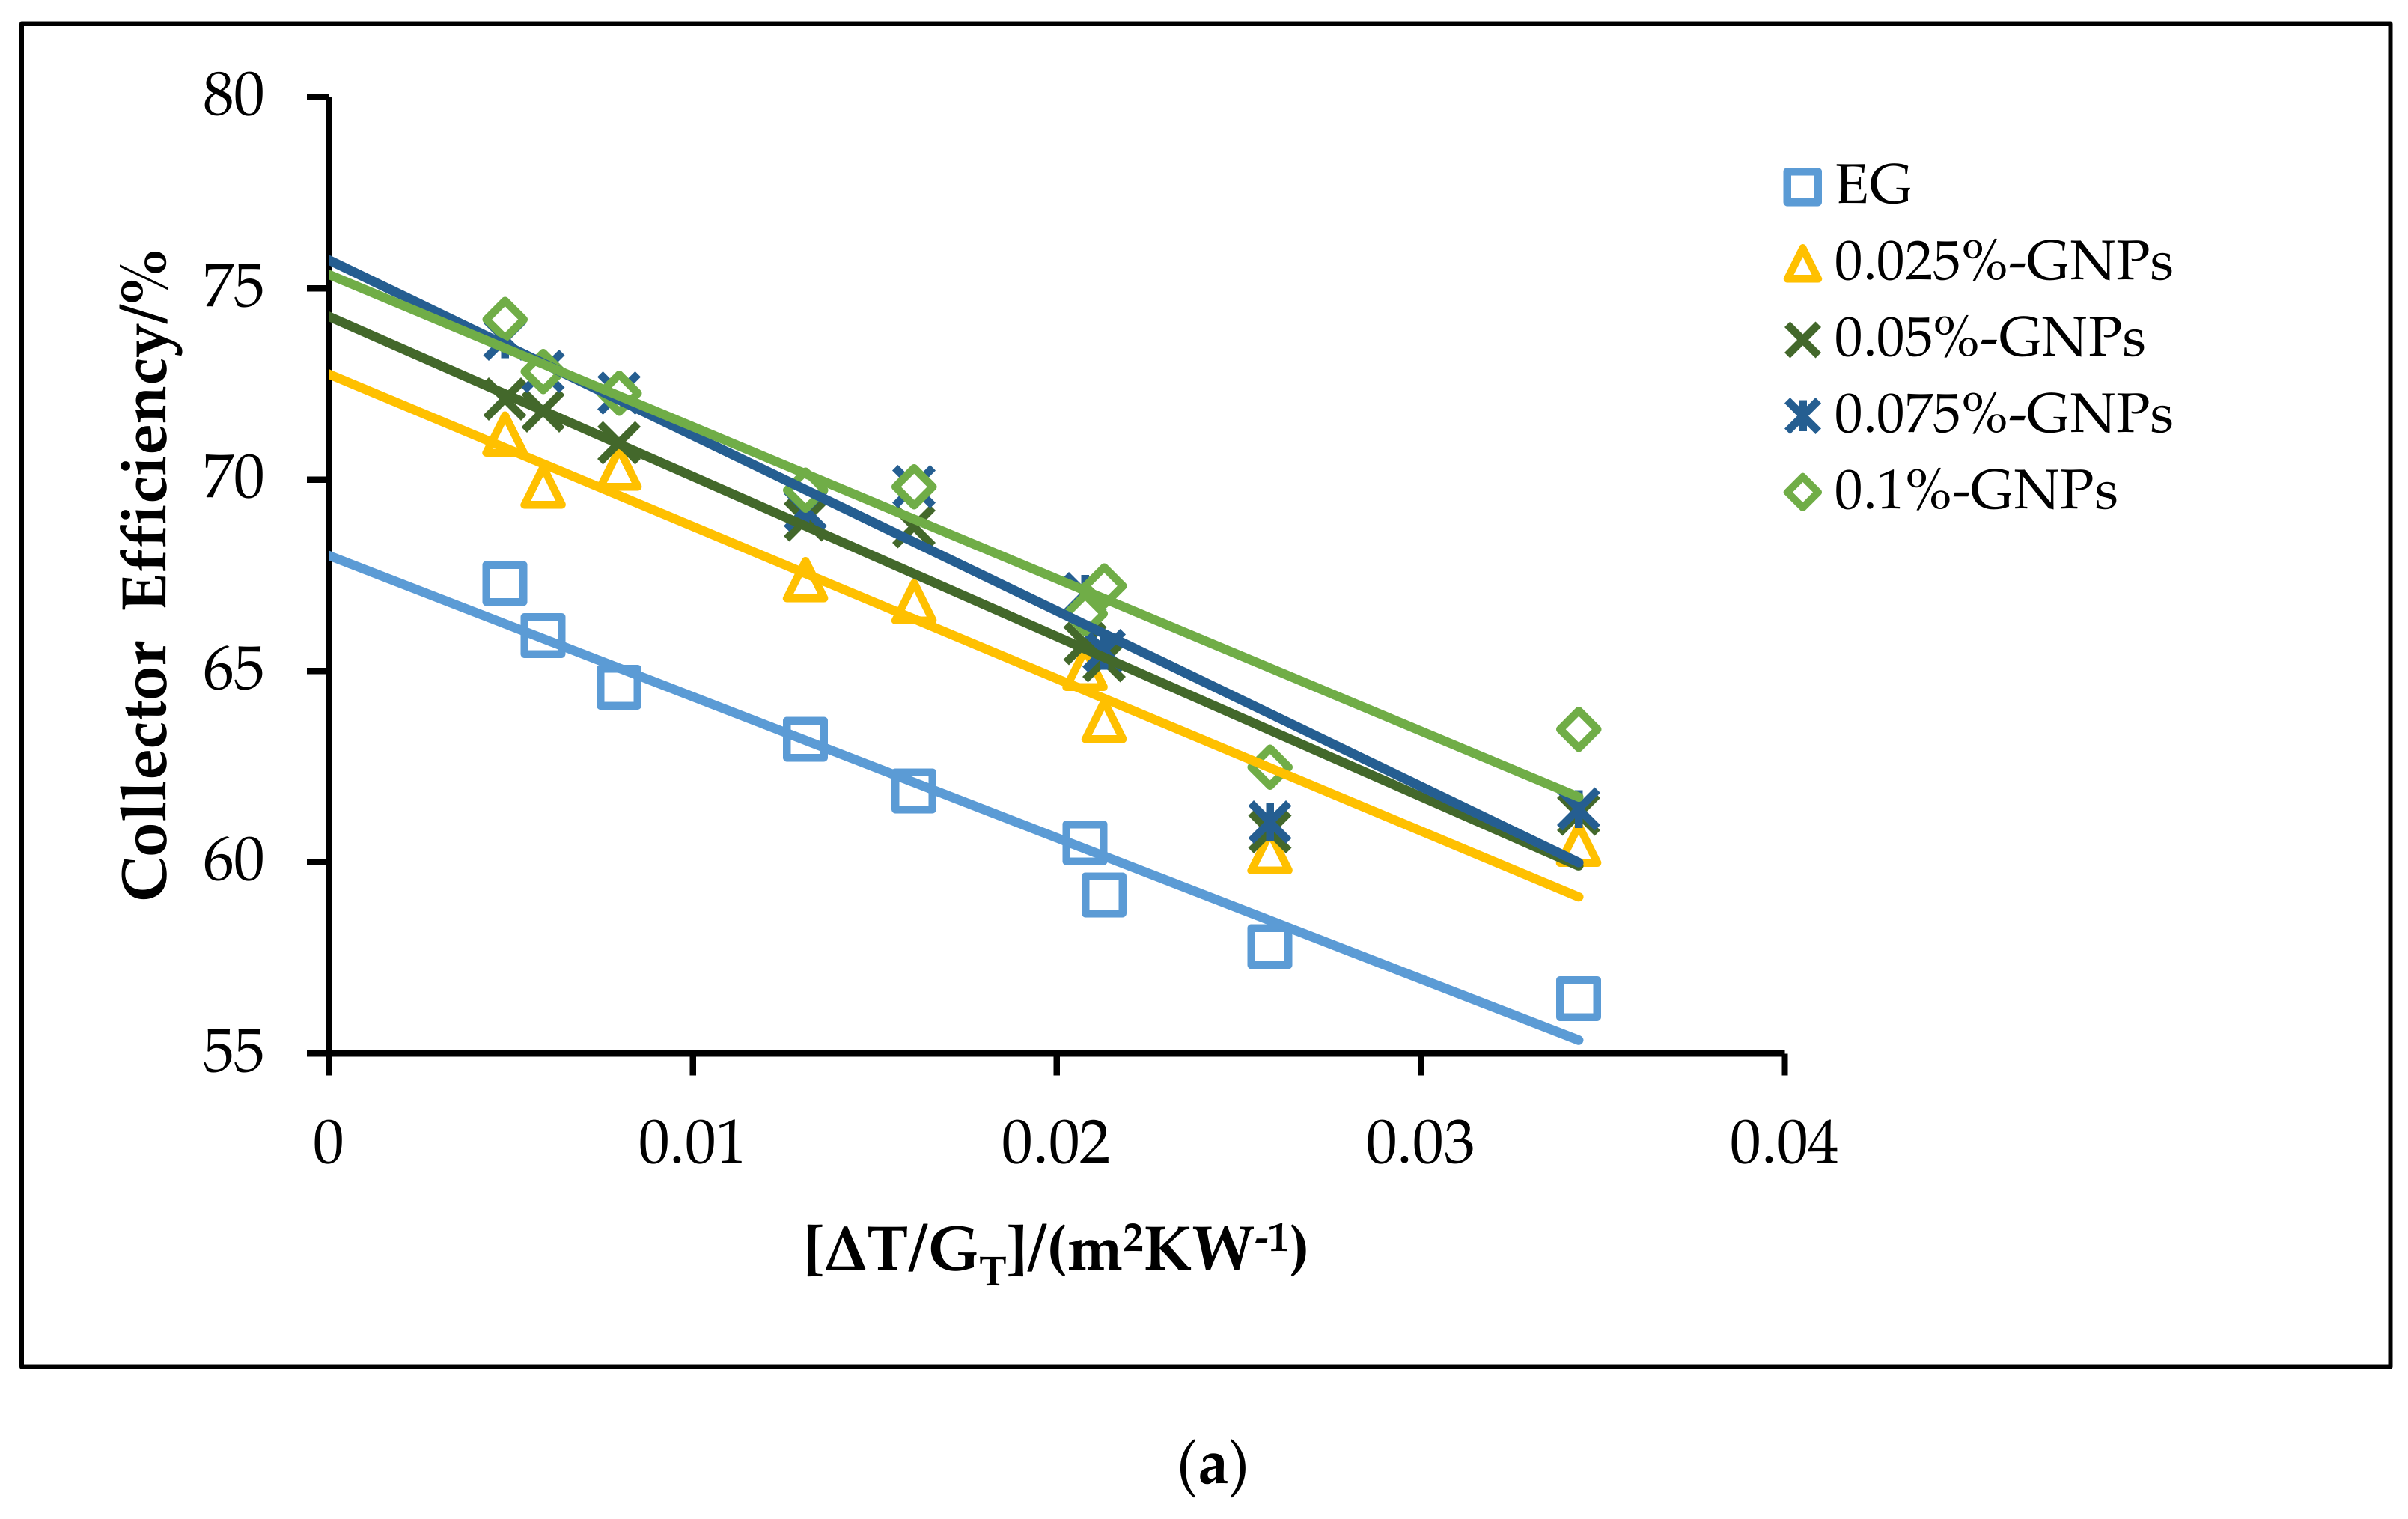
  • The zero-loss efficiency at a flow rate of 1.5 kg min−1 was 0.6992, 0.7038, and 0.7026 for EG, DW: EG (70:30), and DW: EG (50:50), respectively. This means that the increased flow rate improved the performance of the collector. FR (τα) and FRUL increased in tandem, with the flow rate increasing from 0.5 to 1.5 kg min−1.
  • At a flow rate of 1.5 kg min−1, the efficiency enhancements were 8.15%, 9.53%, 11.90%, and 12.69% for the EG-based f-GNPs nanofluids with multiple weight concentrations, respectively, while the enhancements were 8.09%, 9.46%, 11.82%, and 12.60% for the DW:EG (70:30)-based f-GNPs nanofluids for multiple weight concentrations, respectively. The enhancements were 8.11%, 9.48%, 11.84%, and 12.62% for the DW:EG (50:50)-based f-GNPs nanofluids in the case of multiple weight concentrations, respectively. The results revealed that GNPs-based basefluids could function as a kind of good and alternative conventional working fluid in heat transfer applications.
  • At a flow rate of 1.5 kg min−1 and 0.1 wt %, FR(τα) and FRUL increased by 12.48% and 34.25%, 12.40% and 34.01, 12.42% and 34.08% for the EG, DW:EG (70:30)-based, and DW:EG (50:50)-based f-GNPs nanofluids, respectively.
In future work, more research has to be conducted using CNTs-based hybrid nanofluids and graphene-based nanofluids. The nanofluids with heat transfer promoters need to be investigated further to produce maximum cost-effective thermal performance. Future research should be devoted to developing FPSCs with built-in PCM as a latent heat storage, when the nanofluids are used as HTFs. In addition, a porous medium has to be analyzed numerically and experimentally with different porosity materials and nanofluids.

Author Contributions

Conceptualization, O.A.A.; formal analysis, O.A.A.; funding acquisition, H.M.K.; investigation, O.A.A. and A.R.M.; methodology, O.A.A. and H.A.M.; project administration, H.M.K., M.A.S.S., and S.N.K.; supervision, H.M.K. and S.N.K.; writing of the original draft, O.A.A., H.A.M., and G.N.; writing of review and editing, H.A.M. and O.A.H. All authors have read and agreed to the published version of the manuscript.

Funding

This research was funded by Universiti Teknologi Malaysia (UTM), operated by Research Management Center (RMC), under the Research University Grant number (04E76).

Institutional Review Board Statement

Not Applicable.

Informed Consent Statement

Not Applicable.

Data Availability Statement

Data available on request due to restrictions, e.g., privacy or ethical. The data presented in this study are available on request from the corresponding author. The data are not publicly available due to the need for further research.

Conflicts of Interest

The authors declare no conflict of interest.

Nomenclature and Abbreviations

Acsurface area of collector, m2
Al2O3aluminium oxide
CNTscarbon nanotubes
Cpspecific heat coefficient, kJ kg−1 K−1
CuOcopper oxide
DASCdirect absorption solar collector
DSCdifferential scanning calorimetry
DWdistilled water
EDXenergy dispersive X-ray
EGethylene glycol
ELSelectrophoretic light scattering
FPSCflat plate solar collector
FR(τα)collector heat gain coefficient
FRULcollector heat loss coefficient
GNPsgraphene nanoplatelets
GOgraphene oxide
Grgraphene
GTglobal solar radiation, W m−2
hwheat transfer coefficient of wind, W m−2 K−1
HR-TEMhigh-resolution transmission electron microscopy
HTFsheat transfer fluids
Kthermal conductivity, W m−1 K−1
Lcharacteristic length, m
m ˙ Fluid mass flow rate, kg min−1
MWCNTsmultiwalled carbon nanotubes
Nnumber of glasses
PCMphase change material
PDIpolydispersity index
Qlossoverall heat loss, W
Qurate of useful energy gained, W
SEMscanning electron microscopy
SiO2silicon dioxide
SWCNTssingle-wall carbon nanotubes
Ttemperature, K
TGAthermogravimetric analysis
TiO2titanium oxide
ULoverall loss coefficient of an FPSC, W m−2 K−1
Greek Letters
εgglass cover emittance
εapabsorber plate emittance
ηcollector efficiency
ρworking fluid density, kg m−3
σStefan–Boltzmann constant, W m−2 K−4
ταabsorptance–transmittance product
φweight percentage, wt %
Subscripts
ambroom temperature
bback-side
bfbase fluid
ccollector
eedge-side
fmmean fluid
Ininput
Nfnanofluid
Npnanoparticle
outoutput
Pmmean absorber plate
Ttop-side

References

  1. Khanafer, K.; Vafai, K. A review on the applications of nanofluids in solar energy field. Renew. Energy 2018, 123, 398–406. [Google Scholar] [CrossRef]
  2. Elsheikh, A.; Sharshir, S.; Mostafa, M.E.; Essa, F.; Ali, M.K.A. Applications of nanofluids in solar energy: A review of recent advances. Renew. Sustain. Energy Rev. 2018, 82, 3483–3502. [Google Scholar] [CrossRef]
  3. Aleksiejuk-Gawron, J.; Chochowski, A. Study of Dynamics of Heat Transfer in the Flat-Plate Solar Collector. Processes 2020, 8, 1607. [Google Scholar] [CrossRef]
  4. Obstawski, P.; Bakoń, T.; Czekalski, D. Comparison of Solar Collector Testing Methods—Theory and Practice. Processes 2020, 8, 1340. [Google Scholar] [CrossRef]
  5. Duffie, J.A.; Beckman, W.A.; Worek, W.M. Solar Engineering of Thermal Processes, 4nd ed. J. Sol. Energy Eng. 1994, 116, 67–68. [Google Scholar] [CrossRef]
  6. Ladjevardi, S.; Asnaghi, A.; Izadkhast, P.; Kashani, A. Applicability of graphite nanofluids in direct solar energy absorption. Sol. Energy 2013, 94, 327–334. [Google Scholar] [CrossRef]
  7. Phelan, P.; Otanicar, T.; Taylor, R.A.; Tyagi, H. Trends and Opportunities in Direct-Absorption Solar Thermal Collectors. J. Therm. Sci. Eng. Appl. 2013, 5, 021003. [Google Scholar] [CrossRef]
  8. Solangi, K.; Kazi, S.; Luhur, M.; Badarudin, A.; Amiri, A.; Sadri, R.; Zubir, M.N.M.; Gharehkhani, S.; Teng, K. A comprehensive review of thermo-physical properties and convective heat transfer to nanofluids. Energy 2015, 89, 1065–1086. [Google Scholar] [CrossRef]
  9. Ganvir, R.; Walke, P.; Kriplani, V. Heat transfer characteristics in nanofluid—A review. Renew. Sustain. Energy Rev. 2017, 75, 451–460. [Google Scholar] [CrossRef]
  10. Zayed, M.; Zhao, J.; Du, Y.; Kabeel, A.; Shalaby, S. Factors affecting the thermal performance of the flat plate solar collector using nanofluids: A review. Sol. Energy 2019, 182, 382–396. [Google Scholar] [CrossRef]
  11. Raj, P.; Subudhi, S. A review of studies using nanofluids in flat-plate and direct absorption solar collectors. Renew. Sustain. Energy Rev. 2018, 84, 54–74. [Google Scholar] [CrossRef]
  12. Yousefi, T.; Veysi, F.; Shojaeizadeh, E.; Zinadini, S. An experimental investigation on the effect of Al2O3–H2O nanofluid on the efficiency of flat-plate solar collectors. Renew. Energy 2012, 39, 293–298. [Google Scholar] [CrossRef]
  13. Yousefi, T.; Veisy, F.; Shojaeizadeh, E.; Zinadini, S. An experimental investigation on the effect of MWCNT-H2O nanofluid on the efficiency of flat-plate solar collectors. Exp. Therm. Fluid Sci. 2012, 39, 207–212. [Google Scholar] [CrossRef]
  14. Yousefi, T.; Shojaeizadeh, E.; Veysi, F.; Zinadini, S. An experimental investigation on the effect of pH variation of MWCNT–H2O nanofluid on the efficiency of a flat-plate solar collector. Sol. Energy 2012, 86, 771–779. [Google Scholar] [CrossRef]
  15. Faizal, M.; Saidur, R.; Mekhilef, S. Potential of size reduction of flat-plate solar collectors when applying MWCNT nanofluid. In Proceedings of the IOP Conference Series: Earth and Environmental Science, 4th International Conference on Energy and Environment 2013 (ICEE 2013), Putrajaya, Malaysia, 5–6 March 2013. [Google Scholar]
  16. Said, Z.; Saidur, R.; Rahim, N.; Alim, M. Analyses of exergy efficiency and pumping power for a conventional flat plate solar collector using SWCNTs based nanofluid. Energy Build. 2014, 78, 1–9. [Google Scholar] [CrossRef]
  17. Said, Z.; Saidur, R.; Sabiha, M.; Rahim, N.; Anisur, M. Thermophysical properties of Single Wall Carbon Nanotubes and its effect on exergy efficiency of a flat plate solar collector. Sol. Energy 2015, 115, 757–769. [Google Scholar] [CrossRef]
  18. Vakili, M.; Hosseinalipour, S.; Delfani, S.; Khosrojerdi, S.; Karami, M. Experimental investigation of graphene nanoplatelets nanofluid-based volumetric solar collector for domestic hot water systems. Sol. Energy 2016, 131, 119–130. [Google Scholar] [CrossRef]
  19. Ahmadi, A.; Ganji, D.D.; Jafarkazemi, F. Analysis of utilizing Graphene nanoplatelets to enhance thermal performance of flat plate solar collectors. Energy Convers. Manag. 2016, 126, 1–11. [Google Scholar] [CrossRef]
  20. Vincely, D.A.; Natarajan, E. Experimental investigation of the solar FPC performance using graphene oxide nanofluid under forced circulation. Energy Convers. Manag. 2016, 117, 1–11. [Google Scholar] [CrossRef]
  21. Verma, S.K.; Tiwari, A.K.; Chauhan, D.S. Experimental evaluation of flat plate solar collector using nanofluids. Energy Convers. Manag. 2017, 134, 103–115. [Google Scholar] [CrossRef]
  22. Akram, N.; Sadri, R.; Kazi, S.N.; Ahmed, S.M.; Zubir, M.N.M.; Ridha, M.; Soudagar, M.; Ahmed, W.; Arzpeyma, M.; Tong, G.B. An experimental investigation on the performance of a flat-plate solar collector using eco-friendly treated graphene nanoplatelets–water nanofluids. J. Therm. Anal. Calorim. 2019, 138, 609–621. [Google Scholar] [CrossRef]
  23. Alawi, O.A.; Kamar, H.M.; Mallah, A.; Kazi, S.; Sidik, N.A.C. Thermal efficiency of a flat-plate solar collector filled with Pentaethylene Glycol-Treated Graphene Nanoplatelets: An experimental analysis. Sol. Energy 2019, 191, 360–370. [Google Scholar] [CrossRef]
  24. Elcioglu, E.B.; Genc, A.M.; Karadeniz, Z.H.; Ezan, M.A.; Turgut, A. Nanofluid figure-of-merits to assess thermal efficiency of a flat plate solar collector. Energy Convers. Manag. 2020, 204, 112292. [Google Scholar] [CrossRef]
  25. Sarsam, W.S.; Kazi, S.; Badarudin, A. Thermal performance of a flat-plate solar collector using aqueous colloidal dispersions of graphene nanoplatelets with different specific surface areas. Appl. Therm. Eng. 2020, 172, 115142. [Google Scholar] [CrossRef]
  26. Saleh, B.; Sundar, L.S. Thermal Efficiency, Heat Transfer, and Friction Factor Analyses of MWCNT + Fe3O4/ Water Hybrid Nanofluids in a Solar Flat Plate Collector under Thermosyphon Condition. Processes 2020, 9, 180. [Google Scholar] [CrossRef]
  27. Pak, B.C.; Cho, Y.I. Hydrodynamic and heat transfer study of dispersed fluids with submicron metallic oxide particles. Exp. Heat Transf. 1998, 11, 151–170. [Google Scholar] [CrossRef]
  28. Kalogirou, S.A. Solar Energy Engineering: Processes and Systems. J. Chem. Inf. Modeling 2013. [Google Scholar] [CrossRef]
  29. Hawwash, A.; Rahman, A.K.A.; Nada, S.; Ookawara, S. Numerical Investigation and Experimental Verification of Performance Enhancement of Flat Plate Solar Collector Using Nanofluids. Appl. Therm. Eng. 2018, 130, 363–374. [Google Scholar] [CrossRef]
  30. He, Q.; Zeng, S.; Wang, S. Experimental investigation on the efficiency of flat-plate solar collectors with nanofluids. Appl. Therm. Eng. 2015, 88, 165–171. [Google Scholar] [CrossRef]
  31. García, A.; Martín, R.H.; Solano, J.; Pérez-García, J. The role of insert devices on enhancing heat transfer in a flat-plate solar water collector. Appl. Therm. Eng. 2018, 132, 479–489. [Google Scholar] [CrossRef]
  32. Tong, Y.; Lee, H.; Kang, W.; Cho, H. Energy and exergy comparison of a flat-plate solar collector using water, Al2O3 nanofluid, and CuO nanofluid. Appl. Therm. Eng. 2019, 159, 113959. [Google Scholar] [CrossRef]
  33. Amrollahi, A.; Rashidi, A.; Meibodi, M.E.; Kashefi, K. Conduction heat transfer characteristics and dispersion behaviour of carbon nanofluids as a function of different parameters. J. Exp. Nanosci. 2009, 4, 347–363. [Google Scholar] [CrossRef]
  34. Zhu, H.; Zhang, C.; Tang, Y.; Wang, J.; Ren, B.; Yin, Y. Preparation and thermal conductivity of suspensions of graphite nanoparticles. Carbon 2007, 45, 226–228. [Google Scholar] [CrossRef]
  35. Yu, W.; Xie, H. A Review on Nanofluids: Preparation, Stability Mechanisms, and Applications. J. Nanomater. 2011, 2012, 1–17. [Google Scholar] [CrossRef] [Green Version]
  36. Georgakilas, V.; Otyepka, M.; Bourlinos, A.B.; Chandra, V.; Kim, N.; Kemp, K.C.; Hobza, P.; Zboril, R.; Kim, K.S. Functionalization of Graphene: Covalent and Non-Covalent Approaches, Derivatives and Applications. Chem. Rev. 2012, 112, 6156–6214. [Google Scholar] [CrossRef] [PubMed]
  37. Derry, C.; Wu, Y.; Gardner, S.; Zhu, S. Graphene Nanoplatelets Prepared by Electric Heating Acid-Treated Graphite in a Vacuum Chamber and Their Use as Additives in Organic Semiconductors. ACS Appl. Mater. Interfaces 2014, 6, 20269–20275. [Google Scholar] [CrossRef] [PubMed]
  38. Dimiev, A.M.; Ceriotti, G.; Metzger, A.; Kim, N.D.; Tour, J.M. Chemical Mass Production of Graphene Nanoplatelets in ∼100% Yield. ACS Nano 2016, 10, 274–279. [Google Scholar] [CrossRef]
  39. Karami, M.; Bahabadi, M.A.; Delfani, S.; Ghozatloo, A. A new application of carbon nanotubes nanofluid as working fluid of low-temperature direct absorption solar collector. Sol. Energy Mater. Sol. Cells 2014, 121, 114–118. [Google Scholar] [CrossRef]
  40. Karami, M.; Akhavan-Bahabadi, M.; Delfani, S.; Raisee, M. Experimental investigation of CuO nanofluid-based Direct Absorption Solar Collector for residential applications. Renew. Sustain. Energy Rev. 2015, 52, 793–801. [Google Scholar] [CrossRef]
  41. Karami, M.; Akhavan-Behabadi, M.; Dehkordi, M.R.; Delfani, S. Thermo-optical properties of copper oxide nanofluids for direct absorption of solar radiation. Sol. Energy Mater. Sol. Cells 2016, 144, 136–142. [Google Scholar] [CrossRef]
  42. Eltaweel, M.; Abdel-Rehim, A.A. Energy and exergy analysis of a thermosiphon and forced-circulation flat-plate solar collector using MWCNT/Water nanofluid. Case Stud. Therm. Eng. 2019, 14, 100416. [Google Scholar] [CrossRef]
  43. Sharafeldin, M.A.; Gróf, G.; Mahian, O. Experimental study on the performance of a flat-plate collector using WO3/Water nanofluids. Energy 2017, 141, 2436–2444. [Google Scholar] [CrossRef]
  44. Sharafeldin, M.; Gróf, G. Experimental investigation of flat plate solar collector using CeO2 -water nanofluid. Energy Convers. Manag. 2018, 155, 32–41. [Google Scholar] [CrossRef]
  45. Sharafeldin, M.A.; Gróf, G. Efficiency of evacuated tube solar collector using WO3/Water nanofluid. Renew. Energy 2019, 134, 453–460. [Google Scholar] [CrossRef]
Figure 1. Validation of the present theoretical model with the data available in the literature [23].
Processes 09 00302 g001
Figure 2. Schematic of the functionalization process and fabrication of nanofluids.
Processes 09 00302 g002
Figure 3. Flowchart of the theoretical model to simulate the nanofluid-based flat plate solar collector (FPSC) in MATLAB.
Processes 09 00302 g003
Figure 4. Thermal properties of the functionalized graphene nanoplatelets (f-GNPs) by differential scanning calorimetry (DSC) (a) and thermogravimetric analysis (TGA) (b).
Processes 09 00302 g004
Figure 5. UV–VIS variations for pristine GNPs and f-GNPs at 1 and 3 h sonication periods.
Processes 09 00302 g005
Figure 6. Zeta potential distribution of f-GNPs nanofluids at 25 °C.
Processes 09 00302 g006
Figure 7. Particle size distributions for the f-GNPs nanofluid at 25 °C.
Processes 09 00302 g007
Figure 8. HR-TEM image of pristine GNPs (a) and functionalized GNPs (b) dispersed in DW.
Processes 09 00302 g008
Figure 9. SEM and energy-dispersive X-ray spectroscopy (EDX) mapping analysis of the GNPs; (a) SEM microimage at 2 µm; (b) SEM microimage at 5 µm; (c) EDX mapping analysis; (d) EDX elemental analysis; (e) electron image; (f) carbon mapping; (g) oxygen mapping; (h) silicon mapping; (i) sulfur mapping; (j) zirconium mapping.
Processes 09 00302 g009aProcesses 09 00302 g009bProcesses 09 00302 g009c
Figure 10. The theoretical efficiency for the f-GNPs–EG nanofluids with different weight concentrations: (a) 0.5 kg min−1; (b) 1 kg min−1; (c) 1.5 kg min−1.
Processes 09 00302 g010aProcesses 09 00302 g010b
Figure 11. The theoretical efficiencies for the DW:EG (70:30)-based f-GNPs nanofluids with different weight concentrations: (a) 0.5 kg min−1; (b) 1 kg min−1; (c) 1.5 kg min−1.
Processes 09 00302 g011aProcesses 09 00302 g011b
Figure 12. The theoretical efficiencies for the DW:EG (50:50)-based f-GNPs nanofluids with different weight concentrations: (a) 0.5 kg min−1; (b) 1 kg min−1; (c) 1.5 kg min−1.
Processes 09 00302 g012aProcesses 09 00302 g012b
Figure 13. The surface plots of collector efficiency against mass concentration and reduced temperature factor at 1.5 kg min−1: (a) EG + GNPs, (b) DW:EG (70:30) + GNPs, (c) DW:EG (50:50) + GNPs.
Processes 09 00302 g013
Table 1. Specifications of the solar collector.
SpecificationsDimension
Collector occupied area0.6810 m2
Absorber area0.4645 m2
Header tube outer diameter22.2 mm
Header tube inner diameter20.9 mm
Riser tube outer diameter12.7 mm
Riser tube inner diameter11.6 mm
Transmittance–absorptance product0.8772
Tilt angle30°
Table 2. Heat absorbed and heat removal factors at a different flow rate for the EG-based f-GNPs nanofluids.
m ˙
(kg min−1)
EG0.025% f-GNPs0.05% f-GNPs0.075% f-GNPs0.1% f-GNPs
FR(τα)FRULFR(τα)FRULFR(τα)FRULFR(τα)FRULFR(τα)FRUL
0.50.68026.15470.72766.63310.74276.63840.75366.97830.75747.6509
10.70006.33150.75137.04710.76697.05270.77817.40350.78218.0977
1.50.70686.39300.76347.50440.77947.51010.79097.87020.7958.5826
Table 3. Heat absorbed and heat removal factors at a different flow rate for the DW:EG (70:30)-based f-GNPs nanofluids.
m ˙
(kg min−1)
DW:EG (70:30)0.025% f-GNPs0.05% f-GNPs0.075% f-GNPs0.1% f-GNPs
FR(τα)FRULFR(τα)FRULFR(τα)FRULFR (τα)FRULFR(τα)FRUL
0.50.69356.27360.74096.75200.75606.75730.76697.09730.77077.7698
10.70696.39590.75827.11150.77387.11710.7857.46790.7898.1621
1.50.71146.43760.76807.54900.78417.55460.79567.91480.79968.6271
Table 4. Heat absorbed and heat removal factors at a different flow rate for the DW:EG (50:50)-based f-GNPs nanofluids.
m ˙
(kg min−1)
DW:EG (50:50)0.025% f-GNPs0.05% f-GNPs0.075% f-GNPs0.1% f-GNPs
FR(τα)FRULFR(τα)FRULFR(τα)FRULFR (τα)FRULFR(τα)FRUL
0.50.68996.24290.73736.72110.75256.72660.76337.06660.76727.7391
10.70516.38170.75647.09730.77207.10280.78327.45360.78728.1478
1.50.71026.42510.76687.53650.78287.54230.79447.90220.79848.6146
Publisher’s Note: MDPI stays neutral with regard to jurisdictional claims in published maps and institutional affiliations.

