2.1. Method Development
Literature analysis suggested no sustainable densitometry techniques for the quantitation of PPN in plant extracts, foods, and pharmaceutical products [
42]. Three isomers of PPN (chavicine, isochavicine, and isopiperine) are also present in black pepper in small amounts, but these isomers were not quantified in this study [
3,
4]. In this work, only PPN was quantified as it is the major compound of black pepper. In addition, these isomers did not interfere the analysis of PPN as indicated by reported HPTLC analysis [
3]. No greenness profile of any reported analytical technique of PPN analysis was assessed. Accordingly, this research was conducted to establish a rapid and highly sensitive normal/reversed-phase HPTLC densitometry technique for the quantitation of PPN in various food spices of black pepper with TE and UBE of various food spices of
Piper nigrum L. under GAC viewpoint. The utilization of sustainable densitometry techniques offers many advantages over routine analytical techniques for the quantitation of analytes in addition to reduction in the environmental toxicity [
39,
40].
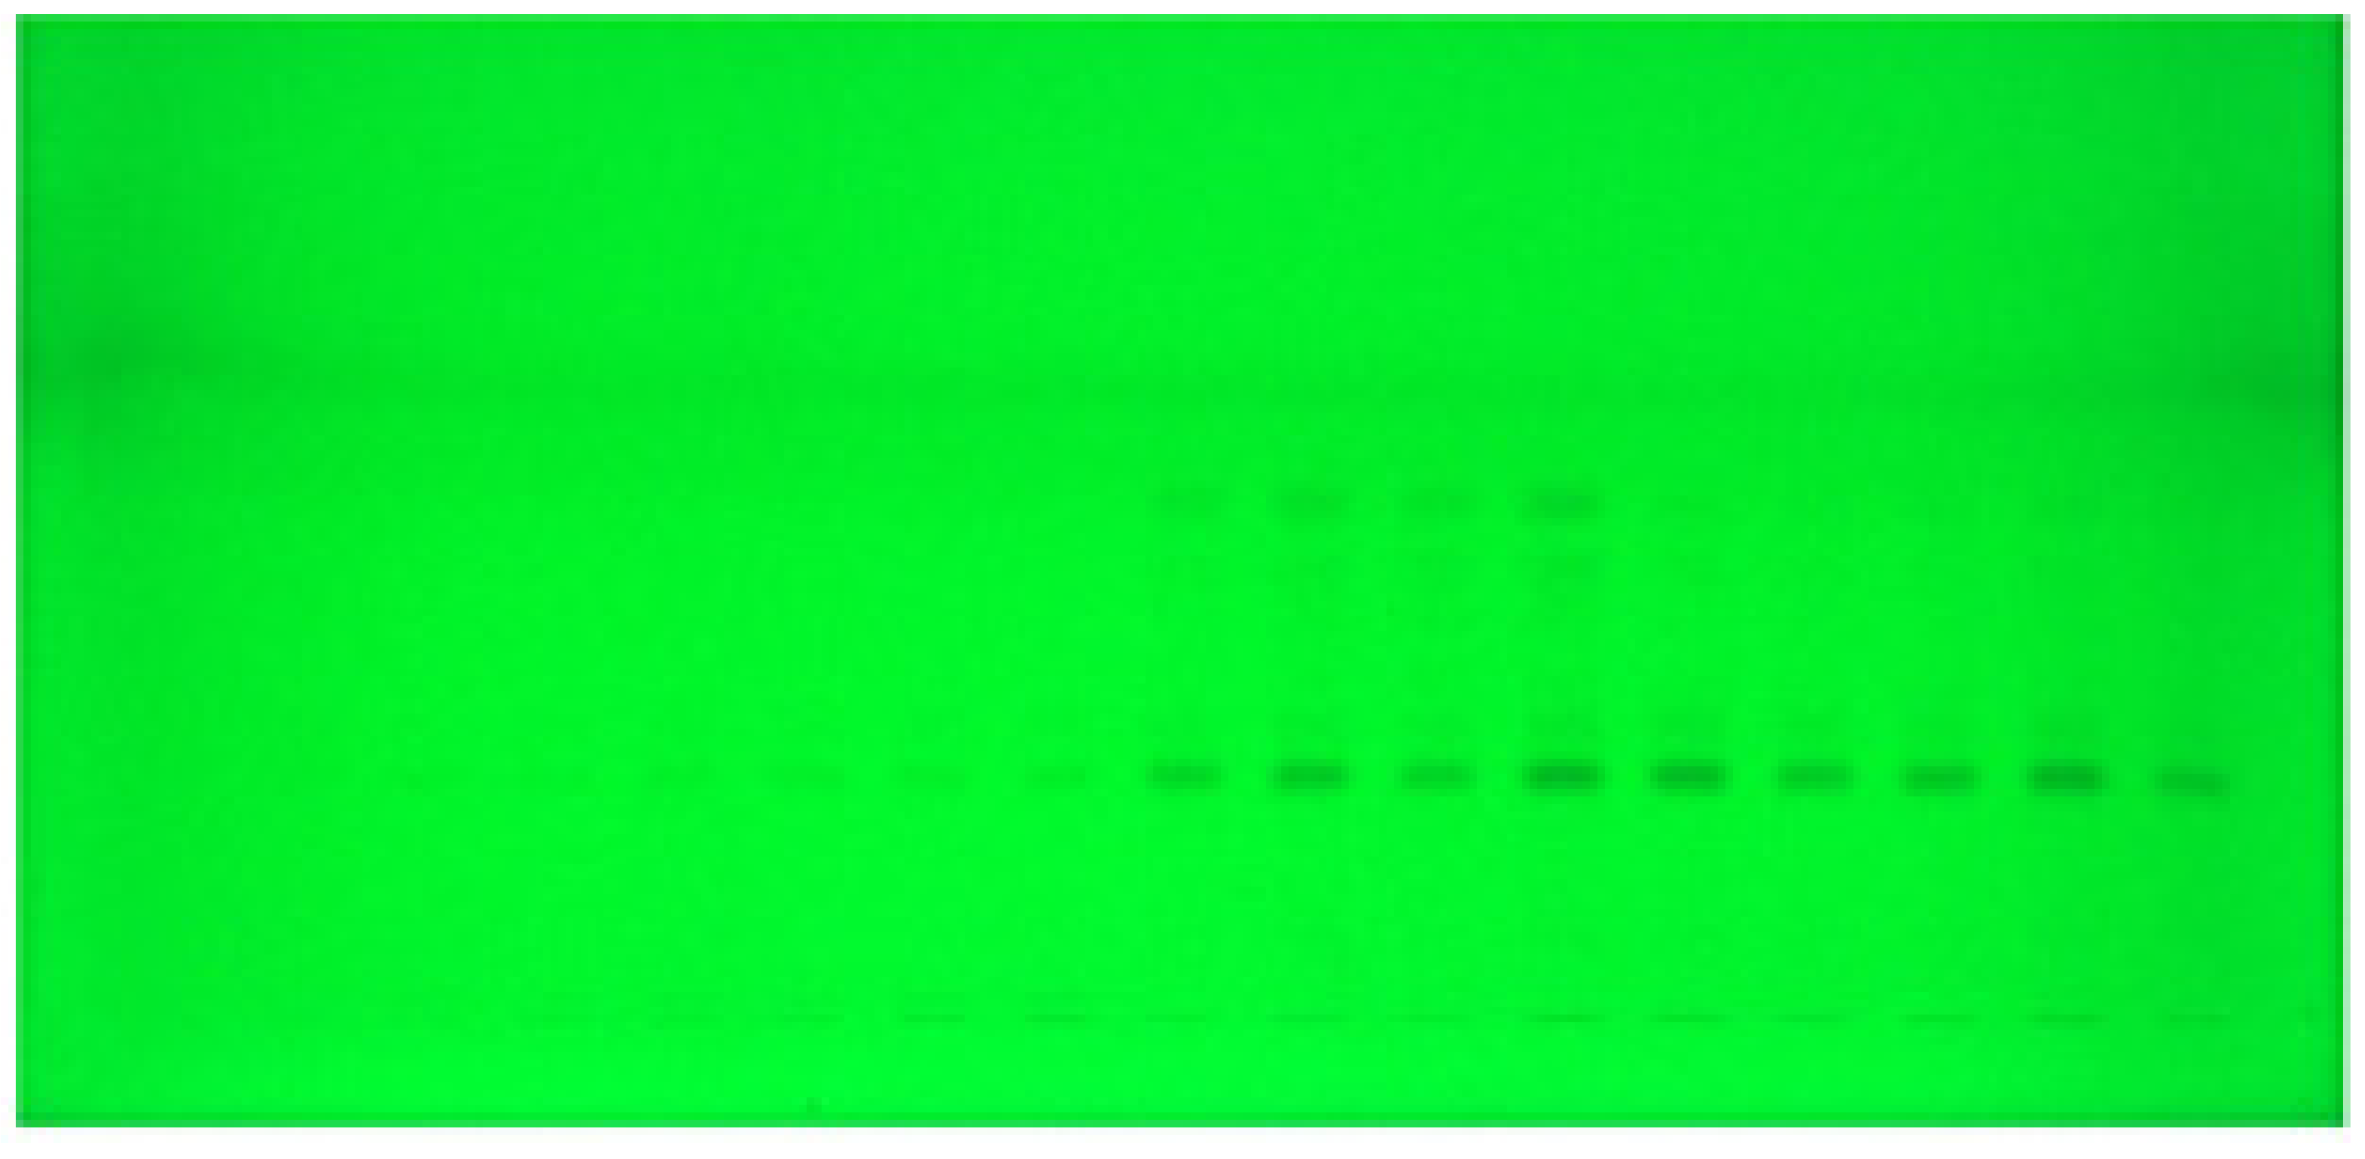
For a normal-phase HPTLC analysis of PPN, the different proportions of cyclohexane and ethyl acetate such as cyclohexane/ethyl acetate (30:70,
v/
v), cyclohexane/ethyl acetate (40:60,
v/
v), cyclohexane/ethyl acetate (50:50,
v/
v), cyclohexane/ethyl acetate (60:40,
v/
v), and cyclohexane/ethyl acetate (70:30,
v/
v) were studied as the solvent systems for the development of an acceptable band for the quantitation of PPN. All the solvent systems were developed under chamber saturation conditions (
Figure 1).
It was observed that cyclohexane/ethyl acetate (30:70,
v/
v), cyclohexane/ethyl acetate (40:60,
v/
v), cyclohexane/ethyl acetate (50:50,
v/
v), and cyclohexane/ethyl acetate (70:30,
v/
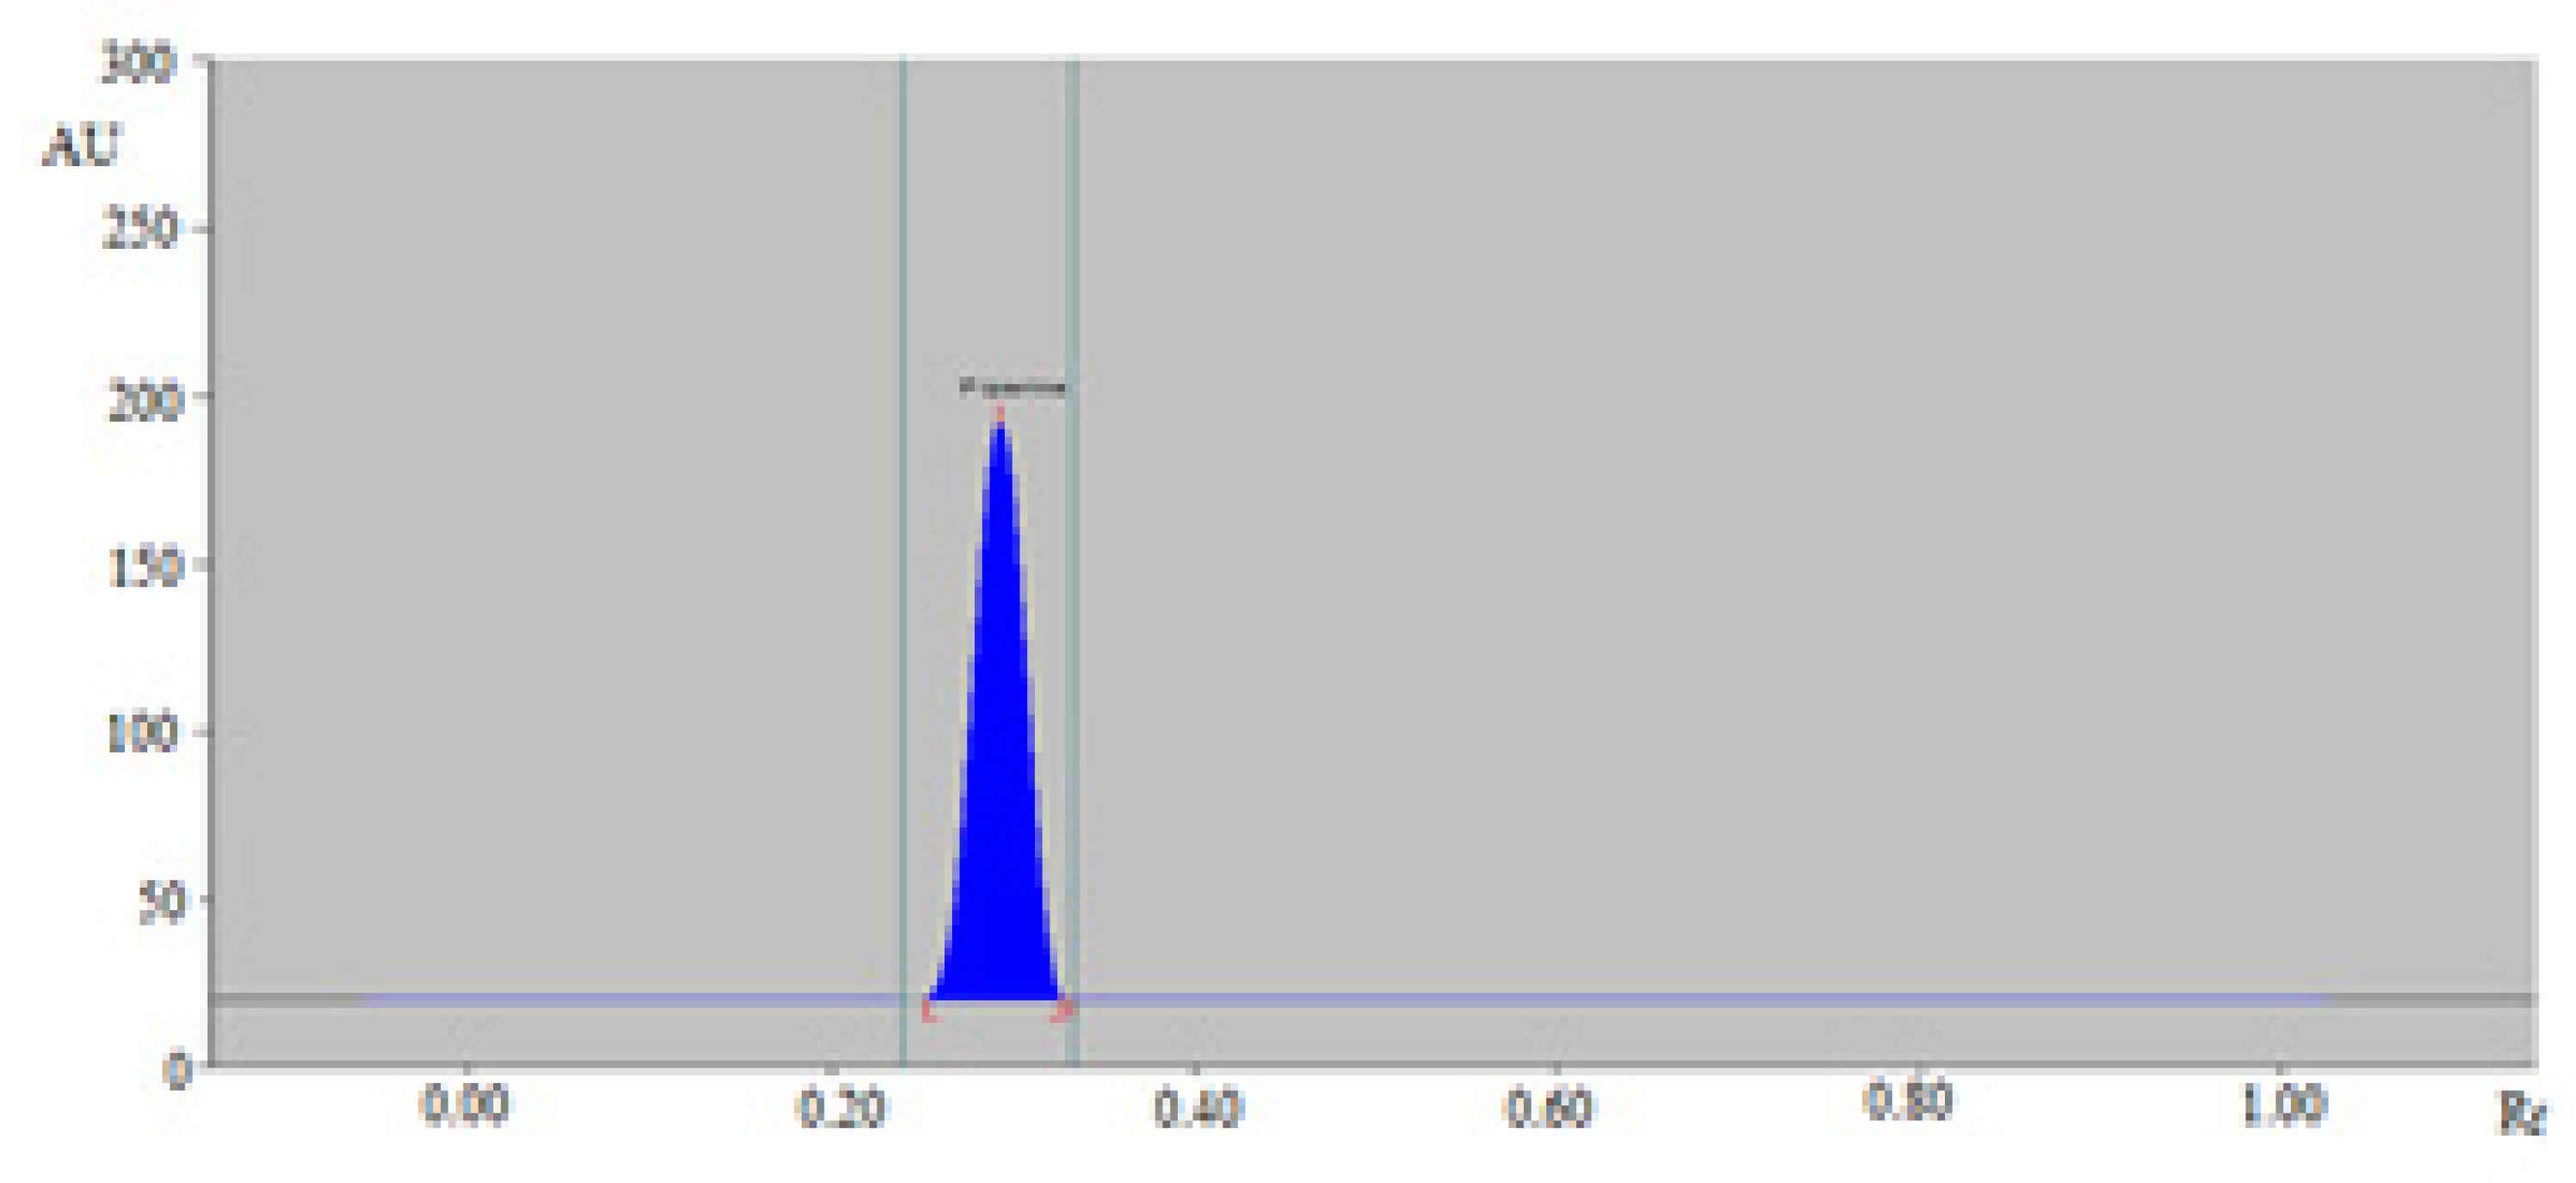
v) sustainable solvent systems offered a poor densitometry peak of PPN with poor asymmetry/tailing factor. However, cyclohexane/ethyl acetate (60:40,
v/
v) was found to offer a well-resolved, symmetrical, and compact densitometry peak of PPN at R
f = 0.29 ± 0.01 (
Figure 2). Accordingly, cyclohexane/ethyl acetate (60:40,
v/
v) system was optimized as the sustainable solvent system for the quantitation of PPN in TE and UBE of BPMH, BPLU, BPSH, and BPPA.
For a reversed-phase HPTLC analysis of PPN, the different proportions of ethanol and water such as ethanol/water (40:60,
v/
v), ethanol/water (50:50,
v/
v), ethanol/water (60:40,
v/
v), ethanol/water (70:30,
v/
v), and ethanol/water (80:20
v/
v) were studied as the solvent systems for the development of an acceptable band for the quantitation of PPN. All the solvent systems were also developed under chamber saturation conditions for a reversed-phase HPTLC technique which is shown in supplementary
Figure S1. It was found that ethanol/water (40:60,
v/
v), ethanol/water (50:50,
v/
v), ethanol/water (60:40,
v/
v), and ethanol/water (70:30,
v/
v) sustainable solvent systems offered a poor densitometry peak of PPN with poor asymmetry/tailing factor. However, ethanol/water (80:20,
v/
v) was found to offer a well-resolved, symmetrical and compact densitometry peak of PPN at R
f = 0.52 ± 0.01 (
Figure S2). Accordingly, ethanol/water (80:20,
v/
v) system was optimized as the sustainable solvent system for the quantitation of PPN in TE and UBE of BPMH, BPLU, BPSH, and BPPA.
The bands spectra for PPN for normal/reversed-phase HPTLC technique was recorded in the densitometry mode and maximum response was recorded at the wavelength (λmax) = 343 nm for PPN. Hence, the whole analysis of PPN was performed at λmax = 343 nm using normal/reversed-phase HPTLC technique.
2.2. Method Validation
Various validation parameters for the quantitation of PPN were evaluated. The results for least square regression analysis for the univariate calibration curve (UCC) of PPN for a normal-phase HPTLC are included in
Table 1. For a normal-phase HPTLC technique, the UCC of PPN was found to be linear in the range of 10–1000 ng band
−1. However, the UCC of PPN was found to be linear in the range of 50–500 ng band
−1 for a reversed-phase HPTLC technique (
Table S1). The determination coefficient (R
2) values were recorded as 0.9998 and 0.9990 for normal and reversed-phase HPTLC techniques, respectively. The R
2 value for a normal-phase HPTLC technique was higher than a reversed-phase HPTLC technique, although both of the densitometry techniques presented good linear relationships between the concentration and peak area. In addition, the lower limit of quantification (LLOQ) and linearity range of a normal-phase HPTLC technique was much better and broader than a reversed-phase HPTLC technique. Accordingly, a normal-phase HPTLC technique was found to be more reliable for the quantitation of PPN compared to a reversed-phase HPTLC technique.
The results of the accuracy for normal-phase HPTLC technique are included in
Table 2. The % recovery of PPN for a normal-phase HPTLC technique was found to be 101.40, 99.30, and 98.97% at LQC (10 ng band
−1), MCQ (500 ng band
−1), and HQC (1000 ng band
−1), respectively. The %RSD in the recovery of PPN for a normal-phase HPTLC technique at LQC, MQC, and HQC was calculated as 0.98, 0.53, and 0.38%, respectively. The % recovery of PPN for a reversed-phase HPTLC technique was found to be 101.84, 100.94, and 98.82% at LQC (50 ng band
−1), MCQ (300 ng band
−1), and HQC (500 ng band
−1), respectively (
Table S2). The %RSD in the recovery of PPN for a reversed-phase HPTLC technique at LQC, MQC, and HQC was calculated as 1.49, 0.73, and 0.59%, respectively. The obtained values of recoveries within 100 ± 2% suggested that normal/reversed-phase HPTLC technique was accurate for the quantitation of PPN. However, a normal-phase HPTLC technique was more accurate than a reversed-phase HPTLC technique.
The results of the precision for a normal-phase HPTLC technique are included in
Table 3. For a normal-phase HPTLC technique, the % RSD values of PPN for the intra-day precision were predicted as 0.78, 0.32, and 0.21% at LQC, MQC, and HQC, respectively. For a normal-phase HPTLC technique, the % RSD values of PPN for the inter-day precision were recorded as 0.86, 0.34, and 0.27% at LQC, MQC, and HQC, respectively. For a reversed-phase HPTLC technique, the % RSD values of PPN for the intra-day precision were calculated as 1.19, 1.05, and 0.80% at LQC, MQC, and HQC, respectively (
Table S2). For a reversed-phase HPTLC technique, the % RSD values of PPN for the inter-day precision were calculated as 1.47, 1.13, and 0.88% at LQC, MQC, and HQC, respectively. The recorded % RSD of PPN within ±2 % suggested that normal/reversed-phase HPTLC technique was precise enough for the quantitation of PPN. However, a normal-phase HPTLC technique was more precise than a reversed-phase HPTLC technique.
The results of robustness evaluation for a normal-phase HPTLC technique are included in
Table 4. The errors values in terms of % RSD for PPN after introducing small modifications in the sustainable solvent system were predicted as 0.36–0.551% for a normal-phase HPTLC technique. The R
f values were found to be in the range of 0.28–0.30 for a normal-phase HPTLC technique. The % RSD values of PPN were predicted as 1.14–1.15% for a reversed-phase HPTLC technique (
Table S4). The R
f values were recorded in the range of 0.51–0.53 for a reversed-phase HPTLC technique. The minor changes in R
f values and lower % RSD values indicated that normal/reversed-phase HPTLC densitometry technique was robust for the quantitation of PPN. However, a normal-phase HPTLC technique was more robust than a reversed-phase HPTLC technique.
The sensitivity of PPN for normal/reversed-phase densitometry technique was calculated in terms of LOD and LOQ and results for a normal-phase HPTLC are included in
Table 1. The LOD and LOQ values of PPN were calculated as 3.38 ± 0.04 and 10.14 ± 0.12 ng band
−1, respectively for a normal-phase HPTLC technique. However, the LOD and LOQ values of PPN were recorded as 17.10 ± 0.82 and 51.30 ± 2.46 ng band
−1, respectively for a reversed-phase HPTLC technique (
Table S1). The recorded data of LOD and LOQ showed that normal/reversed-phase HPTLC technique was sensitive enough for the quantitation of PPN. However, a normal-phase HPTLC technique was highly sensitive than a reversed-phase HPTLC technique.
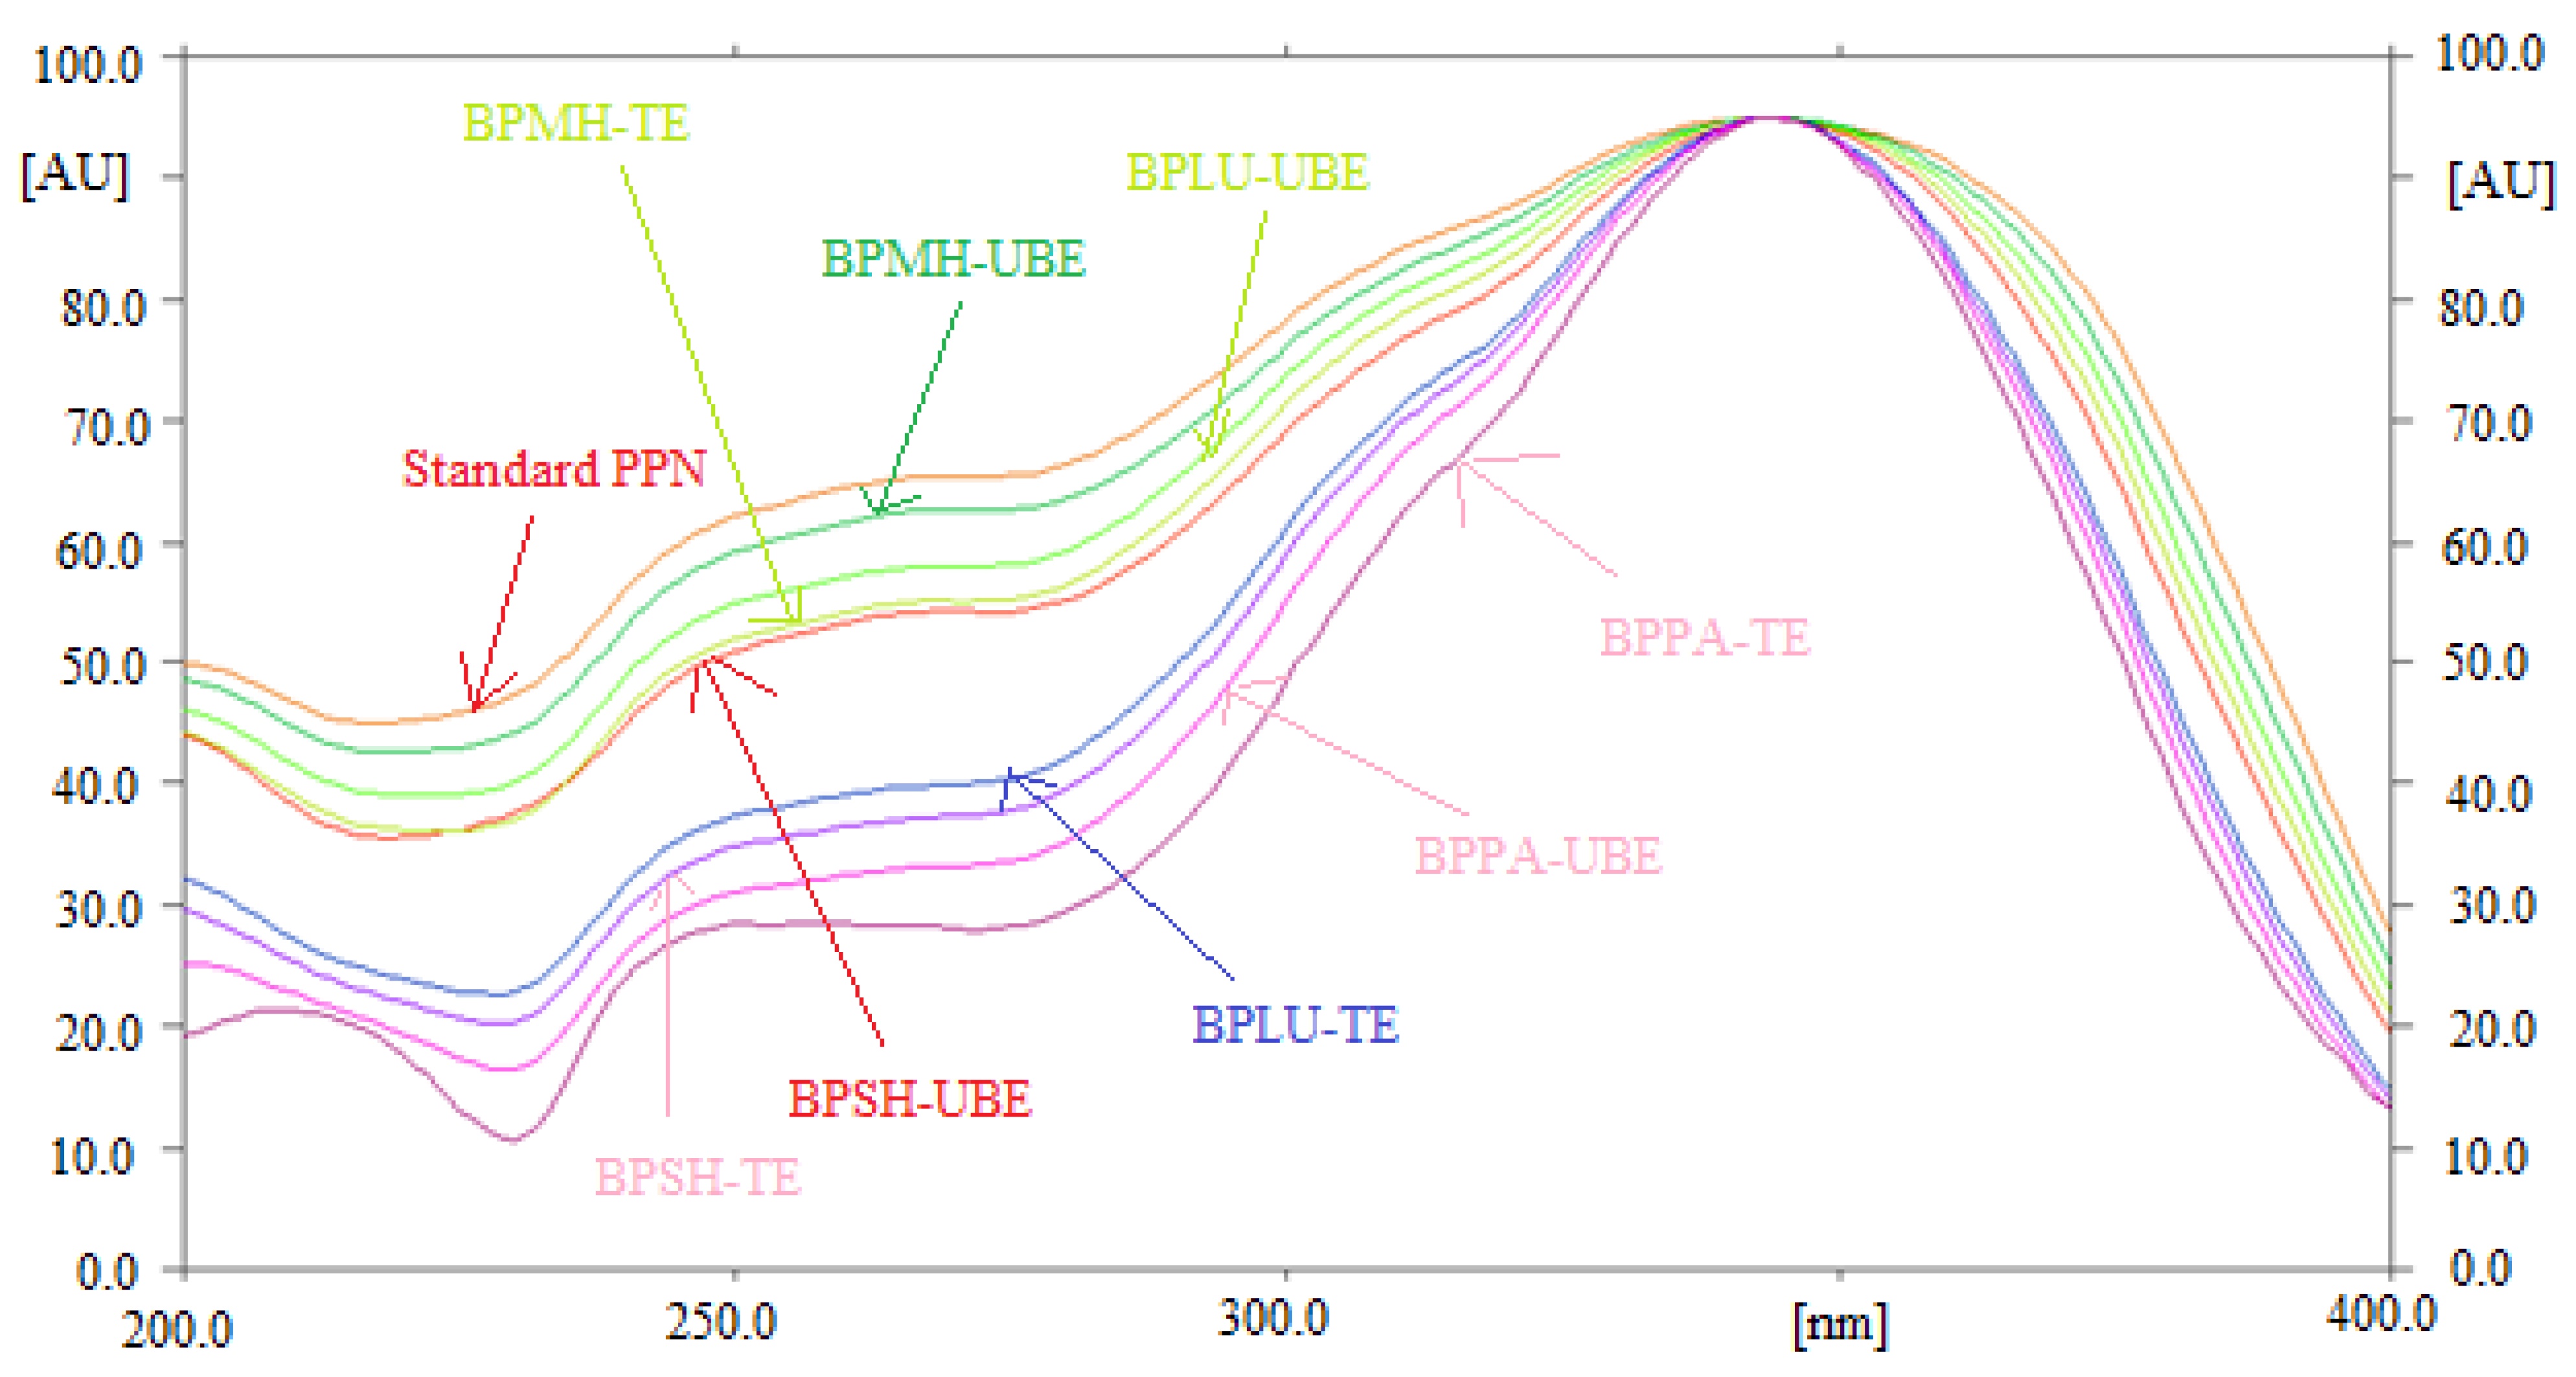
The specificity and the peak purity of PPN for normal/reversed-phase HPTLC technique was determined by comparing the overlaid UV absorption spectra of PPN in TE and UBE of BPMH, BPLU, BPSH, and BPPA with that of standard PPN. The overlaid UV absorption spectra of standard PPN and PPN in TE and UBE of BPMH, BPLU, BPSH, and BPPA are included in
Figure 3. The maximum densitometry peak of PPN in standard and TE and UBE of BPMH, BPLU, BPSH, and BPPA were obtained at λ
max = 343 nm. The identical UV absorption spectra, R
f values, and λ
max of PPN in standard and TE and UBE of BPMH, BPLU, BPSH, and BPPA indicated specificity and peak purity of PPN for the quantitation of PPN using normal/reversed-phase HPTLC technique.
2.3. Application of Normal/Reversed-Phase HPTLC Technique for Quantitation of PPN in Different Brands of Black Pepper
The sustainable normal/reversed-phase HPTLC densitometry technique could be an alternative of routine analytical techniques for the quantitation of PPN in TE and UBE of BPMH, BPLU, BPSH, and BPPA. The densitometry peaks of PPN from TE and UBE of BPMH, BPLU, BPSH, and BPPA were identified by comparing their single TLC band at R
f = 0.29 ± 0.01 with that of a standard PPN for normal/reversed-phase HPTLC technique. The representative normal-phase HPTLC densitogram of PPN in TE of BPMH is included in
Figure 4. The densitogram in
Figure 4 presented the similar peak of PPN with that of standard PPN for normal-phase HPTLC technique. The densitometry peak of PPN in TE of BPMH was also found to be similar with that of standard PPN for reversed-phase HPTLC technique (
Figure S3).
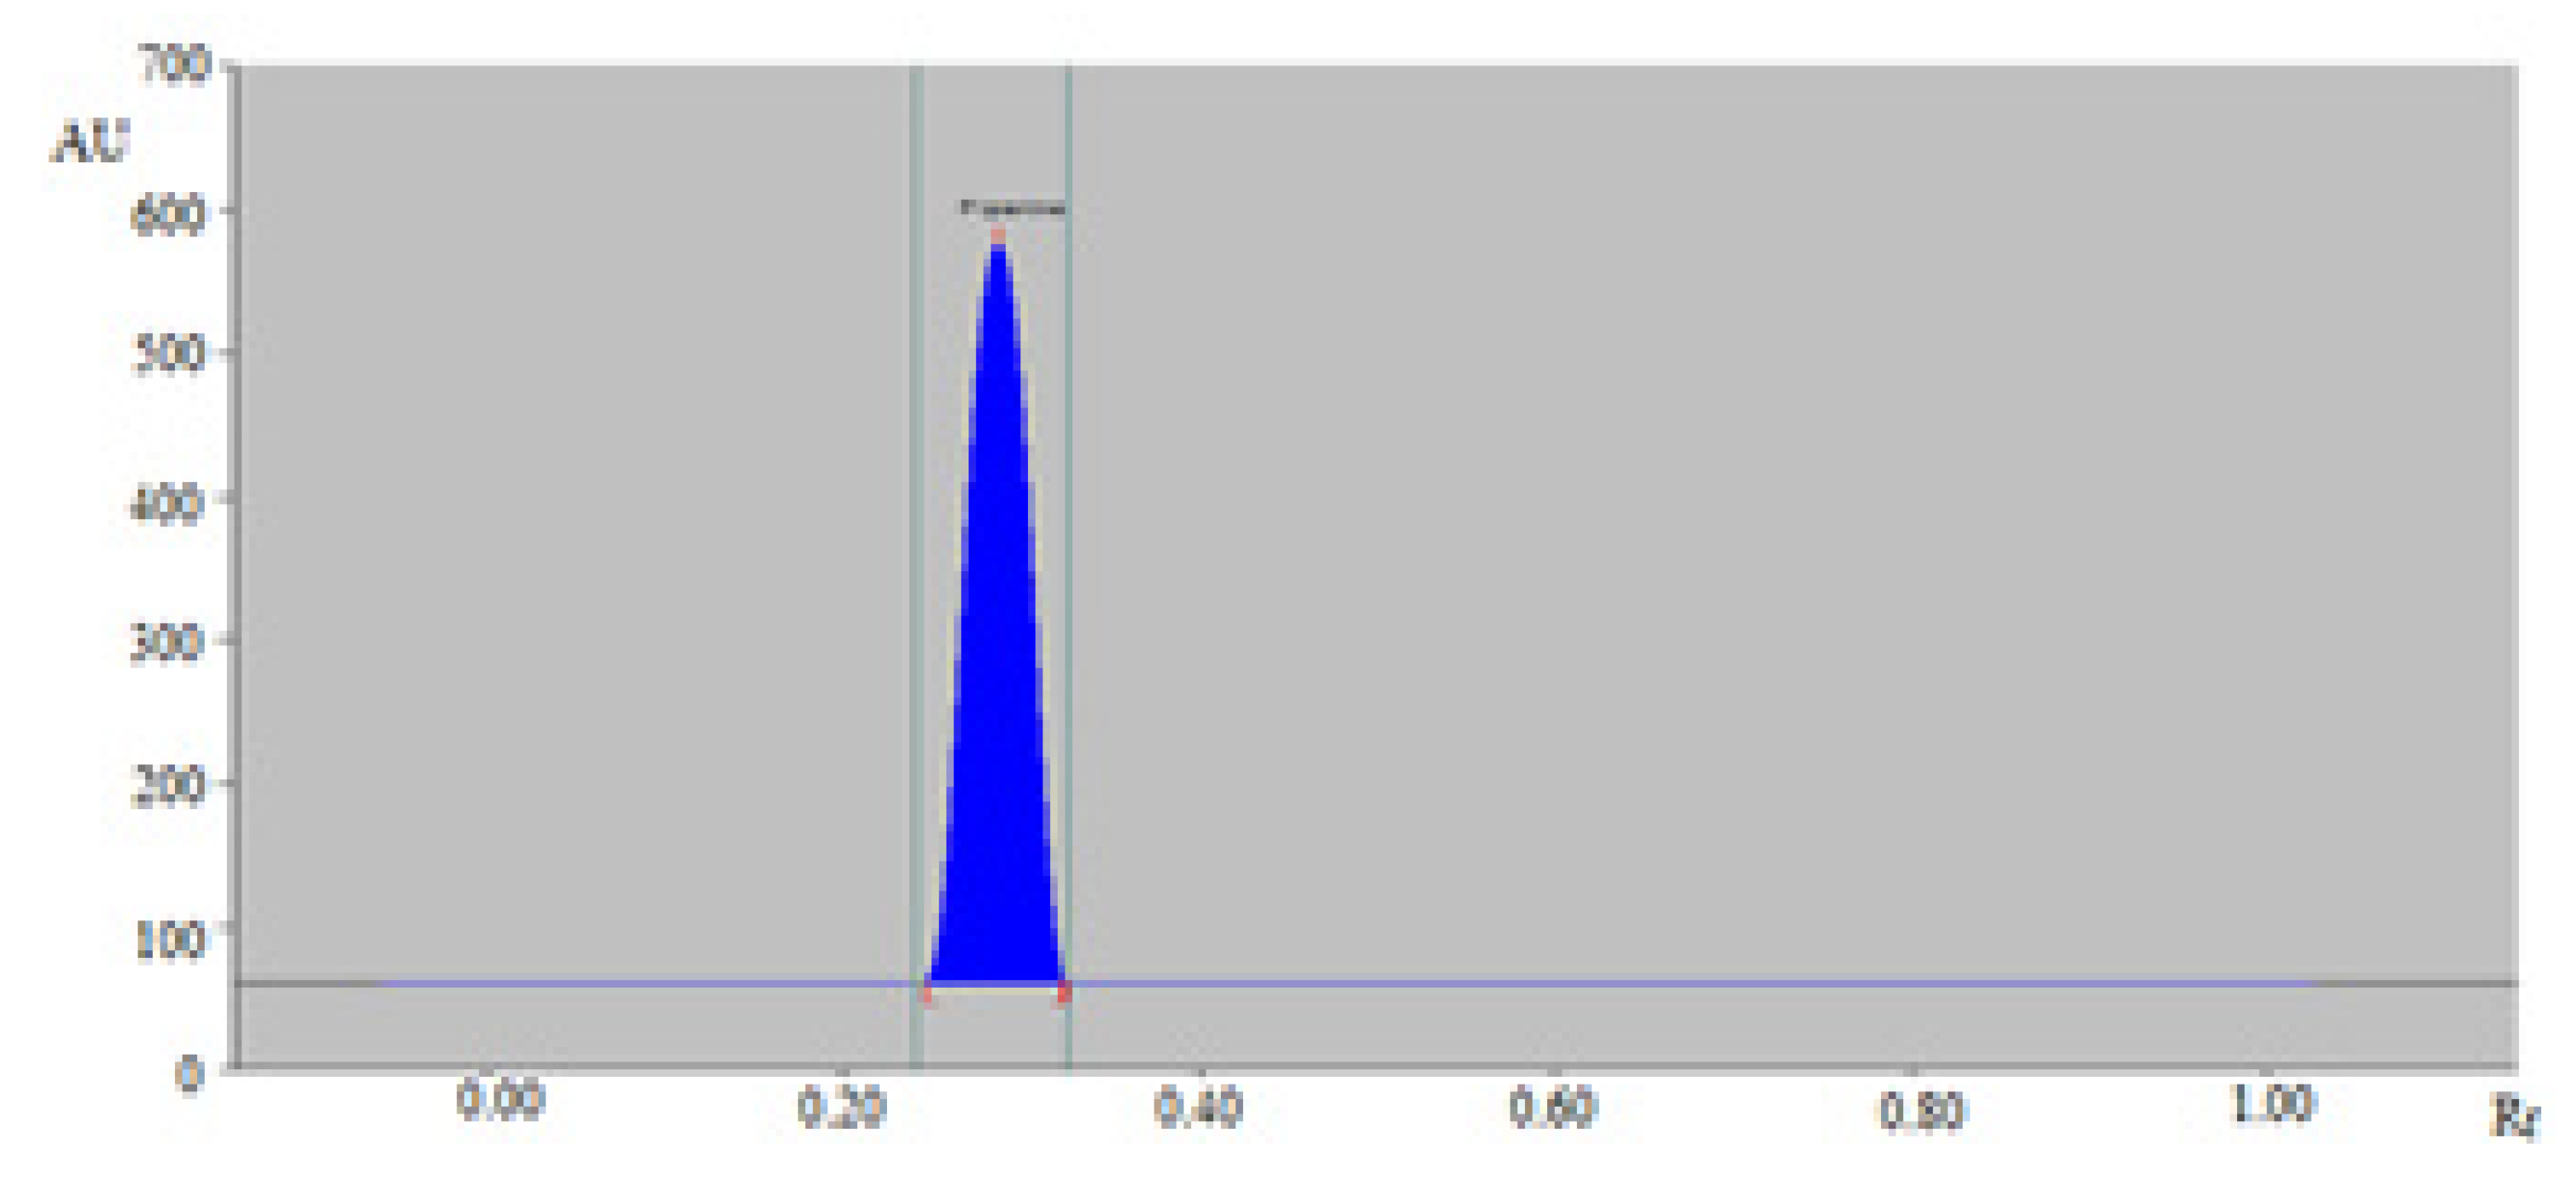
The representative normal-phase HPTLC densitogram of PPN in TE of BPPA is included in
Figure 5. The densitograms in
Figure 5 also presented the similar peak of PPN with that of standard PPN for normal-phase HPTLC technique. The densitometry peak of PPN in TE of BPPA was also found to be similar with that of standard PPN for reversed-phase HPTLC technique (
Figure S4).
The content (mg g
−1) of PPN in TE and UBE of BPMH, BPLU, BPSH, and BPPA was calculated from the UCC of PPN and results for normal-phase HPTLC are included in
Table 5. The content of PPN in TE of BPMH, BPLU, BPSH, and BPPA was calculated as 309.53 ± 6.61, 304.97 ± 6.14, 282.82 ± 5.18, and 232.73 ± 4.26 mg g
−1, respectively using a normal-phase HPTLC technique. However, the content of PPN in UBE of BPMH, BPLU, BPSH, and BPPA was recorded as 318.52 ± 6.76, 314.60 ± 6.70, 292.41 ± 5.23, and 241.82 ± 4.35 mg g
−1, respectively using a normal-phase HPTLC technique. The content of PPN in TE of BPMH, BPLU, BPSH, and BPPA was calculated as 133.67 ± 3.02, 128.37 ± 2.95, 122.46 ± 2.64, and 119.72 ± 2.52 mg g
−1, respectively using a reversed-phase HPTLC technique (
Table S5). However, the content of PPN in UBE of BPMH, BPLU, BPSH, and BPPA was recorded as 143.84 ± 3.86, 142.29 ± 2.98, 128.39 ± 2.70, and 125.56 ± 2.57 mg g
−1, respectively using a reversed-phase HPTLC technique (
Table S5). The content of PPN was found to be highest in TE and UBE of BPMH brand using normal/reversed-phase HPTLC technique. Generally, the content of PPN was found to be significantly higher in UBE of all four brands of black pepper compared to their TE (
p < 0.05). Based on such observations, the UBE procedure for the extraction of PPN in different brands of black pepper has been proposed as superior over its TE procedure.
The content of PPN in South African black pepper, commercial black pepper, and black pepper extract has been reported as 43, 32, and 274 mg g
−1, respectively using an HPLC technique [
17]. In another report, the content of PPN was recorded in the range of 324–497 mg g
−1 using an HPLC technique [
18]. The content of PPN analyzed using an HPLC technique was varied from 15.30–17.80 mg g
−1 in black pepper collected from different regions of Kerala, India [
21]. In another research, the content of PPN in black pepper sample was recorded in the range of 2.10–12.50 mg g
−1 using an HPTLC technique [
36]. Based on the reported data of PPN in black pepper, it was found that the content of PPN varied from country to country and regions to regions. In our research, the high contents of PPN were obtained in all four different brands of black pepper in TE and UBE using normal/reversed-phase HPTLC technique. These observations suggested that the black pepper brands available in Saudi Arabia have high contents of PPN. Overall, these results indicated that normal/reversed-phase HPTLC technique can be efficiently utilized for the quantitation of PPN in the wide variety of food and pharmaceutical products having PPN as one of the ingredients. However, a normal-phase HPTLC technique was found to be much better than a reversed-phase HPTLC technique for the quantitation of PPN in different brands of black pepper.
2.4. Assessment of Greenness Profiles
As stated previously, various metric approaches (NEMI, AES, GAPI, RGB, and AGREE) have been utilized for the assessment of greenness of the analytical procedures, but only AGREE utilized all 12 principles of GAC for the assessment of greenness [
43,
46,
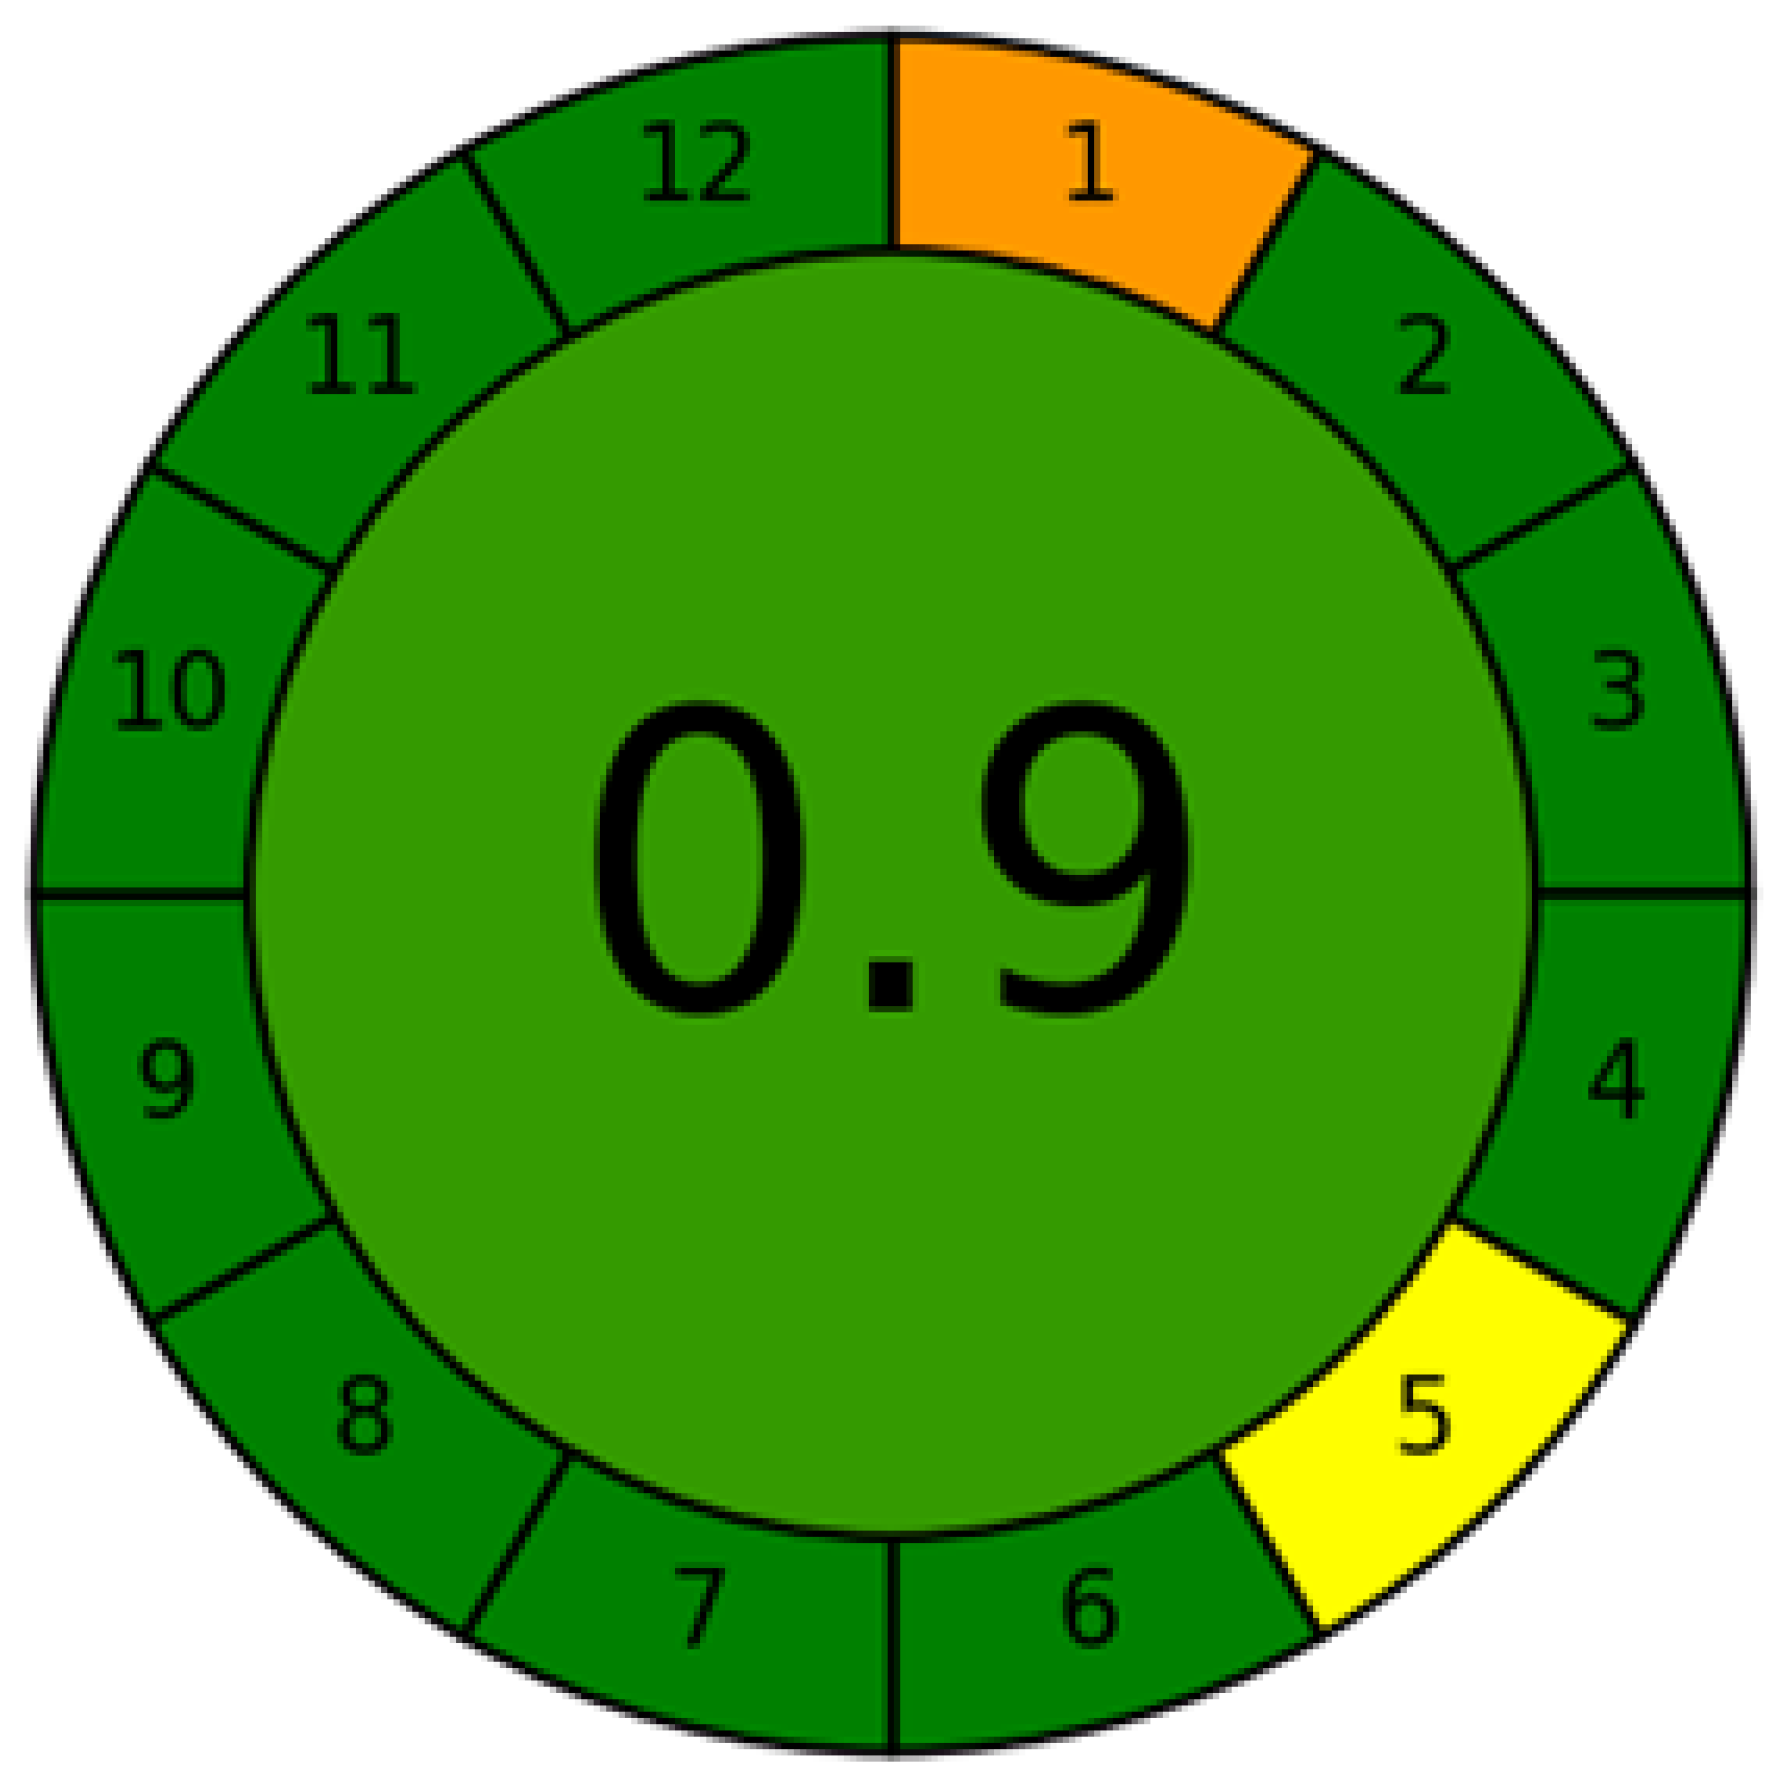
47]. Hence, in this work, the greenness of normal/reversed-phase HPTLC technique was evaluated using AGREE: The Analytical Greenness Calculator (version 0.5, Gdansk University of Technology, Gdansk, Poland, 2020). The eco-scale values for 12 different principles of GAC are assigned from 0.0–1.0 according to this metric approach [
47]. The eco-scale values for a normal-phase HPTLC technique by considering 12 principles of GAC is presented in
Figure 6. The eco-scale value for normal-phase HPTLC technique was predicted as 0.90. The eco-scale value for a reversed-phase HPTLC technique was also predicted as 0.90 (
Figure S5). The eco-scale value of greater than 0.75 indicated the excellent greenness. The eco-scale value of 0.50 is reported as an acceptable value for greenness. An eco-scale value of less than 0.50 is associated with the unacceptability of the greenness of analytical assay [
47]. Based on the eco-scale values obtained in this work, normal/reversed-phase HPTLC technique was found to have excellent greenness for the quantitation of PPN.
2.5. Literature Comparison
The normal/reversed-phase HPTLC technique for the quantitation of PPN was compared with various HPTLC techniques reported for the quantitation of PPN. The comparison results are included in
Table 6. Three different parameters such as linearity range, accuracy, and precision of normal/reversed-phase HPTLC technique were compared with reported HPTLC techniques. The linearity range of a reported HPTLC technique was found to be 10–50 µg mL
−1, which was much inferior to present normal-phase HPTLC (linearity range = 10–1000 ng band
−1) and reversed-phase HPTLC (linearity range = 50–500 ng band
−1) techniques [
33]. However, the accuracy and precision of this technique were comparable to present normal/reversed-phase HPTLC technique.
The linearity range and accuracy of another HPTLC technique was also found to be inferior to present normal/reversed-phase HPTLC technique [
34]. The accuracy of two reported HPTLC techniques was found to be much lower than present normal/reversed-phase HPTLC technique [
35,
37]. However, the linearity range of these techniques was better than present reversed-phase HPTLC technique but inferior than present normal-phase HPTLC technique [
35,
37]. Overall, normal/reversed-phase HPTLC technique was found to be superior than most of the reported HPTLC techniques for the quantitation of PPN. However, a normal-phase HPTLC technique was found to be highly sensitive than all reported HPTLC techniques for the quantitation of PPN.


 ,
, 

