3.1. Analysis of Hydrometeorology
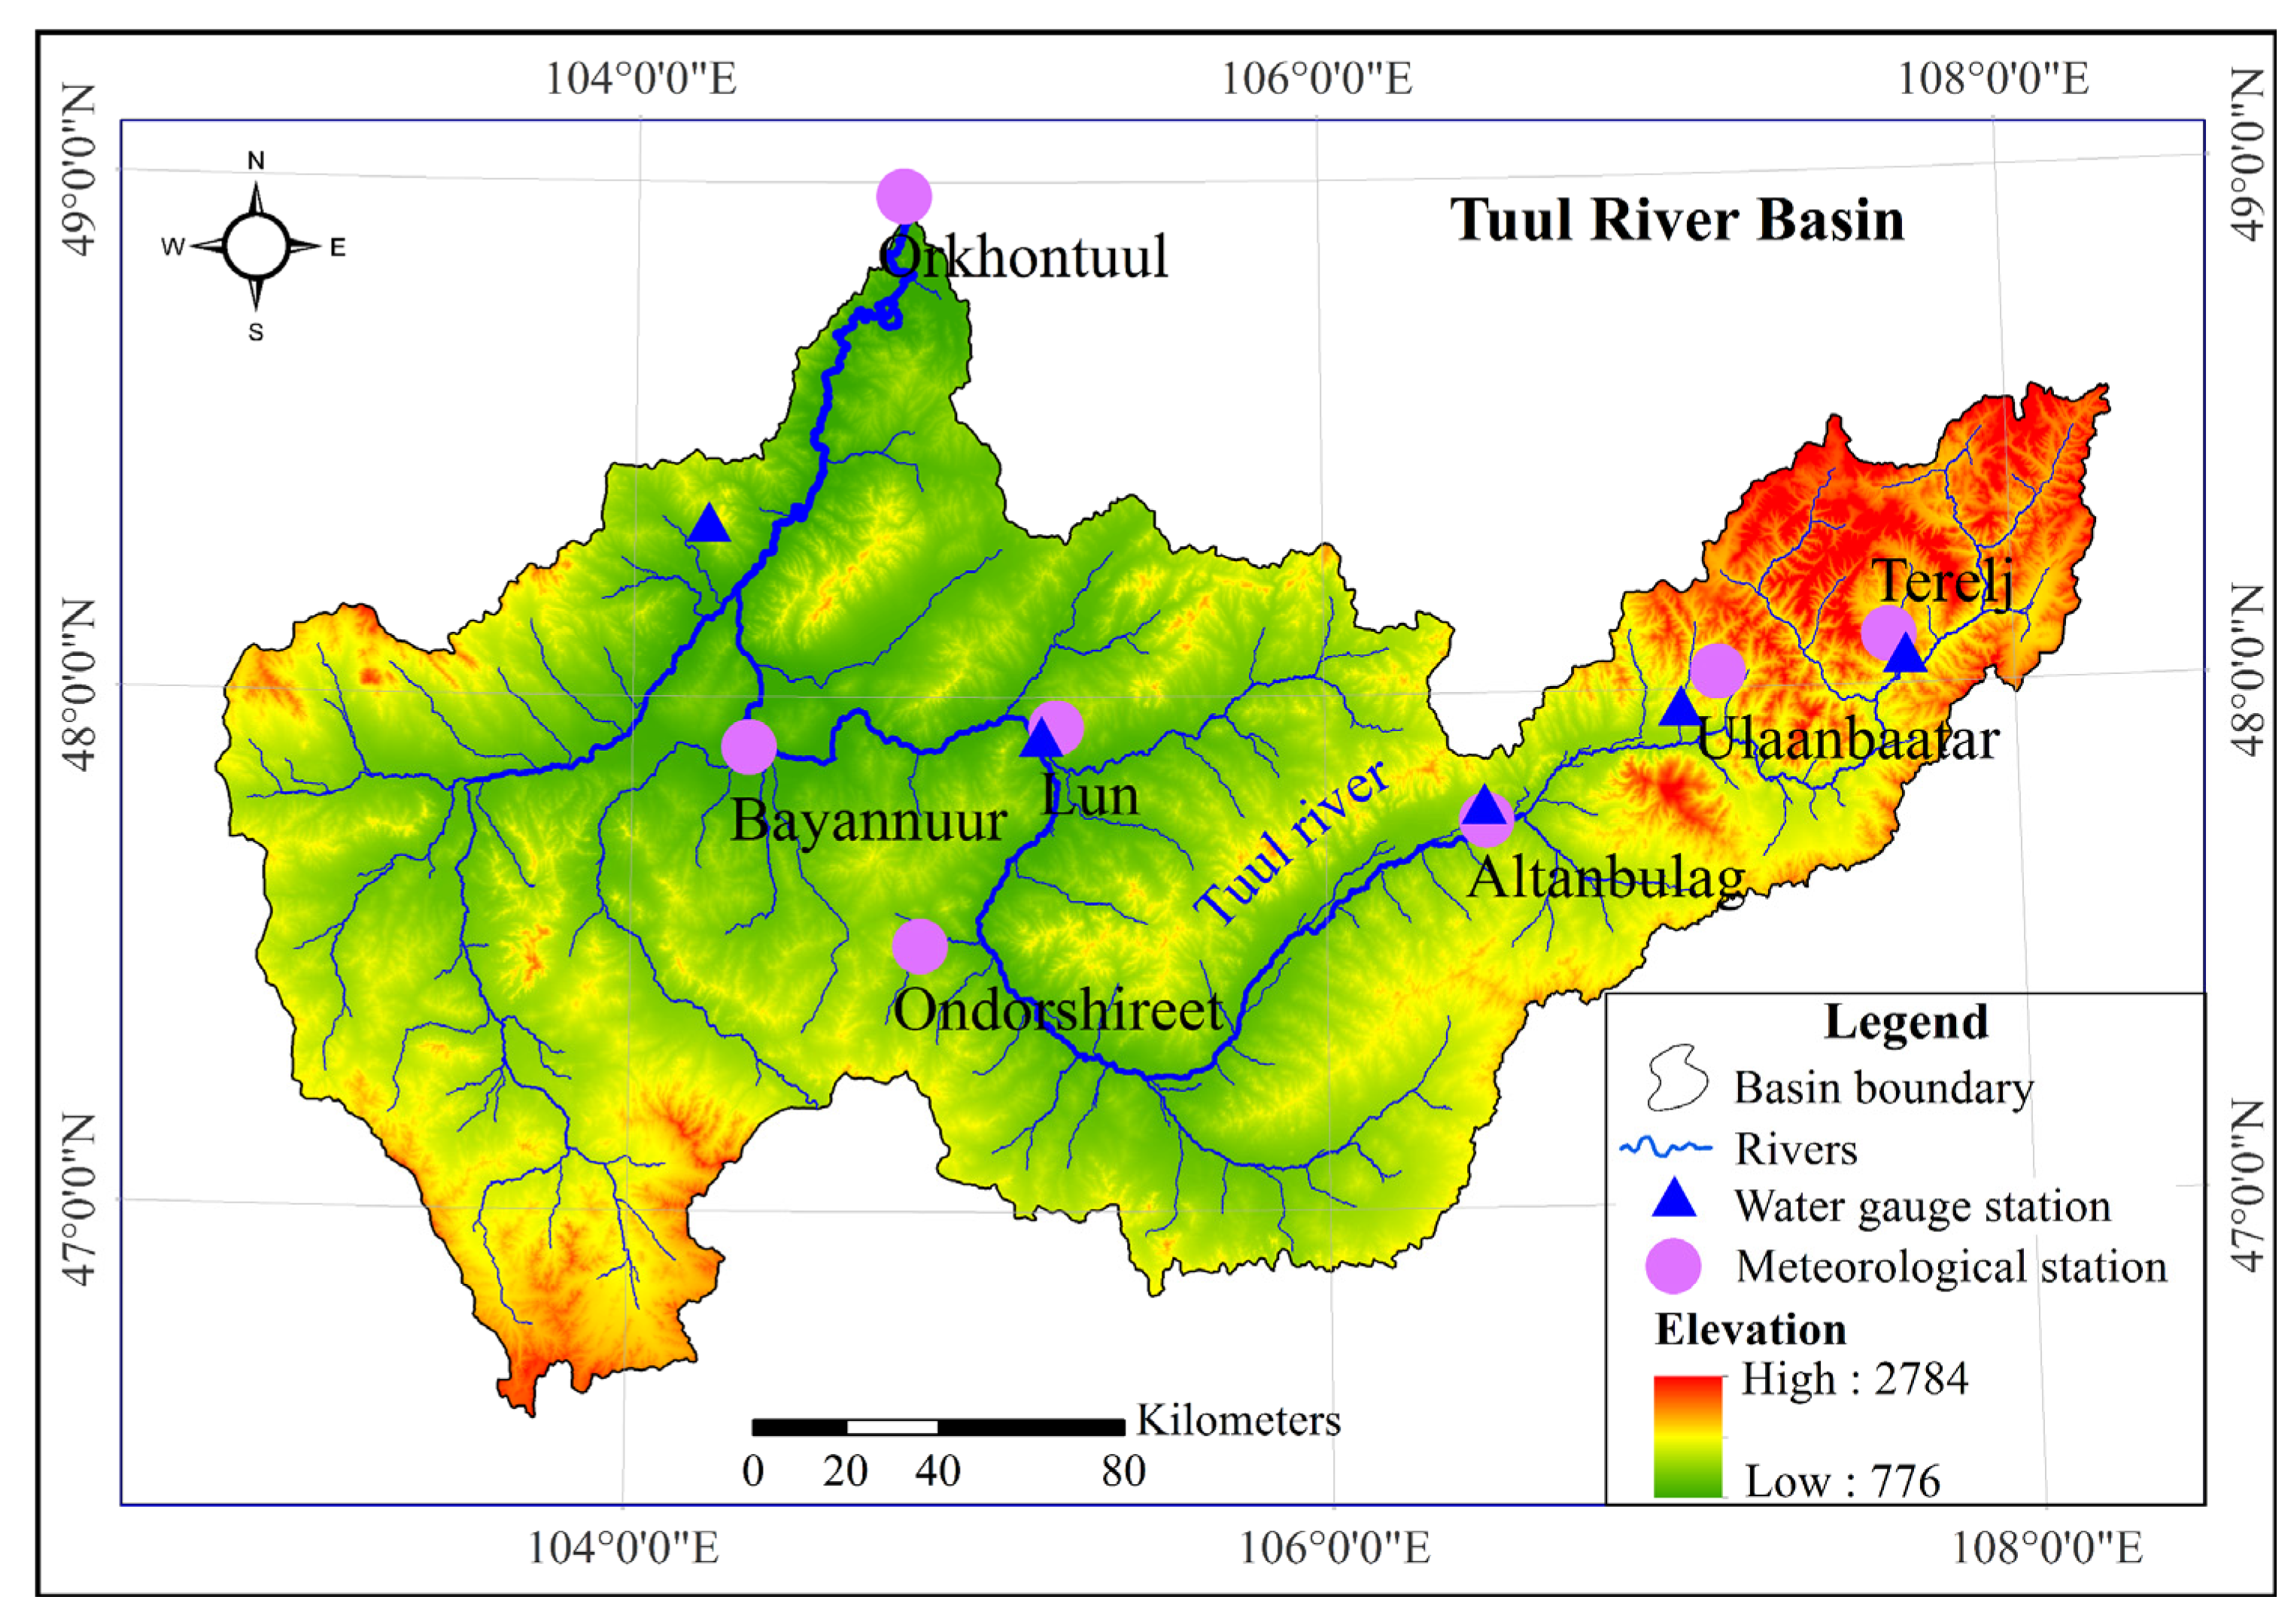
The mean annual air temperature, mean annual precipitation, and average annual river discharge were calculated for each station on the study site by determining the long-term conditions of hydrometeorology change. Additionally, the correlations were calculated using the mean value of hydrological variables.
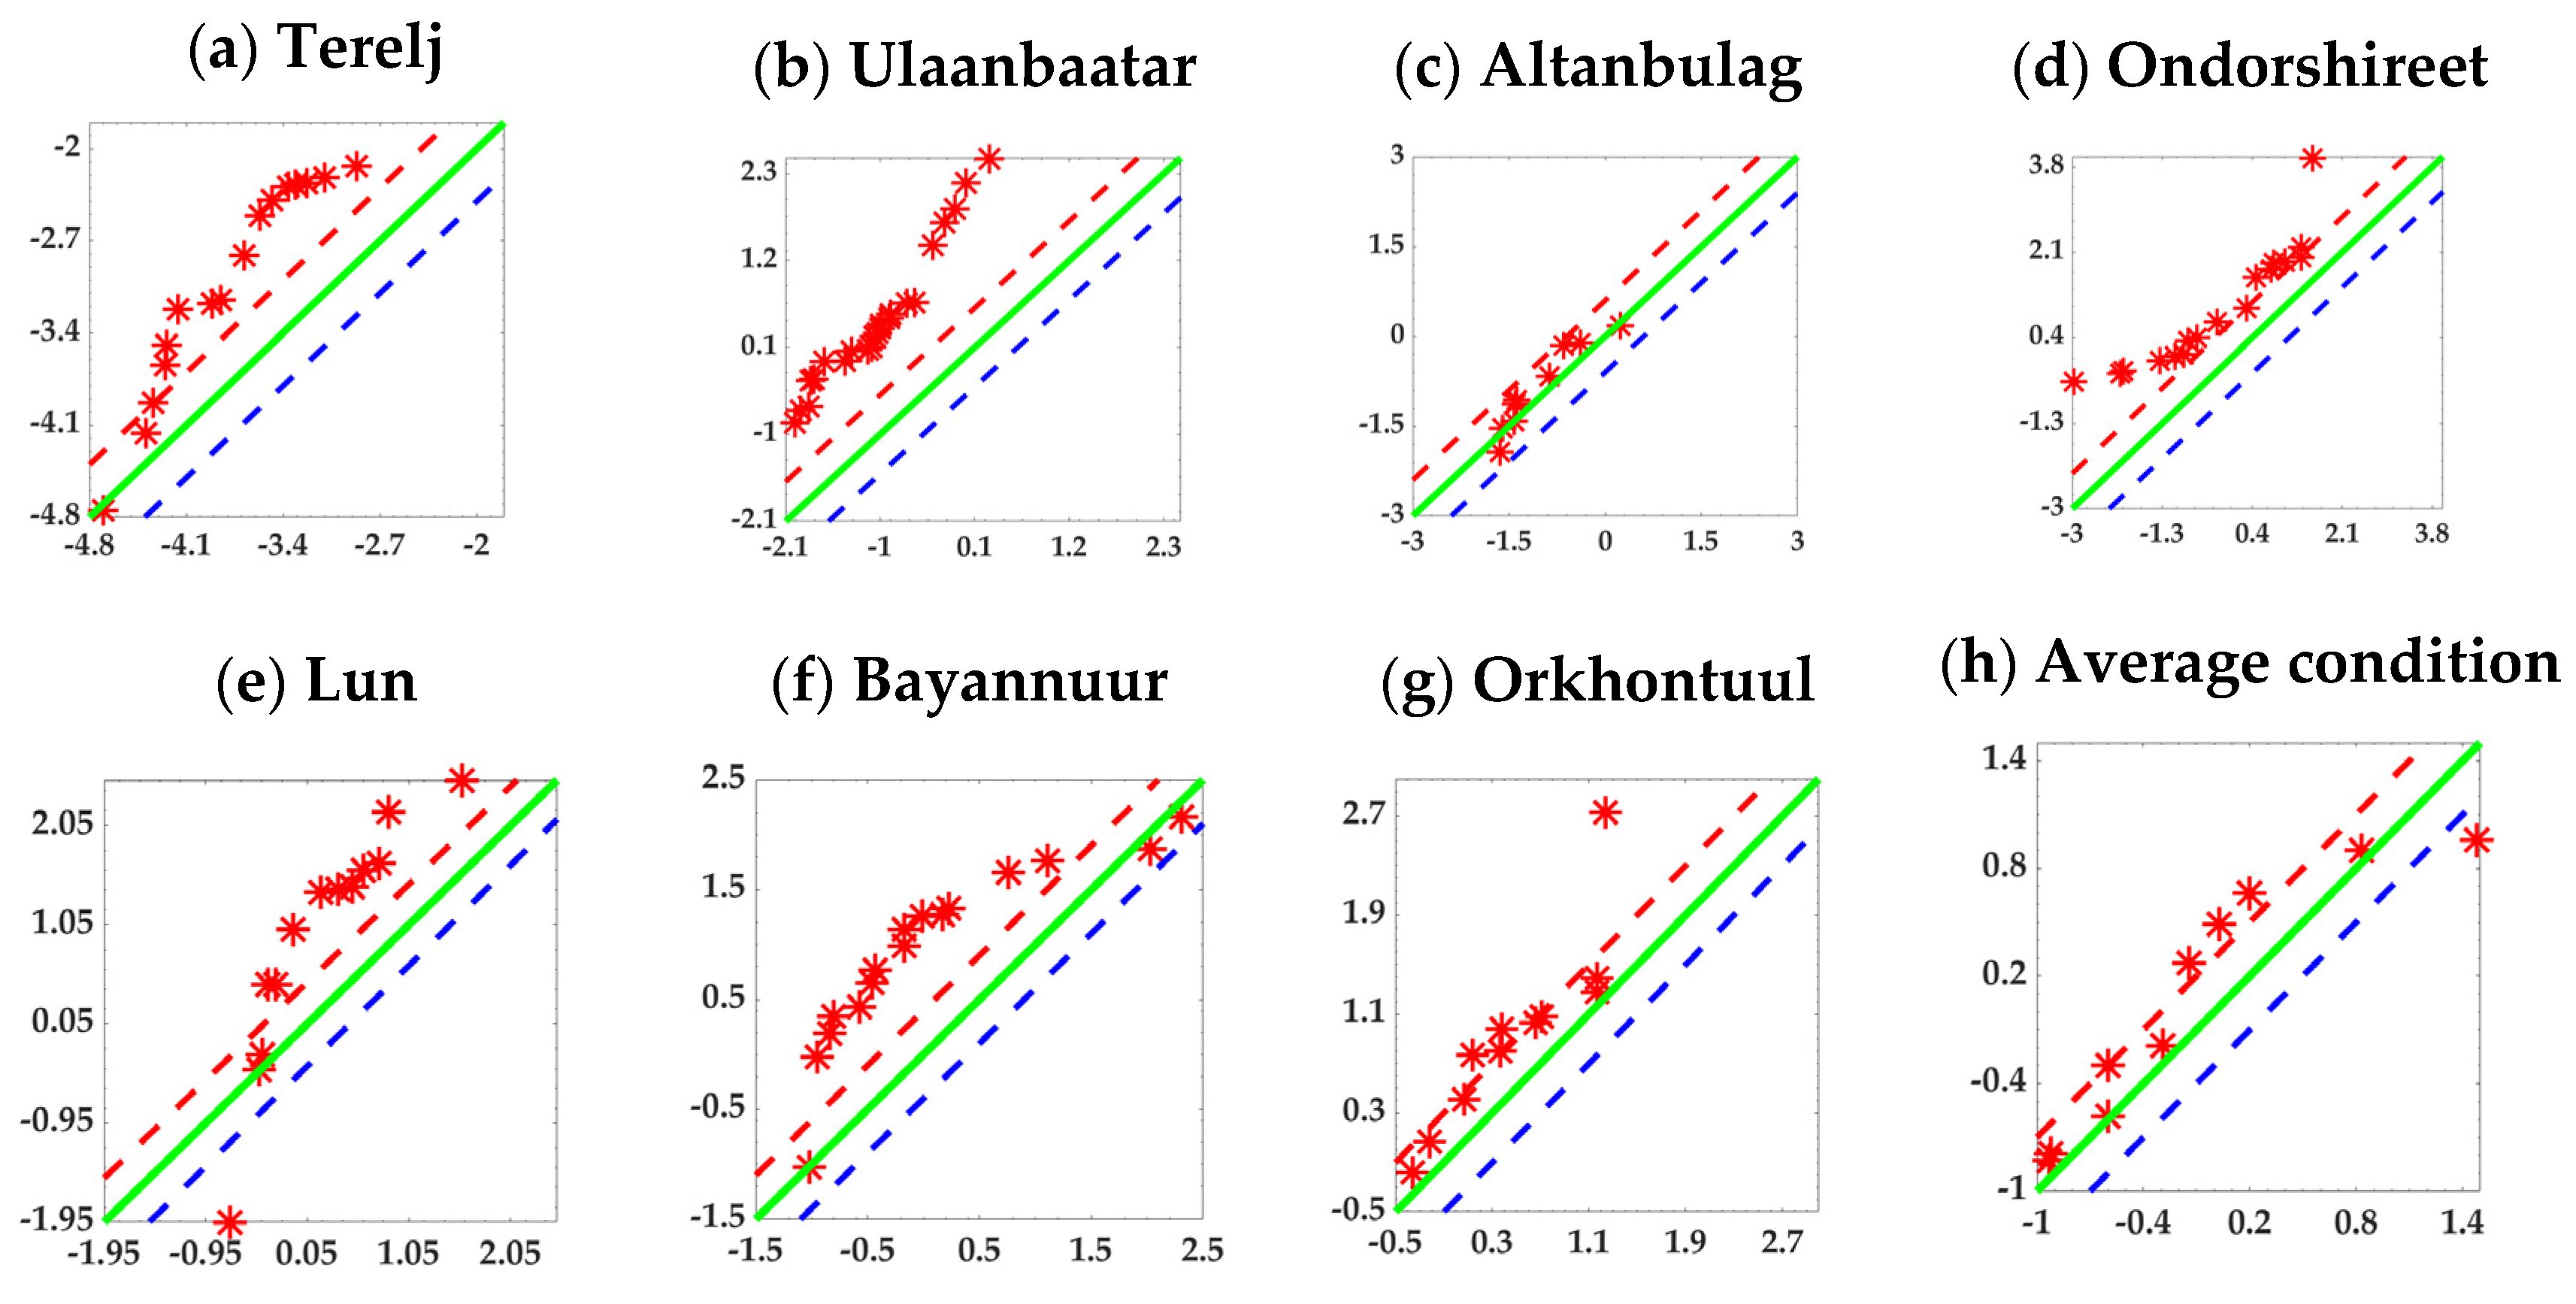
The result shows that the ITAM curve annual air temperature reveals a statistically sharp increasing trend in Ulaanbaatar from 1979 to 2019 (
φ = 14.11), a statistically abrupt increasing trend in Terelj from 1979 to 2019 (
φ = 5.08), a statistically upward trend in Altanbulag from 1979 to 2019 (
φ = 2.82), a statistically sharp upward trend in Ondorshireet from 1979 to 2019 (
φ = 4.65), a statistically sharp upward trend in Lun from 1979 to 2019 (
φ = 3.29), a statistically increasing trend in Bayannuur from 1979 to 2019 (
φ = 4.25); in Orkhontuul, a statistically increasing trend was observed with (
φ = 4.75) from 1979 to 2019. An overall statistically significant upward trend was observed in the average (five stations) (
φ = 7.02) (
Figure 4). In the study period, the average annual air temperature rose from −1.5 °C to +0.3 °C (1.8 °C). This rise could have a direct and indirect significant effect on the ecohydrological processes of the arid and semiarid regions of Central Asia.
The trend analysis of annual air temperature for all stations is presented in
Table 1.
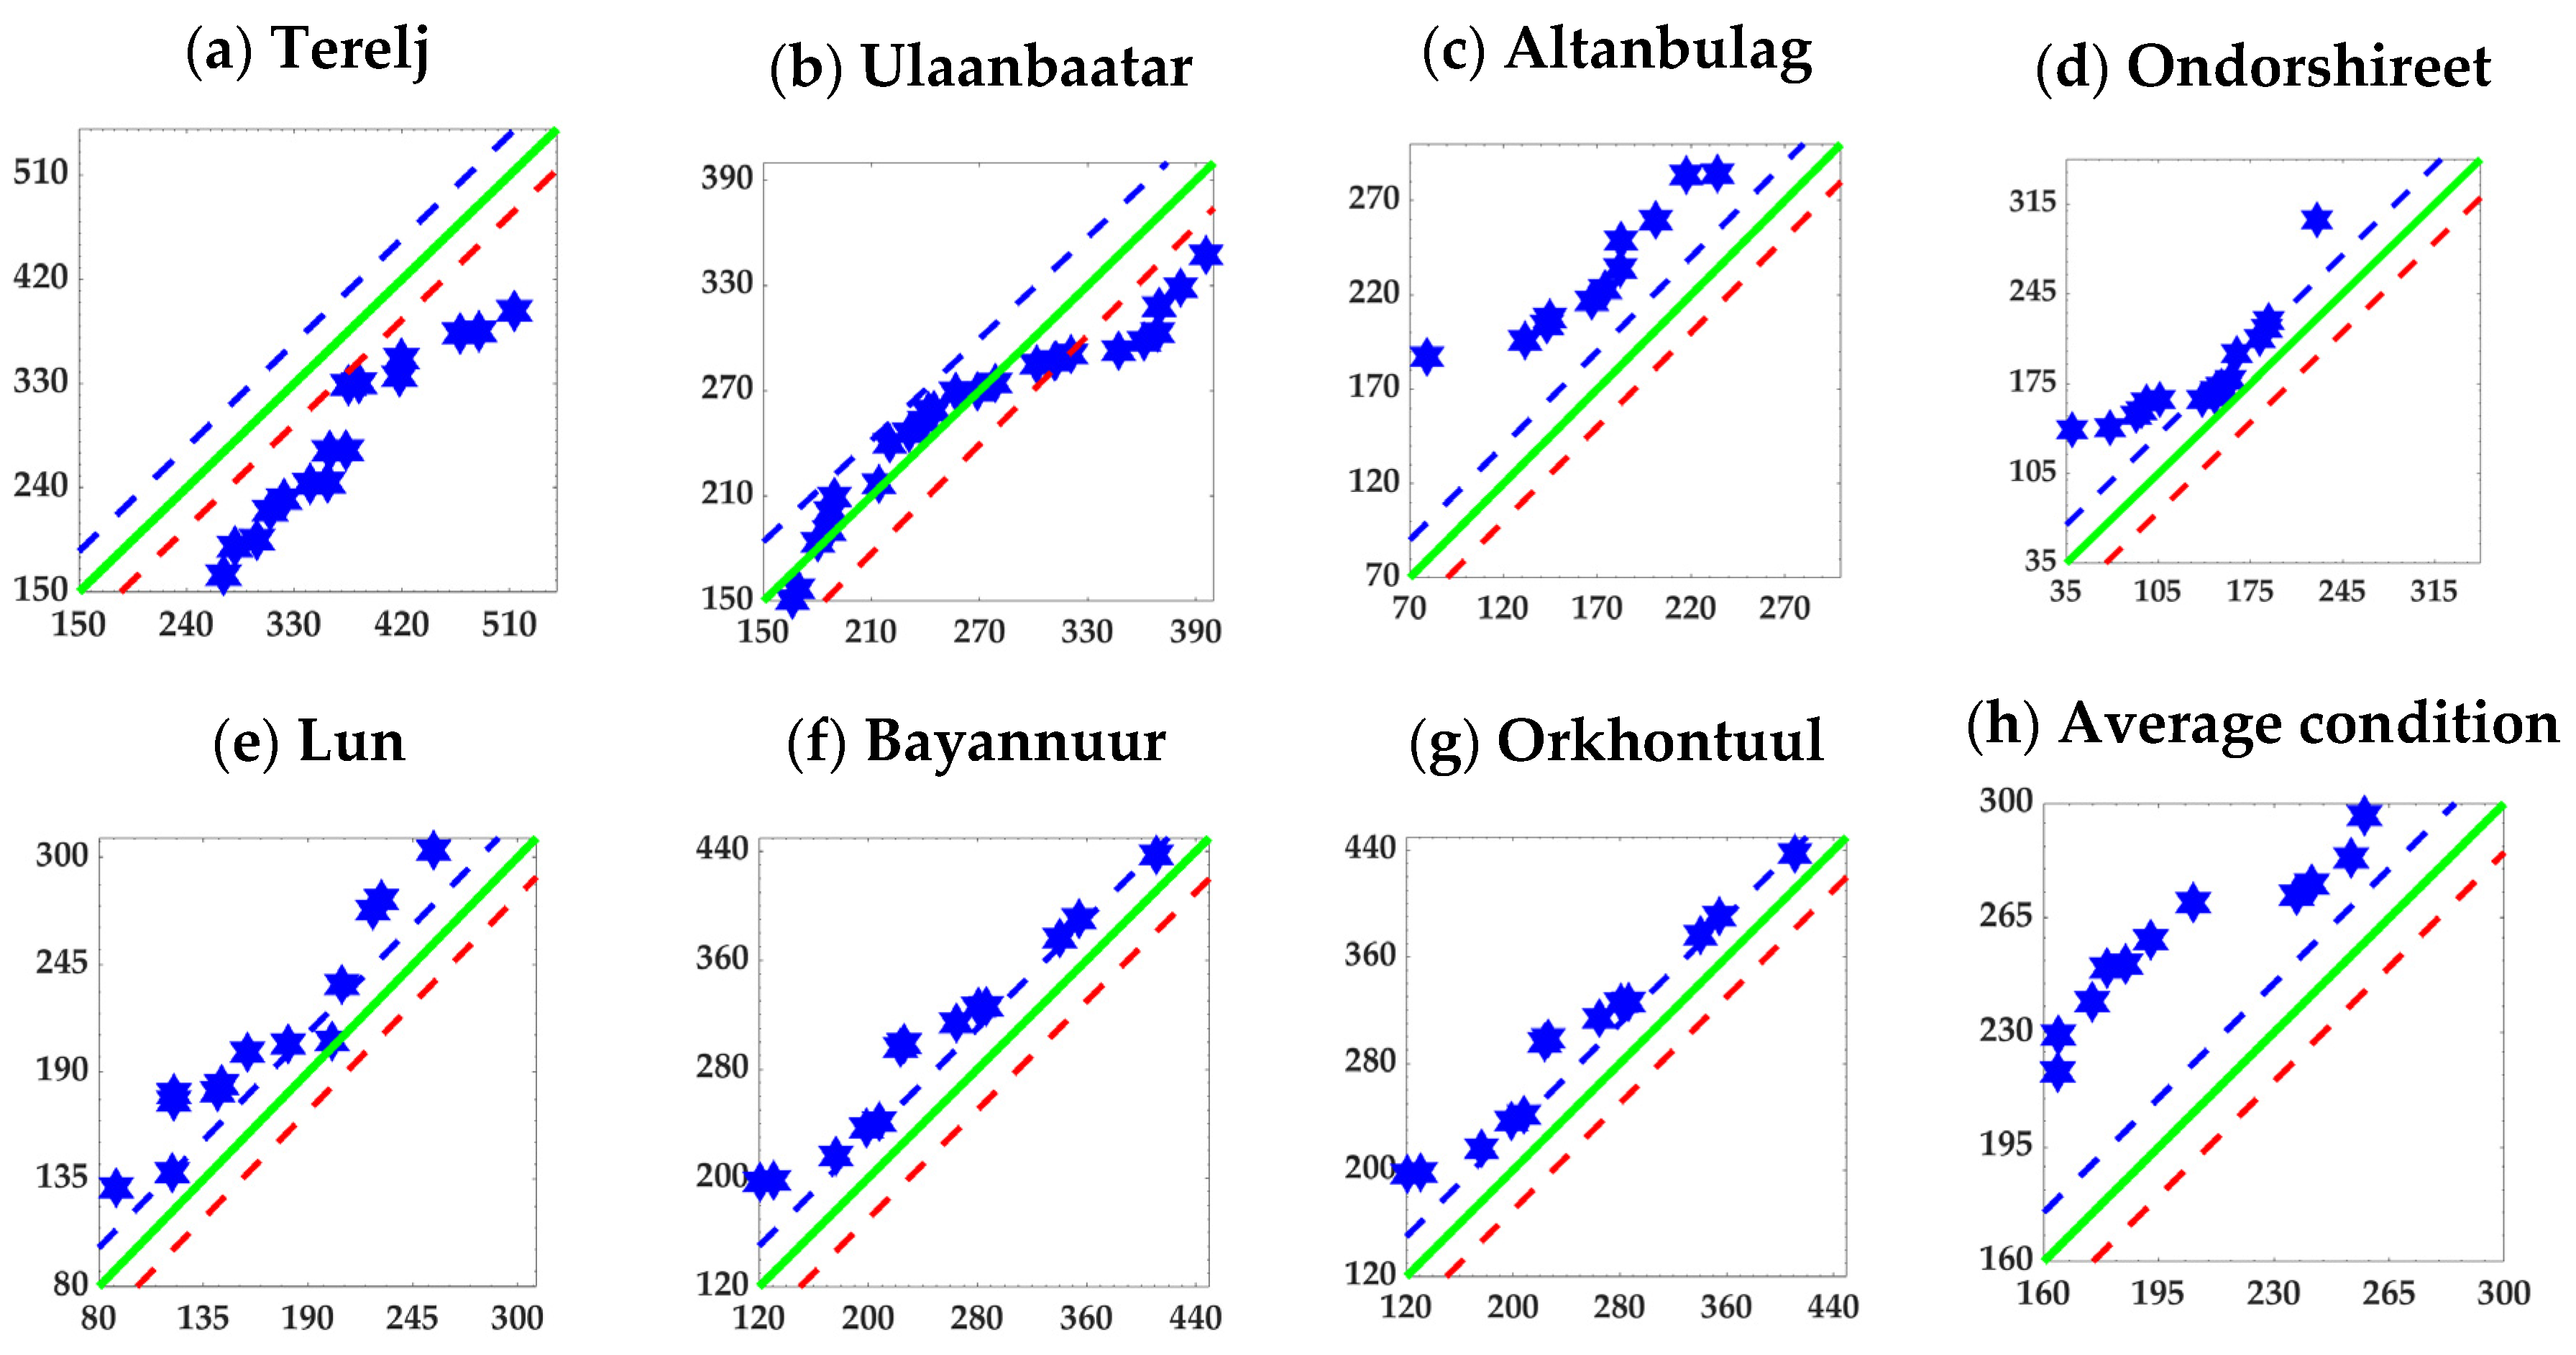
The ITAM curve for mean annual precipitation reveals a statistically sharp downward trend in Terelj from 1979 to 2019 (
φ = −2.44); in Ulaanbaatar from 1979 to 2019 a downward trend (
φ = −0.49); a statistically increasing trend observed in Altanbulag (
φ = 1.7) and Ondorshireet from 1979 to 2019 (
φ = 1.17); a decreasing trend in Lun (
φ = −0.27); and increasing trend was observed in Bayannuur from 1979 to 2019 (
φ = 1.38); in Orkhontuul, an upward trend was obtained (
φ = 0.96). Overall, a slightly increasing trend was observed at the average condition (
φ = 0.60) (
Figure 5). In the study period, the mean annual precipitation was 238 mm and the change was not significant.
The annual trend analysis of precipitation at all stations is presented in
Table 2.
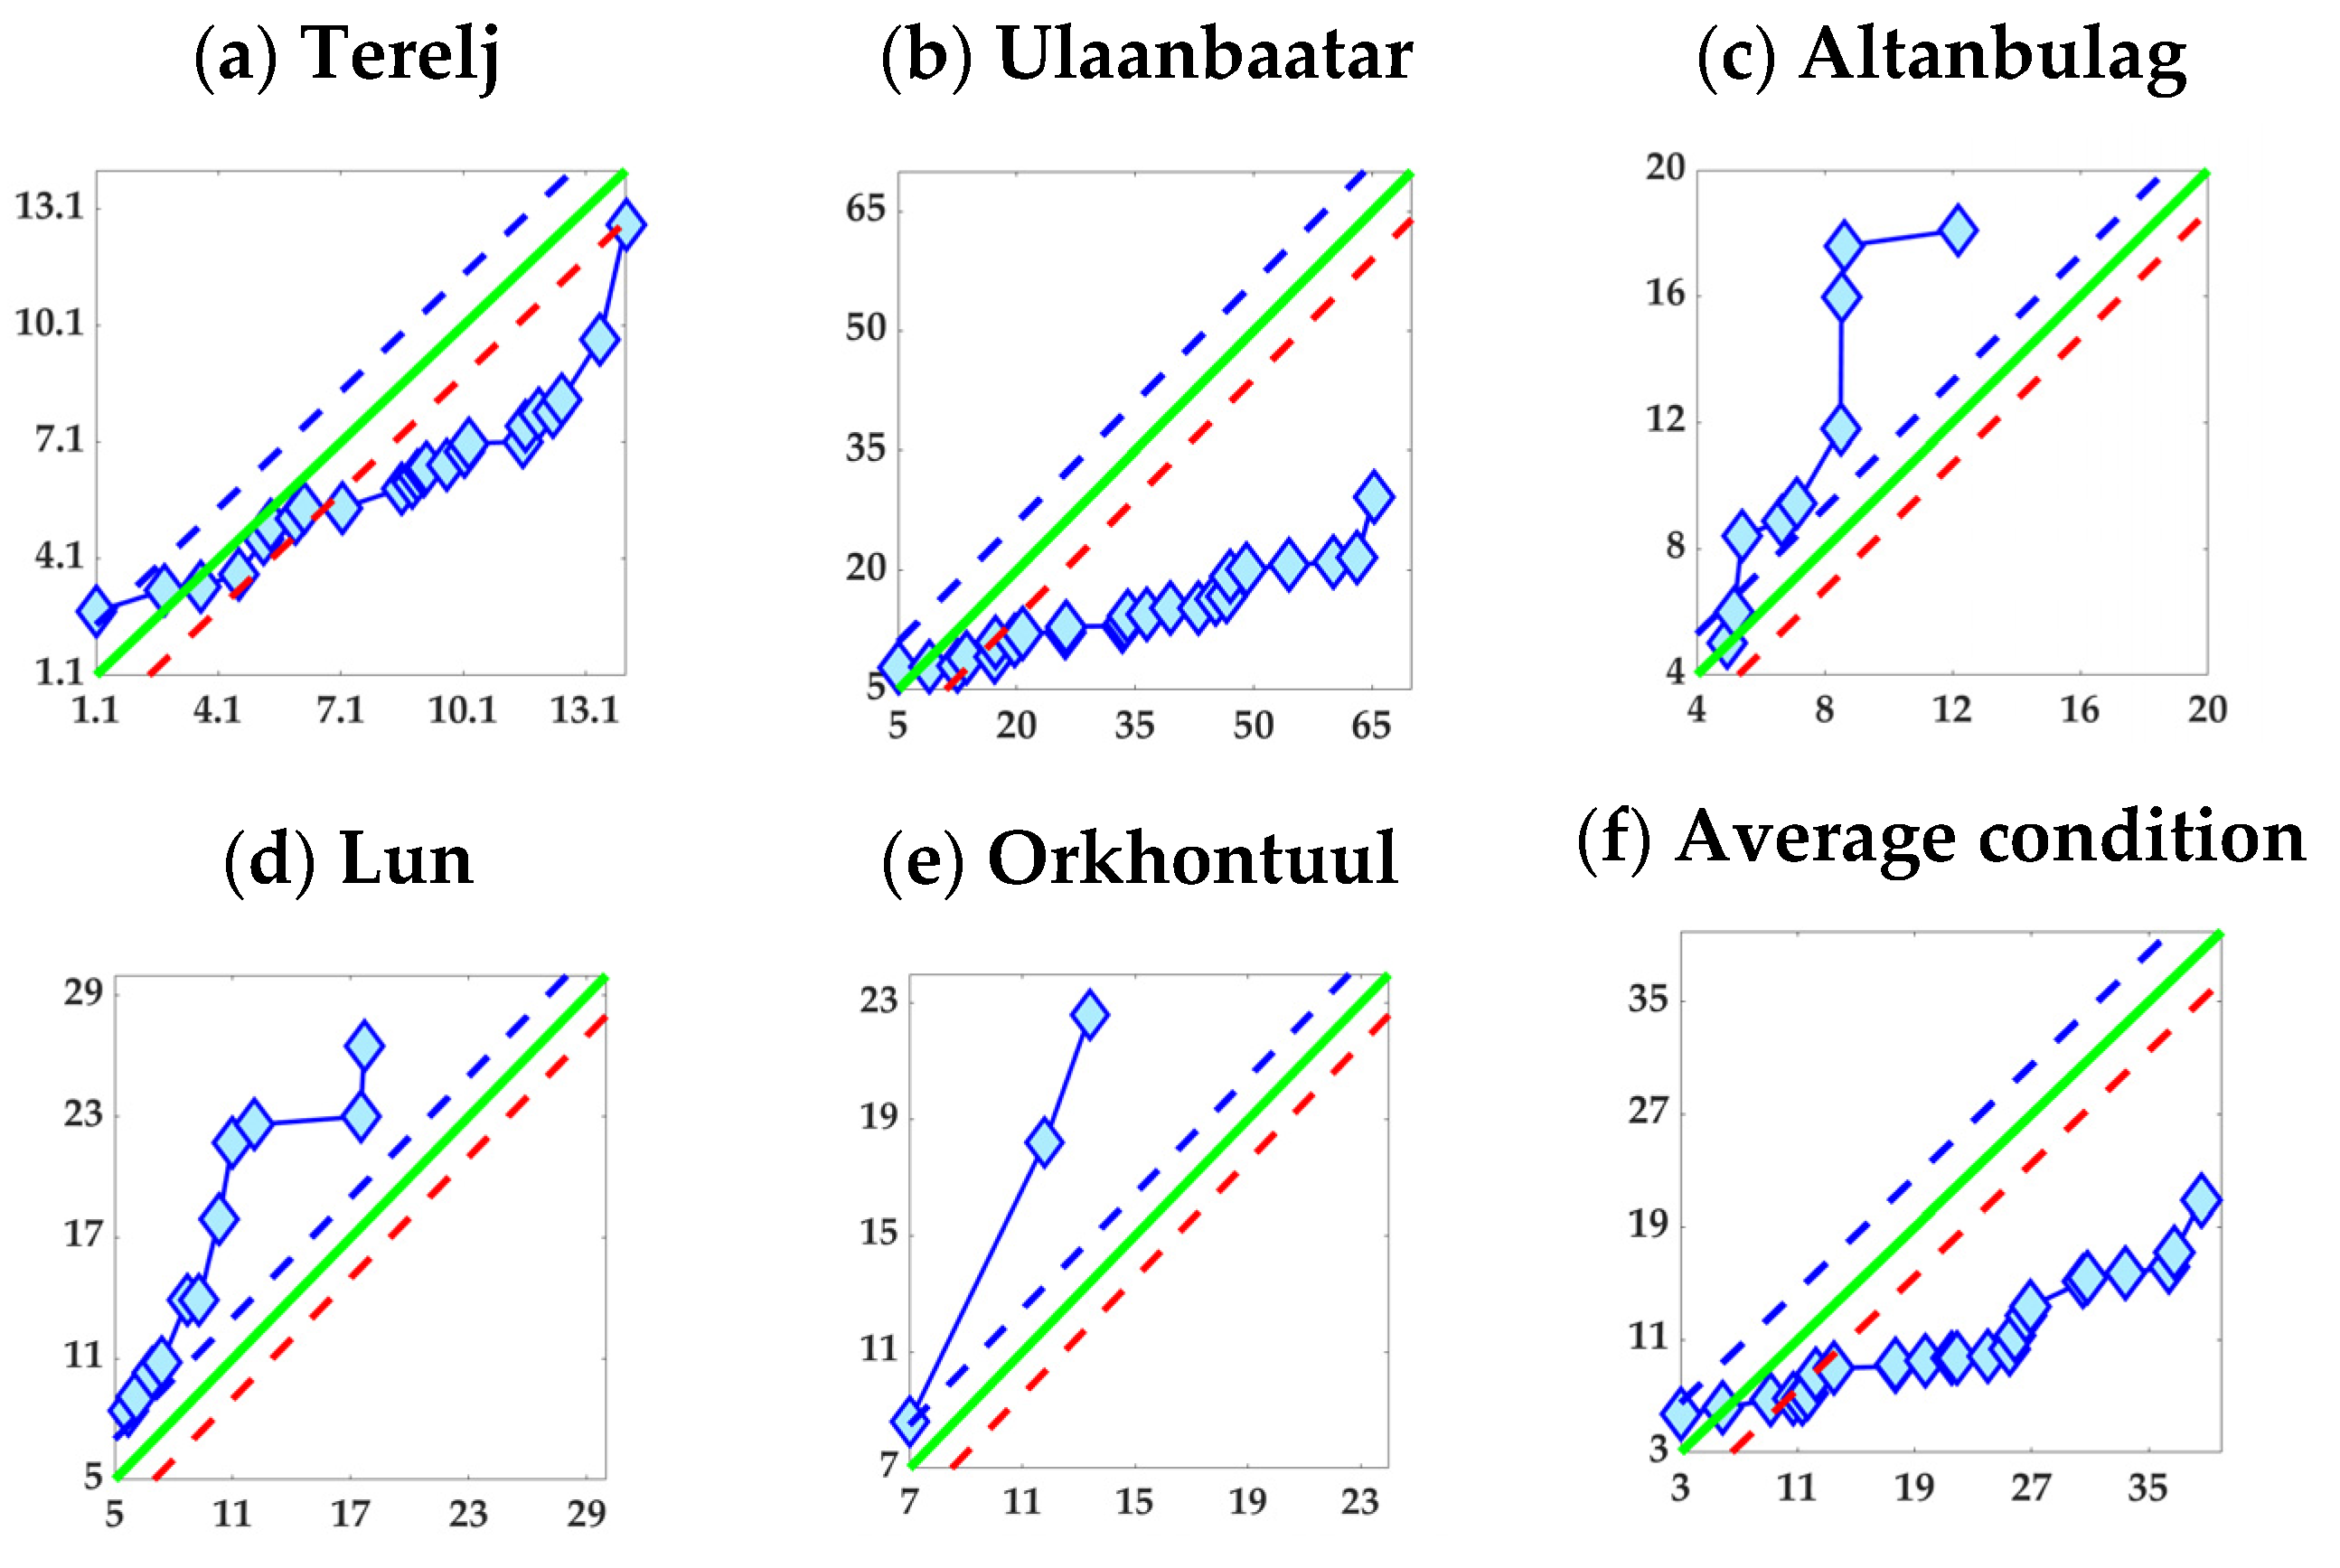
From 1989 to 2019, the ITAM curve mean annual river streamflow shows a statistically sharp downward trend in Terelj (
φ = −2.72), decreasing trend was observed in Ulaanbaatar (
φ = −5.63), and increasing trend was obtained at the Altanbulag, Orkhontuul, and Lun stations: (
φ = 5.34), (
φ = 5.07), and (
φ = 3.42), respectively. Overall, the average value for discharge shows a slightly increasing trend (
φ = −0.92) (
Figure 6).
The annual trend analysis of river discharge for all stations is presented in
Table 3.
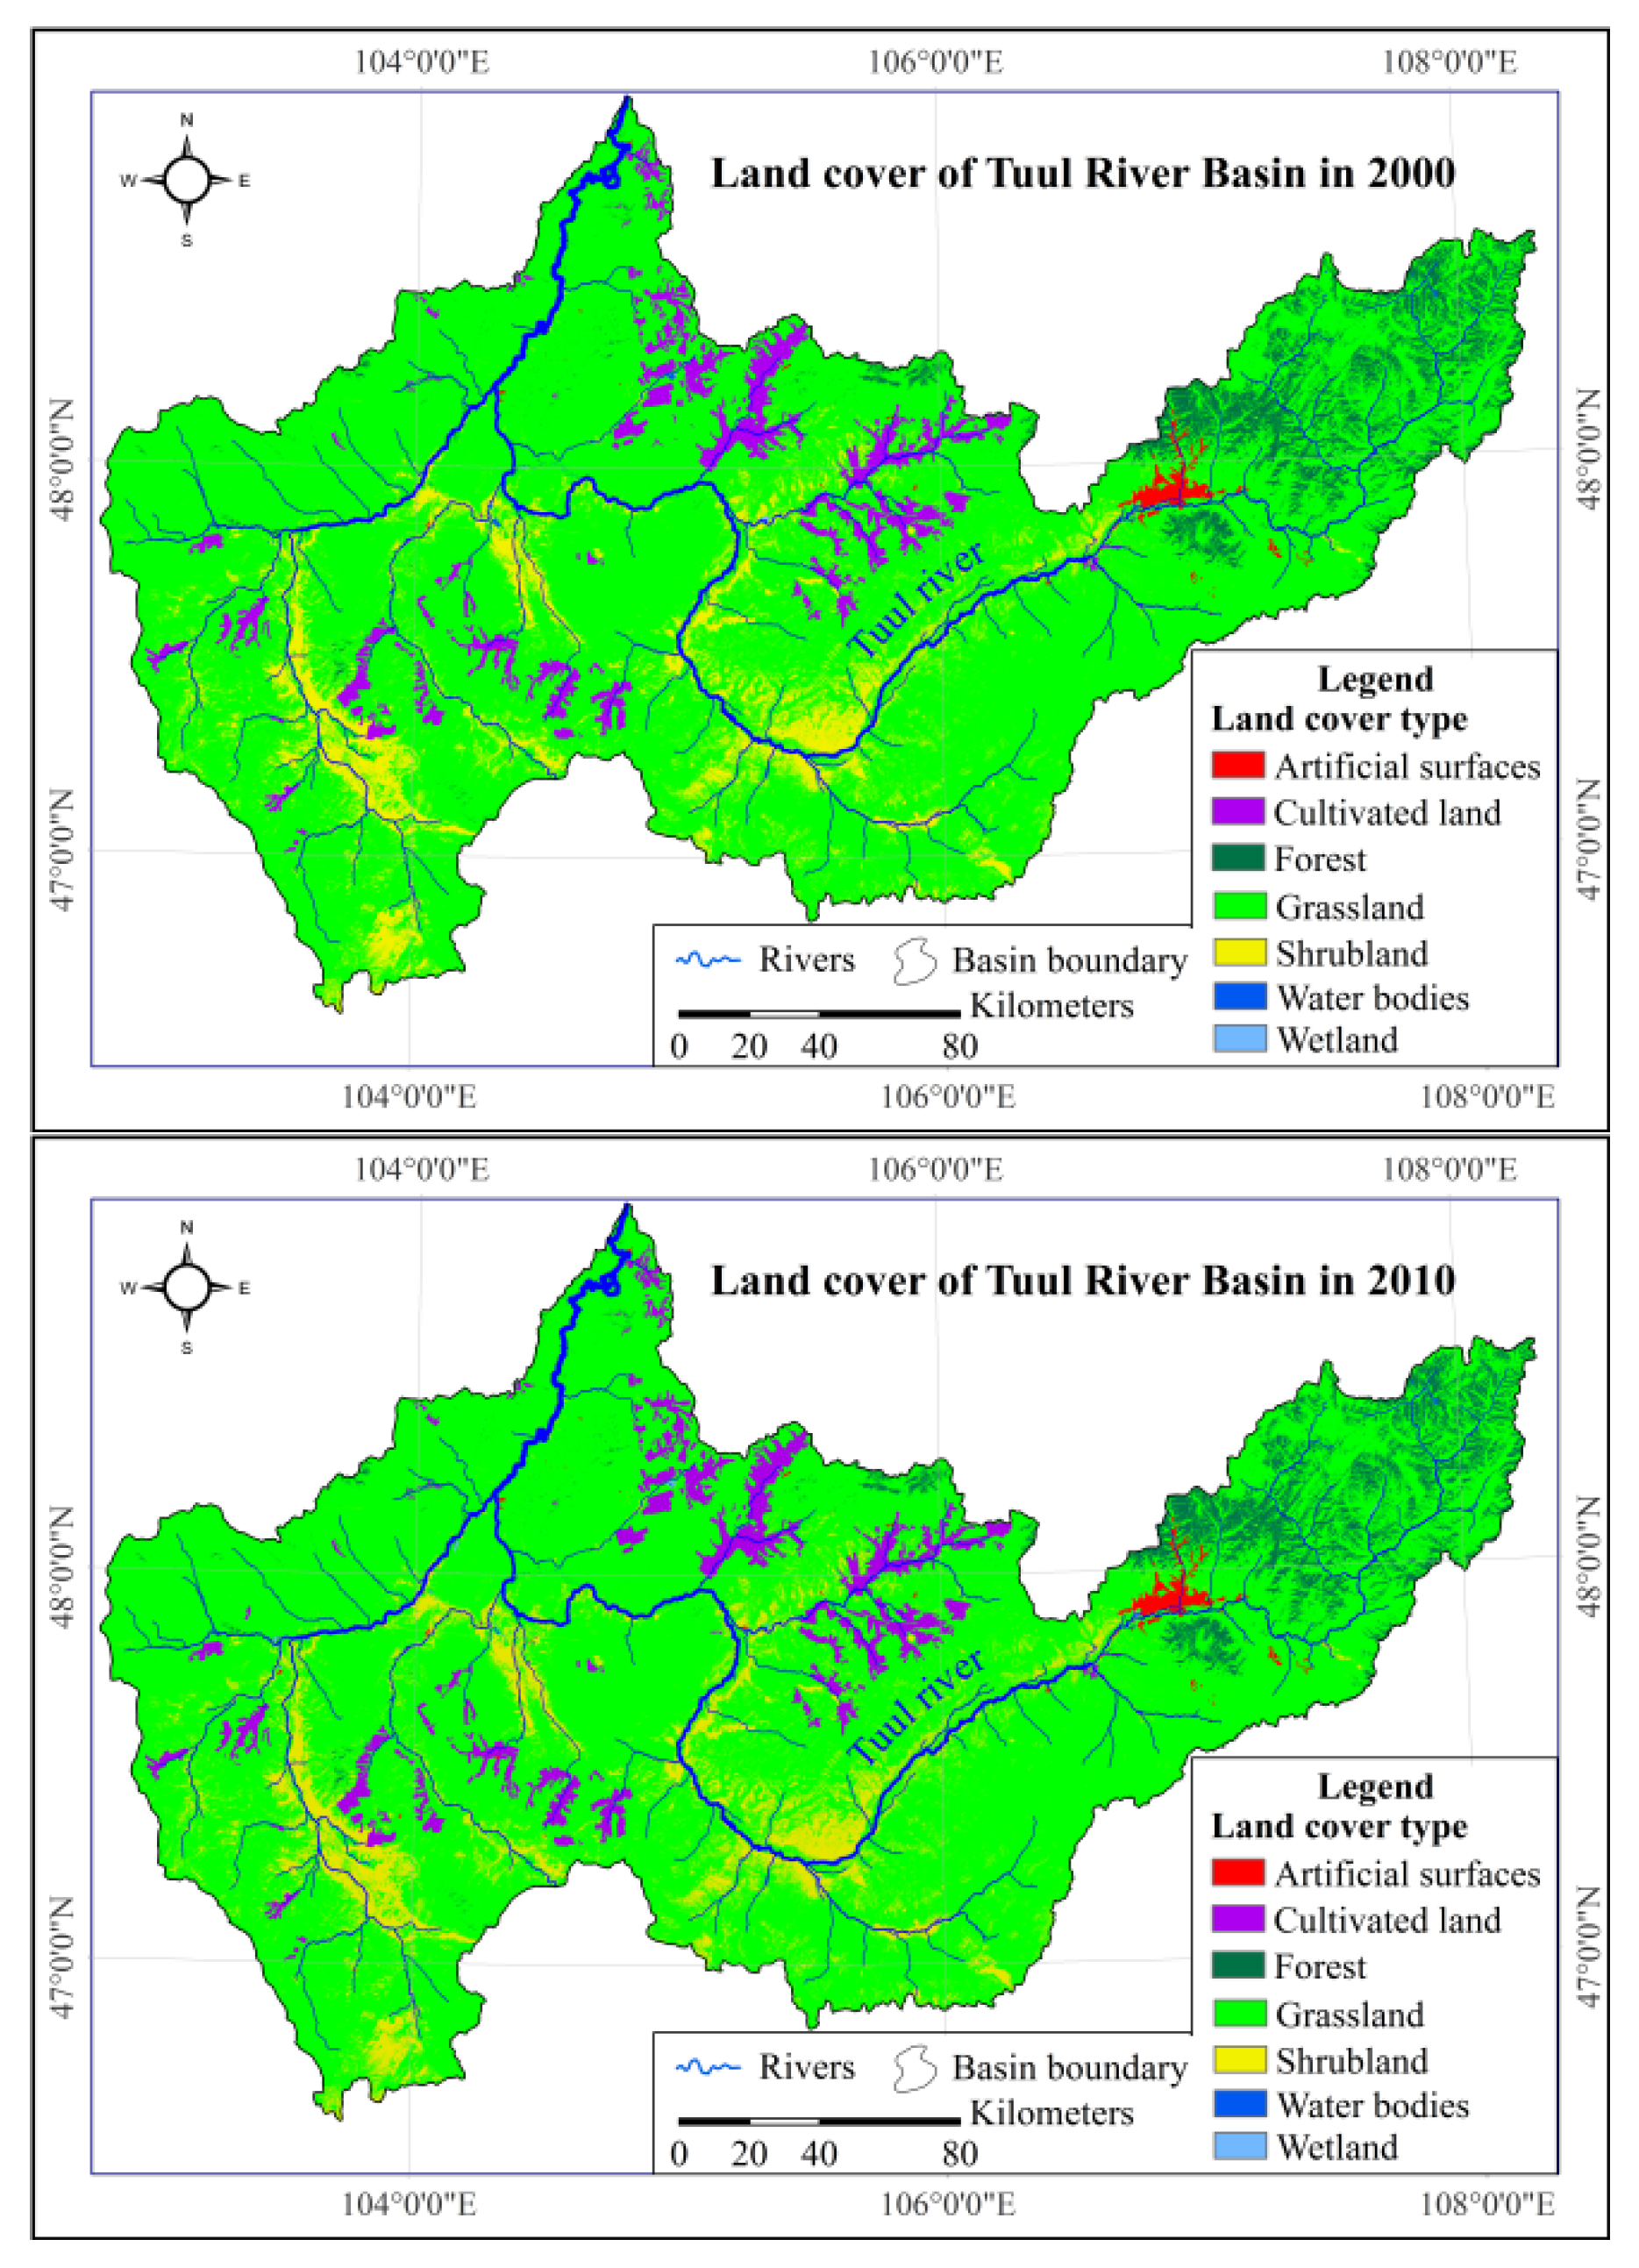
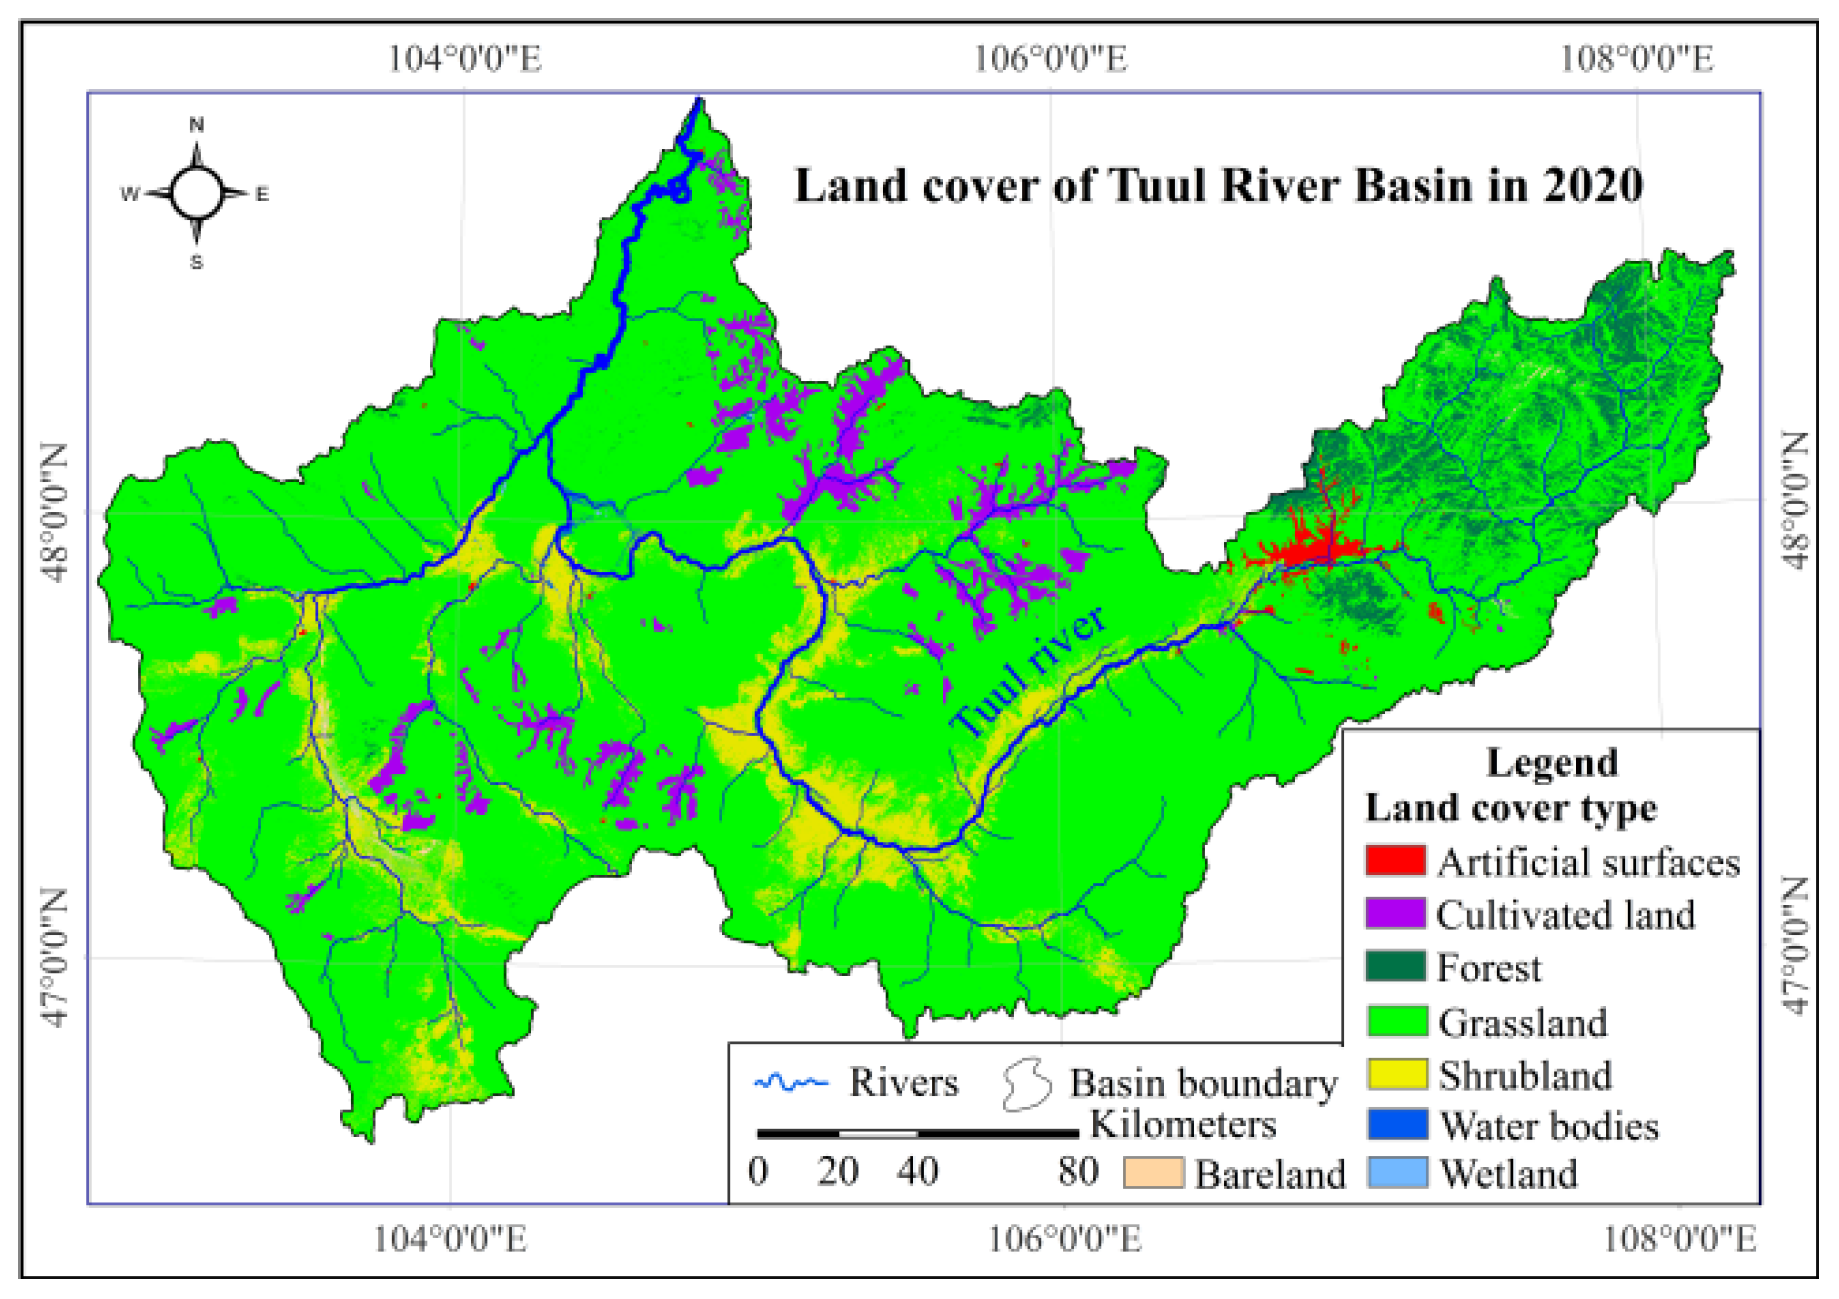
3.2. Analysis of Land Cover
Determining land cover changes using satellite data is important because it allows us to determine land cover changes, shifts, and causes. Study areas were classified using two commonly used supervised classification methods. The maximum-likelihood classification of the Tuul River Basin was used to analyze land cover maps for three different years (2000, 2010, and 2020). To confirm this, there results were compared with the soil, topographic, ecological landscape potential, vegetation, and forest maps. With appreciable accuracy, the Tuul River Basin landscape was classified according to eight land classes (
Figure 7).
The number of classified pixels varied greatly in several types of land cover. It is noteworthy that most of the maximum changes occurred in the grassland and wetland area from 2000 to 2010. During those 10 years, the grassland area and wetland increased by 59.00 km
2 and 11.89 km
2. In contrast, the water bodies and cultivated lands decreased by 45.89 km
2 and 28.00 km
2. However, the change in land cover was even greater between 2010 and 2020, which was almost the opposite of the previous decade. The amount of grassland significantly decreased by −378.67 km
2 during the second decade, while the area of water bodies increased by 74.25 km
2 (
Table 4).
There was also a sharp increase in the size of the bareland, which was not evident in the previous decade. In this case, the high variability of the land cover indicates that there are some factors that strongly influence it.
During 2000 to 2010, the forms of land cover that are most sensitive to water changed significantly. Therefore, the study of land cover transitions and changes may be important in detecting the effects of change (
Table 5).
From 2000 to 2010, about 69.95 km
2 area of cultivated land was converted into grassland and 0.22 km
2 area of cultivated land was converted into shrubland. The conversion of forest land to grassland, wetland, and water bodies was 1.67 km
2, 3.70 km
2, and 0.48 km
2, respectively. The conversion of grassland to cultivated land, forest, wetland, water bodies, artificial surfaces, and shrubland was 41.02 km
2, 5.21 km
2, 12.00 km
2, 4.14 km
2, 2.78 km
2, and 1.73 km
2, respectively. The conversion of wetland to grassland, water bodies, and shrubland was 8.21 km
2, 0.43 km
2, and 0.32 km
2, respectively. The conversion of water bodies to forest land, grassland, wetland, and shrubland was 2.04 km
2, 44.89 km
2, 3.75 km
2, and 1.03 km
2 respectively. The conversion of artificial surfaces to grassland, wetland, and shrubland was 0.37 km
2, 0.07 km
2, and 0.04 km
2, respectively. The conversion of shrubland to cultivated land, grassland, wetland, water bodies, and artificial surfaces was 0.93 km
2, 3.56 km
2, 1.25 km
2, 0.93 km
2, and 1.79 km
2, respectively. The most sensitive types of land cover are grassland and water bodies. The highest increase in land cover type was 59 km
2 for grassland and the highest decrease was 45.89 km
2 for water bodies. From 2000 to 2020, the forms of land cover that are most sensitive to temperature and water changed significantly (
Table 6).
From 2000 to 2020, about 5.13 km
2 area of artificial surfaces land was converted into grassland. The conversion of cultivated land to artificial surfaces land, grassland, and shrubland was 2.77 km
2, 292.95 km
2, and 3.57 km
2, respectively. The conversion of forest land to bareland, grassland, water bodies, and wetland was 2.19 km
2, 438.02 km
2, 4.02 km
2, and 3.71 km
2, respectively. The conversion of grassland to artificial surfaces land, bareland, cultivated land, forest land, shrubland, water bodies, and wetland was 96.63 km
2, 31.93 km
2, 79.02 km
2, 557.73 km
2, 2531.30 km
2, 62.13 km
2, and 14.03 km
2, respectively. The conversion of shrubland to artificial surfaces land, bareland, cultivated land, grassland, water bodies, and wetland was 8.70 km
2, 70.48 km
2, 1.19 km
2, 2177.62 km
2, 13.91 km
2, and 1.11 km
2, respectively. The conversion of water bodies to forest land, grassland, shrubland, and wetland was 4.08 km
2, 36.55 km
2, 9.29 km
2, and 2.26 km
2 respectively. The conversion of wetland to grassland, shrubland, and water bodies was 3.59 km
2, 4.09 km
2, and 1.55 km
2, respectively. Numerous studies to estimate land cover displacement confirm the confidence value by the kappa coefficient [
5,
33,
34,
35]. If the accuracy value of the kappa coefficient classification is 0.61–0.80, it substantially ensures the accuracy of the land cover transition [
36,
37,
38]. In this study, land cover classification for the years 2000 and 2020 was produced and the accuracy checked for the transformation matrix; the kappa coefficient was substantial, 0.78. This means that the estimates of land cover changes in the Tuul River Basin are accurate and interrelationships can be further analyzed.
3.3. Analysis of Interrelationships of Ecohydrological Processes
In the Tuul River Basin, air temperature statistically increased sharply at all stations, with Terelj (
φ = 5.08) and Ulaanbaatar (
φ = 14.11) the highest (
Table 1). This greatly increases evaporation and has a direct effect on the reduction of water and moisture in the surface area. In the semiarid and arid regions of the Central Asian Plateau, precipitation is the main source of surface water, and surface water levels may increase as precipitation increases. It is important to examine whether there is a statistical relationship between hydrological processes and land cover components in the basin. This is especially important in understanding the ecohydrological process by establishing the relationship between river discharge and precipitation, and the components associated with the surface area of water bodies. In the study area, it was observed with a sharp increase in the average annual air temperature and a moderately negative correlation with a decrease in the water body type of land cover (r = −n.54). It was observed that the average annual precipitation has a strong positive, statistically significant correlation with river water discharge (r = 0.70). The interrelationships between the other sections were weak (
Figure 8).
The ecohydrological processes in Mongolia are directly related to the amount of precipitation [
39]. As a result of direct and indirect human and natural factors, the hydrological processes of Mongolia’s major rivers are changing and river discharge is declining [
40]. In particular, global warming increases evaporation and affects the land surface, decreasing the water surface [
41]. Therefore, this may have had a significant impact on reducing the surface area of water bodies (45.89 km
2) in the Tuul River Basin from 2000 to 2010. However, between 2010 and 2020, a slight increase in precipitation in the basin increased the area with water bodies (74.25 km
2). Between 2000 and 2020, the amount of grassland decreased by 319.67 km
2, while the area of water bodies increased by 28.36 km
2. In addition, due to temperature and evaporation, the amount of grassland area decreased and the amount of bareland increased. Therefore, it is important to establish an interrelationship by comparing the main hydrometeorological parameters, which have a major impact on the ecohydrological processes, with water bodies and sensitive areas of the land cover types (
Figure 9).
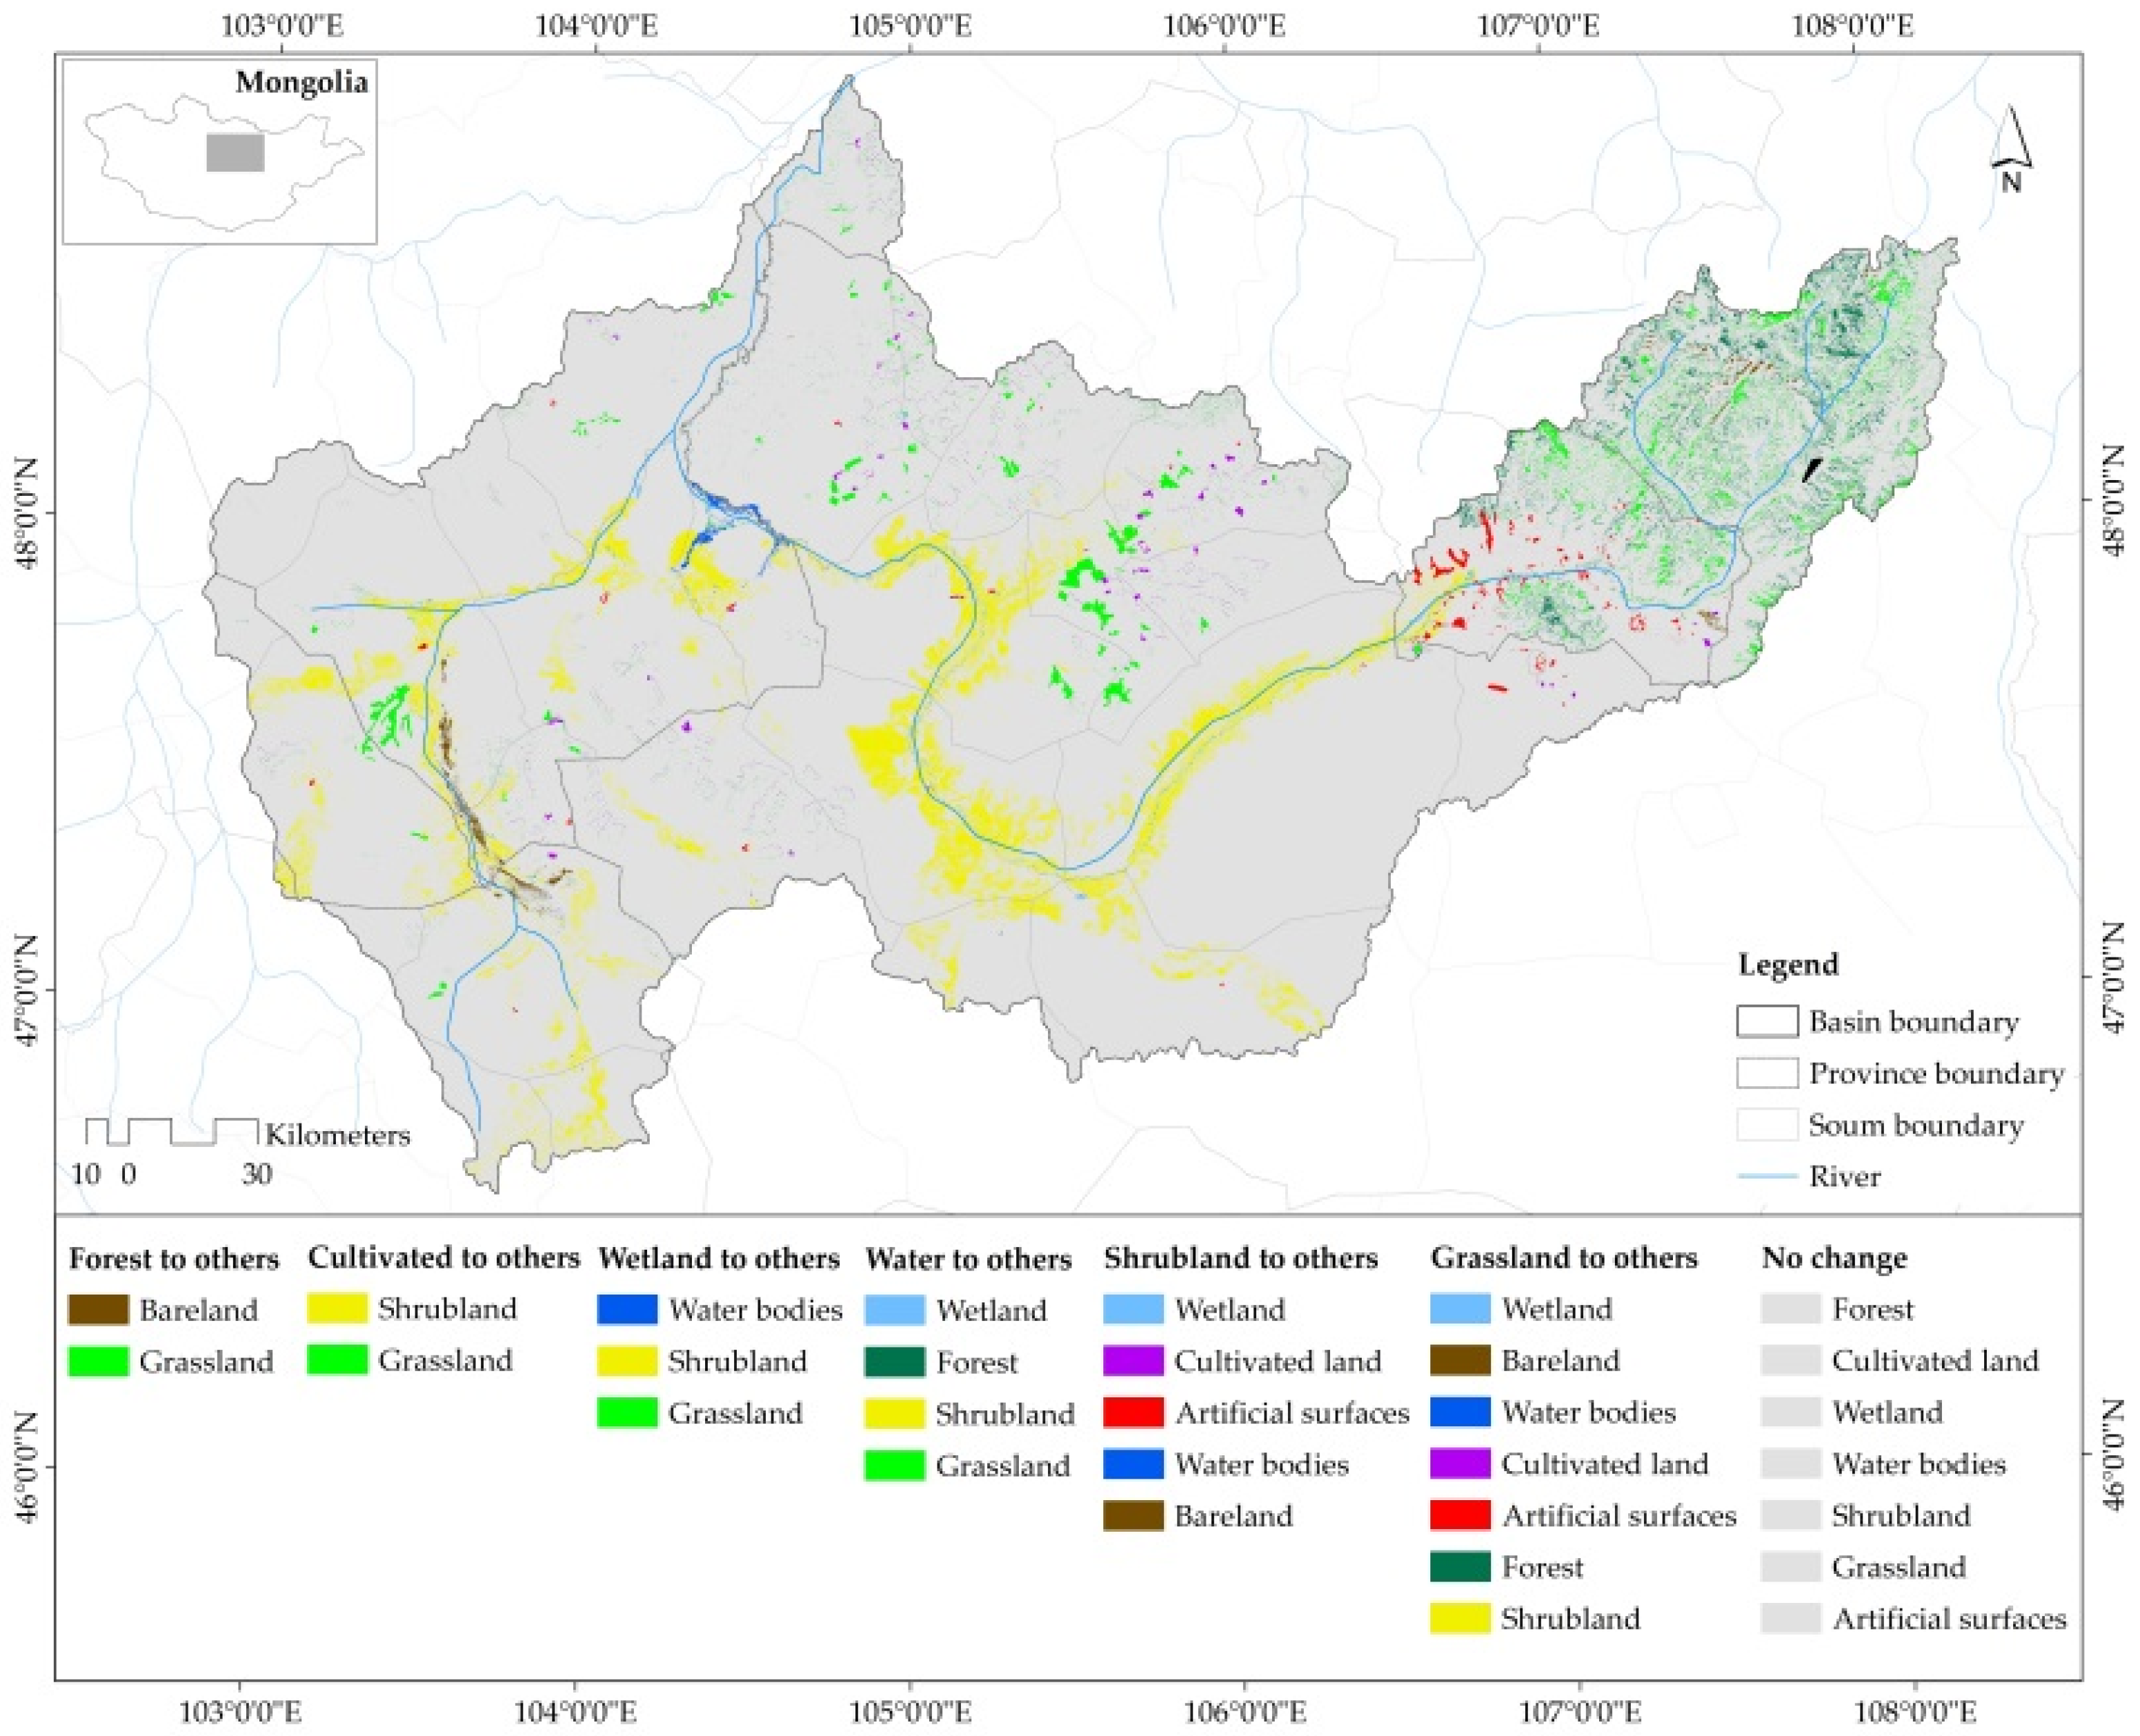
Studies in the arid and semiarid regions of Central Asia show that climate change has a significant impact on land cover changes [
5,
42]. When linking changes and shifts in this land cover to a hydrological system, it may be important to consider the spatial and temporal interrelationships of the key factors that affect it. In addition, changes in land cover have occurred in basin areas as a result of human and natural impacts (
Figure 10).
The areas that changed the most were within the river zone. In particular, the size of grasslands along the river basin changed significantly and shifted to other forms. There is also a not less of a change in cultivated land and artificial surfaces that are changed by human activities. This is a manifestation of changes in the types of land cover due to human activities [
43]. On the other hand, precipitation and water bodies of the basin are clearly declining due to global warming [
44]. This is a natural factor affecting the land cover [
45].
This baseline study is to determine the impact of climate change on ecohydrological processes, land cover changes, ecosystems, and surface aquifers in a semiarid region. It is consistent with the results of other studies on the hydrological processes and land cover of the Central Asian Plateau with a semiarid climate.

 ,
, 


