Fused Deposition Modelling of Fibre Reinforced Polymer Composites: A Parametric Review

 ,
,  ,
,  , , and
Abstract
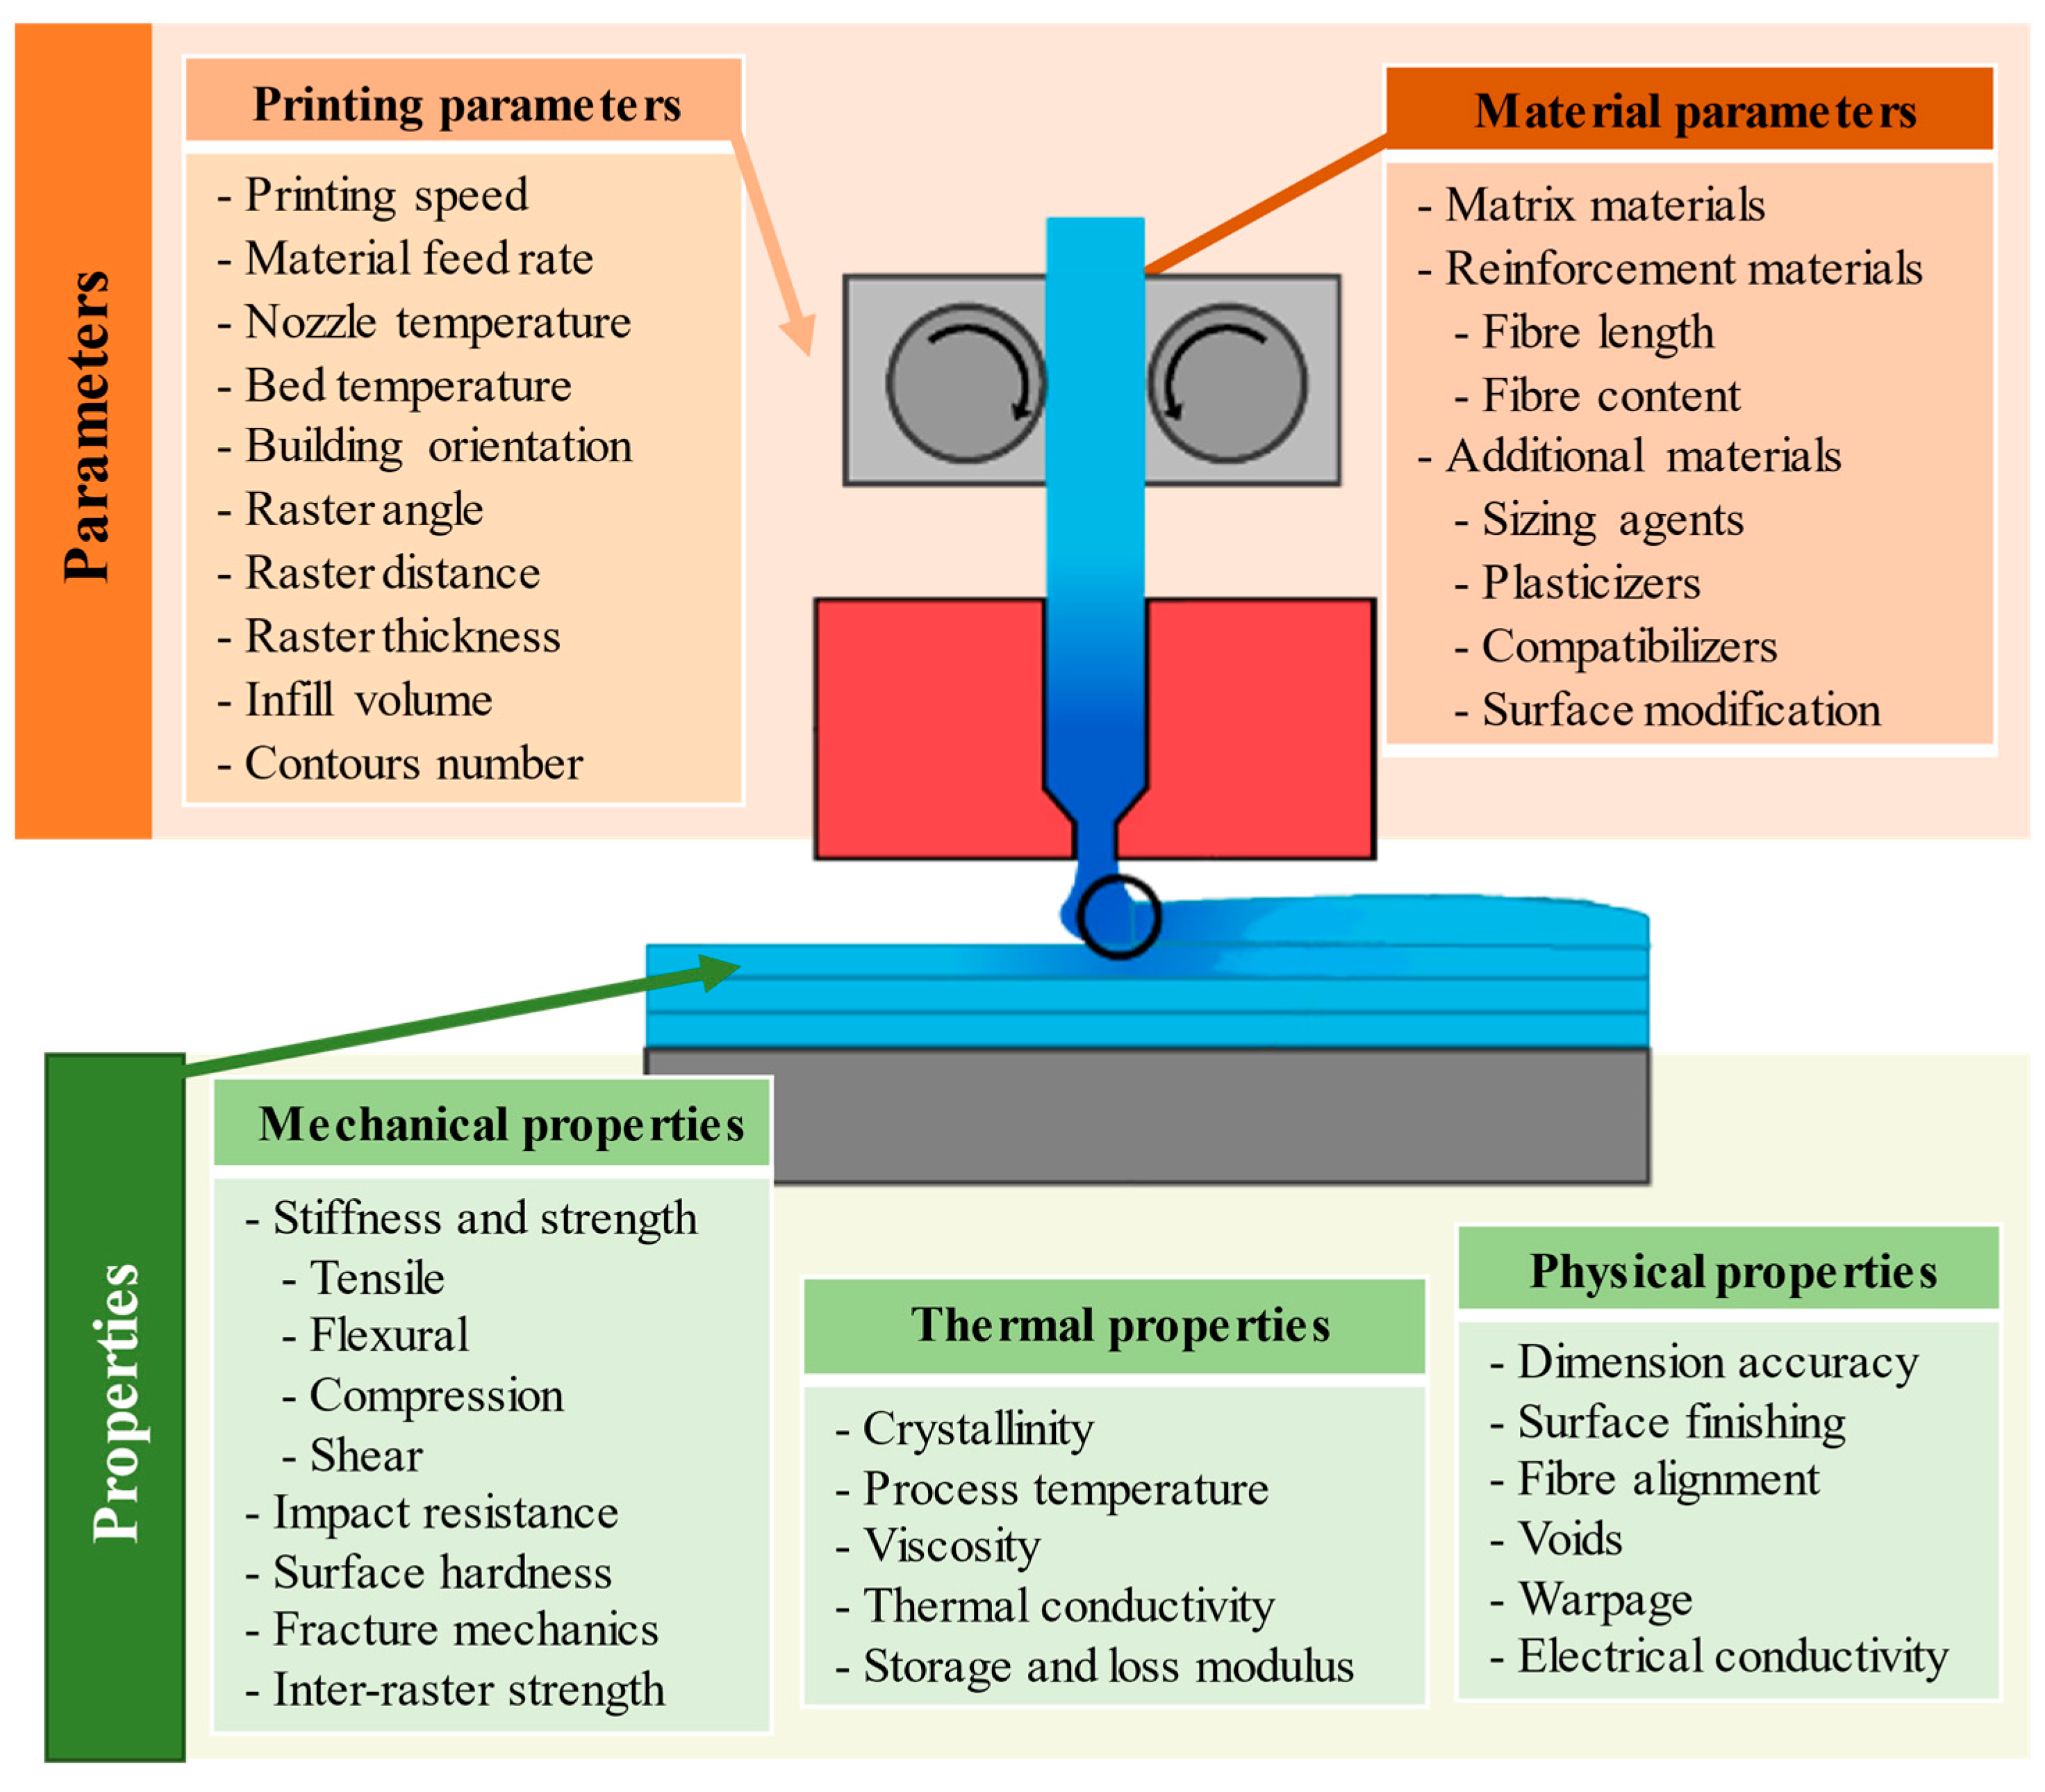
:1. Introduction
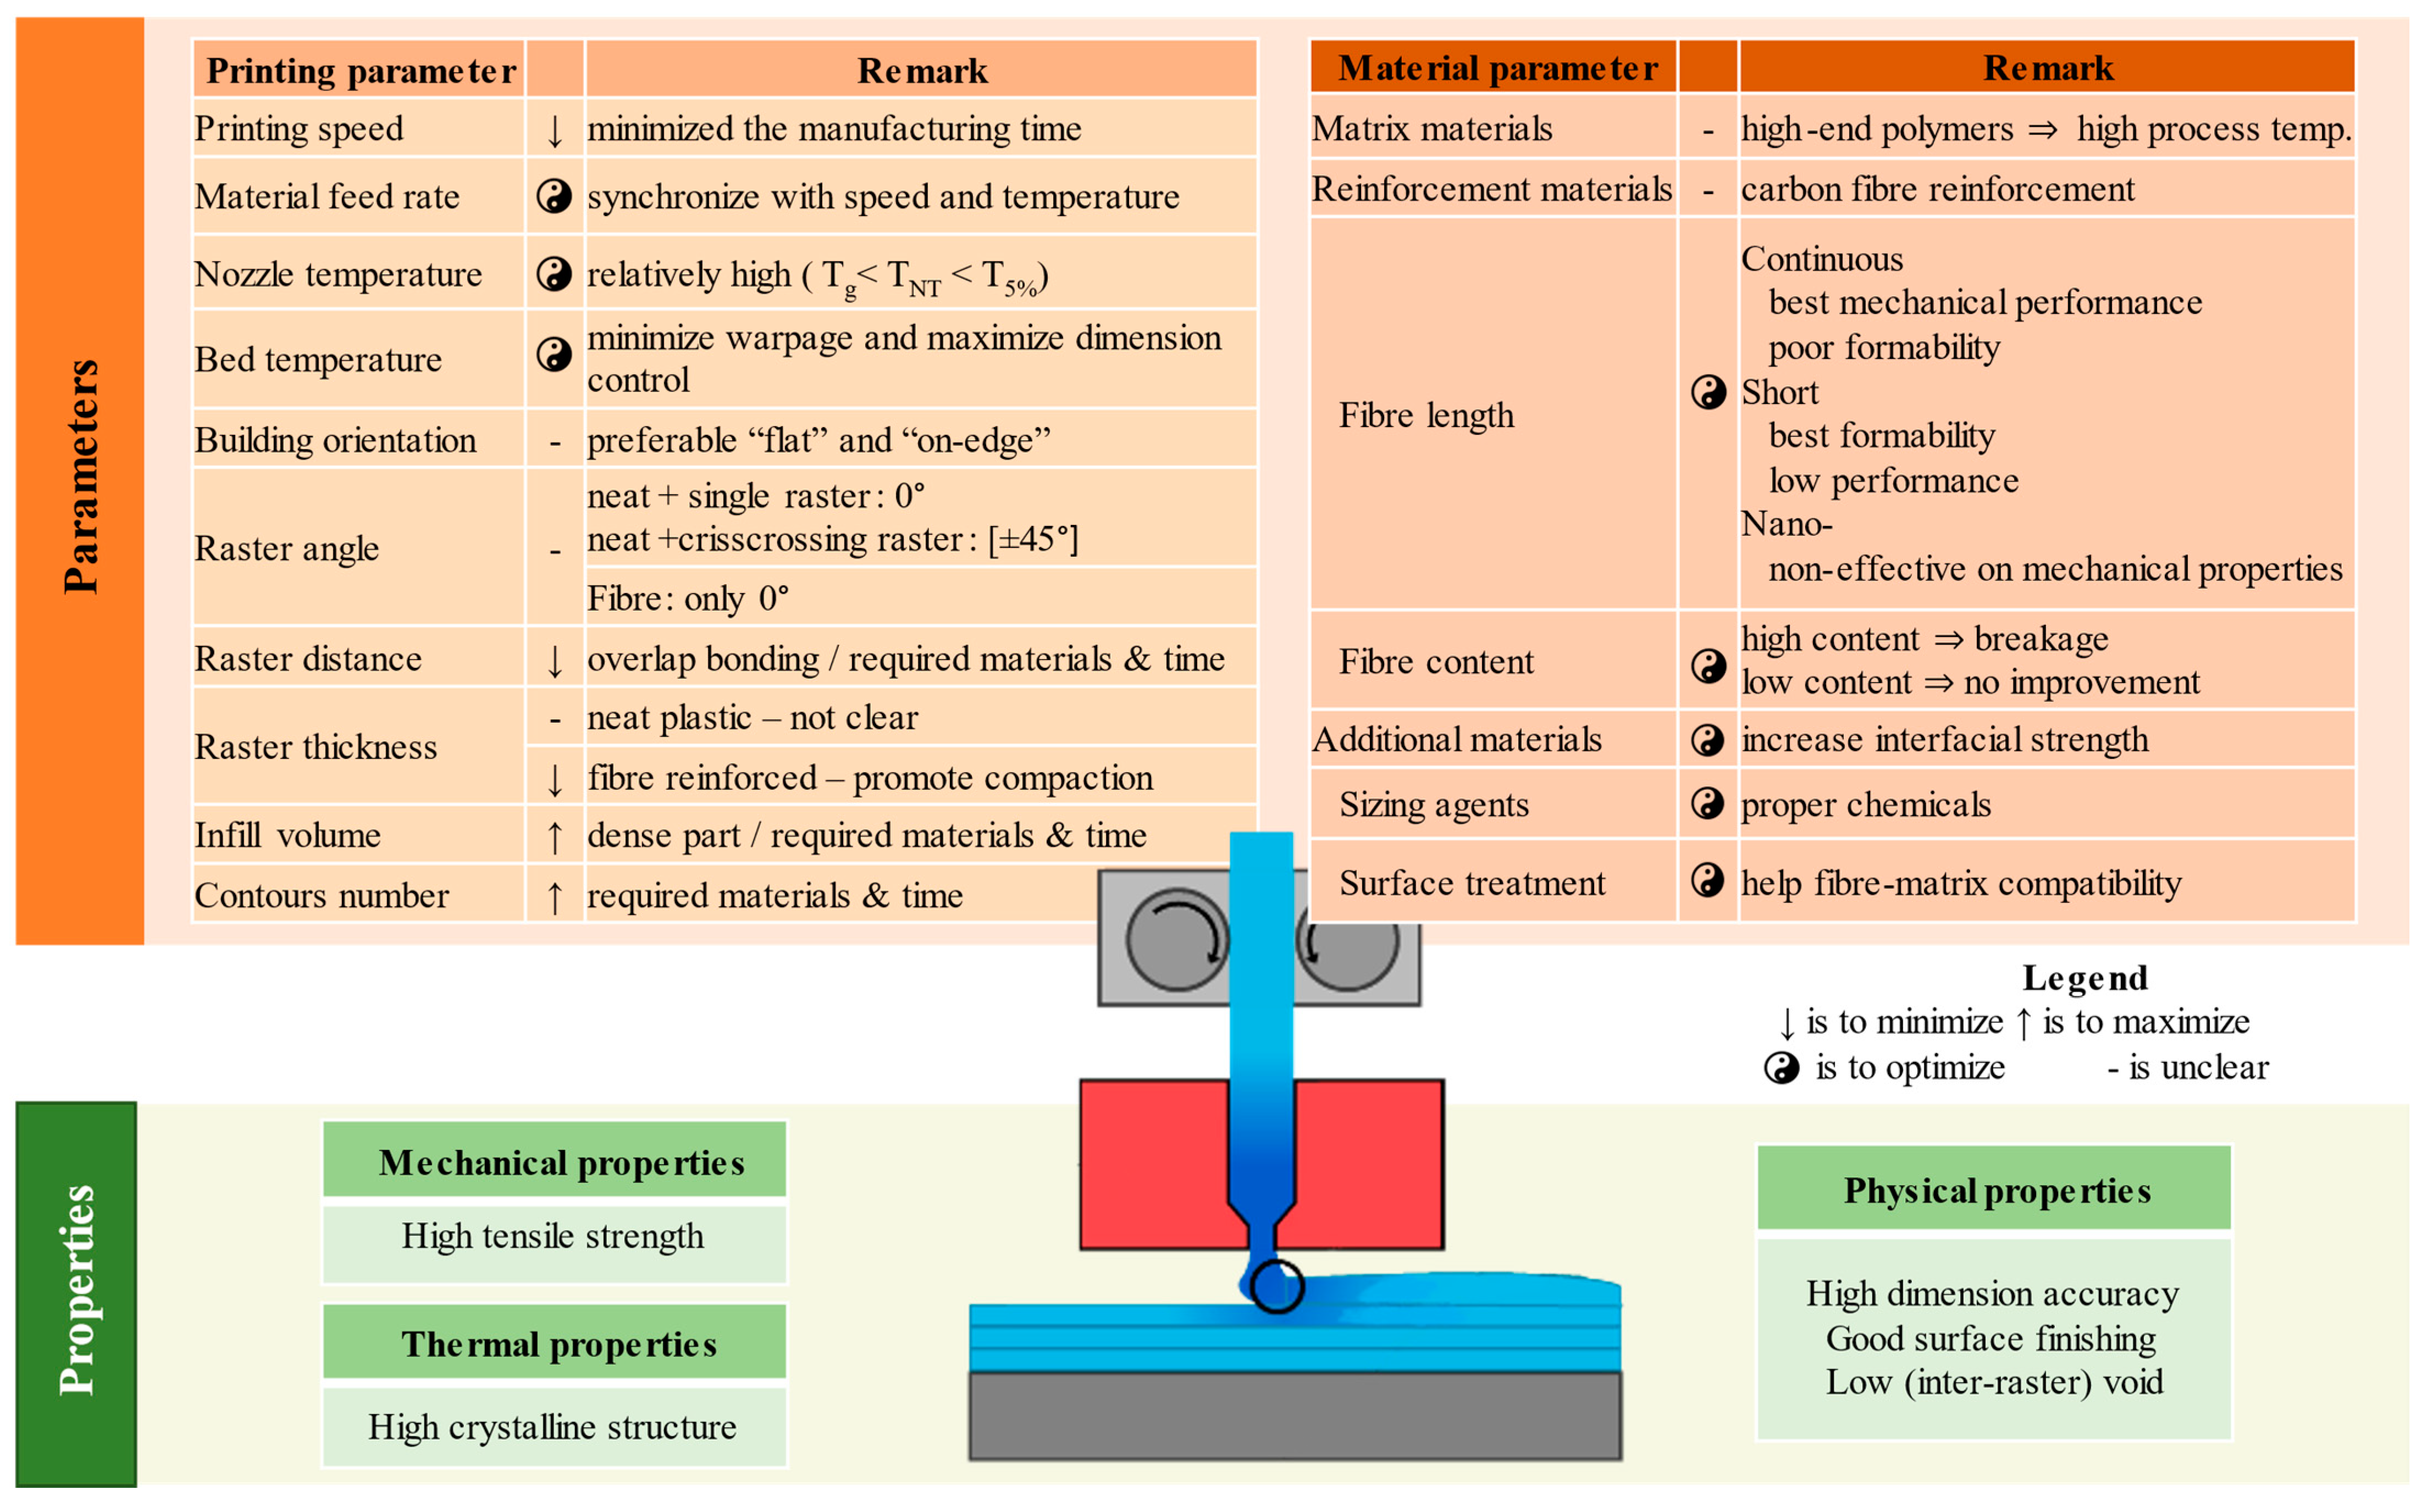
2. Printing Parameters
2.1. Printing Speed
2.2. Material Feed Rate or Extrusion Rate
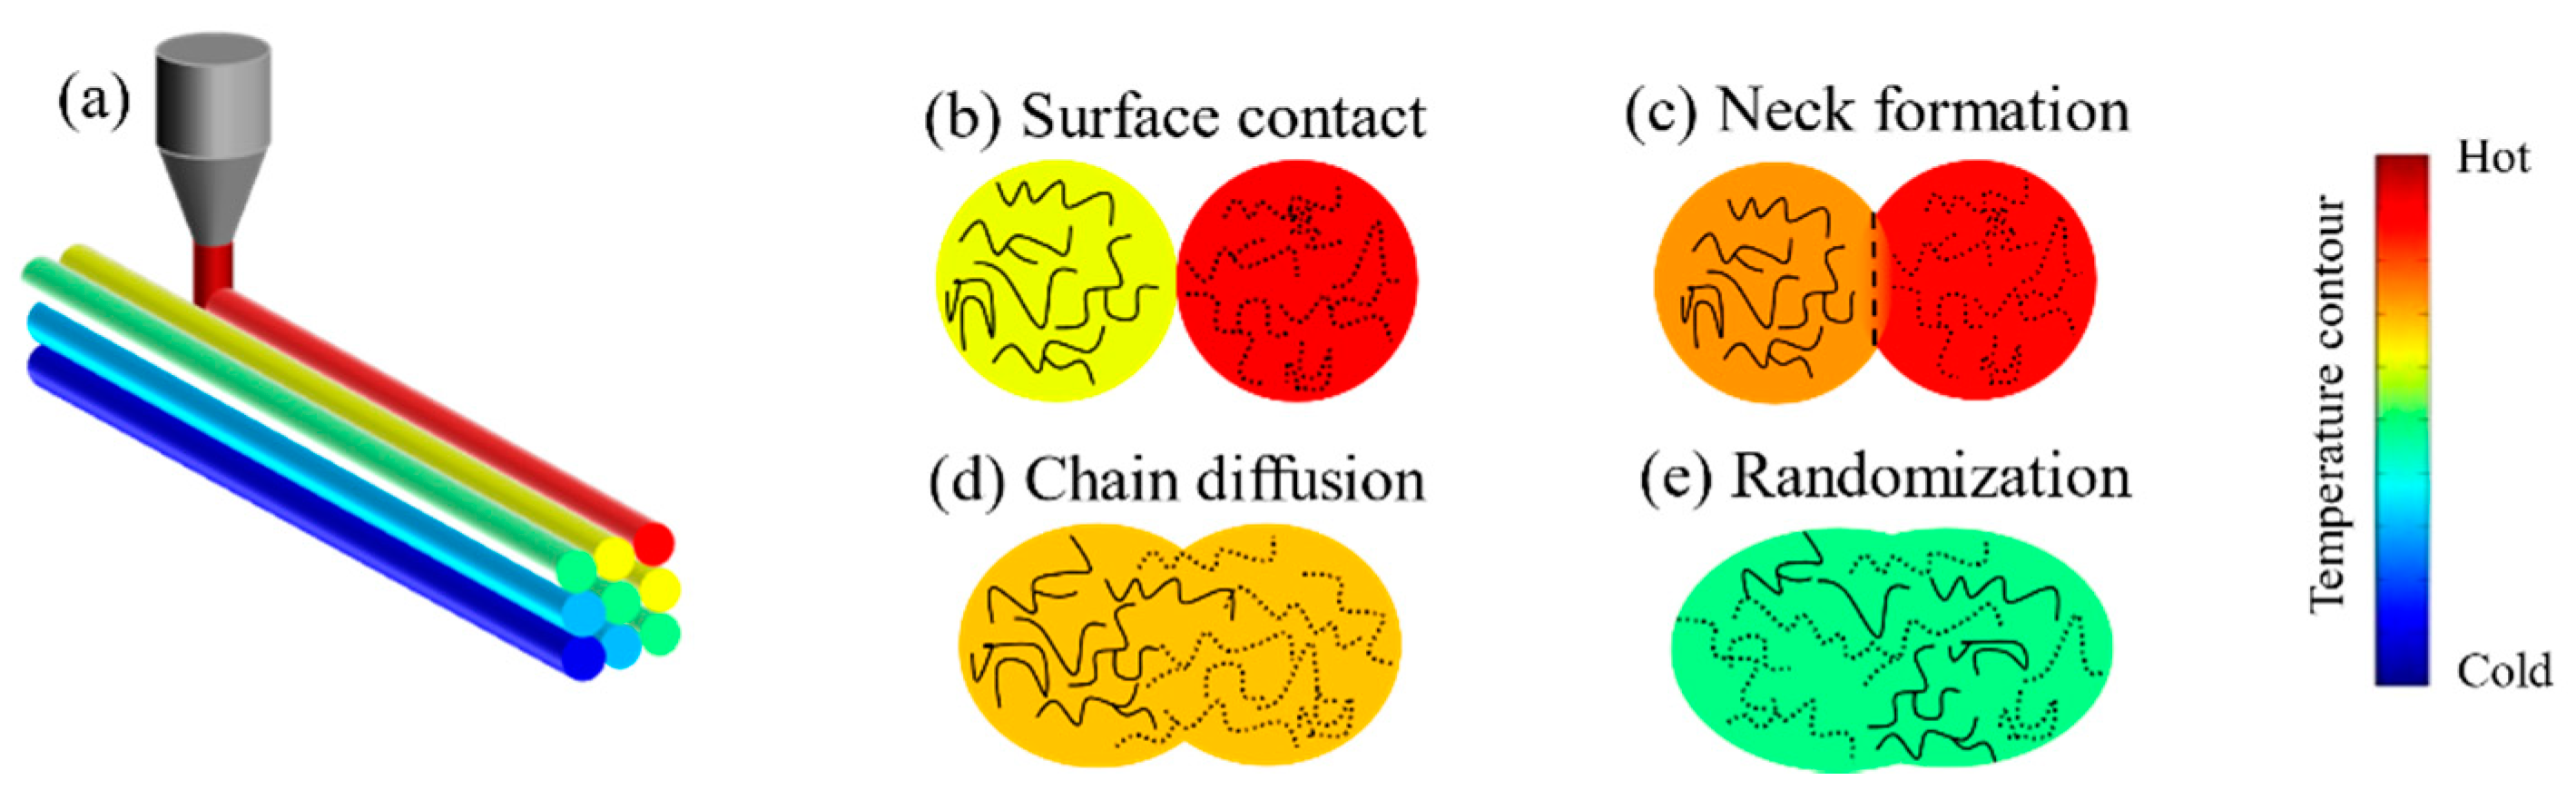
2.3. Nozzle Temperature
2.4. Bed Temperature and Environmental Control
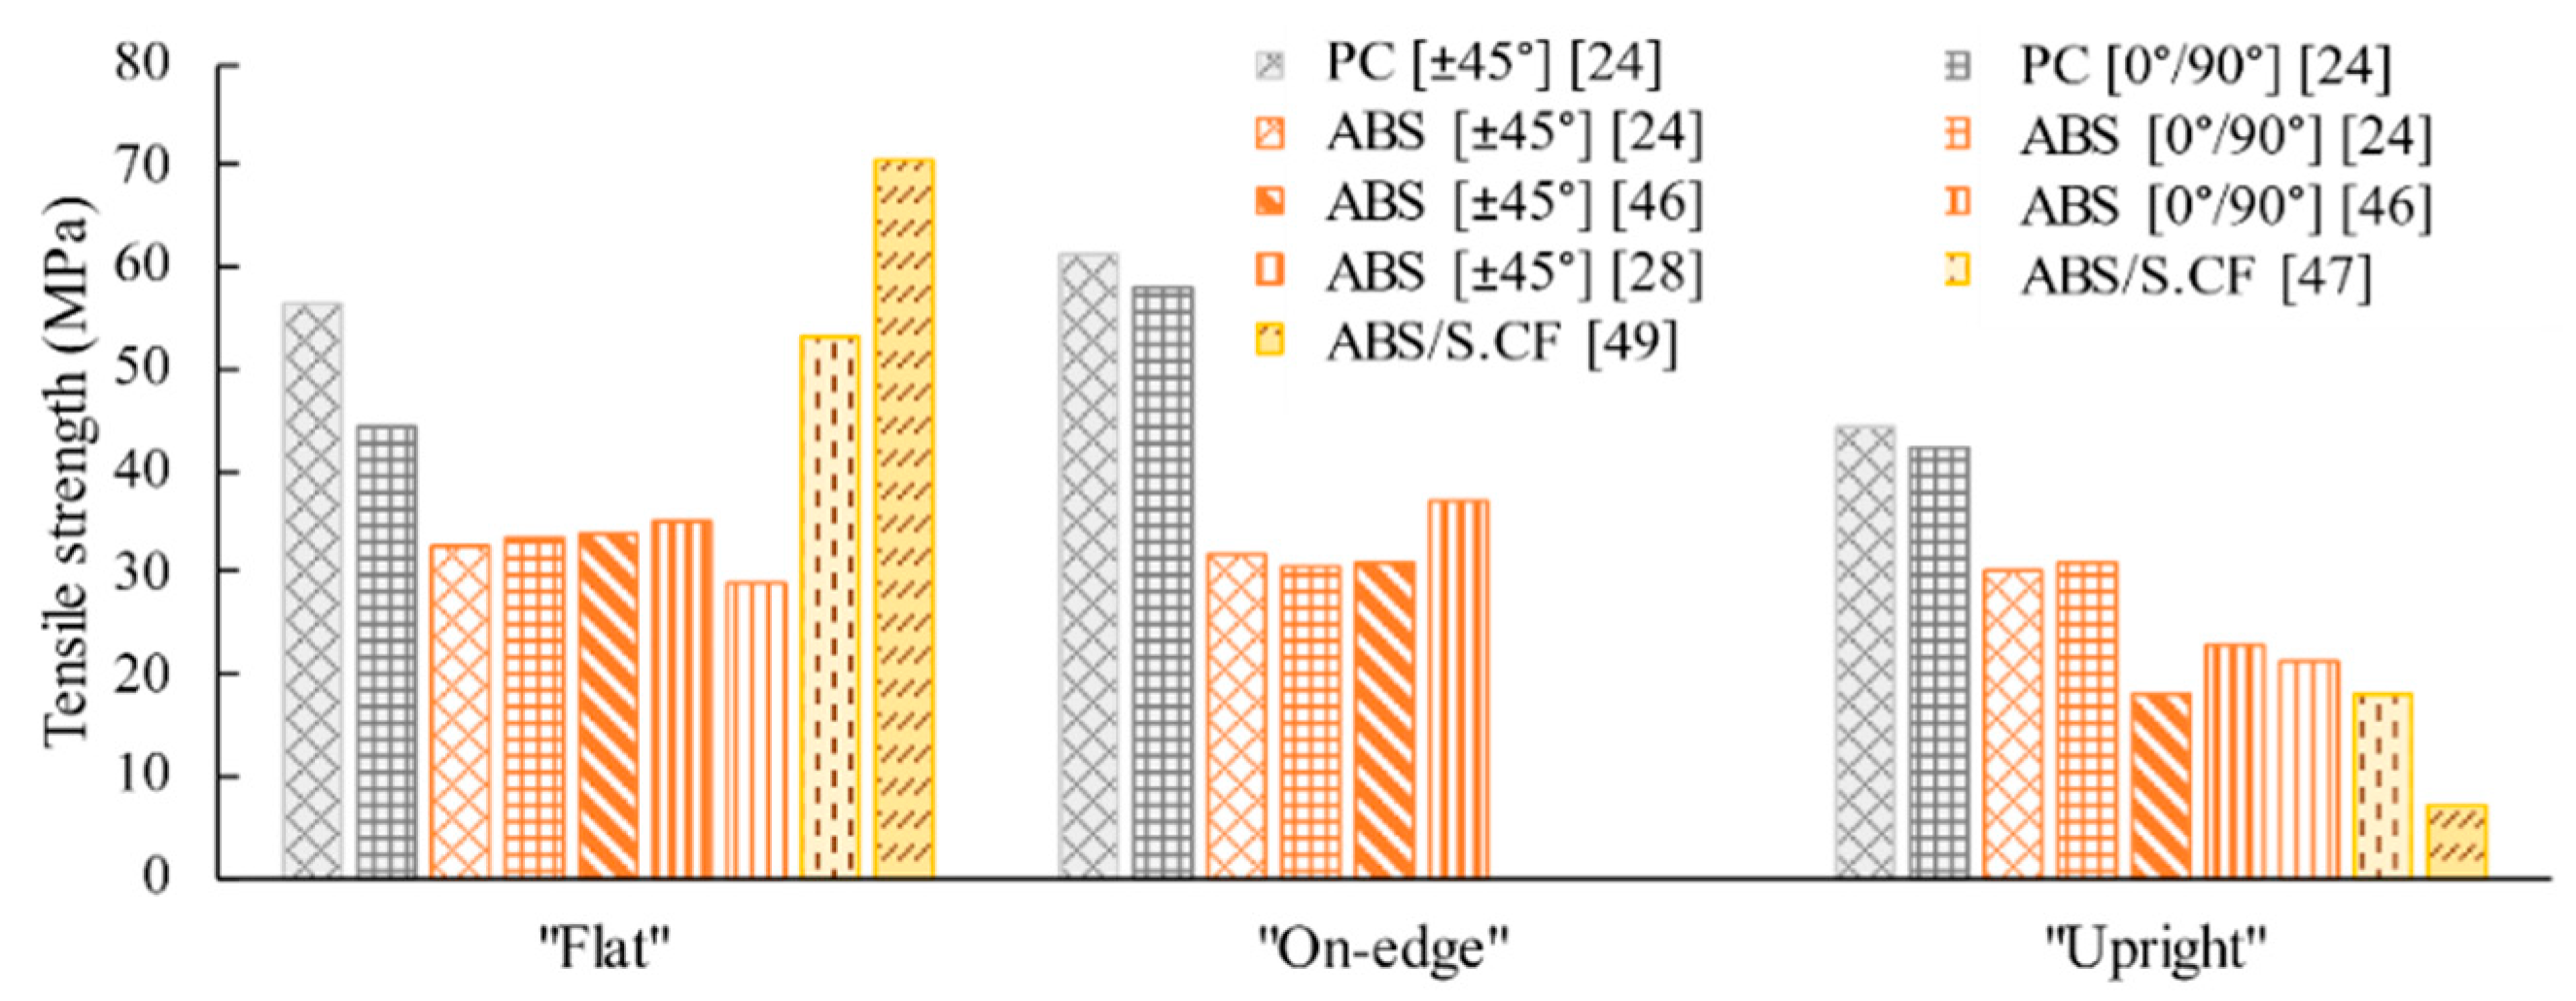
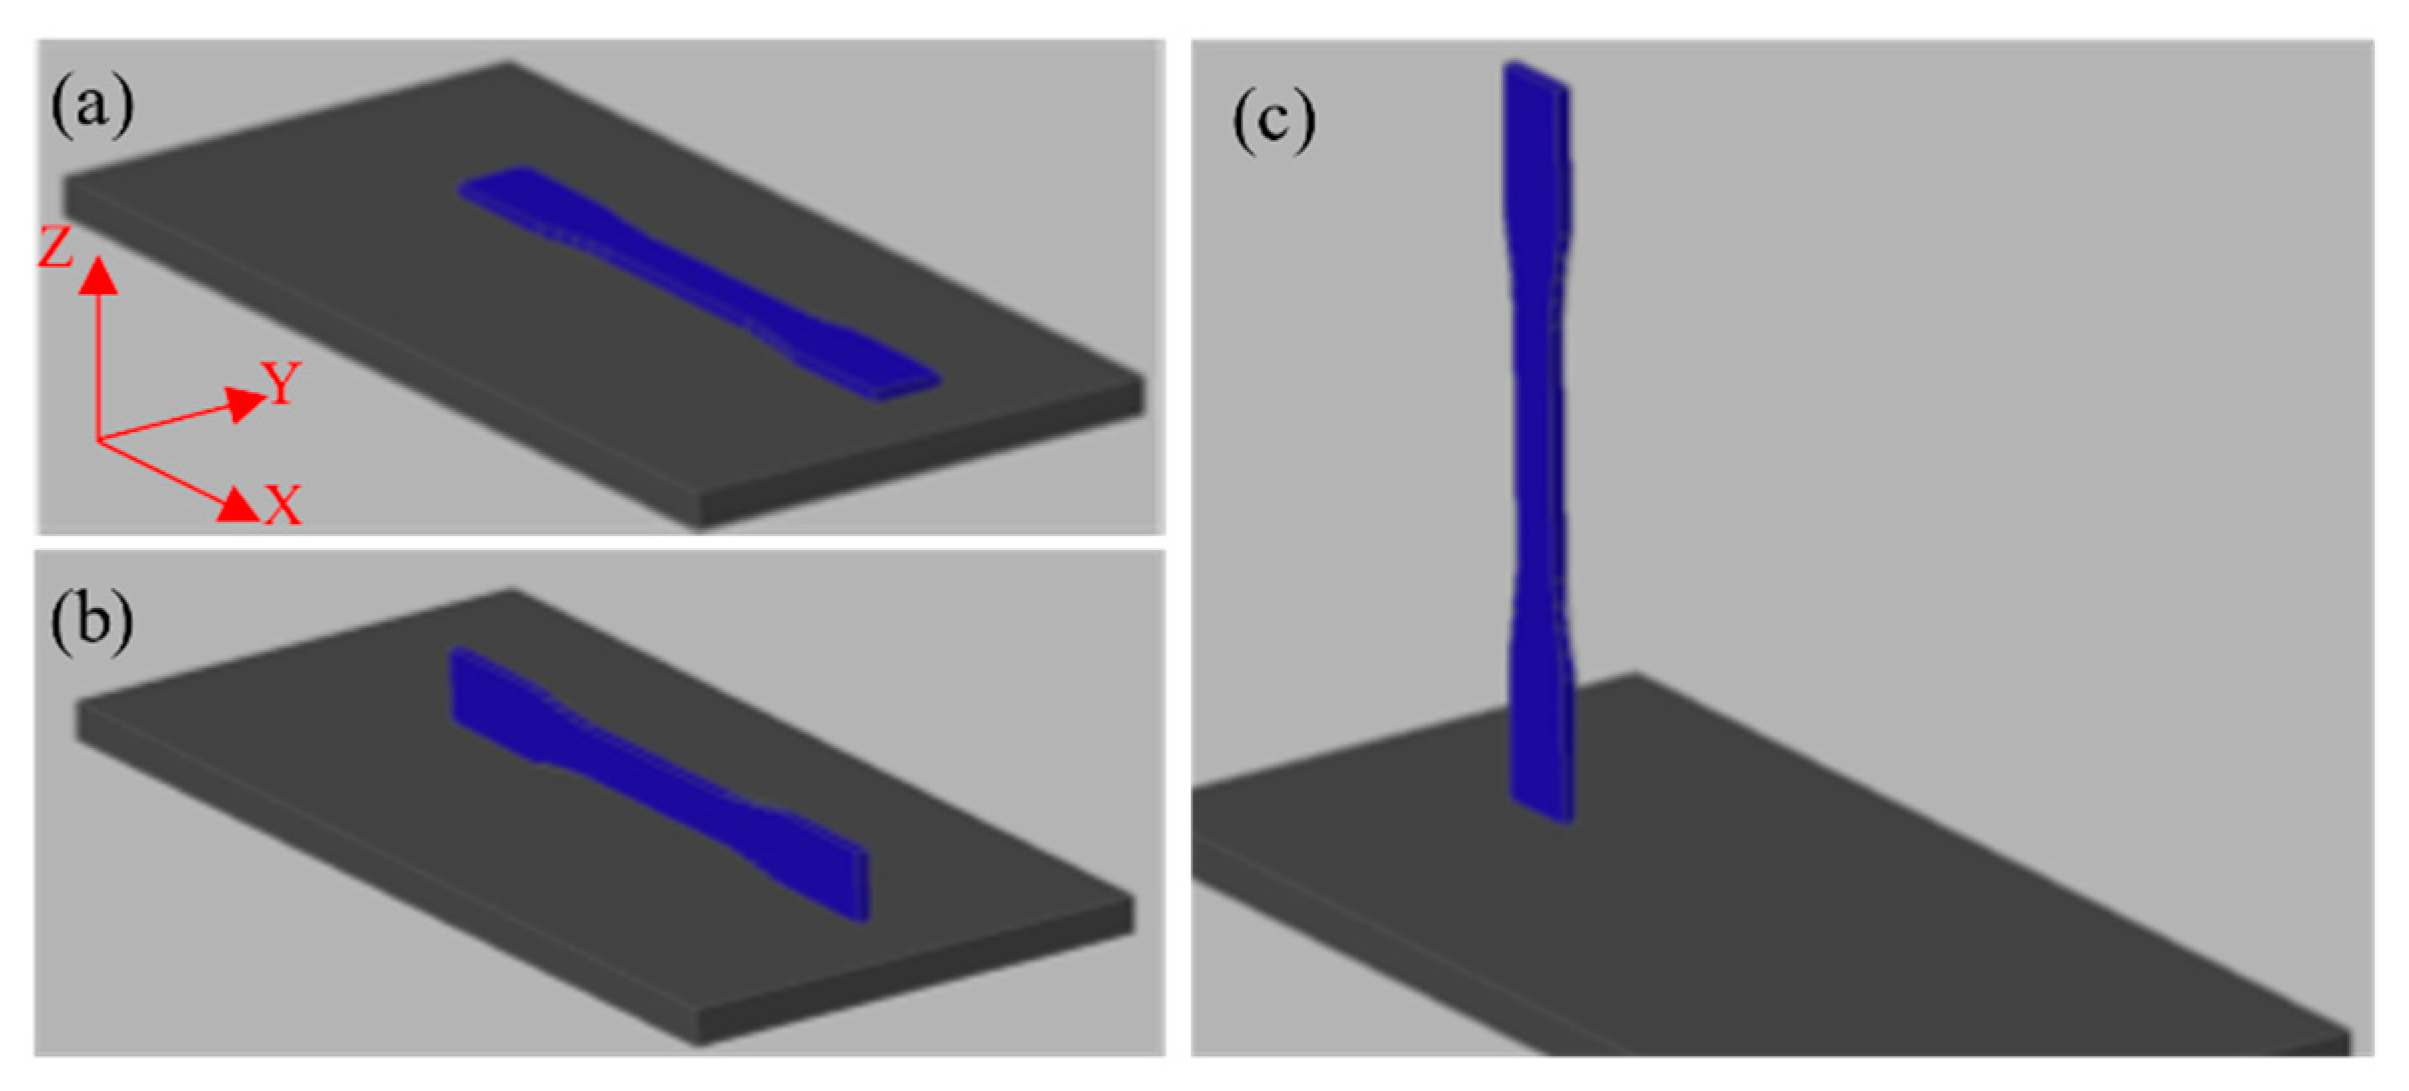
2.5. Building Orientation
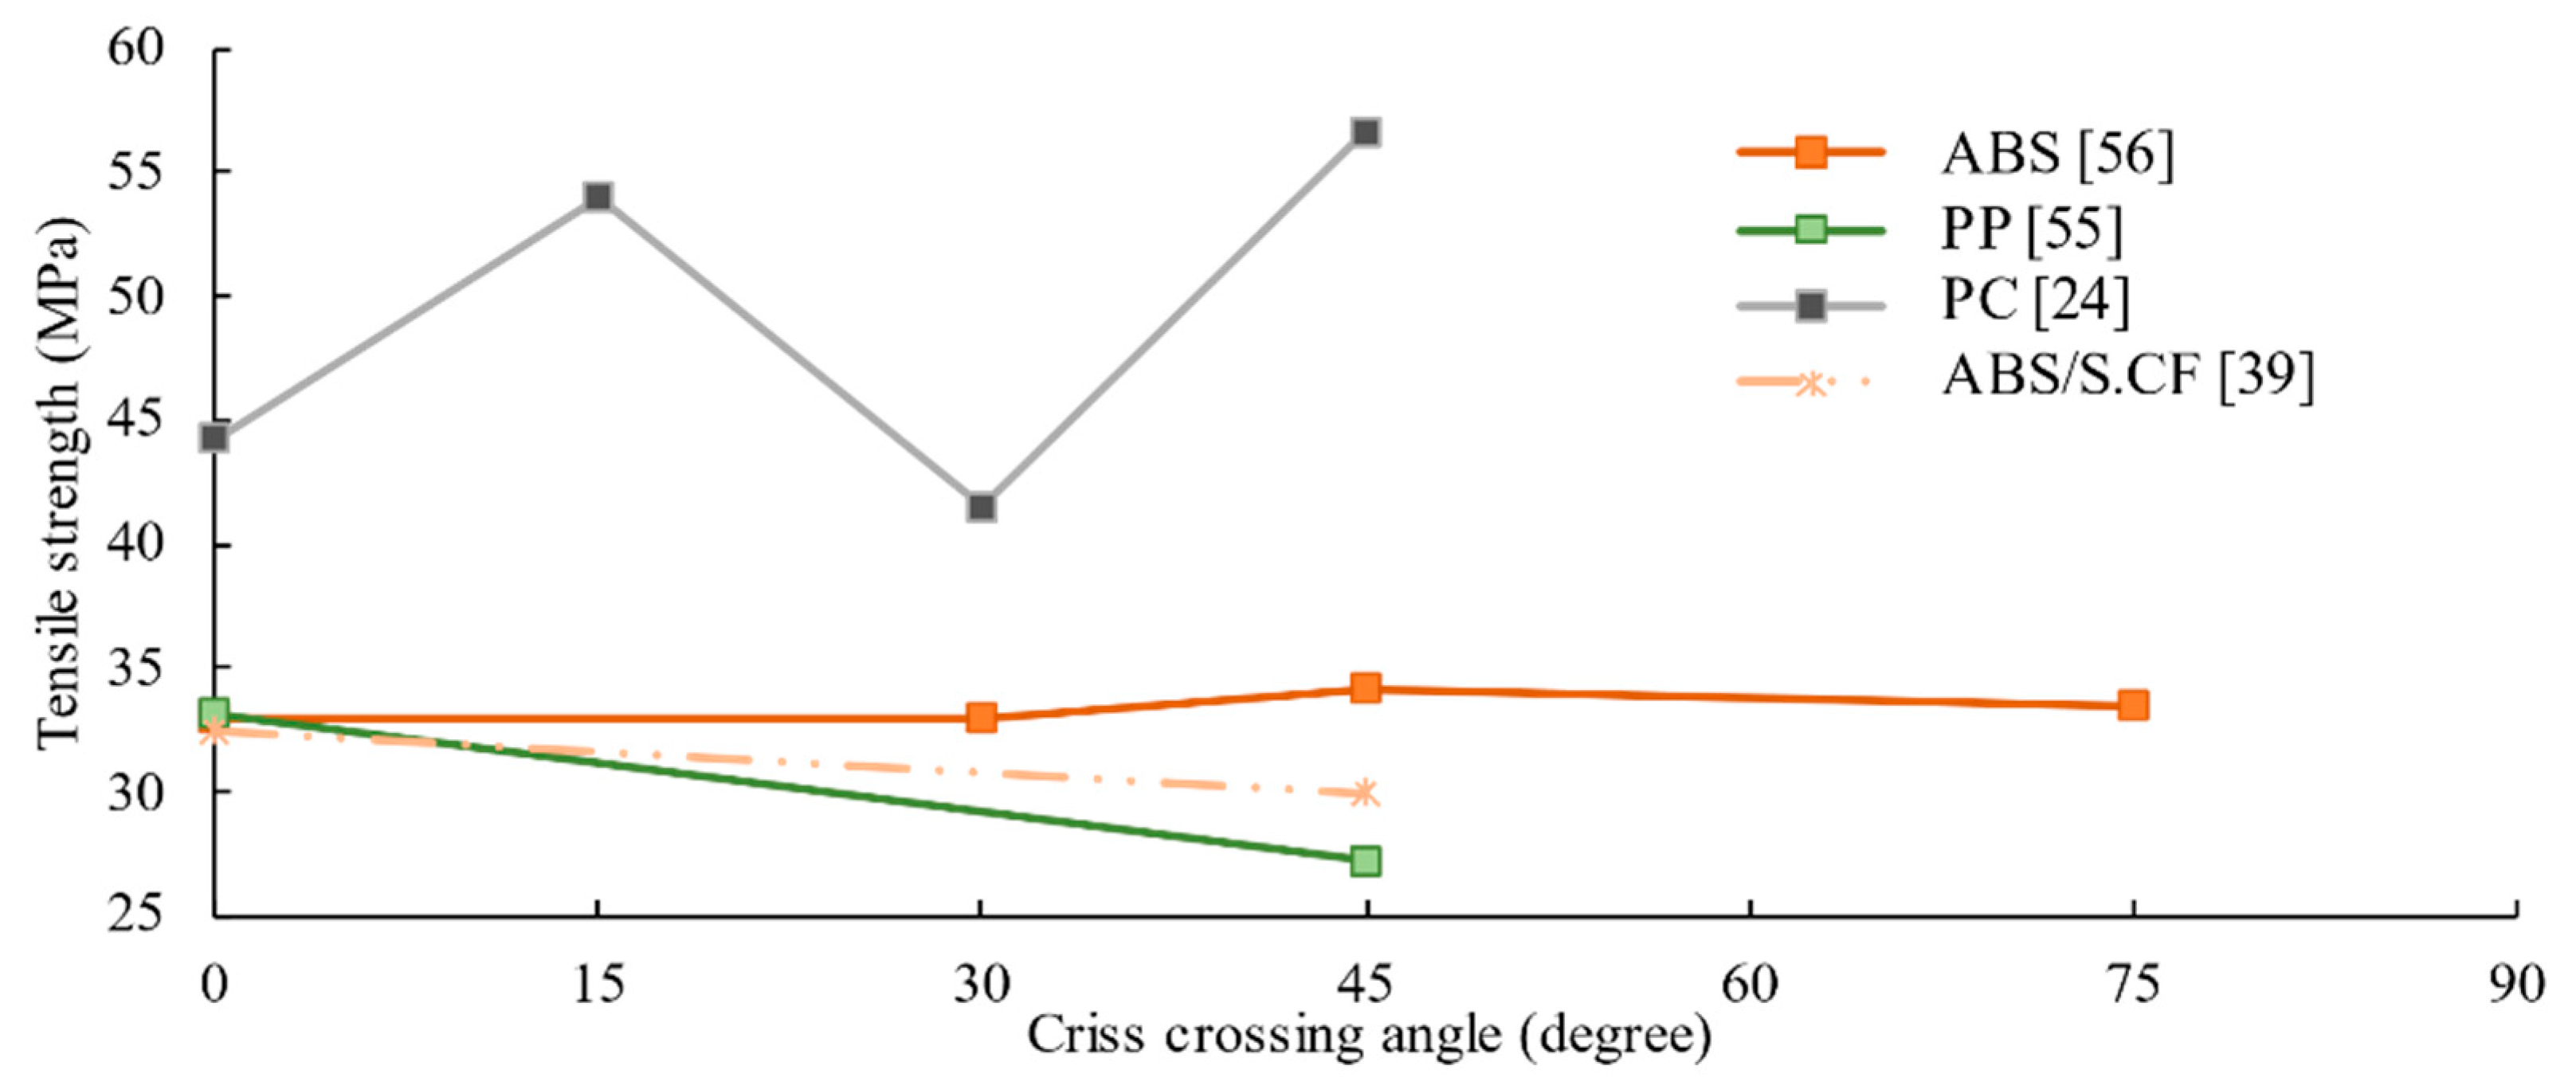
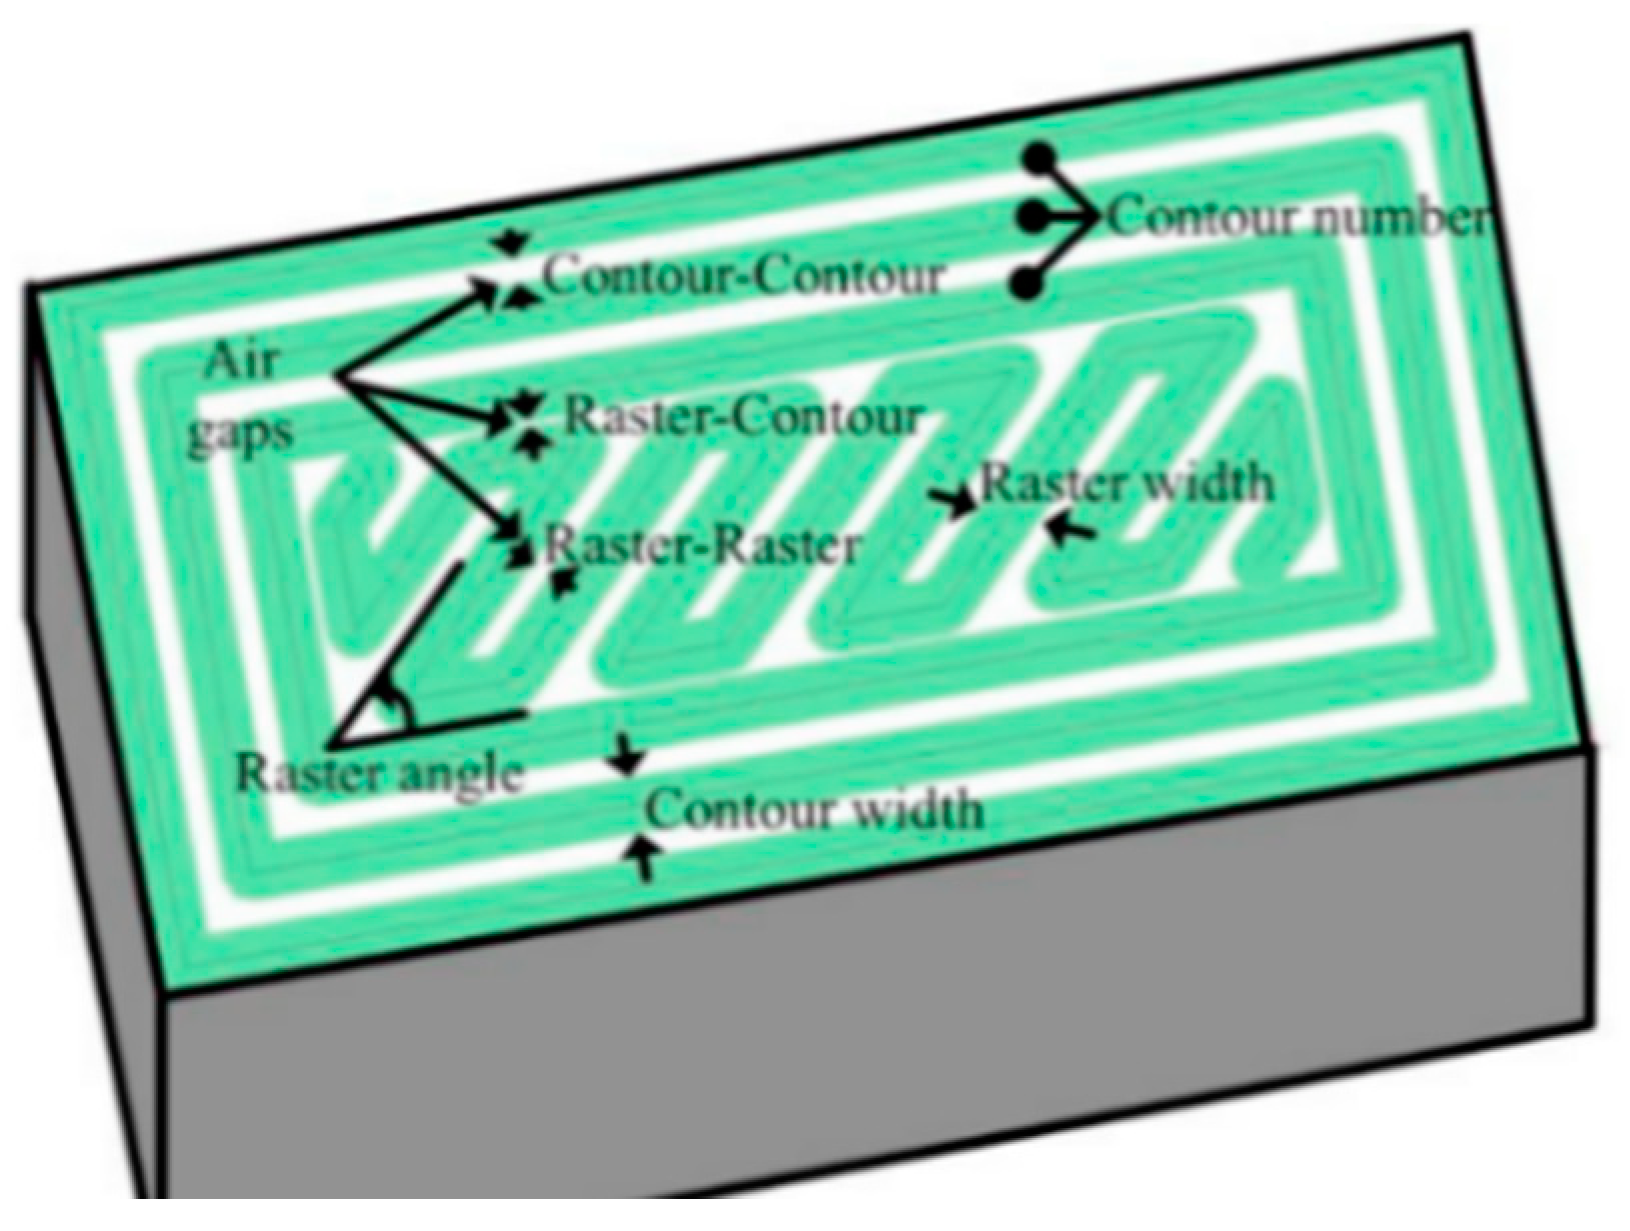
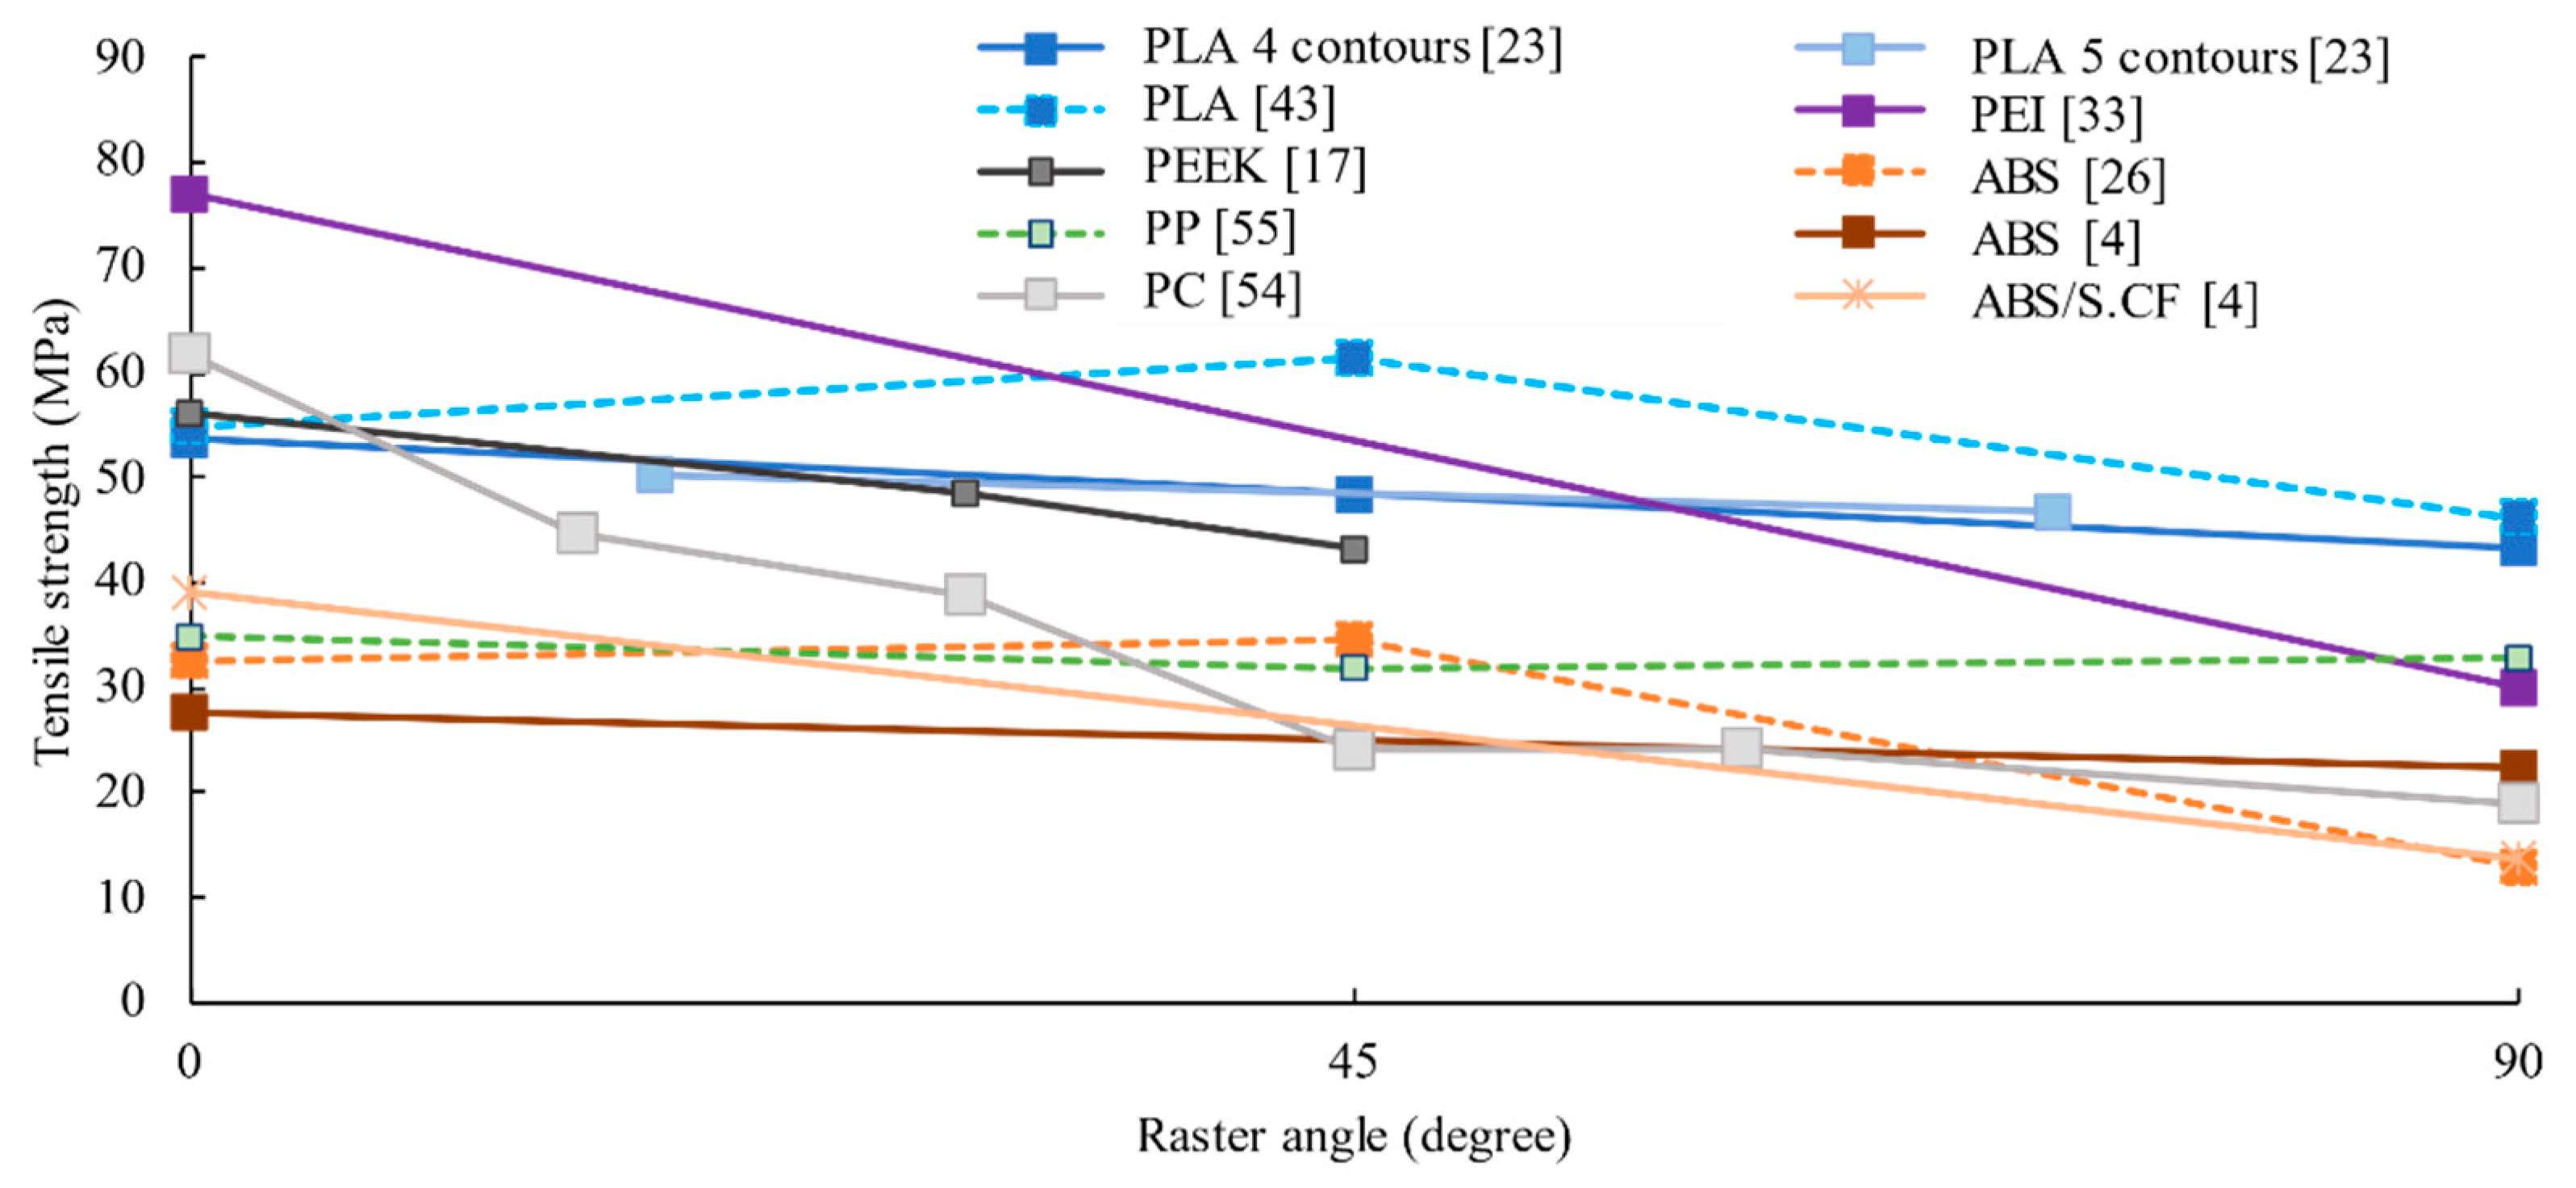
2.6. Raster Angle
2.7. Raster Distance (Raster Width and Air Gap)
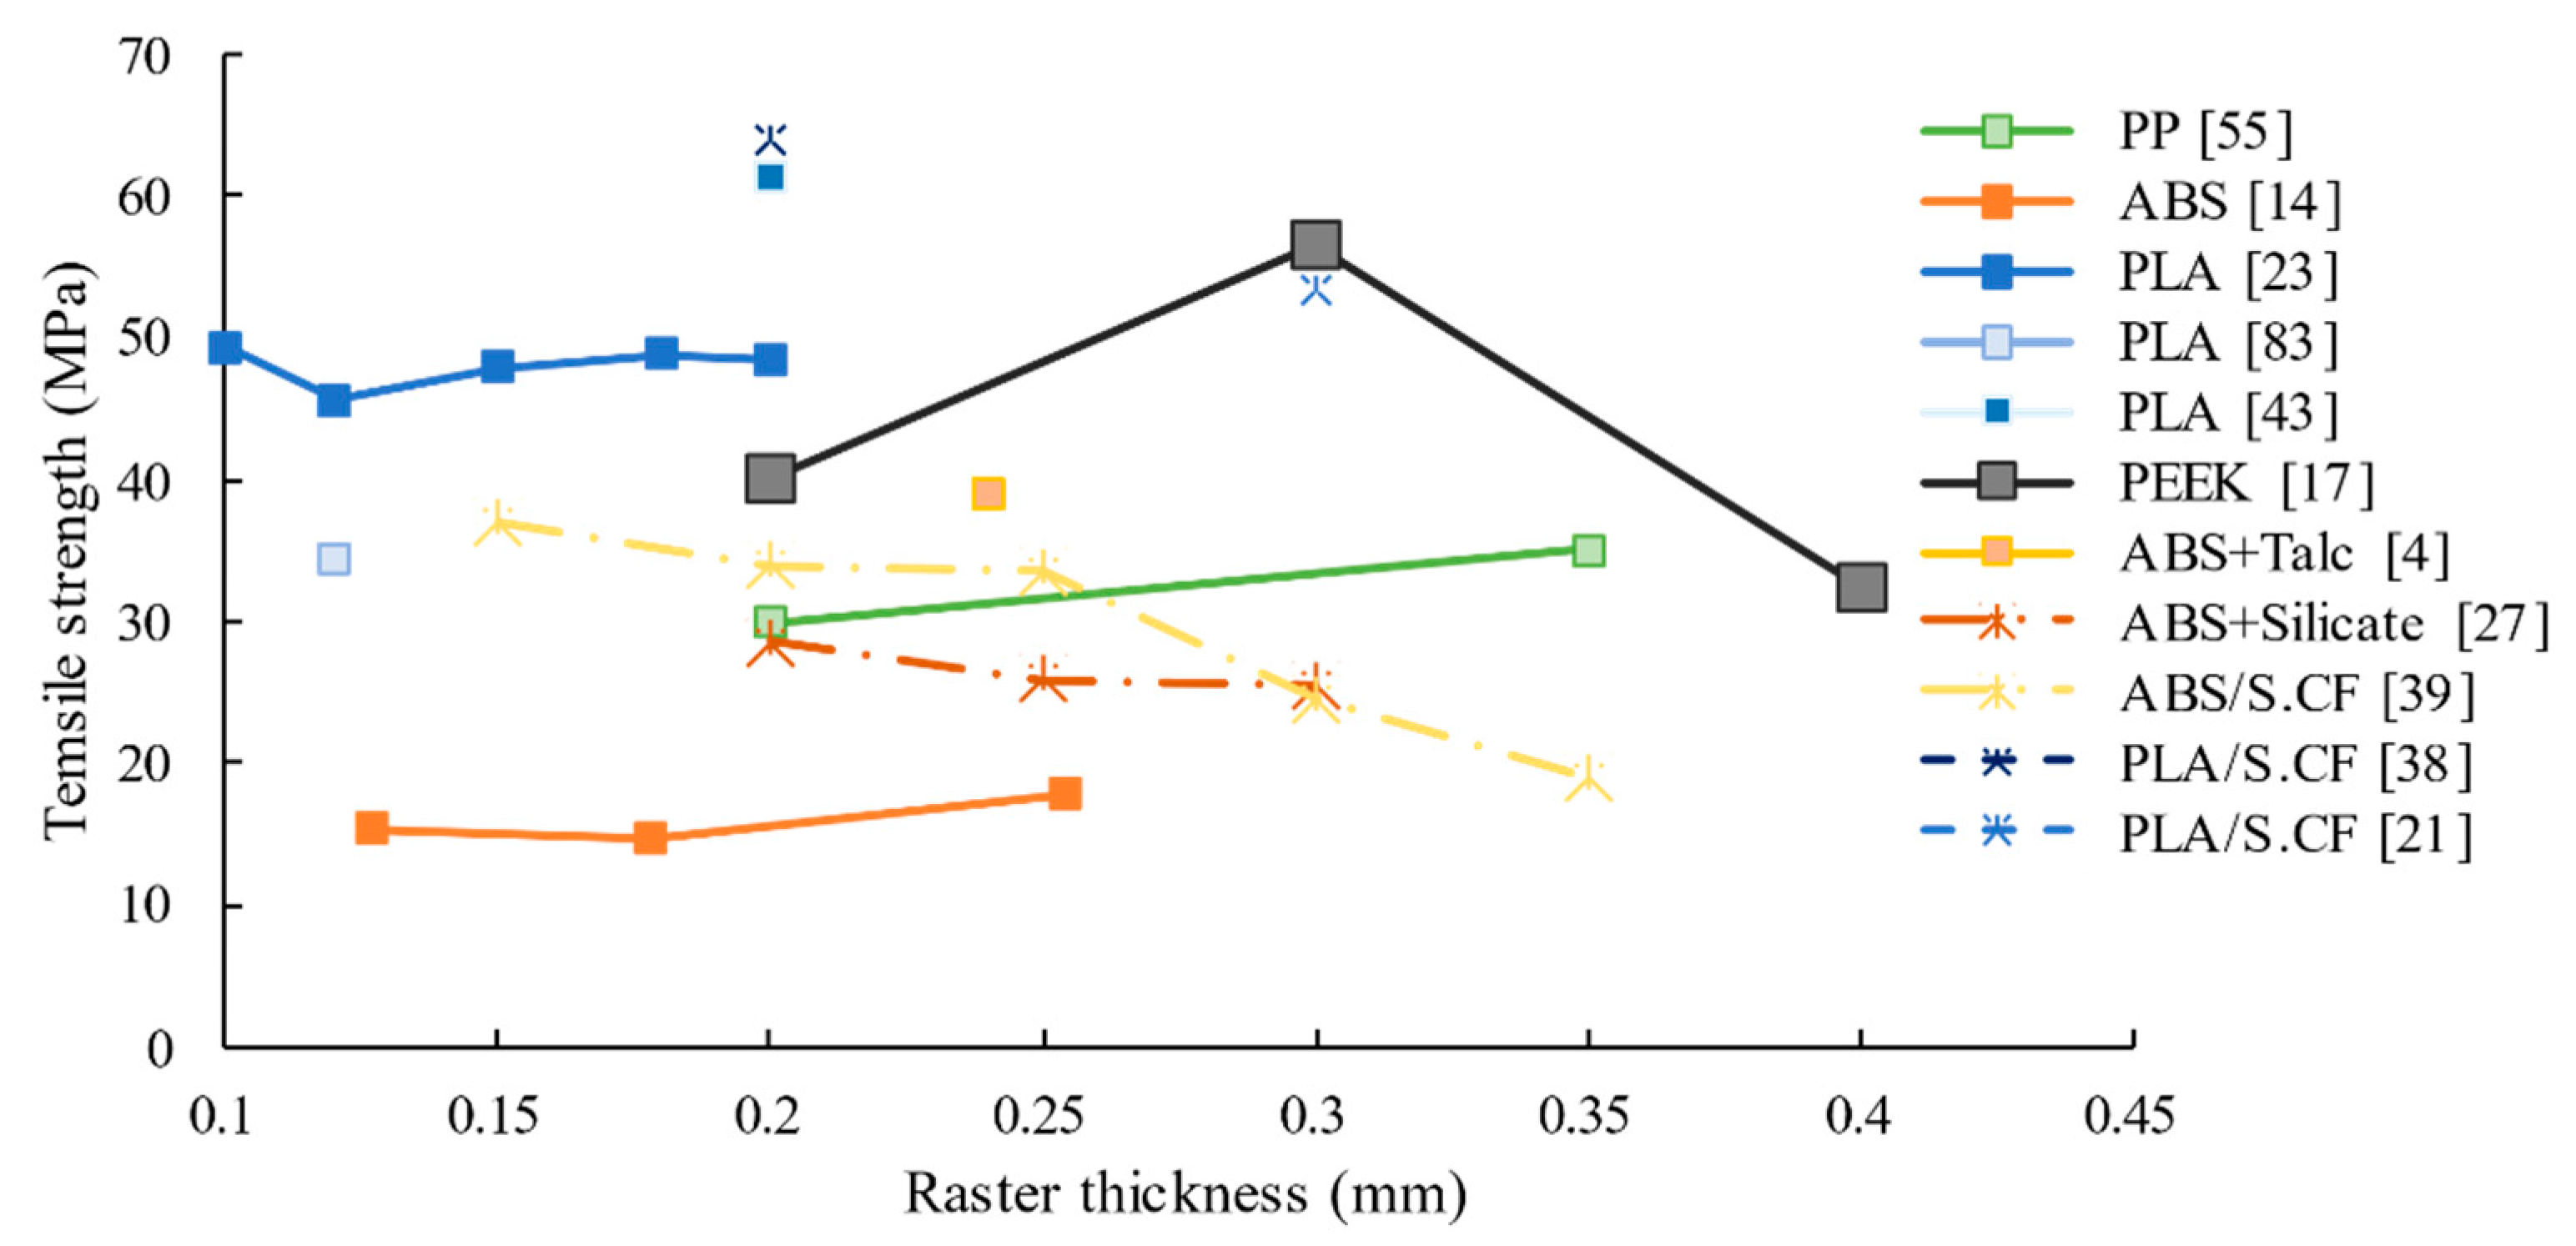
2.8. Raster Thickness
2.9. Contours Numbers
2.10. Infill Volume (%Infill)
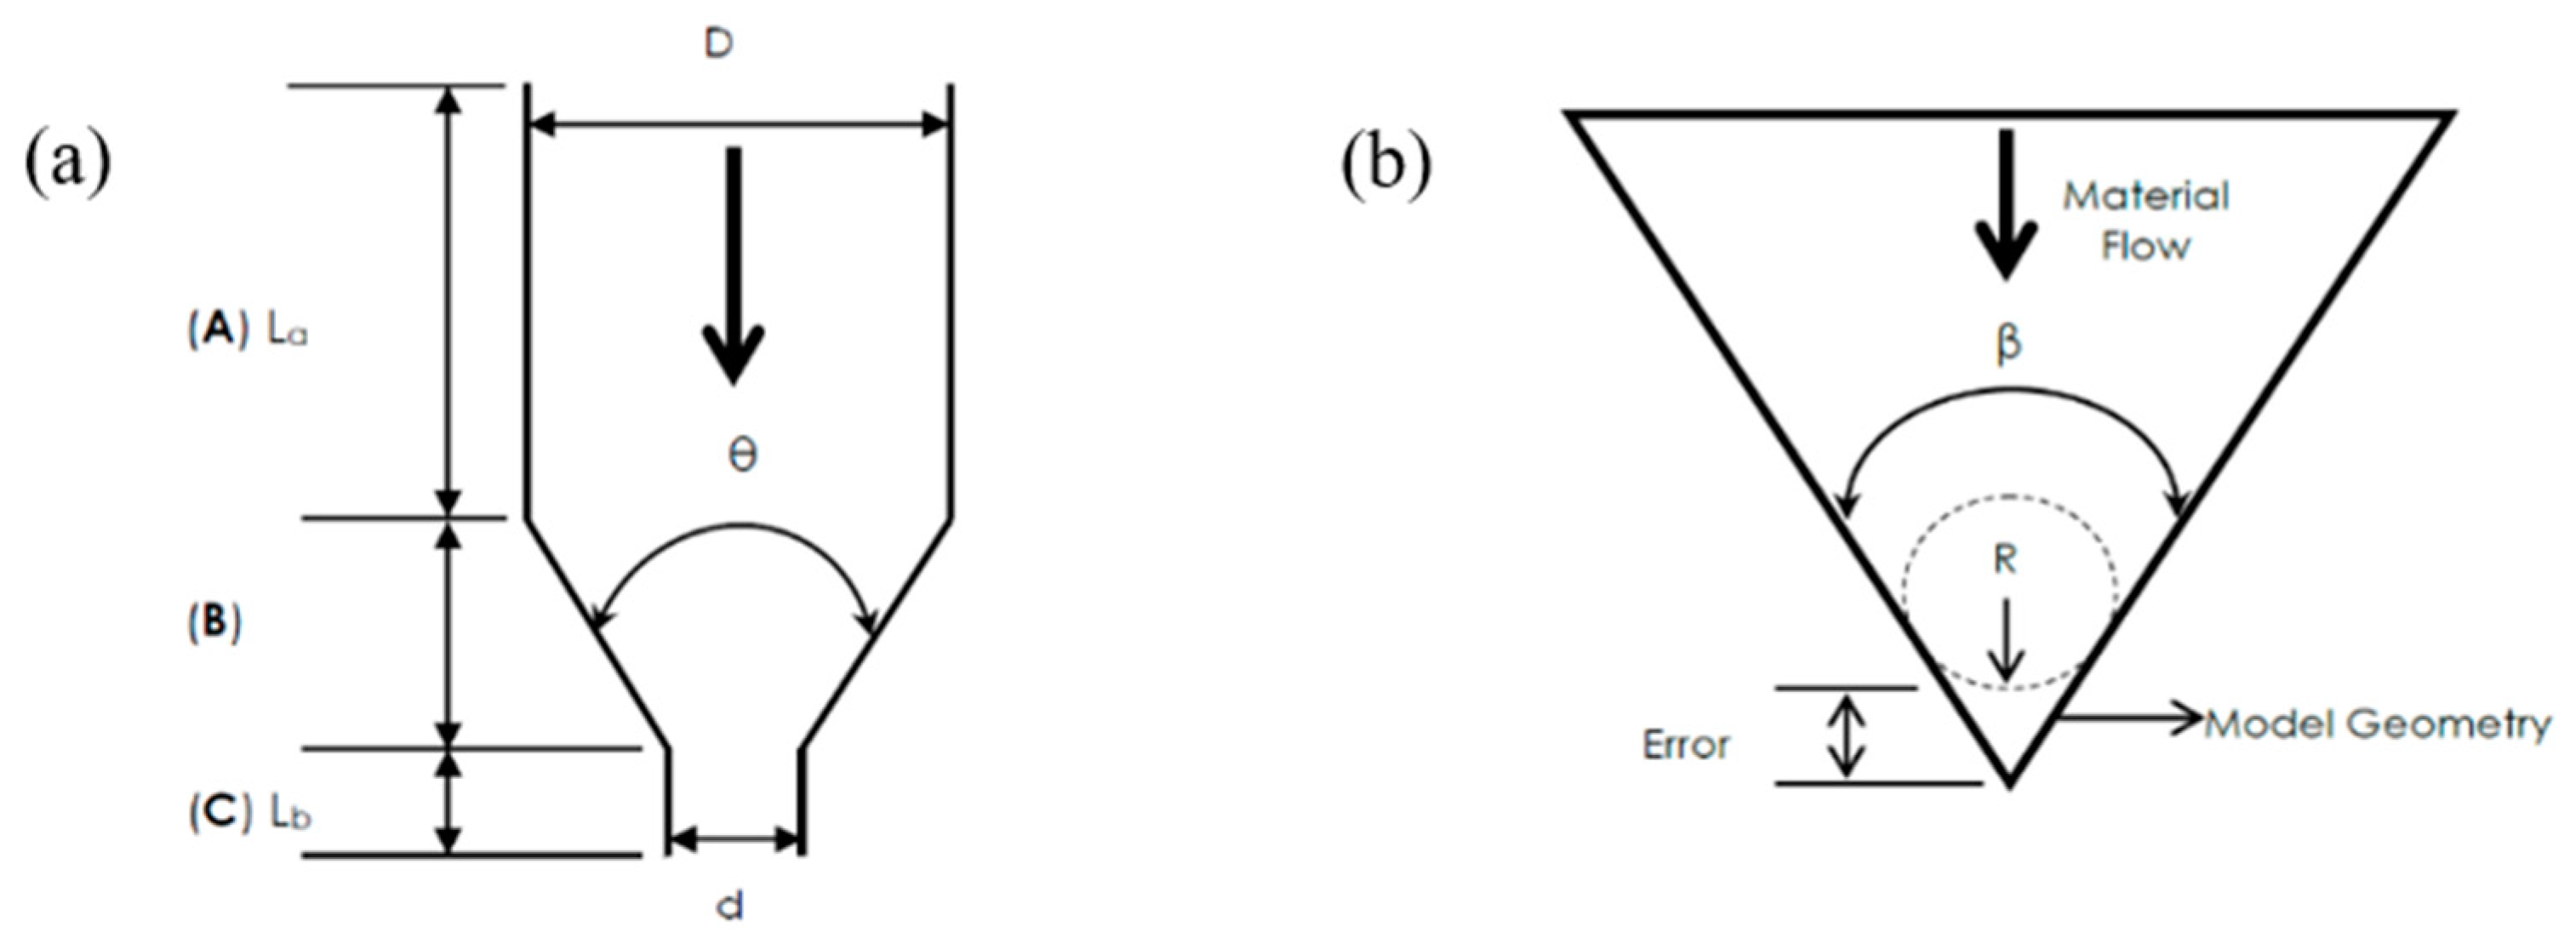
2.11. Nozzle Geometry
3. Material Parameters
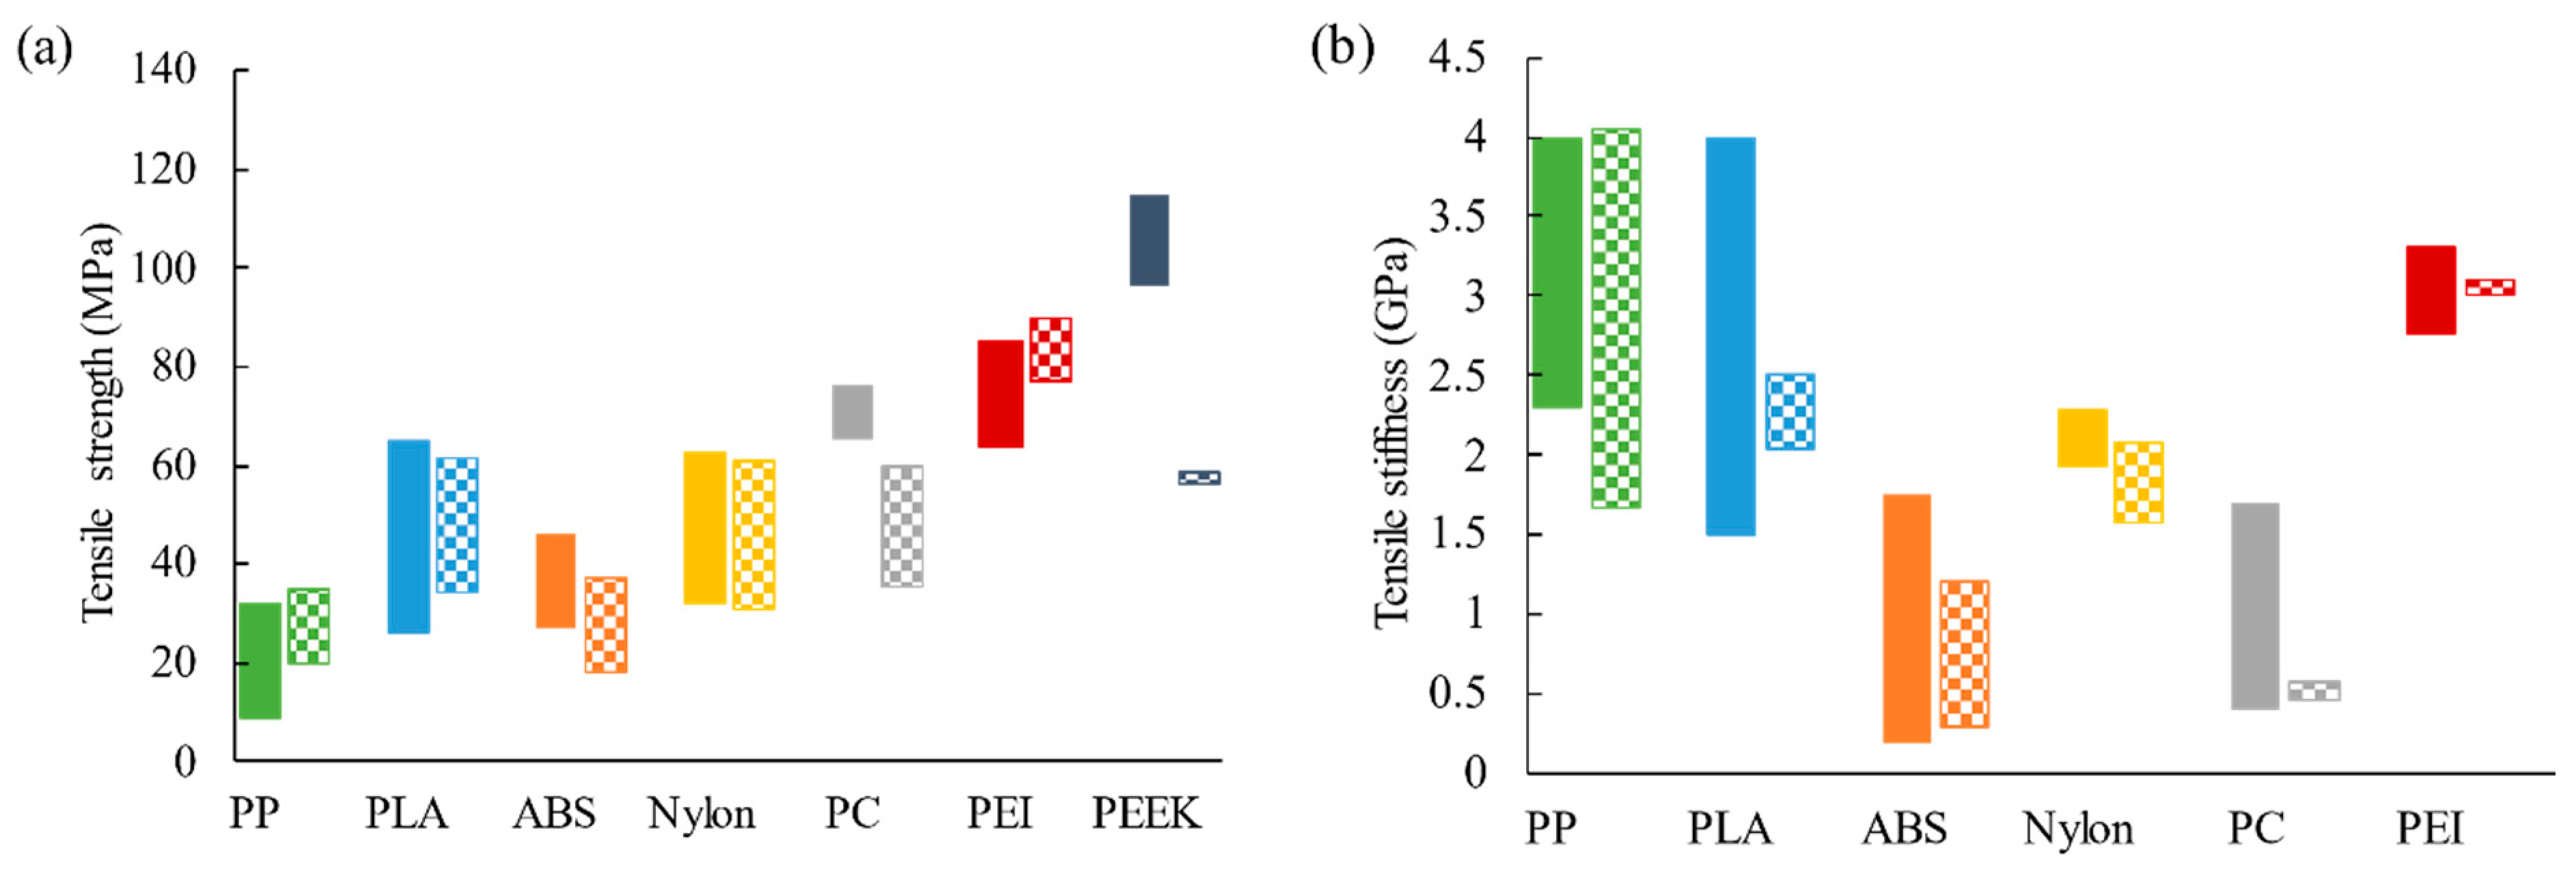
3.1. Matrix
3.2. Reinforcement
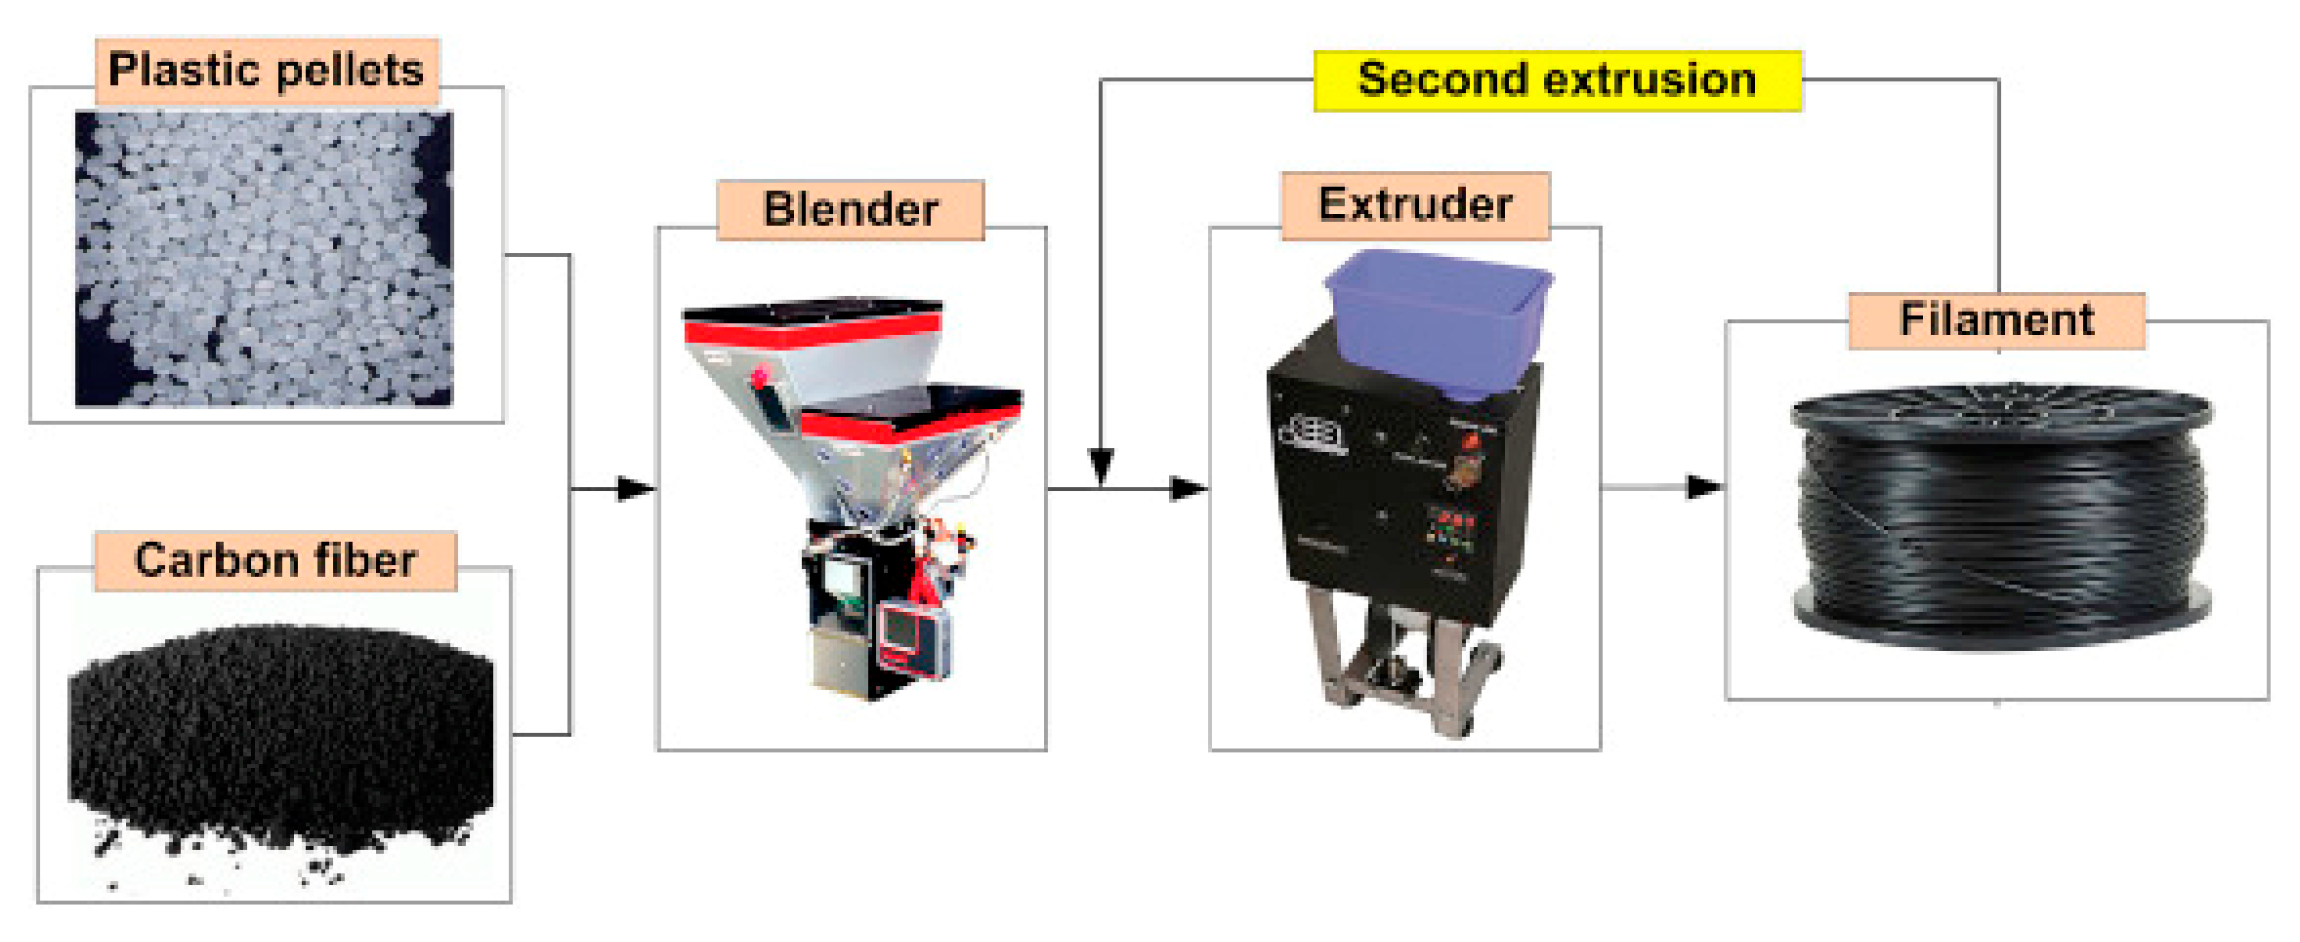
3.2.1. Reinforced Filament Production
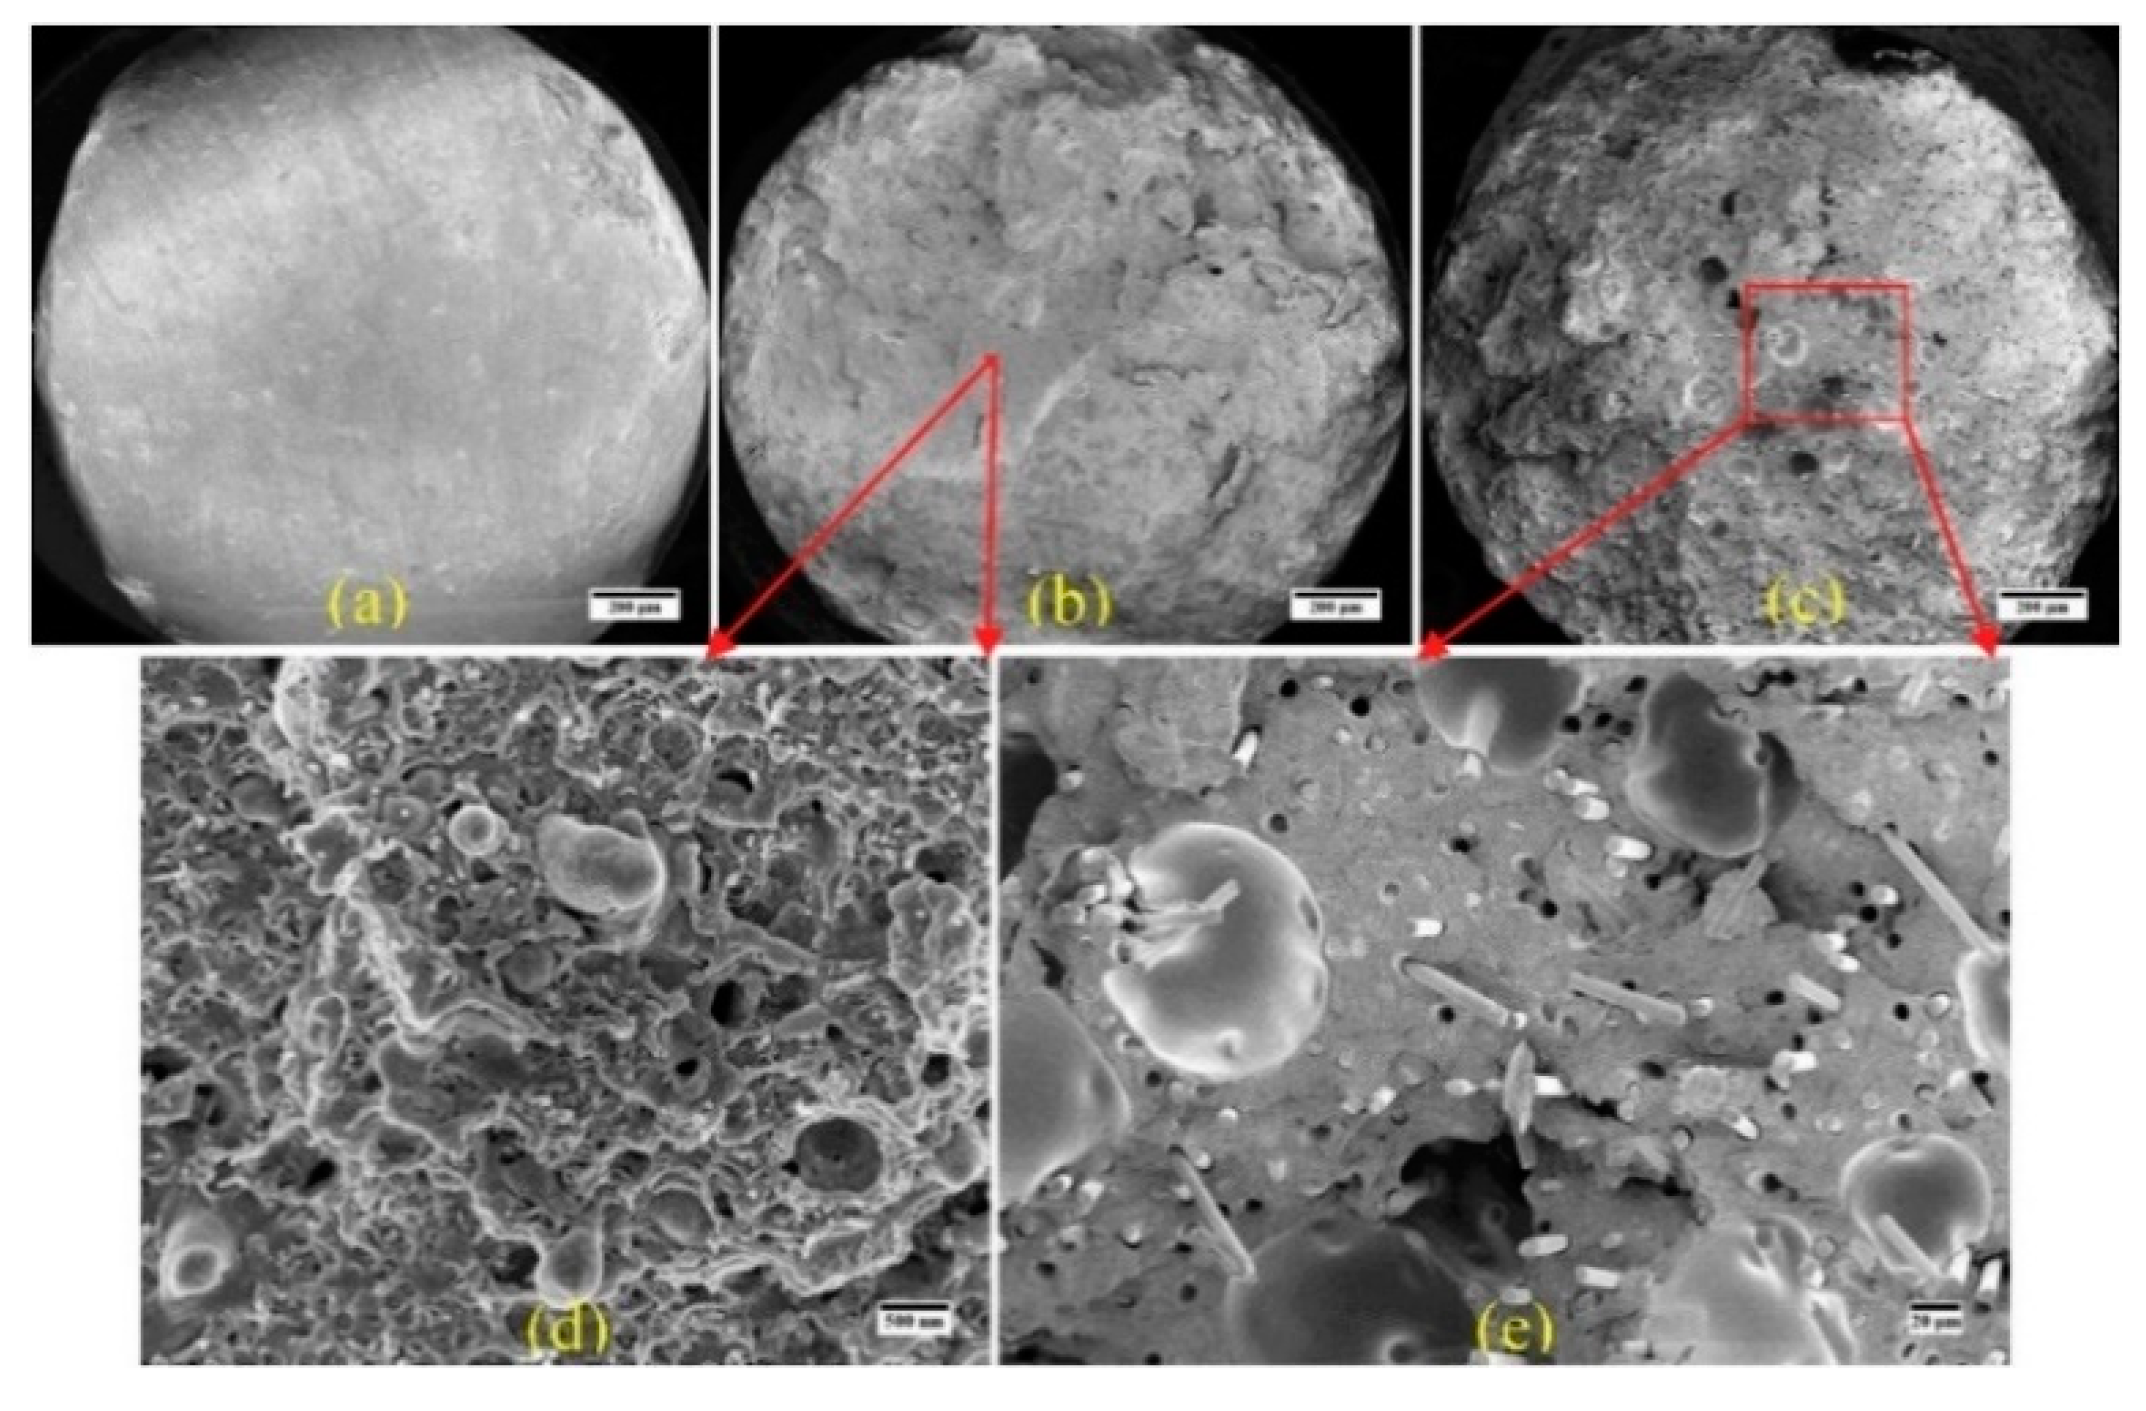
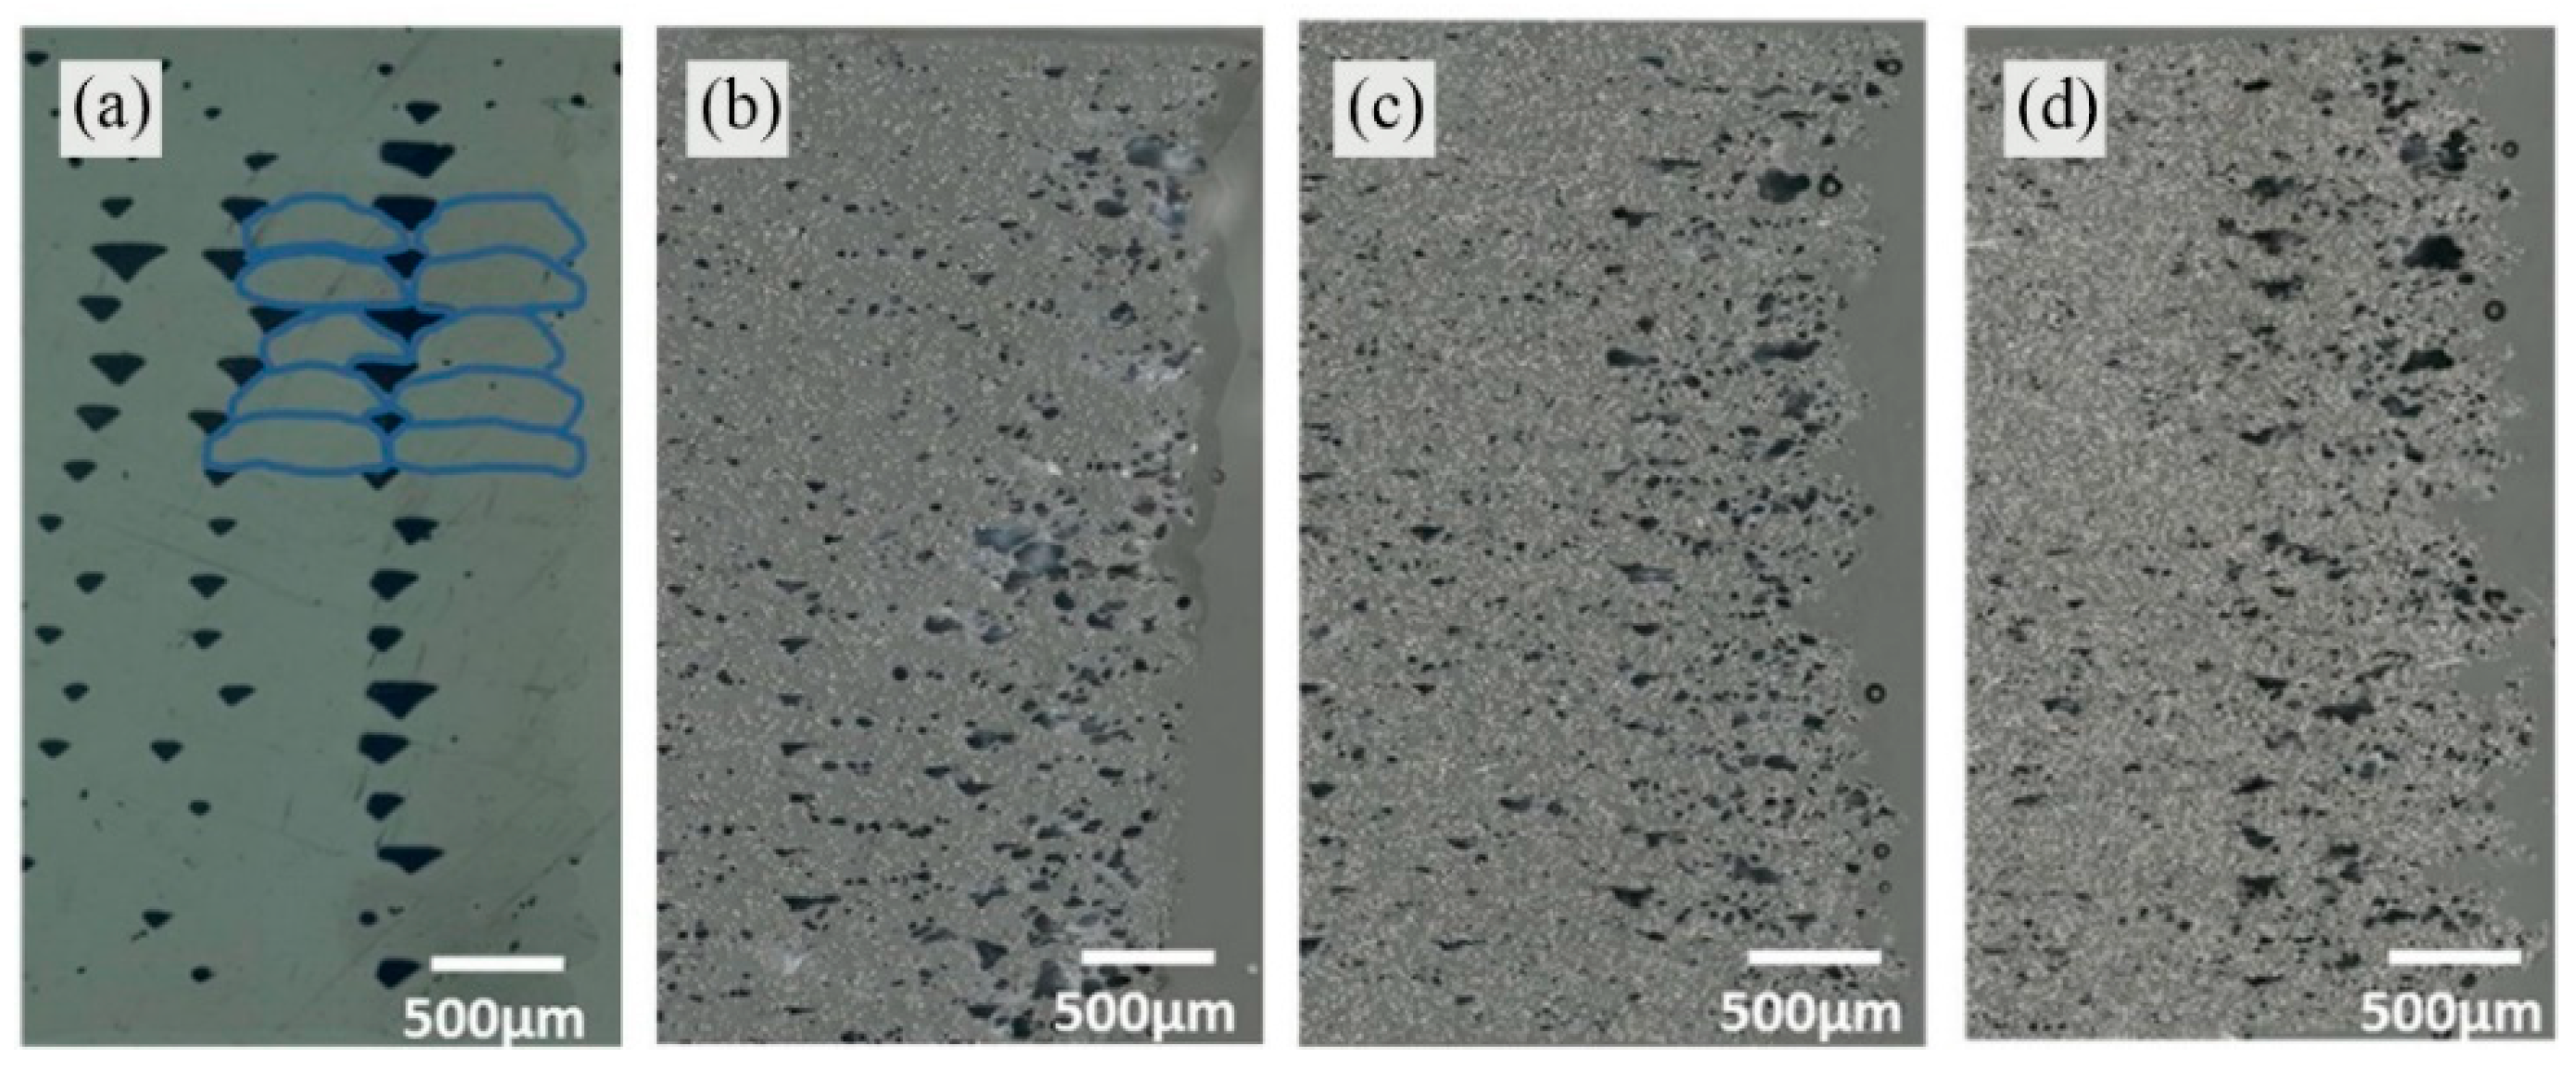
3.2.2. Effect of Reinforcement on Microstructure
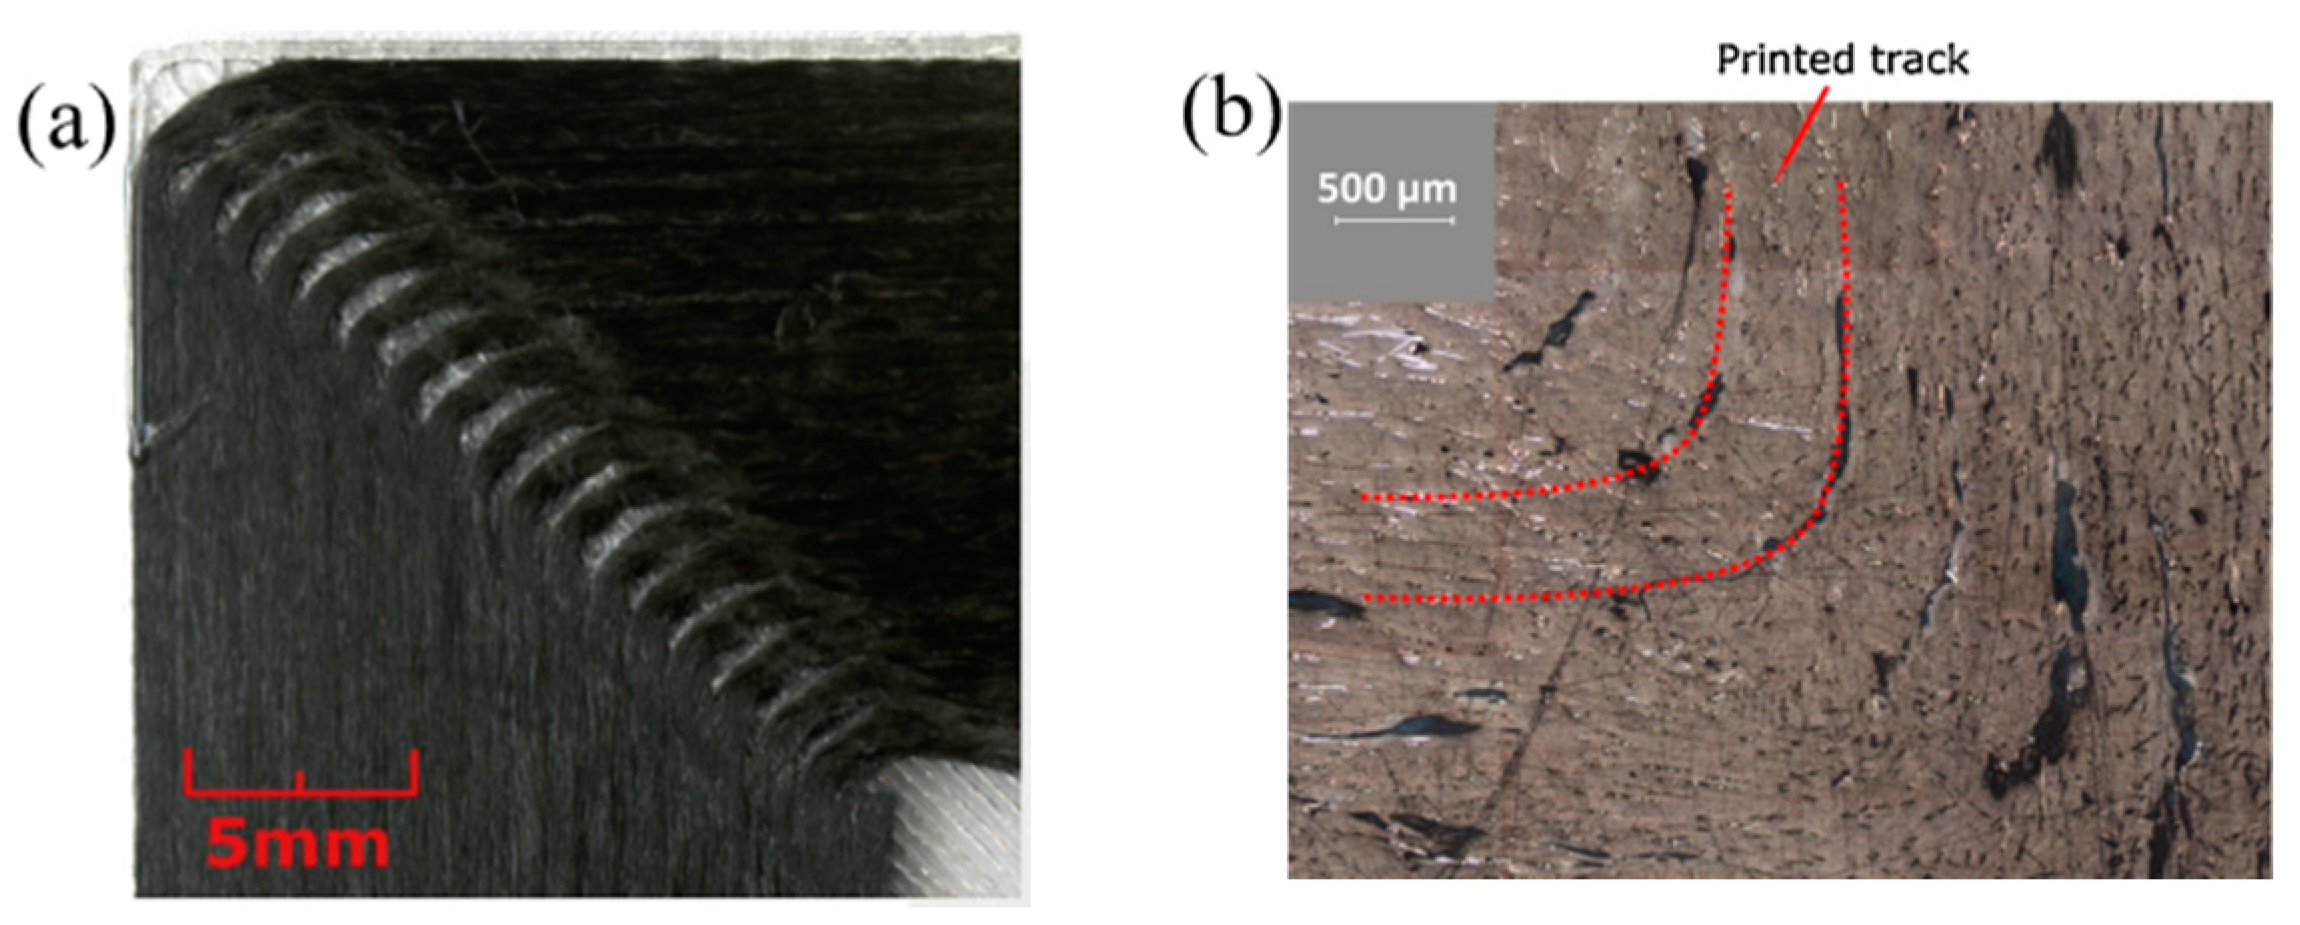
3.2.3. Effect of Reinforcement on Mesostructured
3.2.4. Effect of Reinforcement on Physical and Chemical Properties
3.2.5. Effect of Reinforcement on Mechanical Properties
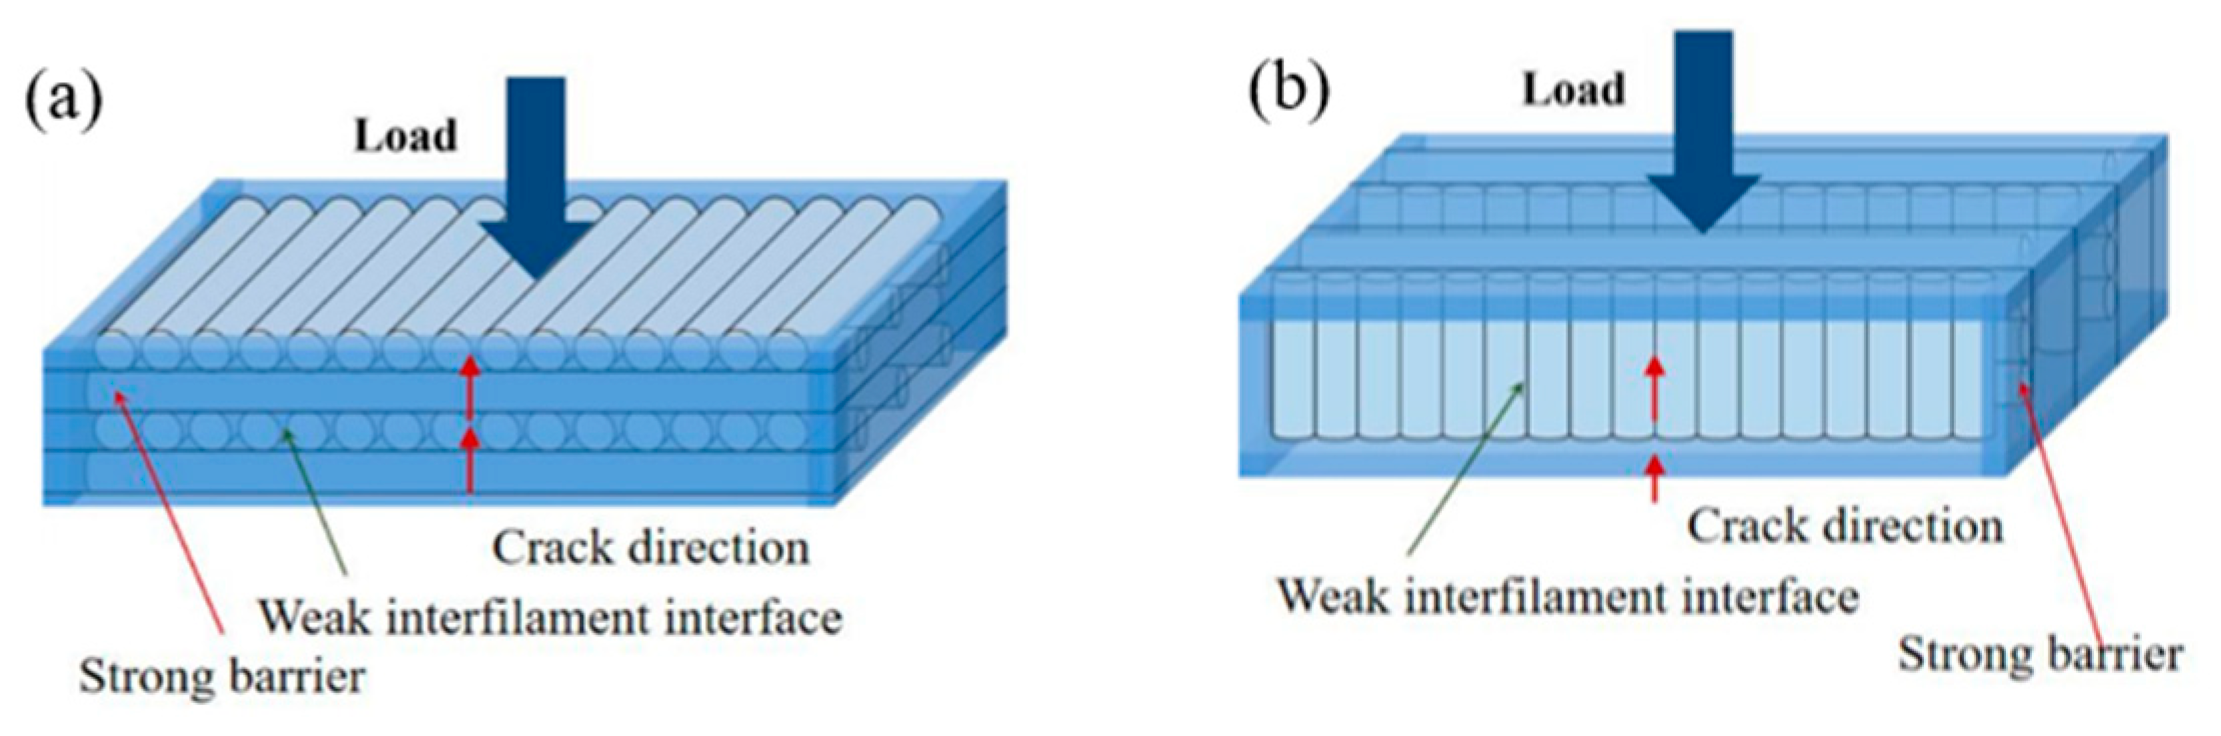
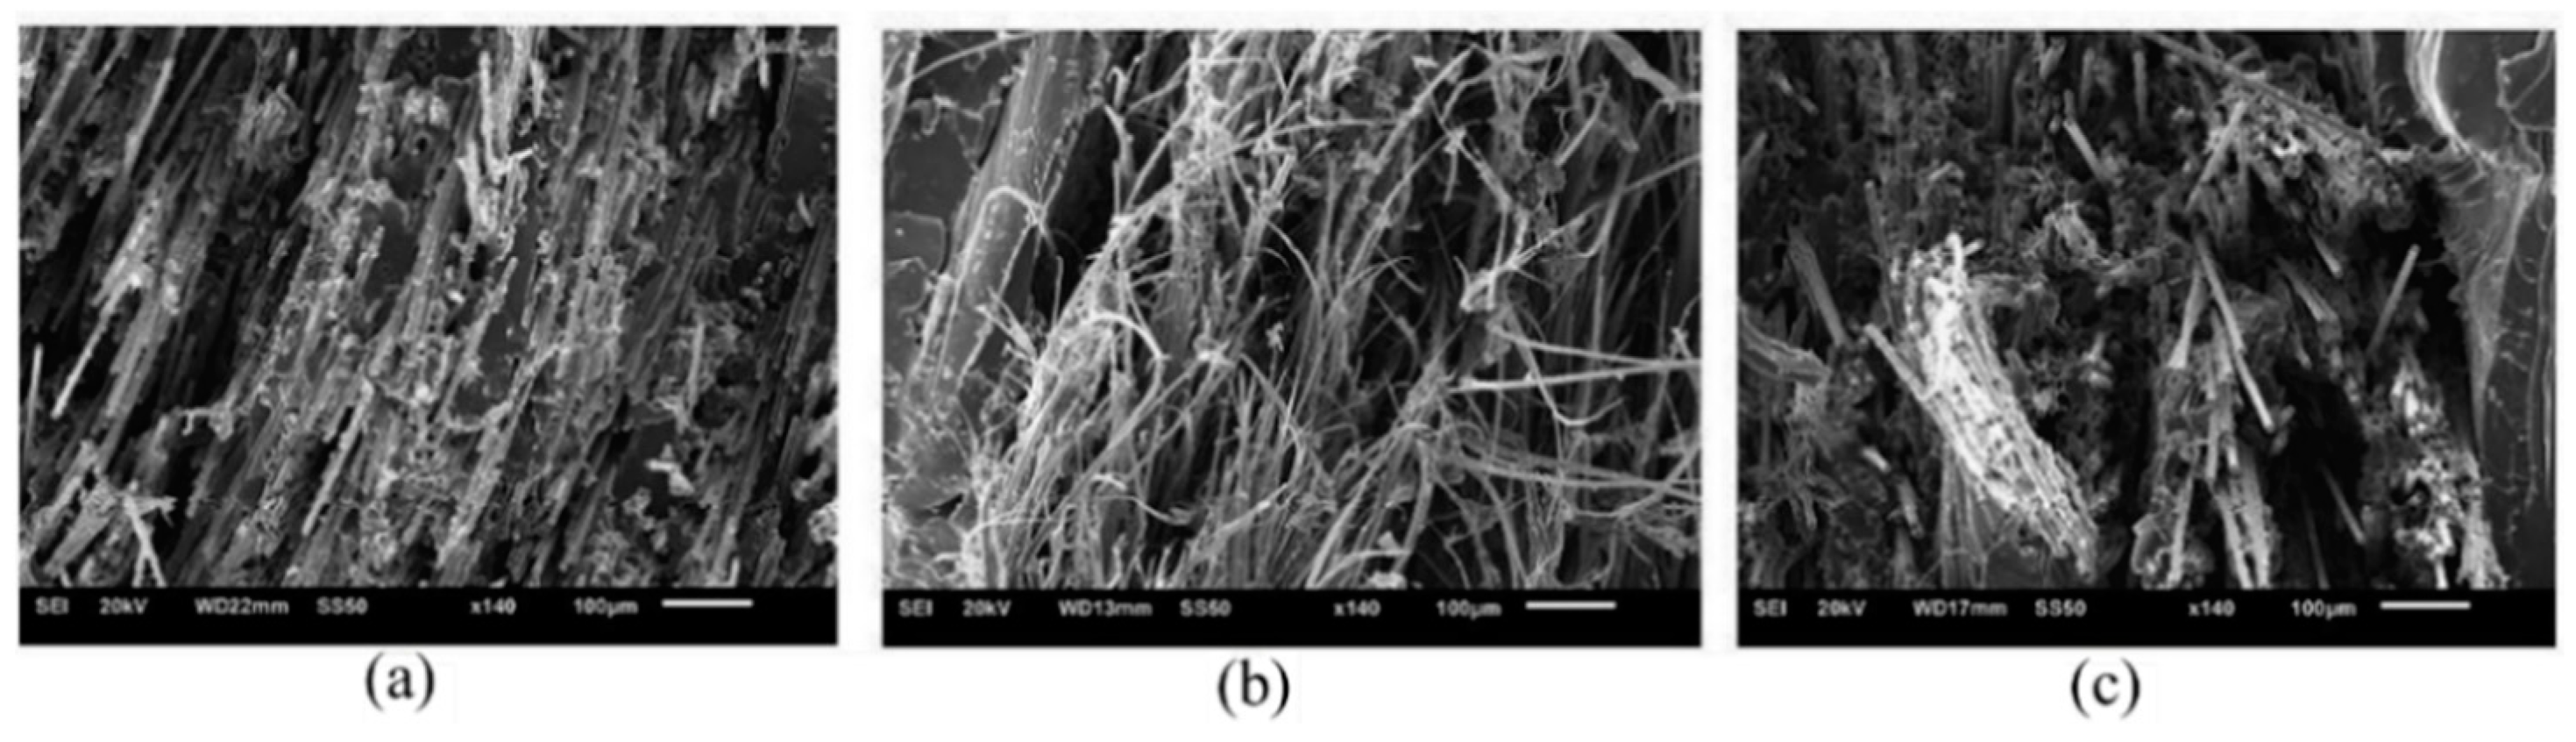
3.2.6. Effect of Reinforcement on Failure Mechanisms
3.2.7. Effect of Fibre Length on Composite Performance
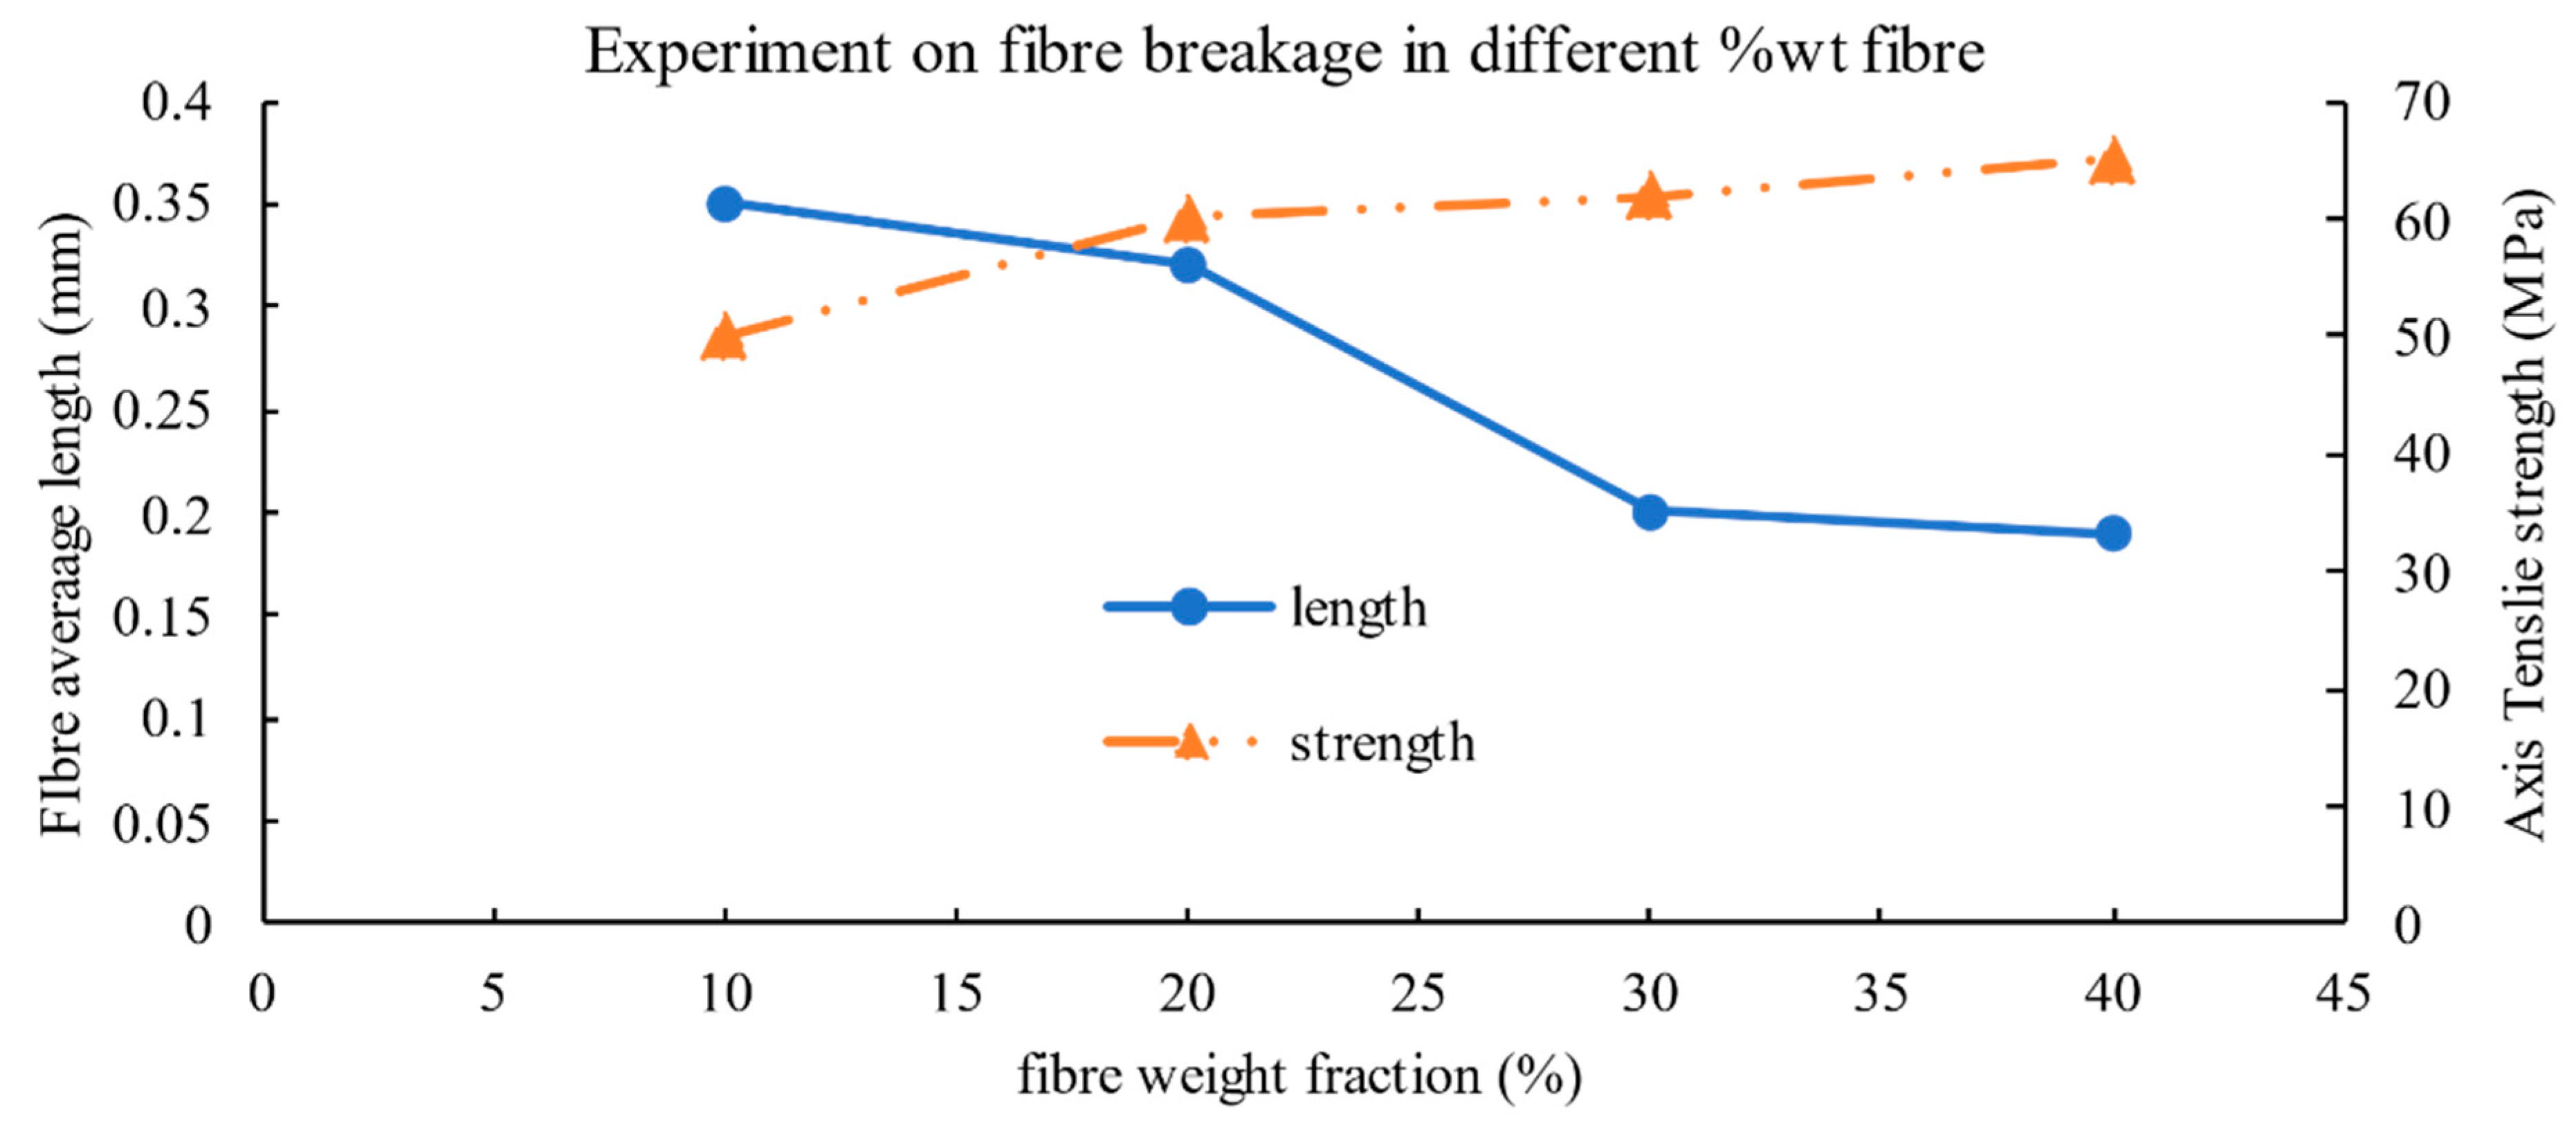
3.2.8. Effect of Fibre Content
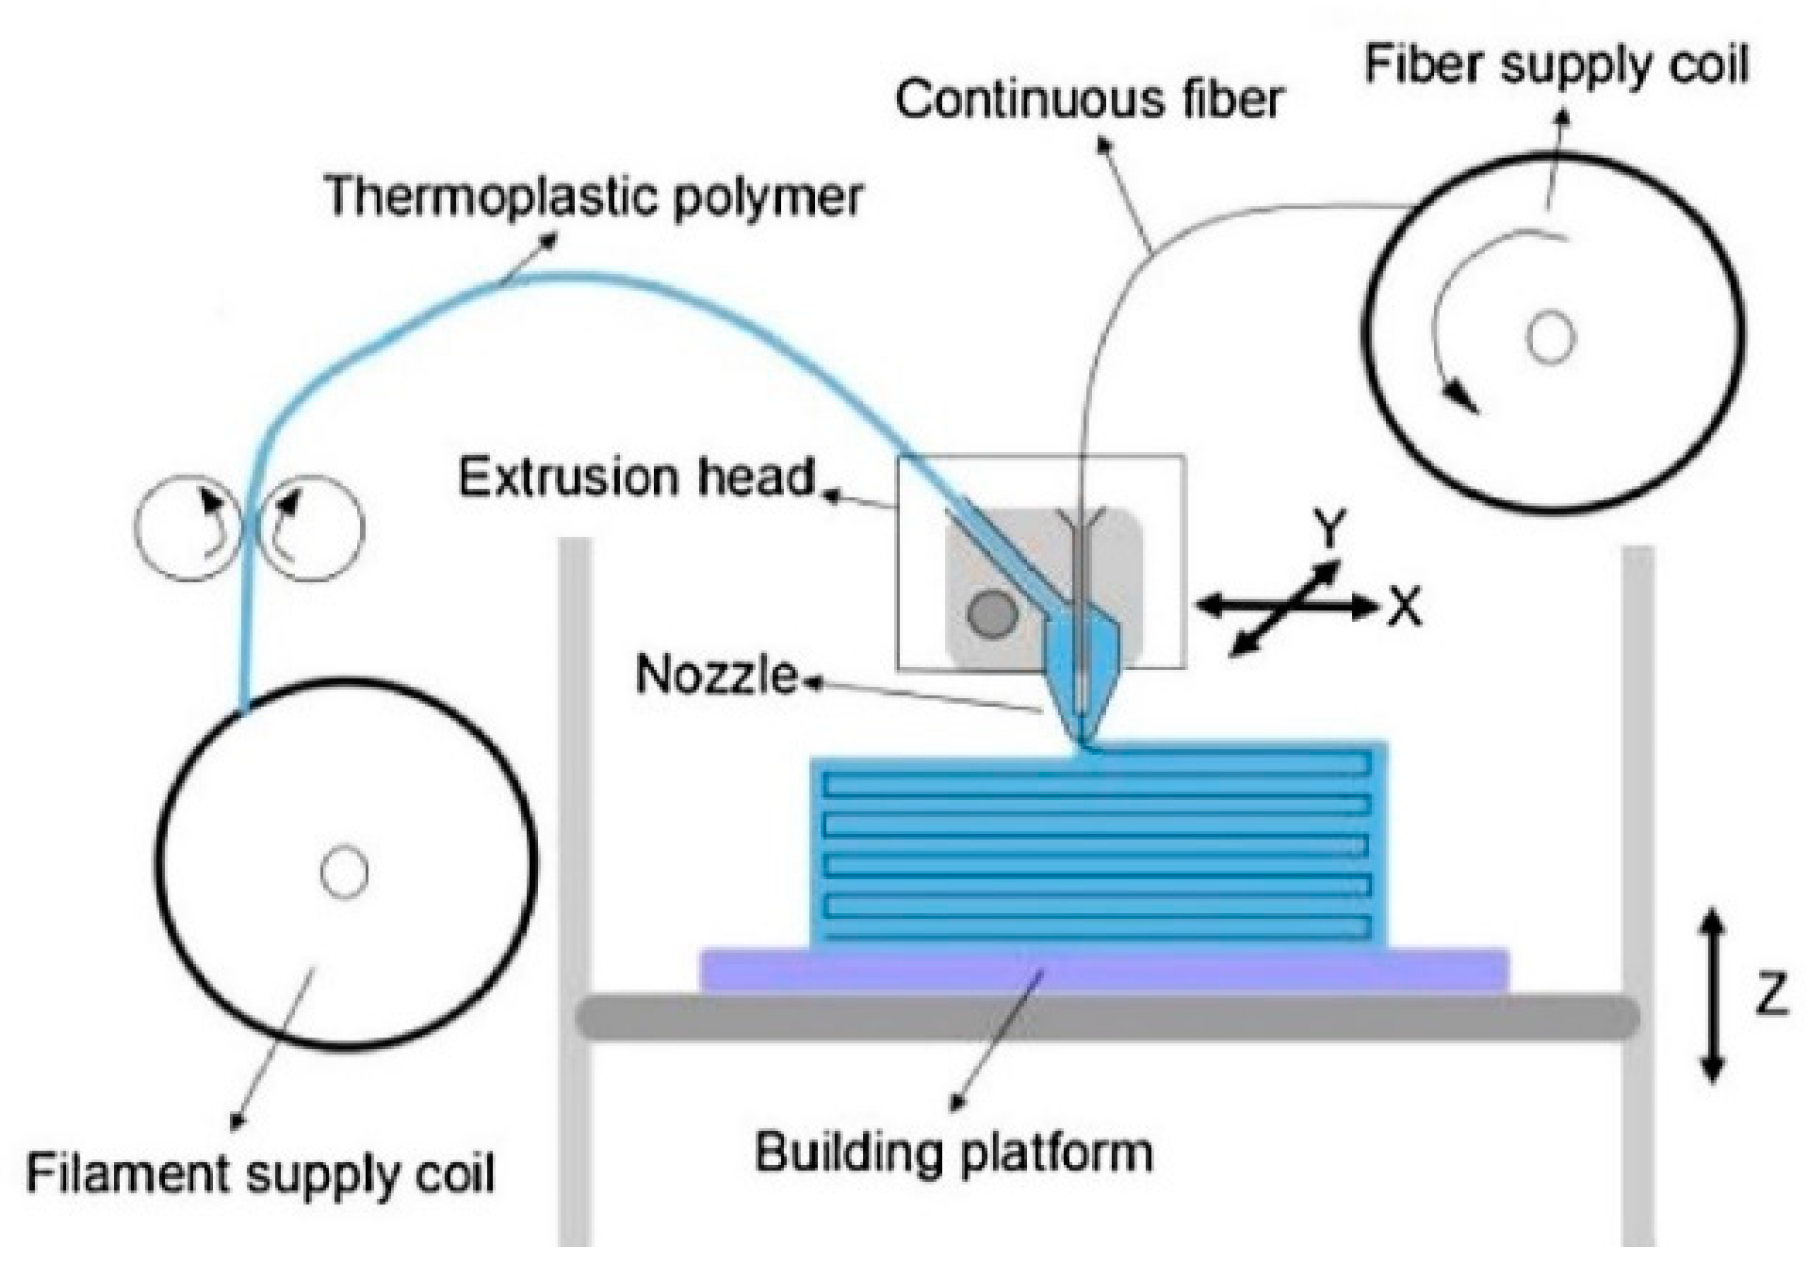
3.2.9. Fibre Alignment during the FDM Process
3.3. Additional Materials
4. Conclusions
Author Contributions
Funding
Conflicts of Interest
Abbreviations
| %infill | Infill volume | PC | Polycarbonate |
| ABS | Poly(acrylonitrile-butadiene-styrene) | PEEK | Poly(ether ether ketone) |
| ALM | Additive layer manufacturing | PEI | Polyetherimide |
| BF | Basalt fibre | PET | Poly(ethylene terephthalate) |
| C. | Continuous fibre | PETG | Poly(ethylene terephthalate glycol) |
| CF | Carbon fibre | PLA | Poly(lactic acid) |
| CNT | Carbon nanotube | PP | Polypropylene |
| FDM | Fused deposition modelling | S. | Short fibre |
| FR | Feed rate of filament | T5% | Degradation temperature, 5% mass loss |
| GF | Glass fibre | TD | Calculated composite density |
| KF | Kevlar fibre, aramid fibre | Tg | Glass transition temperature |
| LLDPE | Linear low-density polyethylene | Tm | Melting temperature |
| MWCNT | Multi-Walled Carbon Nanotubes | TPU | Thermoplastic polyurethane |
| NC | Number of contours | VGCFs | Vapour grown carbon fibres |
| PA | Polyamide, Nylon | wt% | Percentage by weight |
Appendix A

| Study | Material Parameters | Printing Parameters | Tensile Properties | ||||||||||||
|---|---|---|---|---|---|---|---|---|---|---|---|---|---|---|---|
| Polymer | Reinforcement | ||||||||||||||
| Material | Length (mm) | Diameter (μm) | Content (by wt%) | Print Speed (mm/min) | Nozzle Temp. (°C) | Bed Temp. (°C) | Build Orientation F, E, Z | Raster Angle (degree) | Raster Thickness (mm) | Infill Volume (%) | Contour (Lines) | Stiffness (GPa) | Ultimate Strength (MPa) | ||
| Carneiro et al. [55] | PP | 3600 | 165 | room | 45, 0, 90, [±45], [0/90] | 0.2, 0.35 | 20, 60, 100 | 0.3–1.2 | 10–35 | ||||||
| Sood et al. [14] | ABS | F | [0/90], [15/75], [30/60], [±45] | 0.127, 0.178, 0.254 | 9.95–18.09 | ||||||||||
| Onwubolu and Rayegani [26] | ABS | F | 0, 45, 90 | 0.127, 0.330 | 4.01–34.61 | ||||||||||
| Croccolo et al. [63] | ABS | F, E | ±45 | 0.25 | 1, 4, 7, 10 | 1.81–2.11 | 23.9–29.7 | ||||||||
| Durgun and Ertan [46] | ABS | F, E, Z | 0, 30, 45, 60, 90 | 0.253 | 1.9–2.5 | 19–37 | |||||||||
| Dawoud et al. [56] | ABS | 1800 | 250 | 120 | [0/90], [30/60], [±45], [75/15] | 0.5 | 1 | 28–35 | |||||||
| Cantrell et al. [24] | ABS | 235 | 105 | F, E, Z | [0/90], [±45] | 0.1 | 1.96–2.05 | 30.0–32.8 | |||||||
| Zhang et al. [4] | ABS | 3600, 4800, 6000 | 0, [±45], 90 | 0.18, 0.24, 0.3 | 1.95–2.44 | 22.31–27.69 | |||||||||
| Walter et al. [28] | ABS | F | [±45] | 0.25 | 1.89–2.18 | 21.5–28.8 | |||||||||
| Duty et al. [47] | ABS | 250 | 95 | 2.3–2.41 | 31.2–34 | ||||||||||
| Cicala et al. [83] | PLA | 2100–2700 | 210 | 50 | [0/90] | 0.12 | 100 | 2.66–3.74 | 28.37–34.43 | ||||||
| Song et al. [43] | PLA | 2700, 3600, 6000, 9000 | 200, 210, 220, 230 | E | 0, 45, 90 | 0.1, 0.2, 0.3, 0.4 | 3.96–4.04 | 46.24–61.42 | |||||||
| Lanzotti et al. [23] | PLA | 3600 | 205 | 60 | F | 0, 18, 45, 72, 90 | 0.1, 0.12, 0.15, 0.18, 0.2 | 100 | 2, 3, 4, 5, 6 | 2.79–3.49 | 37.62–53.59 | ||||
| Ivey et al. [12] | PLA | 1800 1st 2100 rest | 200 | 85 | [0/90] | 0.1 | 100 | 2 | 3.37 | 59.3 | |||||
| Papon et al. [58] | PLA | 1200 | 220 | 110 | [45/−45/45/90/0]s | 0.4 | 100 | 1.670 | 45 | ||||||
| Dickson et al. [84] | Nylon | concentric, 0 | 0.53 | 61 | |||||||||||
| Chacón et al. [52] | Nylon | 274 | F, E | 0 | 0.1, 0.125, 0.2 | 100 | 0.41–0.47 | 27.2–30.9 | |||||||
| Cantrell et al. [24] | PC | 345 | 145 | F, E, Z | [0/90], [30/60], [±45], [75/15] | 1.62–2 | 30.4–43.5 | ||||||||
| Hill and Haghi [54] | PC | 300 | F | 0, 15, 30, 45, 60, 75, 90 | 0.267 | 1.35–2.082 | 16.89–59.77 | ||||||||
| Smith and Dean [45] | PC | F, E, Z | [0/90] | 0.508 | 1.18–1.57 | 20.6–35.7 | |||||||||
| Hossain et al. [57] | PC | 345 | 140 | [0/90], [30/60], [±45] | 0.432–0.508 | 1.5–1.83 | 45–55 | ||||||||
| Wu et al. [17] | PEEK | 334 | F | 0, 30, 45 | 0.2, 0.3, 0.4 | 2 | 32.4–56.6 | ||||||||
| Gebisa and Lemu [33] | PEI | F | 0, 90 | 1, 5 | 26–77 | ||||||||||
| Gardner et al. [10] | PEI | 375 | 162 | 0 | 3 | 90 | |||||||||
| Study | Material Parameters | Printing Parameters | Tensile Properties | ||||||||||||
|---|---|---|---|---|---|---|---|---|---|---|---|---|---|---|---|
| Polymer | Reinforcement | ||||||||||||||
| Material | Length (mm) | Diameter (μm) | Content (by wt%) | Print Speed (mm/min) | Nozzle Temp. (°C) | Bed Temp. (°C) | Build Orientation F, E, Z | Raster Angle (degree) | Raster Thickness (mm) | Infill Volume (%) | Contour (Lines) | Stiffness (GPa) | Ultimate Strength (MPa) | ||
| Carneiro et al. [55] | PP | GF | 30 | 480 | 185 | [±45] | 0.2 | 100 | 1.9 | 40 | |||||
| Sodeifia et al. [15] | PP | GF | 240 | 30 | 0.1, 0.4 | 100 | 0.25–0.4 | 20–32 | |||||||
| Ning et al. [41] | ABS | CF | 0.150, 0.100 | 7.2 | 3–15 | 1200 1st 1500 rest | 230 | [±45] | 0.2 | 100 | 2–2.6 | 34–44 | |||
| Ning et al. [39] | ABS | CF | 5 | 15, 20, 25, 30, 35 | 200, 210, 220, 230, 240 | 80 | F | [±45], [0/90] | 0.15, 0.2, 0.25, 0.3, 0.35 | 100 | 3 | 0.6–1.1 | 18–37 | ||
| Tekinalp et al. [38] | ABS | CF | <0.4 | 10–40 | 205 | 0.2 | 2–14 | 30–65 | |||||||
| Love et al. [49] | ABS | CF | <0.4 | 13 | 220 | 1.52–8.91 | 7.0- 70.69 | ||||||||
| Duty et al. [48] | ABS | CF | 1 | 20 | 3048 | 250 | 0, 90 | 2.13–11.92 | 10.27–66.18 | ||||||
| Duty et al. [47] | ABS | CF | <3 | 13, 20 | 250 | 95 | 8.18–11.94 | 53.3–66.4 | |||||||
| Zhang et al. [4] | ABS | CF | 8 | 3600, 4800, 6000 | 0, [±45], 90 | 0.18, 0.24, 0.3 | 2.19–5.89 | 13.74–39.05 | |||||||
| Zhong et al. [11] | ABS | GF | 250 | 60 | F, Z | 24–58 kg * | |||||||||
| Duty et al. [48] | ABS | GF | 1 | 20 | 3048 | 250 | 0, 90 | 2.48–5.65 | 15.30–54.33 | ||||||
| Duty et al. [47] | ABS | GF | <3 | 20 | 250 | 95 | 5.67 | 54.4 | |||||||
| Perez et al. [25] | ABS | Jute | 5 | 3300 | 230 | 0.27 | 0.871–1.543 | 12.9–25.9 | |||||||
| Perez et al. [25] | ABS | Nano TiO2 | 5 | 3300 | 230 | 0.27 | 1.355–1.708 | 18.4–32.2 | |||||||
| Zhang et al. [4] | ABS | CNTCF | 15 | 3600, 4800, 6000 | 0, [±45], 90 | 0.18, 0.24, 0.4 | 2.01–2.52 | 21.46–29.64 | |||||||
| Shofner et al. [22] | ABS | VGCFs | 0.1 | 0.1 | 10 | 37 | |||||||||
| Ferreira et al. [21] | PLA | CF | 0.06 | 15 | 3000 | 190 | 70 | 0, 90 | 0.3 | 100 | 4.14–7.66 | 35.4–53.4 | |||
| Sang et al. [19] | PLA | CF | 0.131 | 7 | 5–20 | 1200 1st 3600 rest | 210 | 60 | [±45] | 0.1 | 100 | 3.4–7.4 | 60–70 | ||
| Ivey et al. [12] | PLA | CF | 0.125 | 7.4 | 15 | 1800 1st 2100 rest | 200 | 85 | 0/90 | 0.1 | 100 | 2 | 5.68 | 55.2 | |
| Sang et al. [19] | PLA | BF | 0.13 | 12 | 5–20 | 1200 1st 3600 rest | 210 | 60 | [±45] | 0.1 | 100 | 3–5.5 | 61–70 | ||
| Isobe et al. [13] | PLA | MW CNT | 0.5–3 | ~3–3.5 | 40–50 | ||||||||||
| Papon et al. [58] | PLA | nano CF | 0.0005 | 0.05 | 0.5–2 | 1200 | 220 | 110 | [±45/45/90/0]s | 0.4 | 100 | 1.822 | 41–48 | ||
| Blok et al. [29] | nylon | micro CF | 0.1 | 6 | 260 | F | 0.2 | 1.85 | 33.5 | ||||||
| Isobe et al. [13] | nylon | CF | 0.13 | 14.3 | ~1–2 | 45.5 | |||||||||
| Silva and Rezende [18] | nylon | CF | 0.05–0.2 | 5 | 65 | 300 | 270 | 110 | 1 | 3.5 | 153.62 | ||||
| Liao et al. [31] | nylon | CF | 6–7 | 2–10 | 1800 | 250 | 120 | 0 | 100 | 1–3.5 | 48–90 | ||||
| Walter et al. [28] | nylon | CF | F | [±45] | 0.1 | 3.019 | 58.2 | ||||||||
| Duty et al. [47] | PPS | GF | <3 mm | 40 | 357 | 95 | 10.82 | 51.2 | |||||||
| Duty et al. [48] | PPS | GF | 1 | 40 | 3048 | 251 | 0, 90 | 10.82 | 51.2 | ||||||
| Gardner et al. [10] | PEI | CNT yarns | 375 | 162 | 0 | 3 | 119 | ||||||||
| Study | Material Parameters | Printing Parameters | Tensile Properties | ||||||||||||
|---|---|---|---|---|---|---|---|---|---|---|---|---|---|---|---|
| Polymer | Reinforcement | ||||||||||||||
| Material | Length (mm) | Diameter (μm) | Content (by wt%) | Print Speed (mm/min) | Nozzle Temp. (°C) | Bed Temp. (°C) | Build Orientation F, E, Z | Raster Angle (degree) | Raster Thickness (mm) | Infill Volume (%) | Contour (Lines) | Stiffness (GPa) | Ultimate Strength (MPa) | ||
| Blok et al. [29] | nylon | CF | 36.67 | 2.39 cm3/hr | 260 | 0 | 0.125 | 100 | 62.5 | 968 | |||||
| Isobe et al. [13] | nylon | CF | 35.7 | 0 | 10 | 341 | |||||||||
| Zhuo et al. [74] | nylon | CF | 0 | ||||||||||||
| Chacón et al. [52] | nylon | CF | 350 | 2.38–31.32 | 274 (nylon) 232 (fibre) | F, E | 0 | 0.125 | 7.6–51.7 | 96.6–436.7 | |||||
| Al Abadi et al. [75] | nylon | CF | 45 | [±45]/0 | 37 | 360 | |||||||||
| Mohammadizadeh et al. [85] | nylon | CF | 265 (nylon) 270 (fibre) | concentric, 0 | 0.125 | 50 | 235.5–404.3 | ||||||||
| van der Klift et al. [86] | nylon | CF | 29.79- | 0.125 | 15–35.7 | 128–520 | |||||||||
| Dickson et al. [84] | nylon | CF | 350 | 13.59 | 263 | NO | concentric, 0 | 0.125 | 7.73 | 216 | |||||
| Chacón et al. [52] | nylon | GF | 300 | 3.95–33.67 | 273 (nylon) 232 (fibre) | F, E | 0 | 0.1 | 3.7–19.6 | 113.4–381.2 | |||||
| Al Abadi et al. [75] | nylon | GF | 47.62 | [±45]/[0/90] | 6.4 | 180 | |||||||||
| Mohammadizadeh et al. [85] | nylon | GF | 266 (nylon) 270 (fibre) | concentric, 0 | 0.1 | 50 | 302.6–372.1 | ||||||||
| Dickson et al. [84] | nylon | GF | 300 | 10.6–13.06 | 263 | NO | concentric, 0 | 0.1 | 3.12–3.75 | 194–206 | |||||
| Chacón et al. [52] | nylon | KF | 300 | 3.19–28.88 | 275 (nylon) 232 (fibre) | F, E | 0 | 0.1 | 5.2–25.5 | 55.8–235.6 | |||||
| Al Abadi et al. [75] | nylon | KF | 42.11 | [±45]/[0/90] | 8.7 | 170 | |||||||||
| Al Abadi et al. [75] | nylon | KF | 42.11 | [±45]/[0/90] | 8.7 | 170 | |||||||||
| Mohammadizadeh et al. [85] | nylon | KF | 267 (nylon) 270 (fibre) | concentric, 0 | 0.1 | 50 | 259.7–309.14 | ||||||||
| Dickson et al. [84] | nylon | KF | 12 | 8.66–10.81 | 263 | NO | concentric, 0 | 0.1 | 3.61–4.37 | 150–164 | |||||
| Matsuzaki et al. [76] | PLA | CF | 9.3 | 60 | 210 | 80 | 0 | 20 | 200 | ||||||
| Li et al. [34] | PLA | CF | <42.92 | 91 | |||||||||||
| Tian et al. [35] | PLA | CF | 34.93 | 100, 200, 300, 400, 500, 600 | 180, 190, 200, 210, 220, 230, 240 | NO | 0.3, 0.4, 0.5, 0.6, 0.7, 0.8 | ||||||||
| Namiki et al. [61] | PLA | CF | 1.45 | 100 | 210 | 80 | 5.8 | 90 | |||||||
| Matsuzaki et al. [76] | PLA | Jute Fibre | 7.11 | 60 | 210 | 80 | 0 | 5 | 50 | ||||||
| Hou et al. [37] | PLA | KF | 13.11 | 100 | 210 | NO | 0.1–0. | 7.42 | 73.54 | ||||||
| Tey et al. [87] | PLA | KF | 400 | 6.54 %vol | 0.8 | 4 | 3.29 | 104.64 | |||||||
| Yang et al. [5] | ABS | CF | 10 | 600 | 230 | 90 | 0.5 | 4.185 | 147 | ||||||
Appendix B
| PLA | ABS | PP | ||||||
| Strength (MPa) | Stiffness (GPa) | Ref. | Strength (MPa) | Stiffness (GPa) | Ref. | Strength (MPa) | Stiffness (GPa) | Ref. |
| 45.6 | 2.364 | [88] | 33.9 | 1.618 | [89] | 32 | - | [90] |
| 37 | 4 | [91] | 27 | 2.1–7.6 | [91] | 8.7 | 0.2 | [92] |
| 26.4 | 2.3 | [93] | 46 | - | [94] | 28–36 | 1.75 | [95] |
| 46.8 | 2.91 | [96] | 33 | - | [97] | 34 | 1.325 | [98] |
| 65 | - | [90] | 25–50 | 1.1–2.9 | [99] | |||
| PC | Nylon | PEI | ||||||
| Strength (MPa) | Stiffness (GPa) | Ref. | Strength (MPa) | Stiffness (GPa) | Ref. | Strength (MPa) | Stiffness (GPa) | Ref. |
| 72 | - | [90] | 48 | - | [97] | 81 | - | [97] |
| 65 | - | [100] | 32 | 0.4 | [101] | 85 | 3.2 | [102] |
| 76.4 | 2.13 | [103] | 34.4 | 0.579 | [104] | 64 | 2.77 | [105] |
| 57 | 1.94 | [106] | 45 | 1.4 | [107] | 85 | 3.3 | [108] |
| 68 | 2.28 | [109] | 48 | 1.7 | [110] | |||
| PEEK | ||||||||
| Strength (MPa) | Stiffness (GPa) | Ref. | ||||||
| 105 | 4.1 | [111] | ||||||
| 115 | 4.3 | [112] | ||||||
| 96.52 | 4.07 | [113] | ||||||
References
- Parandoush, P.; Lin, D. A review on additive manufacturing of polymer-fiber composites. Compos. Struct. 2017, 182, 36–53. [Google Scholar] [CrossRef]
- Ngo, T.D.; Kashani, A.; Imbalzano, G.; Nguyen, K.T.Q.; Hui, D. Additive manufacturing (3D printing): A review of materials, methods, applications and challenges. Compos. Part B Eng. 2018, 143, 172–196. [Google Scholar] [CrossRef]
- Frketic, J.; Dickens, T.; Ramakrishnan, S. Automated manufacturing and processing of fiber-reinforced polymer (FRP) composites: An additive review of contemporary and modern techniques for advanced materials manufacturing. Addit. Manuf. 2017, 14, 69–86. [Google Scholar] [CrossRef] [Green Version]
- Zhang, W.; Cotton, C.; Sun, J.; Heider, D.; Gu, B.; Sun, B.; Chou, T.-W. Interfacial bonding strength of short carbon fiber/acrylonitrile-butadiene-styrene composites fabricated by fused deposition modeling. Compos. Part B Eng. 2018, 137, 51–59. [Google Scholar] [CrossRef]
- Yang, C.; Tian, X.; Liu, T.; Cao, Y.; Li, D. 3D printing for continuous fiber reinforced thermoplastic composites: Mechanism and performance. Rapid Prototyp. J. 2017, 23, 209–215. [Google Scholar] [CrossRef]
- Levy, G.N.; Schindel, R.; Kruth, J.-P. Rapid manufacturing and rapid tooling with layer manufacturing (LM) technologies, state of the art and future perspectives. CIRP Ann. 2003, 52, 589–609. [Google Scholar] [CrossRef]
- Wang, X.; Jiang, M.; Zhou, Z.; Gou, J.; Hui, D. 3D printing of polymer matrix composites: A review and prospective. Compos. Part B Eng. 2017, 110, 442–458. [Google Scholar] [CrossRef]
- Kumar, N.; Jain, P.K.; Tandon, P.; Pandey, P.M. The effect of process parameters on tensile behavior of 3D printed flexible parts of ethylene vinyl acetate (EVA). J. Manuf. Process. 2018, 35, 317–326. [Google Scholar] [CrossRef]
- Bettini, P.; Alitta, G.; Sala, G.; Di Landro, L. Fused deposition technique for continuous fiber reinforced thermoplastic. J. Mater. Eng. Perform. 2017, 26, 843–848. [Google Scholar] [CrossRef]
- Gardner, J.M.; Sauti, G.; Kim, J.-W.; Cano, R.J.; Wincheski, R.A.; Stelter, C.J.; Grimsley, B.W.; Working, D.C.; Siochi, E.J. Additive Manufacturing of Multifunctional Components using High Density Carbon Nanotube Yarn Filaments; NASA Langley Research Center: Hampton, VA, USA, 2016.
- Zhong, W.; Li, F.; Zhang, Z.; Song, L.; Li, Z. Short fiber reinforced composites for fused deposition modeling. Mater. Sci. Eng. A 2001, 301, 125–130. [Google Scholar] [CrossRef]
- Ivey, M.; Melenka, G.W.; Carey, J.P.; Ayranci, C. Characterizing short-fiber-reinforced composites produced using additive manufacturing. Adv. Manuf. Polym. Compos. Sci. 2017, 3, 81–91. [Google Scholar] [CrossRef] [Green Version]
- Isobe, T.; Tanaka, T.; Nomura, T.; Yuasa, R. Comparison of strength of 3D printing objects using short fiber and continuous long fiber. Proc. IOP Conf. Ser. Mater. Sci. Eng. 2018, 012042. [Google Scholar] [CrossRef]
- Sood, A.K.; Ohdar, R.K.; Mahapatra, S.S. Parametric appraisal of mechanical property of fused deposition modelling processed parts. Mater. Des. 2009, 31, 287–295. [Google Scholar] [CrossRef]
- Sodeifian, G.; Ghaseminejad, S.; Yousefi, A.A. Preparation of polypropylene/short glass fiber composite as Fused Deposition Modeling (FDM) filament. Results Phys. 2019, 12, 205–222. [Google Scholar] [CrossRef]
- Geng, P.; Zhao, J.; Wu, W.; Ye, W.; Wang, Y.; Wang, S.; Zhang, S. Effects of extrusion speed and printing speed on the 3D printing stability of extruded PEEK filament. J. Manuf. Process. 2019, 37, 266–273. [Google Scholar] [CrossRef]
- Wu, W.; Geng, P.; Li, G.; Zhao, D.; Zhang, H.; Zhao, J. Influence of layer thickness and raster angle on the mechanical properties of 3D-printed PEEK and a comparative mechanical study between PEEK and ABS. Materials 2015, 8, 5834–5846. [Google Scholar] [CrossRef]
- Silva, J.V.; Rezende, R.A. Additive Manufacturing and its future impact in logistics. IFAC Proc. Vol. 2013, 46, 277–282. [Google Scholar] [CrossRef]
- Sang, L.; Han, S.; Li, Z.; Yang, X.; Hou, W. Development of short basalt fiber reinforced polylactide composites and their feasible evaluation for 3D printing applications. Compos. Part B Eng. 2019, 164, 629–639. [Google Scholar] [CrossRef]
- Magdum, Y.; Pandey, D.; Bankar, A.; Harshe, S.; Parab, V.; Kadam, M. Process parameter optimization for FDM 3D printer. Int. Res. J. Eng. Technol. (IRJET) 2019, 6, 1–6. [Google Scholar]
- Ferreira, R.T.L.; Amatte, I.C.; Dutra, T.A.; Burger, D. Experimental characterization and micrography of 3D printed PLA and PLA reinforced with short carbon fibers. Compos. Part B Eng. 2017, 124, 88–100. [Google Scholar] [CrossRef]
- Shofner, M.; Lozano, K.; Rodriguez-Macias, F.; Barrera, E. Nanofiber-Reinforced polymers prepared by fused deposition modeling. J. Appl. Polym. Sci. 2003, 89, 3081–3090. [Google Scholar] [CrossRef]
- Lanzotti, A.; Pei, E.; Grasso, M.; Staiano, G.; Martorelli, M. The impact of process parameters on mechanical properties of parts fabricated in PLA with an open-source 3-D printer. Rapid Prototyp. J. 2015, 21, 604–617. [Google Scholar] [CrossRef] [Green Version]
- Cantrell, J.; Rohde, S.; Damiani, D.; Gurnani, R.; DiSandro, L.; Anton, J.; Young, A.; Jerez, A.; Steinbach, D.; Kroese, C.; et al. Experimental characterization of the mechanical properties of 3D-printed ABS and polycarbonate parts. Rapid Prototyp. J. 2017. [Google Scholar] [CrossRef]
- Perez, A.R.T.; Roberson, D.A.; Wicker, R.B. Fracture surface analysis of 3D-printed tensile specimens of novel ABS-based materials. J. Fail. Anal. Prev. 2014, 14, 343–353. [Google Scholar] [CrossRef]
- Onwubolu, G.C.; Rayegani, F. Characterization and optimization of mechanical properties of ABS parts manufactured by the fused deposition modelling process. Int. J. Manuf. Eng. 2014, 2014. [Google Scholar] [CrossRef]
- Christiyan, K.J.; Chandrasekhar, U.; Venkateswarlu, K. A study on the influence of process parameters on the Mechanical Properties of 3D printed ABS composite. Proc. IOP Conf. Ser. Mater. Sci. Eng. 2016, 114, 012109. [Google Scholar] [CrossRef]
- Walter, R.; Friedrich, K.; Gurka, M. Characterization of mechanical properties of additively manufactured polymers and composites. AIP Conf. Proc. 2018, 020033. [Google Scholar] [CrossRef]
- Blok, L.G.; Longana, M.L.; Yu, H.; Woods, B.K. An investigation into 3D printing of fibre reinforced thermoplastic composites. Addit. Manuf. 2018, 22, 176–186. [Google Scholar] [CrossRef]
- Nazan, M.A.; Ramli, F.R.; Alkahari, M.R.; Sudin, M.N.; Abdullah, M. Process parameter optimization of 3D printer using response surface method. ARPN J. Eng. Appl. Sci. 2017, 12, 2291–2296. [Google Scholar]
- Liao, G.; Li, Z.; Cheng, Y.; Xu, D.; Zhu, D.; Jiang, S.; Guo, J.; Chen, X.; Xu, G.; Zhu, Y. Properties of oriented carbon fiber/polyamide 12 composite parts fabricated by fused deposition modeling. Mater. Des. 2018, 139, 283–292. [Google Scholar] [CrossRef]
- Banerjee, S.S.; Burbine, S.; Kodihalli Shivaprakash, N.; Mead, J. 3D-printable PP/SEBS thermoplastic elastomeric blends: Preparation and properties. Polymers 2019, 11, 347. [Google Scholar] [CrossRef] [PubMed] [Green Version]
- Gebisa, A.W.; Lemu, H.G. Influence of 3D Printing FDM Process Parameters on Tensile Property of ULTEM 9085. Procedia Manuf. 2019, 30, 331–338. [Google Scholar] [CrossRef]
- Li, N.; Li, Y.; Liu, S. Rapid prototyping of continuous carbon fiber reinforced polylactic acid composites by 3D printing. J. Mater. Process. Technol. 2016, 238, 218–225. [Google Scholar] [CrossRef]
- Tian, X.; Liu, T.; Yang, C.; Wang, Q.; Li, D. Interface and performance of 3D printed continuous carbon fiber reinforced PLA composites. Compos. Part A Appl. Sci. Manuf. 2016, 88, 198–205. [Google Scholar] [CrossRef]
- Fasel, U.; Keidel, D.; Baumann, L.; Cavolina, G.; Eichenhofer, M.; Ermanni, P. Composite additive manufacturing of morphing aerospace structures. Manuf. Lett. 2020, 23, 85–88. [Google Scholar] [CrossRef]
- Hou, Z.; Tian, X.; Zhang, J.; Li, D. 3D printed continuous fibre reinforced composite corrugated structure. Compos. Struct. 2018, 184, 1005–1010. [Google Scholar] [CrossRef]
- Tekinalp, H.L.; Kunc, V.; Velez-Garcia, G.M.; Duty, C.E.; Love, L.J.; Naskar, A.K.; Blue, C.A.; Ozcan, S. Highly oriented carbon fiber—Polymer composites via additive manufacturing. Compos. Sci. Technol. 2014, 105, 144–150. [Google Scholar] [CrossRef] [Green Version]
- Ning, F.; Cong, W.; Hu, Y.; Wang, H. Additive manufacturing of carbon fiber-reinforced plastic composites using fused deposition modeling: Effects of process parameters on tensile properties. J. Compos. Mater. 2017, 51, 451–462. [Google Scholar] [CrossRef]
- Brenken, B.; Barocio, E.; Favaloro, A.; Kunc, V.; Pipes, R.B. Fused filament fabrication of fiber-reinforced polymers: A review. Addit. Manuf. 2018, 21, 1–16. [Google Scholar] [CrossRef]
- Ning, F.; Cong, W.; Qiu, J.; Wei, J.; Wang, S. Additive manufacturing of carbon fiber reinforced thermoplastic composites using fused deposition modeling. Compos. Part B Eng. 2015, 80, 369–378. [Google Scholar] [CrossRef]
- Turner, B.N.; Strong, R.; Gold, S.A. A review of melt extrusion additive manufacturing processes: I. Process design and modeling. Rapid Prototyp. J. 2014, 20, 192–204. [Google Scholar] [CrossRef]
- Song, Y.; Li, Y.; Song, W.; Yee, K.; Lee, K.-Y.; Tagarielli, V.L. Measurements of the mechanical response of unidirectional 3D-printed PLA. Mater. Des. 2017, 123, 154–164. [Google Scholar] [CrossRef]
- Sun, Q.; Rizvi, G.; Bellehumeur, C.; Gu, P. Effect of processing conditions on the bonding quality of FDM polymer filaments. Rapid Prototyp. J. 2008, 14, 72–80. [Google Scholar] [CrossRef]
- Smith, W.C.; Dean, R.W. Structural characteristics of fused deposition modeling polycarbonate material. Polym. Test. 2013, 32, 1306–1312. [Google Scholar] [CrossRef]
- Durgun, I.; Ertan, R. Experimental investigation of FDM process for improvement of mechanical properties and production cost. Rapid Prototyp. J. 2014. [Google Scholar] [CrossRef]
- Duty, C.E.; Drye, T.; Franc, A. Material Development for Tooling Applications Using Big Area Additive Manufacturing (BAAM); Oak Ridge National Lab. (ORNL): Oak Ridge, TN, USA; Manufacturing Demonstration Facility (MDF): Knoxville, TN, USA, 2015.
- Duty, C.E.; Kunc, V.; Compton, B.; Post, B.; Erdman, D.; Smith, R.; Lind, R.; Lloyd, P.; Love, L. Structure and mechanical behavior of Big Area Additive Manufacturing (BAAM) materials. Rapid Prototyp. J. 2017. [Google Scholar] [CrossRef]
- Love, L.J.; Kunc, V.; Rios, O.; Duty, C.E.; Elliott, A.M.; Post, B.K.; Smith, R.J.; Blue, C.A. The importance of carbon fiber to polymer additive manufacturing. J. Mater. Res. 2014, 29, 1893–1898. [Google Scholar] [CrossRef] [Green Version]
- Ding, Q.; Li, X.; Zhang, D.; Zhao, G.; Sun, Z. Anisotropy of poly (lactic acid)/carbon fiber composites prepared by fused deposition modeling. J. Appl. Polym. Sci. 2020, 137, 48786. [Google Scholar] [CrossRef]
- Wang, K.; Li, S.; Rao, Y.; Wu, Y.; Peng, Y.; Yao, S.; Zhang, H.; Ahzi, S. Flexure behaviors of ABS-based composites containing carbon and Kevlar fibers by material extrusion 3D printing. Polymers 2019, 11, 1878. [Google Scholar] [CrossRef] [Green Version]
- Chacón, J.M.; Caminero, M.A.; Núñez, P.J.; García-Plaza, E.; García-Moreno, I.; Reverte, J.M. Additive manufacturing of continuous fibre reinforced thermoplastic composites using fused deposition modelling: Effect of process parameters on mechanical properties. Compos. Sci. Technol. 2019, 181, 107688. [Google Scholar] [CrossRef]
- Caminero, M.; Chacón, J.M.; García-Moreno, I.; Rodríguez, G.P. Impact damage resistance of 3D printed continuous fibre reinforced thermoplastic composites using fused deposition modelling. Compos. Part B Eng. 2018, 148, 93–103. [Google Scholar] [CrossRef]
- Hill, N.; Haghi, M. Deposition direction-dependent failure criteria for fused deposition modeling polycarbonate. Rapid Prototyp. J. 2014, 20, 221–227. [Google Scholar] [CrossRef]
- Carneiro, O.S.; Silva, A.; Gomes, R. Fused deposition modeling with polypropylene. Mater. Des. 2015, 83, 768–776. [Google Scholar] [CrossRef]
- Dawoud, M.; Taha, I.; Ebeid, S.J. Mechanical behaviour of ABS: An experimental study using FDM and injection moulding techniques. J. Manuf. Process. 2016, 21, 39–45. [Google Scholar] [CrossRef]
- Hossain, M.S.; Ramos, J.; Espalin, D.; Perez, M.; Wicker, R. Improving tensile mechanical properties of FDM-manufactured specimens via modifying build parameters. In Proceedings of the International Solid Freeform Fabrication Symposium: An Additive Manufacturing Conference, Austin, TX, USA, 12–14 August 2019; pp. 380–392. [Google Scholar]
- Papon, M.E.A.; Haque, A.; Ma, R.S. Effect of nozzle geometry on melt flow simulation and structural property of thermoplastic nanocomposites in fused deposition modeling. In Proceedings of the Thirty-Second Technical Conference, American Society for Composites, West Lafayette, IN, USA, 23–25 October 2017. [Google Scholar]
- Comminal, R.; Serdeczny, M.; Pedersen, D.; Spangenberg, J. Numerical modeling of the material deposition and contouring precision in fused deposition modeling. In Proceedings of the 29th Annual International Solid Freeform Fabrication Symposium, Austin, TX, USA, 13–15 August 2018; pp. 13–15. [Google Scholar]
- Comminal, R.; Serdeczny, M.P.; Pedersen, D.B.; Spangenberg, J. Motion planning and numerical simulation of material deposition at corners in extrusion additive manufacturing. Addit. Manuf. 2019, 29, 100753. [Google Scholar] [CrossRef]
- Namiki, M.; Ueda, M.; Todoroki, A.; Hirano, Y. 3D printing of continuous fiber reinforced plastic. In Proceedings of the SAMPE 2014, International SAMPE Symposium and Exhibition, Seattle, WA, USA, 2–5 June 2014. [Google Scholar]
- Anitha, R.; Arunachalam, S.; Radhakrishnan, P. Critical parameters influencing the quality of prototypes in fused deposition modelling. J. Mater. Process. Technol. 2001, 118, 385–388. [Google Scholar] [CrossRef]
- Croccolo, D.; De Agostinis, M.; Olmi, G. Experimental characterization and analytical modelling of the mechanical behaviour of fused deposition processed parts made of ABS-M30. Comput. Mater. Sci. 2013, 79, 506–518. [Google Scholar] [CrossRef]
- Verdejo de Toro, E.; Coello Sobrino, J.; Martínez Martínez, A.; Miguel Eguía, V.; Ayllón Pérez, J. Investigation of a Short Carbon Fibre-Reinforced Polyamide and Comparison of Two Manufacturing Processes: Fused Deposition Modelling (FDM) and Polymer Injection Moulding (PIM). Materials 2020, 13, 672. [Google Scholar] [CrossRef] [Green Version]
- Yasa, E.; Ersoy, K. Dimensional Accuracy and Mechanical Properties of Chopped Carbon Reinforced Polymers Produced by Material Extrusion Additive Manufacturing. Materials 2019, 12, 3885. [Google Scholar] [CrossRef] [Green Version]
- Yasa, E. Anisotropic impact toughnness of chopped carbon fiber reinforced nylon fabricated by material-extrusion-based additive manufacturing. Anadolu Univ. Sci. Technol. A Appl. Sci. Eng. 2019, 20. [Google Scholar] [CrossRef]
- Aworinde, A.K.; Adeosun, S.O.; Oyawale, F.A.; Akinlabi, E.T.; Akinlabi, S.A. Parametric Effects of Fused Deposition Modelling on the Mechanical Properties of Polylactide Composites: A Review. J. Phys. Conf. Ser. 2019, 022060. [Google Scholar] [CrossRef]
- MarkForged. MarkForged Visual Troubleshooting Guide. Available online: https://support.markforged.com/hc/en-us/articles/205927119-MarkForged-Visual-Troubleshooting-Guide (accessed on 25 March 2020).
- Sukindar, N.A.; Ariffin, M.K.A.; Baharudin, B.H.T.; Jaafar, C.N.A.; Ismail, M.I.S. Analyzing the effect of nozzle diameter in fused deposition modeling for extruding polylactic acid using open source 3D printing. J. Teknol. 2016, 78. [Google Scholar] [CrossRef] [Green Version]
- Blok, L.G.; Longana, M.L.; Woods, B.K.S. Fabrication and characterisation of aligned discontinuous carbon fibre reinforced thermoplastics for automated manufacture. Materials 2020, 13, 4671. [Google Scholar] [CrossRef] [PubMed]
- 3D Matter. What is the Best Type of Plastic for My 3D Printing Application? Available online: https://my3dmatter.com/what-is-the-best-type-of-plastic-for-my-3d-printing-application/ (accessed on 11 March 2020).
- 3D Matter. FDM 3D Printing Materials Compared. Available online: https://www.3dhubs.com/knowledge-base/fdm-3d-printing-materials-compared/ (accessed on 20 March 2020).
- Wilson, A. 1—The formation of dry, wet, spunlaid and other types of nonwovens. Appl. Nonwovens Tech. Text. 2010, 3–17. [Google Scholar] [CrossRef]
- Zhuo, P.; Li, S.; Ashcroft, I.; Jones, A.; Pu, J. 3D printing of continuous fibre reinforced thermoplastic composites. In Proceedings of the 21st International Conference on Composite Materials, ICCM21, ID, Xi’an, China, 20–25 August 2017. [Google Scholar]
- Al Abadi, H.; Thai, H.-T.; Paton-Cole, V.; Patel, V.I. Elastic properties of 3D printed fibre-reinforced structures. Compos. Struct. 2018, 193, 8–18. [Google Scholar] [CrossRef]
- Matsuzaki, R.; Ueda, M.; Namiki, M.; Jeong, T.-K.; Asahara, H.; Horiguchi, K.; Nakamura, T.; Todoroki, A.; Hirano, Y. Three-Dimensional printing of continuous-fiber composites by in-nozzle impregnation. Sci. Rep. 2016, 6, 23058. [Google Scholar] [CrossRef] [PubMed]
- Heller, B.P.; Smith, D.E.; Jack, D.A. Effects of extrudate swell and nozzle geometry on fiber orientation in Fused Filament Fabrication nozzle flow. Addit. Manuf. 2016, 12, 252–264. [Google Scholar] [CrossRef]
- Mulholland, T.; Goris, S.; Boxleitner, J.; Osswald, T.; Rudolph, N. Fiber Orientation Effects in Fused Filament Fabrication of Air-Cooled Heat Exchangers. JOM 2018, 70, 298–302. [Google Scholar] [CrossRef]
- Hofstätter, T.; Gutmann, I.W.; Koch, T.; Pedersen, D.B.; Tosello, G.; Heinz, G.; Hansen, N. Distribution and orientation of carbon fibers in polylactic acid parts produced by fused deposition modeling. In Proceedings of the ASPE Summer Topical Meeting, Raleigh, NC, USA, 27–30 June 2016. [Google Scholar]
- Yu, H.; Potter, K.D.; Wisnom, M.R. A novel manufacturing method for aligned discontinuous fibre composites (High Performance-Discontinuous Fibre method). Compos. Part A Appl. Sci. Manuf. 2014, 65, 175–185. [Google Scholar] [CrossRef]
- Such, M.; Ward, C.; Potter, K. Aligned discontinuous fibre composites: A short history. J. Multifunct. Compos. 2014, 2, 155–168. [Google Scholar] [CrossRef]
- Folgar, F.; Tucker, C.L., III. Orientation behavior of fibers in concentrated suspensions. J. Reinf. Plast. Compos. 1984, 3, 98–119. [Google Scholar] [CrossRef]
- Cicala, G.; Giordano, D.; Tosto, C.; Filippone, G.; Recca, A.; Blanco, I. Polylactide (PLA) filaments a biobased solution for additive manufacturing: Correlating rheology and thermomechanical properties with printing quality. Materials 2018, 11, 1191. [Google Scholar] [CrossRef] [PubMed] [Green Version]
- Dickson, A.N.; Barry, J.N.; McDonnell, K.A.; Dowling, D.P. Fabrication of continuous carbon, glass and Kevlar fibre reinforced polymer composites using additive manufacturing. Addit. Manuf. 2017, 16, 146–152. [Google Scholar] [CrossRef]
- Mohammadizadeh, M.; Imeri, A.; Fidan, I.; Elkelany, M. 3D printed fiber reinforced polymer composites-Structural analysis. Compos. Part B Eng. 2019, 175, 107112. [Google Scholar] [CrossRef]
- Van Der Klift, F.; Koga, Y.; Todoroki, A.; Ueda, M.; Hirano, Y.; Matsuzaki, R. 3D printing of continuous carbon fibre reinforced thermo-plastic (CFRTP) tensile test specimens. Open J. Compos. Mater. 2016, 6, 18–27. [Google Scholar] [CrossRef] [Green Version]
- Tey, J.; Ding, W.; Yeo, W.; King, Y.; Saw, L. 3D printing of continuous kevlar reinforced polymer composite through coextrusion method. IOP Conf. Ser. Earth Environ. Sci. 2020, 463, 012091. [Google Scholar] [CrossRef]
- Ultimaker. Technical Data Sheet PLA. Available online: https://ultimaker.com/download/74599/UM180821%20TDS%20PLA%20RB%20V10.pdf (accessed on 15 March 2020).
- Ultimaker. Technical Data Sheet ABS. Available online: https://ultimaker.com/download/74640/UM180821%20TDS%20ABS%20RB%20V11.pdf (accessed on 15 March 2020).
- Simplify3D. Filament Properties Table. Available online: https://www.simplify3d.com/support/materials-guide/properties-table/ (accessed on 15 March 2020).
- Giang, K. PLA vs. ABS: What’s the Difference? Available online: https://www.3dhubs.com/knowledge-base/pla-vs-abs-whats-difference/ (accessed on 16 March 2020).
- Ultimaker. Technical Data Sheet PP. Available online: https://ultimaker.com/download/74977/UM180821%20TDS%20PP%20RB%20V11.pdf (accessed on 15 March 2020).
- SD3D Printing. Technical Data Sheet PLA. Available online: https://www.sd3d.com/wp-content/uploads/2017/06/MaterialTDS-PLA_01.pdf (accessed on 15 March 2020).
- Rogers, T. Everything You Need to Know About ABS Plastic. Available online: https://www.creativemechanisms.com/blog/everything-you-need-to-know-about-abs-plastic (accessed on 18 February 2020).
- Engineering ToolBox. Young’s Modulus—Tensile and Yield Strength for Common Materials. Available online: https://www.engineeringtoolbox.com/young-modulus-d_417.html (accessed on 1 May 2020).
- MatWeb, L. Overview of Materials for Polylactic Acid (PLA) Biopolymer. Available online: http://www.matweb.com/search/DataSheet.aspx?MatGUID=ab96a4c0655c4018a8785ac4031b9278 (accessed on 1 May 2020).
- O’Neal, B. Navigating through the Selection of 3D Printing Materials: Know Your Strengths! Available online: https://3dprint.com/42417/3d-printing-material-strengths/ (accessed on 6 March 2020).
- Designerdata. PP. Available online: https://designerdata.nl/materials/plastics/thermo-plastics/polypropylene-(cop.) (accessed on 1 May 2020).
- Chilson, L. Comparison of Typical 3D Printing Materials. Available online: http://2015.igem.org/wiki/images/2/24/CamJIC-Specs-Strength.pdf (accessed on 16 February 2020).
- Vexma Technologies. Polycarbonate (PC). Available online: https://vexmatech.com/PC-polycarbonate-FDM-technology-3dprinting-material.html (accessed on 8 March 2020).
- BCN3D. Unlock a Wide Range of Applications with the Revamped Industrial-Grade BCN3D Filaments Portfolio. Available online: https://www.bcn3d.com/revamped-industrial-grade-bcn3d-basf-mitsubishi-filaments-portfolio/ (accessed on 16 March 2020).
- 3D4Maker.com. PEI Filament Ultem 1010. Available online: https://www.multi-3dprint.nl/images/3d4makers/TDS_PEI_ULTEM_1010.pdf (accessed on 10 February 2020).
- Ultimaker. Technical Data Sheet PC. Available online: https://ultimaker.com/download/74975/UM180821%20TDS%20PC%20RB%20V11.pdf (accessed on 20 March 2020).
- Ultimaker. Technical Data Sheet Nylon. Available online: https://ultimaker.com/download/74598/UM180821%20TDS%20Nylon%20RB%20V10.pdf (accessed on 1 May 2020).
- Stratasys. ULTEM™ 1010 Resin. Available online: https://www.stratasys.com/materials/search/ultem1010 (accessed on 28 March 2020).
- Javelin. PC (Polycarbonate). Available online: https://www.javelin-tech.com/3d/stratasys-materials/pc/ (accessed on 1 May 2020).
- Fillamentum. Technical Data Sheet Nylon FX256. Available online: https://www.materialpro3d.cz/user/related_files/fillamentum_nylon_fx256_-_technical_data_sheet.pdf (accessed on 1 May 2020).
- Sabic. ULTEM™ RESIN. Available online: https://www.sabic.com/en/products/specialties/ultem-resins/ultem-resin (accessed on 1 May 2020).
- Stratasys. FORTUS PC (Polycarbonate). Available online: http://producto3d.com/wp-content/uploads/2018/01/FDM_PCPropertiesReport.pdf (accessed on 1 May 2020).
- Fast Radius. Know Your Materials: PA 12. Available online: https://www.fastradius.com/resources/polyamide-12/ (accessed on 18 March 2020).
- 3dgence. PEEK Filament. Available online: http://support.3dgence.com/twoje-pliki/downloader/1352/TDS_PEEK_Filament_1.pdf (accessed on 20 November 2020).
- Theplasticshop. Ketron®1000 PEEK. Available online: https://www.theplasticshop.co.uk/plastic_technical_data_sheets/peek_1000_technical_data_sheet.pdf (accessed on 23 March 2020).
- CURBELL Plastics. PEEK Strong, Stiff Plastic with Outstanding Chemical Resistance; Performs over a Wide Range of Temps. Available online: https://www.curbellplastics.com/Research-Solutions/Technical-Resources/Technical-Resources/PEEK-Data-Sheet (accessed on 28 March 2020).


Publisher’s Note: MDPI stays neutral with regard to jurisdictional claims in published maps and institutional affiliations. |
© 2021 by the authors. Licensee MDPI, Basel, Switzerland. This article is an open access article distributed under the terms and conditions of the Creative Commons Attribution (CC BY) license (http://creativecommons.org/licenses/by/4.0/).
Share and Cite
Krajangsawasdi, N.; Blok, L.G.; Hamerton, I.; Longana, M.L.; Woods, B.K.S.; Ivanov, D.S. Fused Deposition Modelling of Fibre Reinforced Polymer Composites: A Parametric Review. J. Compos. Sci. 2021, 5, 29. https://doi.org/10.3390/jcs5010029
Krajangsawasdi N, Blok LG, Hamerton I, Longana ML, Woods BKS, Ivanov DS. Fused Deposition Modelling of Fibre Reinforced Polymer Composites: A Parametric Review. Journal of Composites Science. 2021; 5(1):29. https://doi.org/10.3390/jcs5010029
Chicago/Turabian StyleKrajangsawasdi, Narongkorn, Lourens G. Blok, Ian Hamerton, Marco L. Longana, Benjamin K. S. Woods, and Dmitry S. Ivanov. 2021. "Fused Deposition Modelling of Fibre Reinforced Polymer Composites: A Parametric Review" Journal of Composites Science 5, no. 1: 29. https://doi.org/10.3390/jcs5010029