Macrophage-Derived Inflammation Induces a Transcriptome Makeover in Mesenchymal Stromal Cells Enhancing Their Potential for Tissue Repair


Abstract
:1. Introduction
2. Results
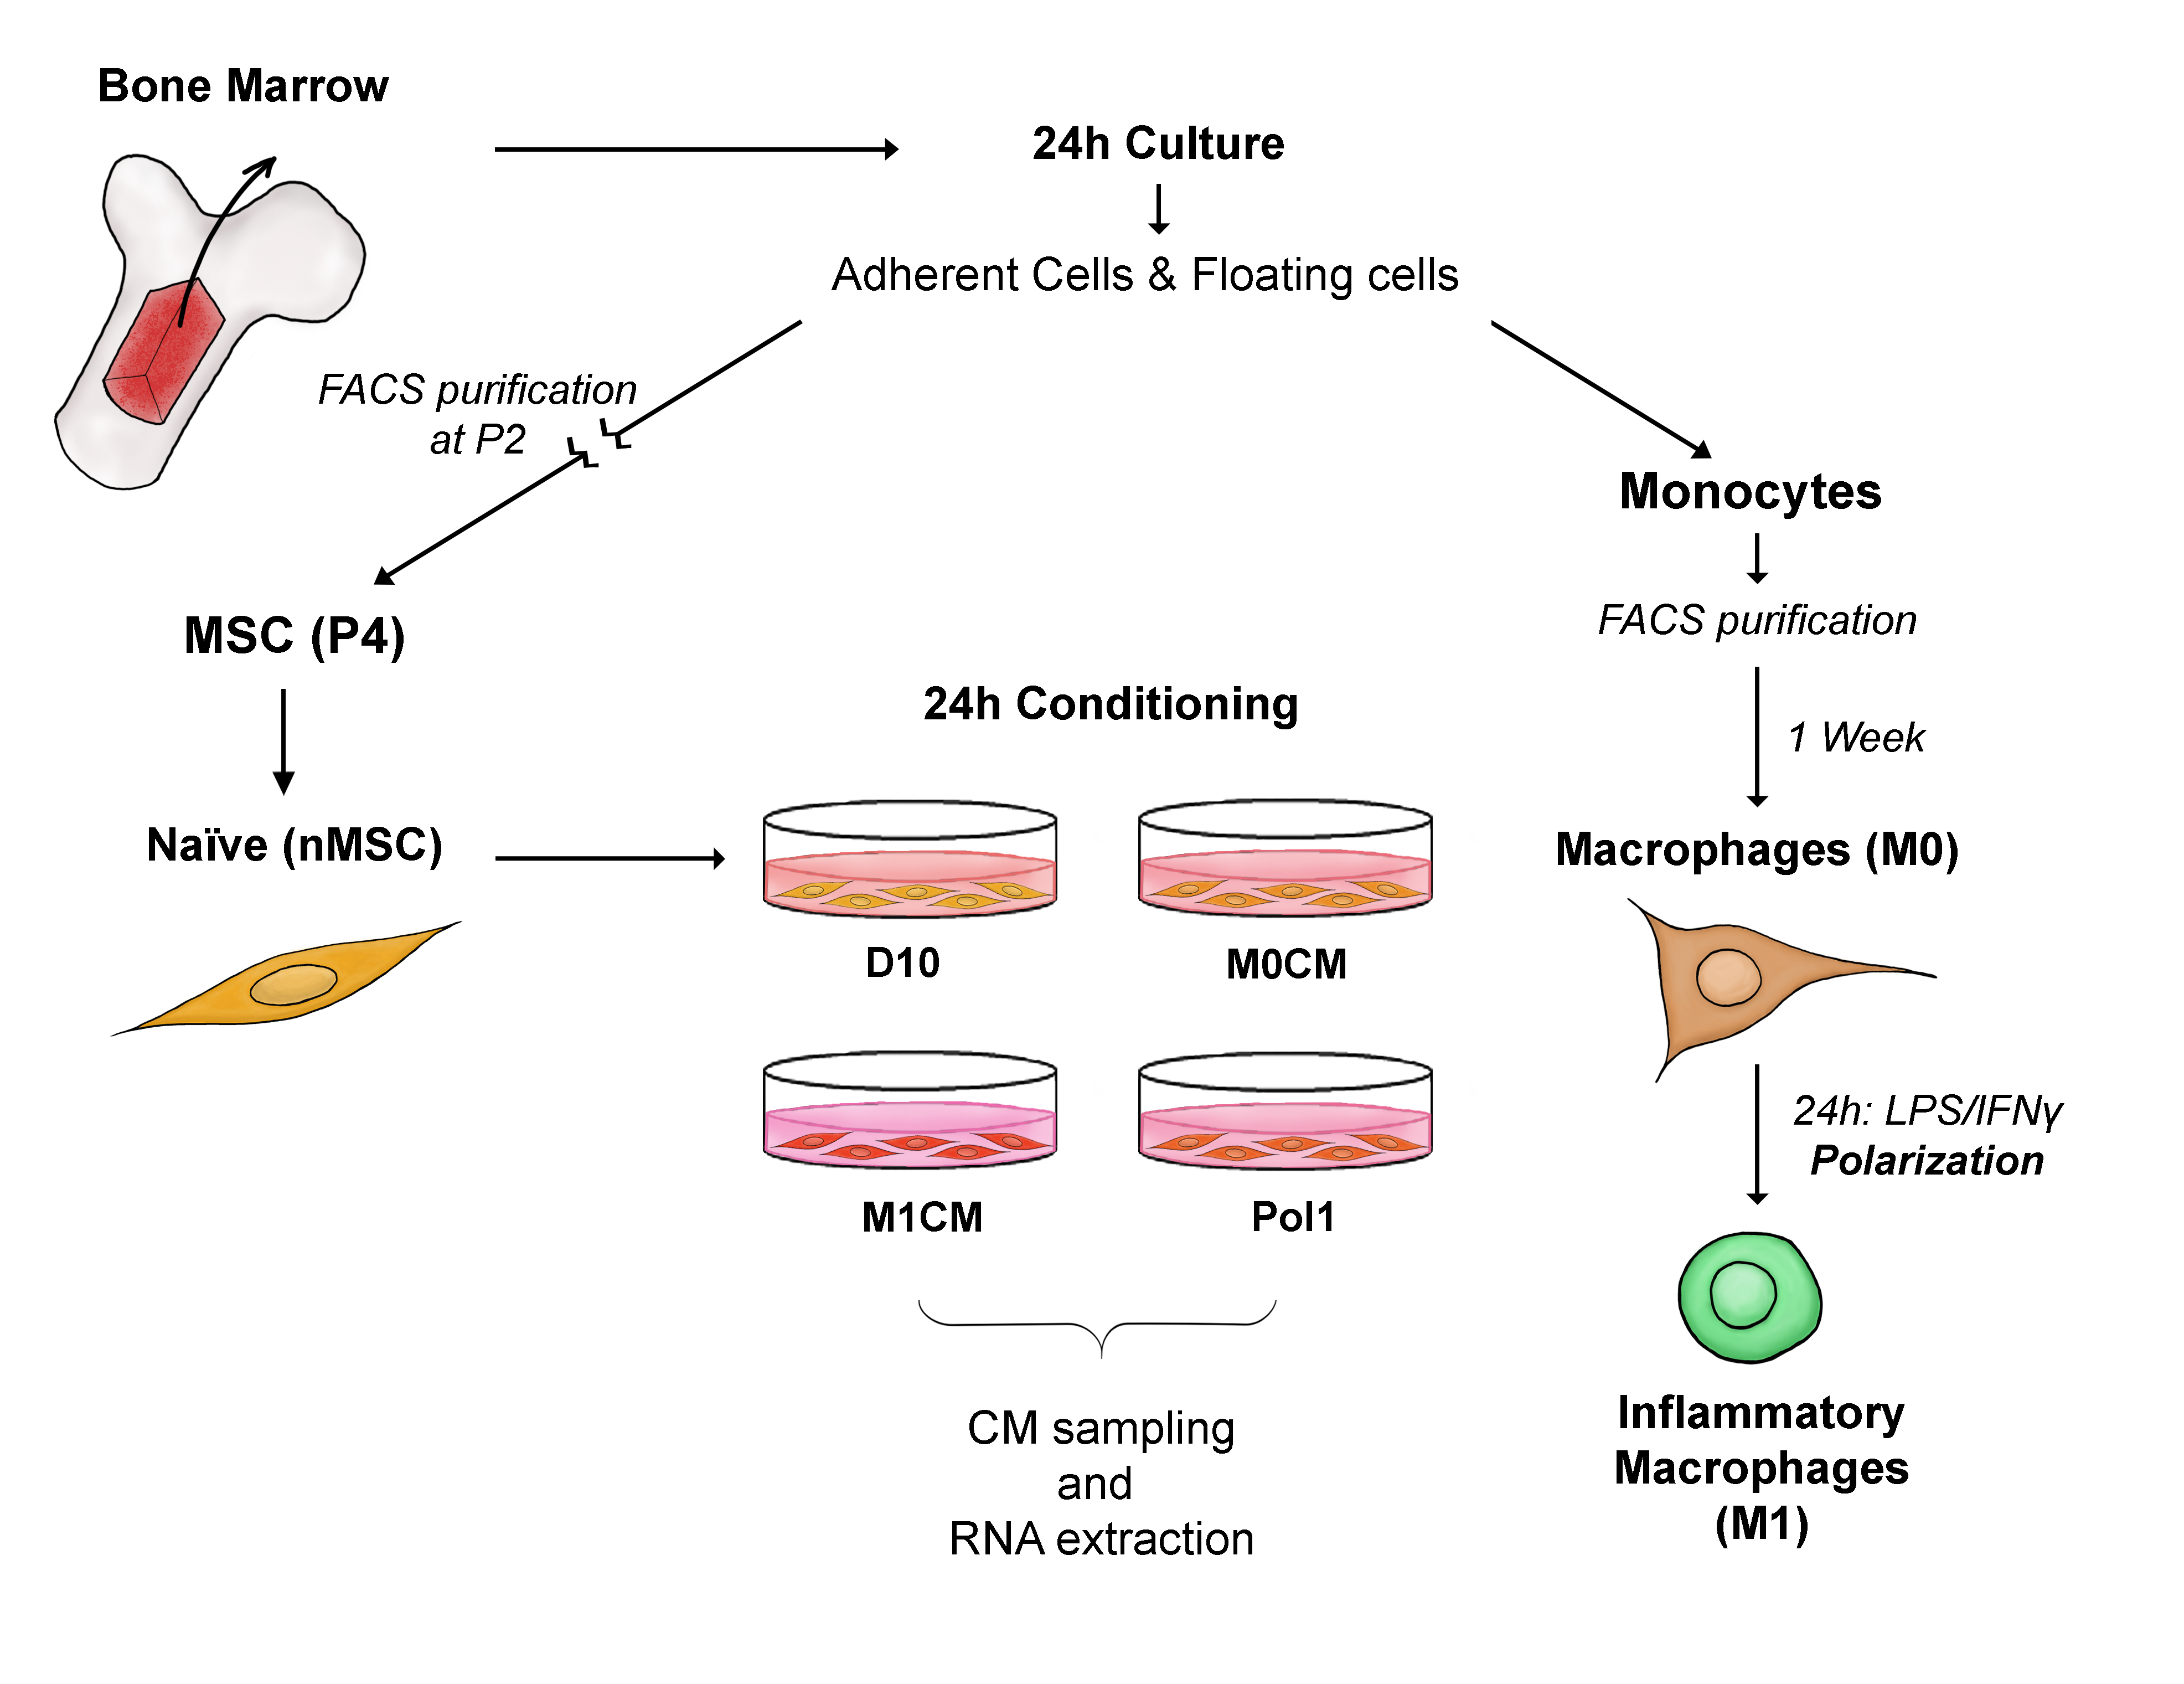
2.1. Study Design
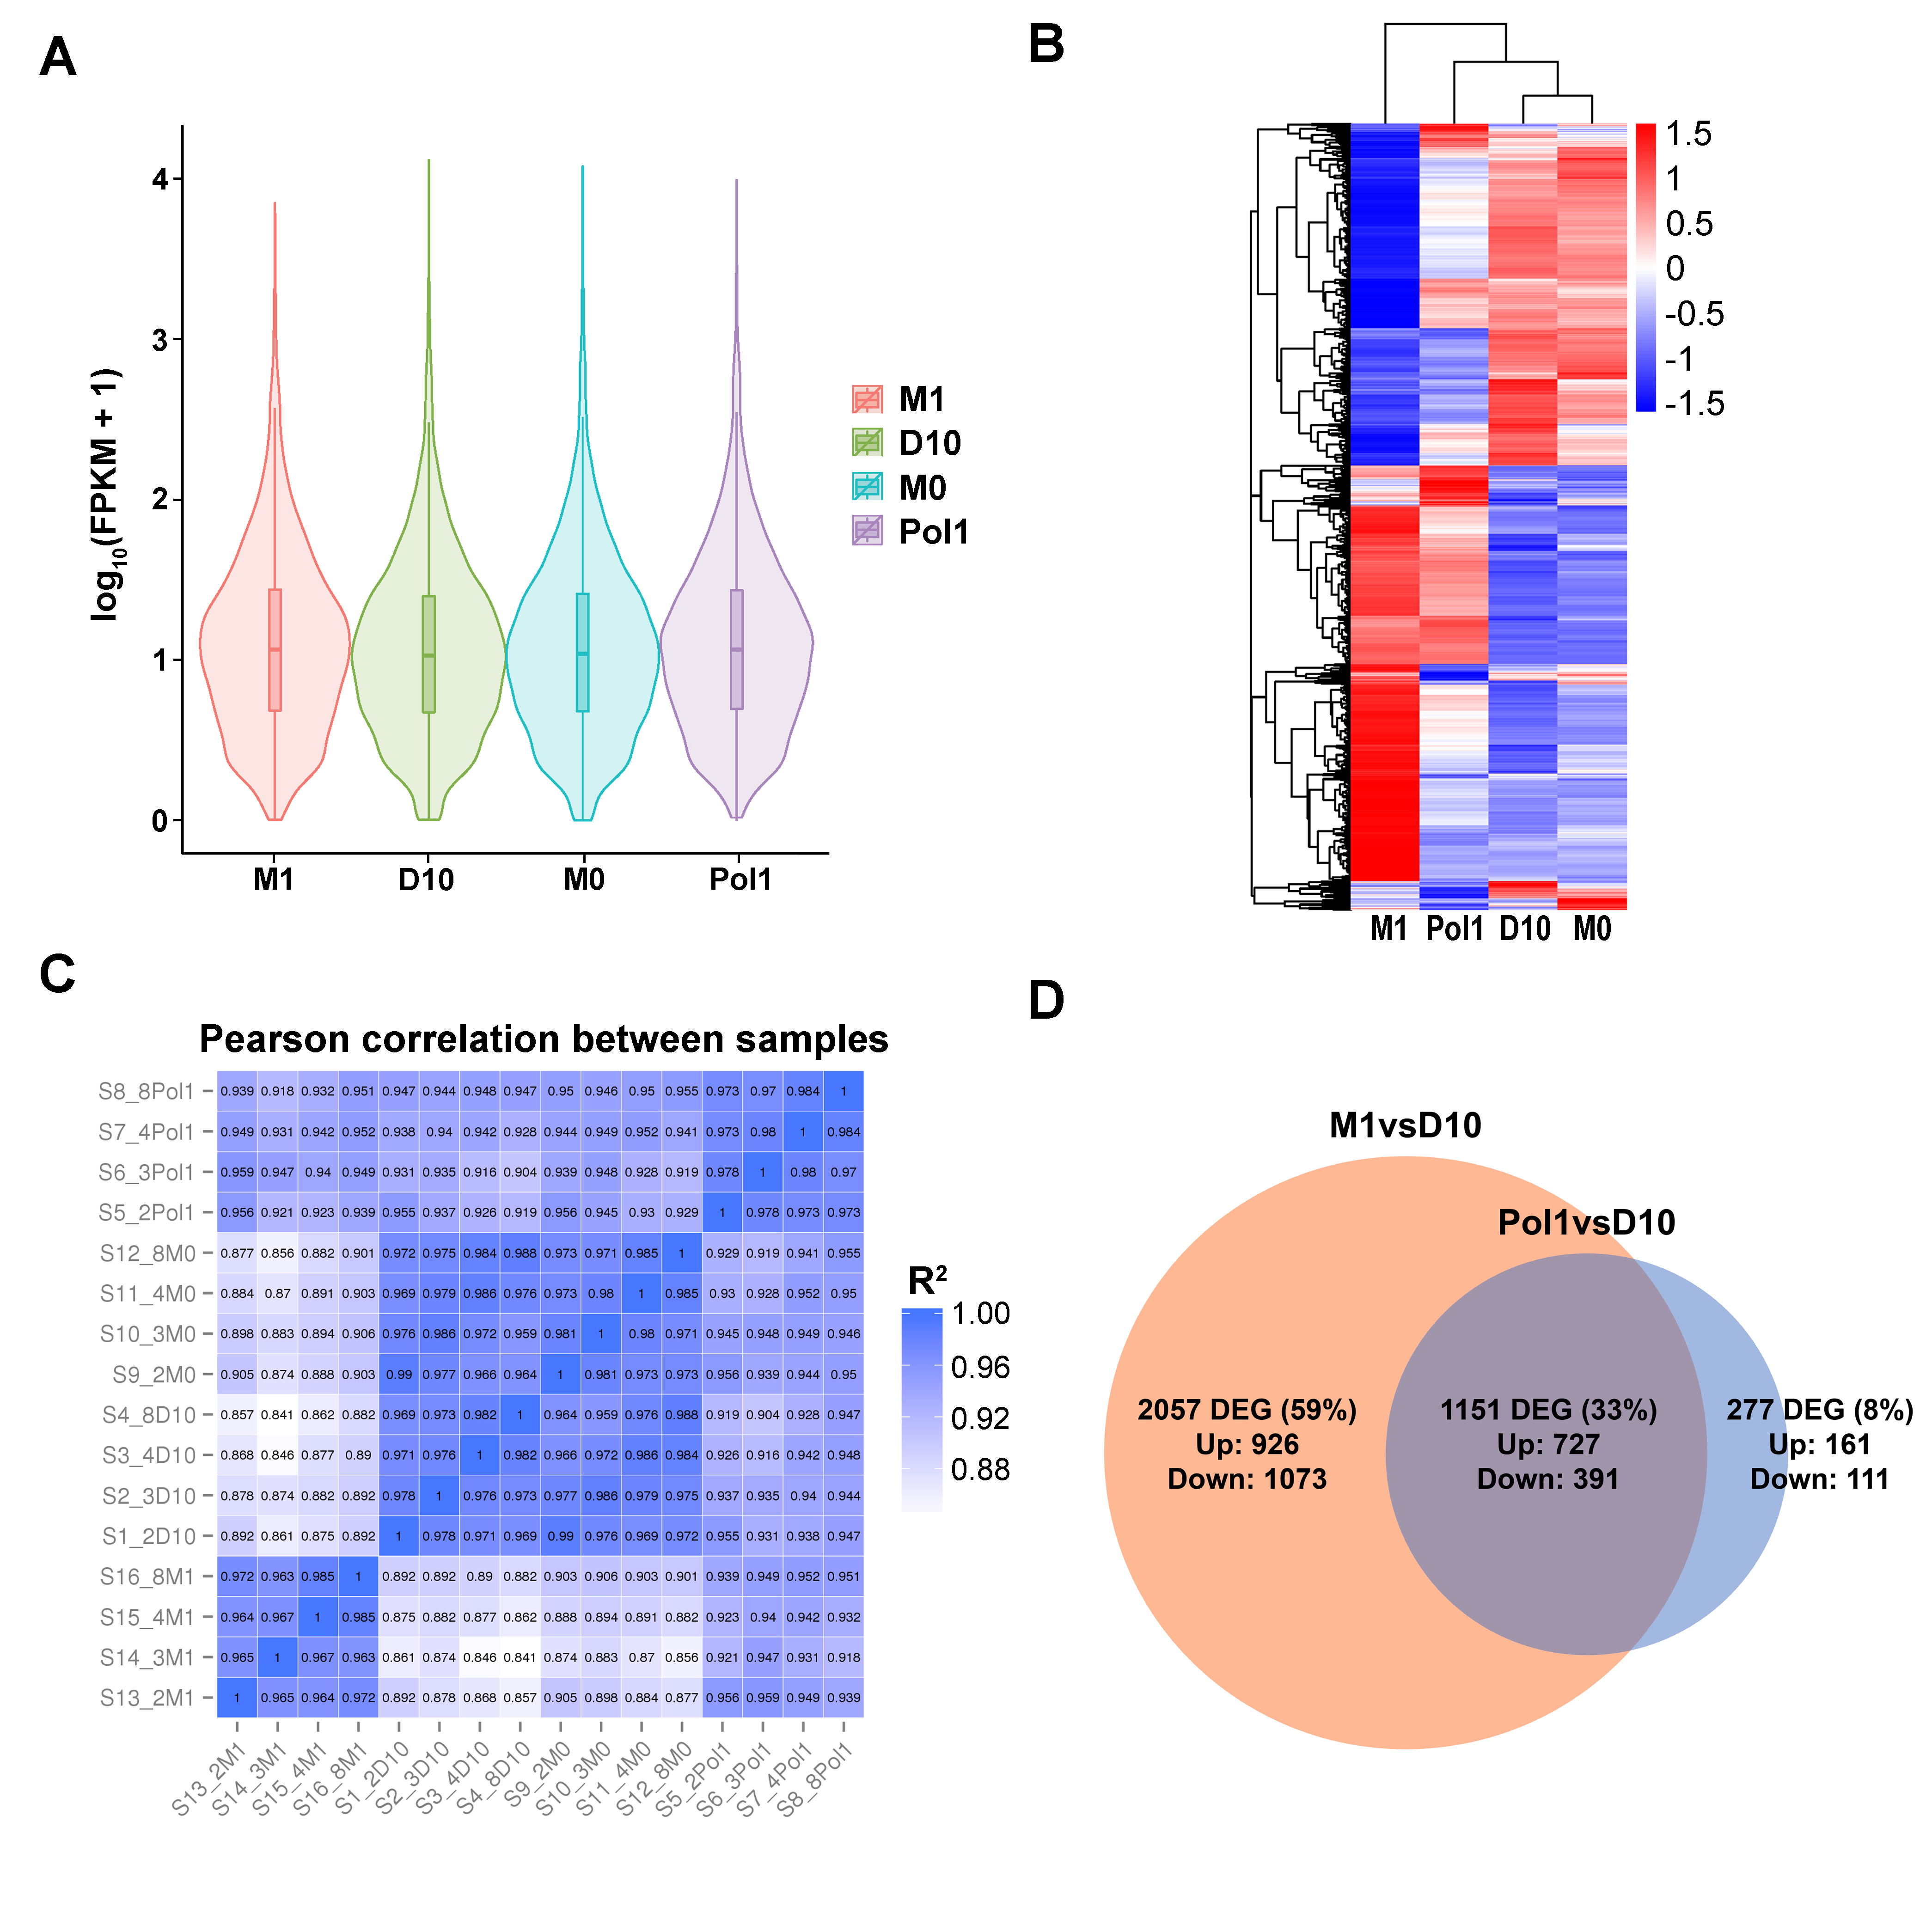
2.2. RNAseq Analysis
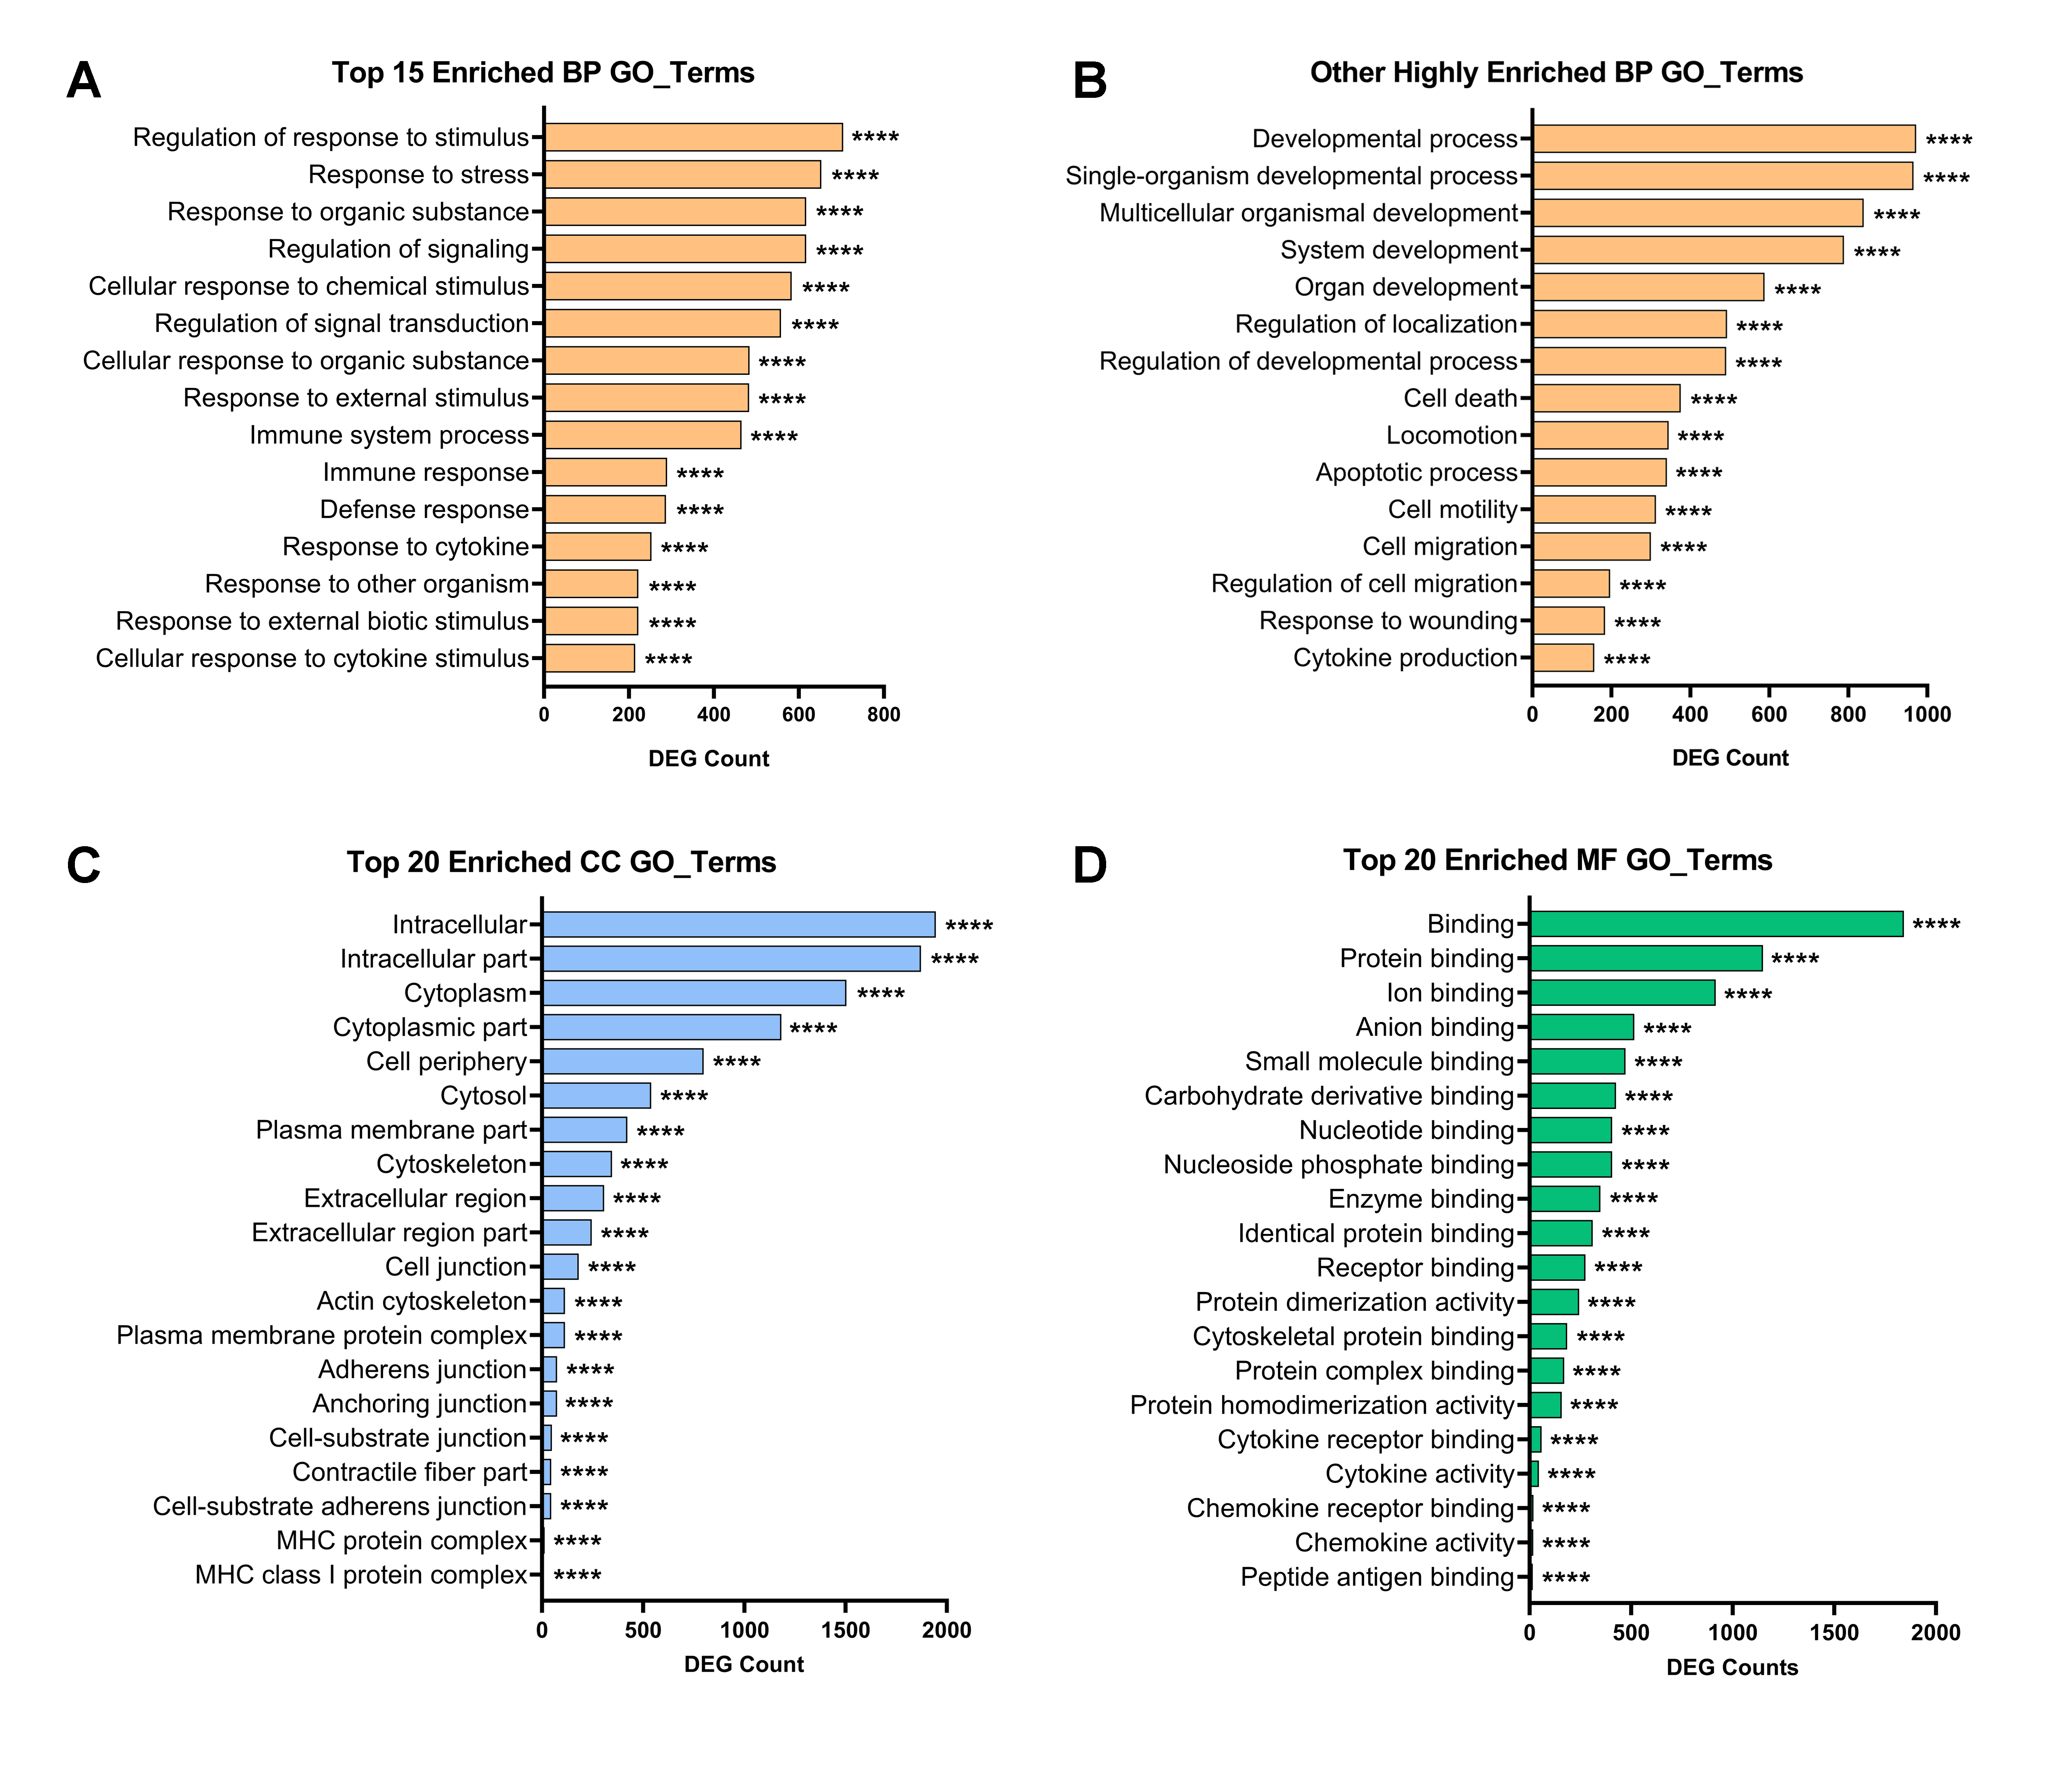
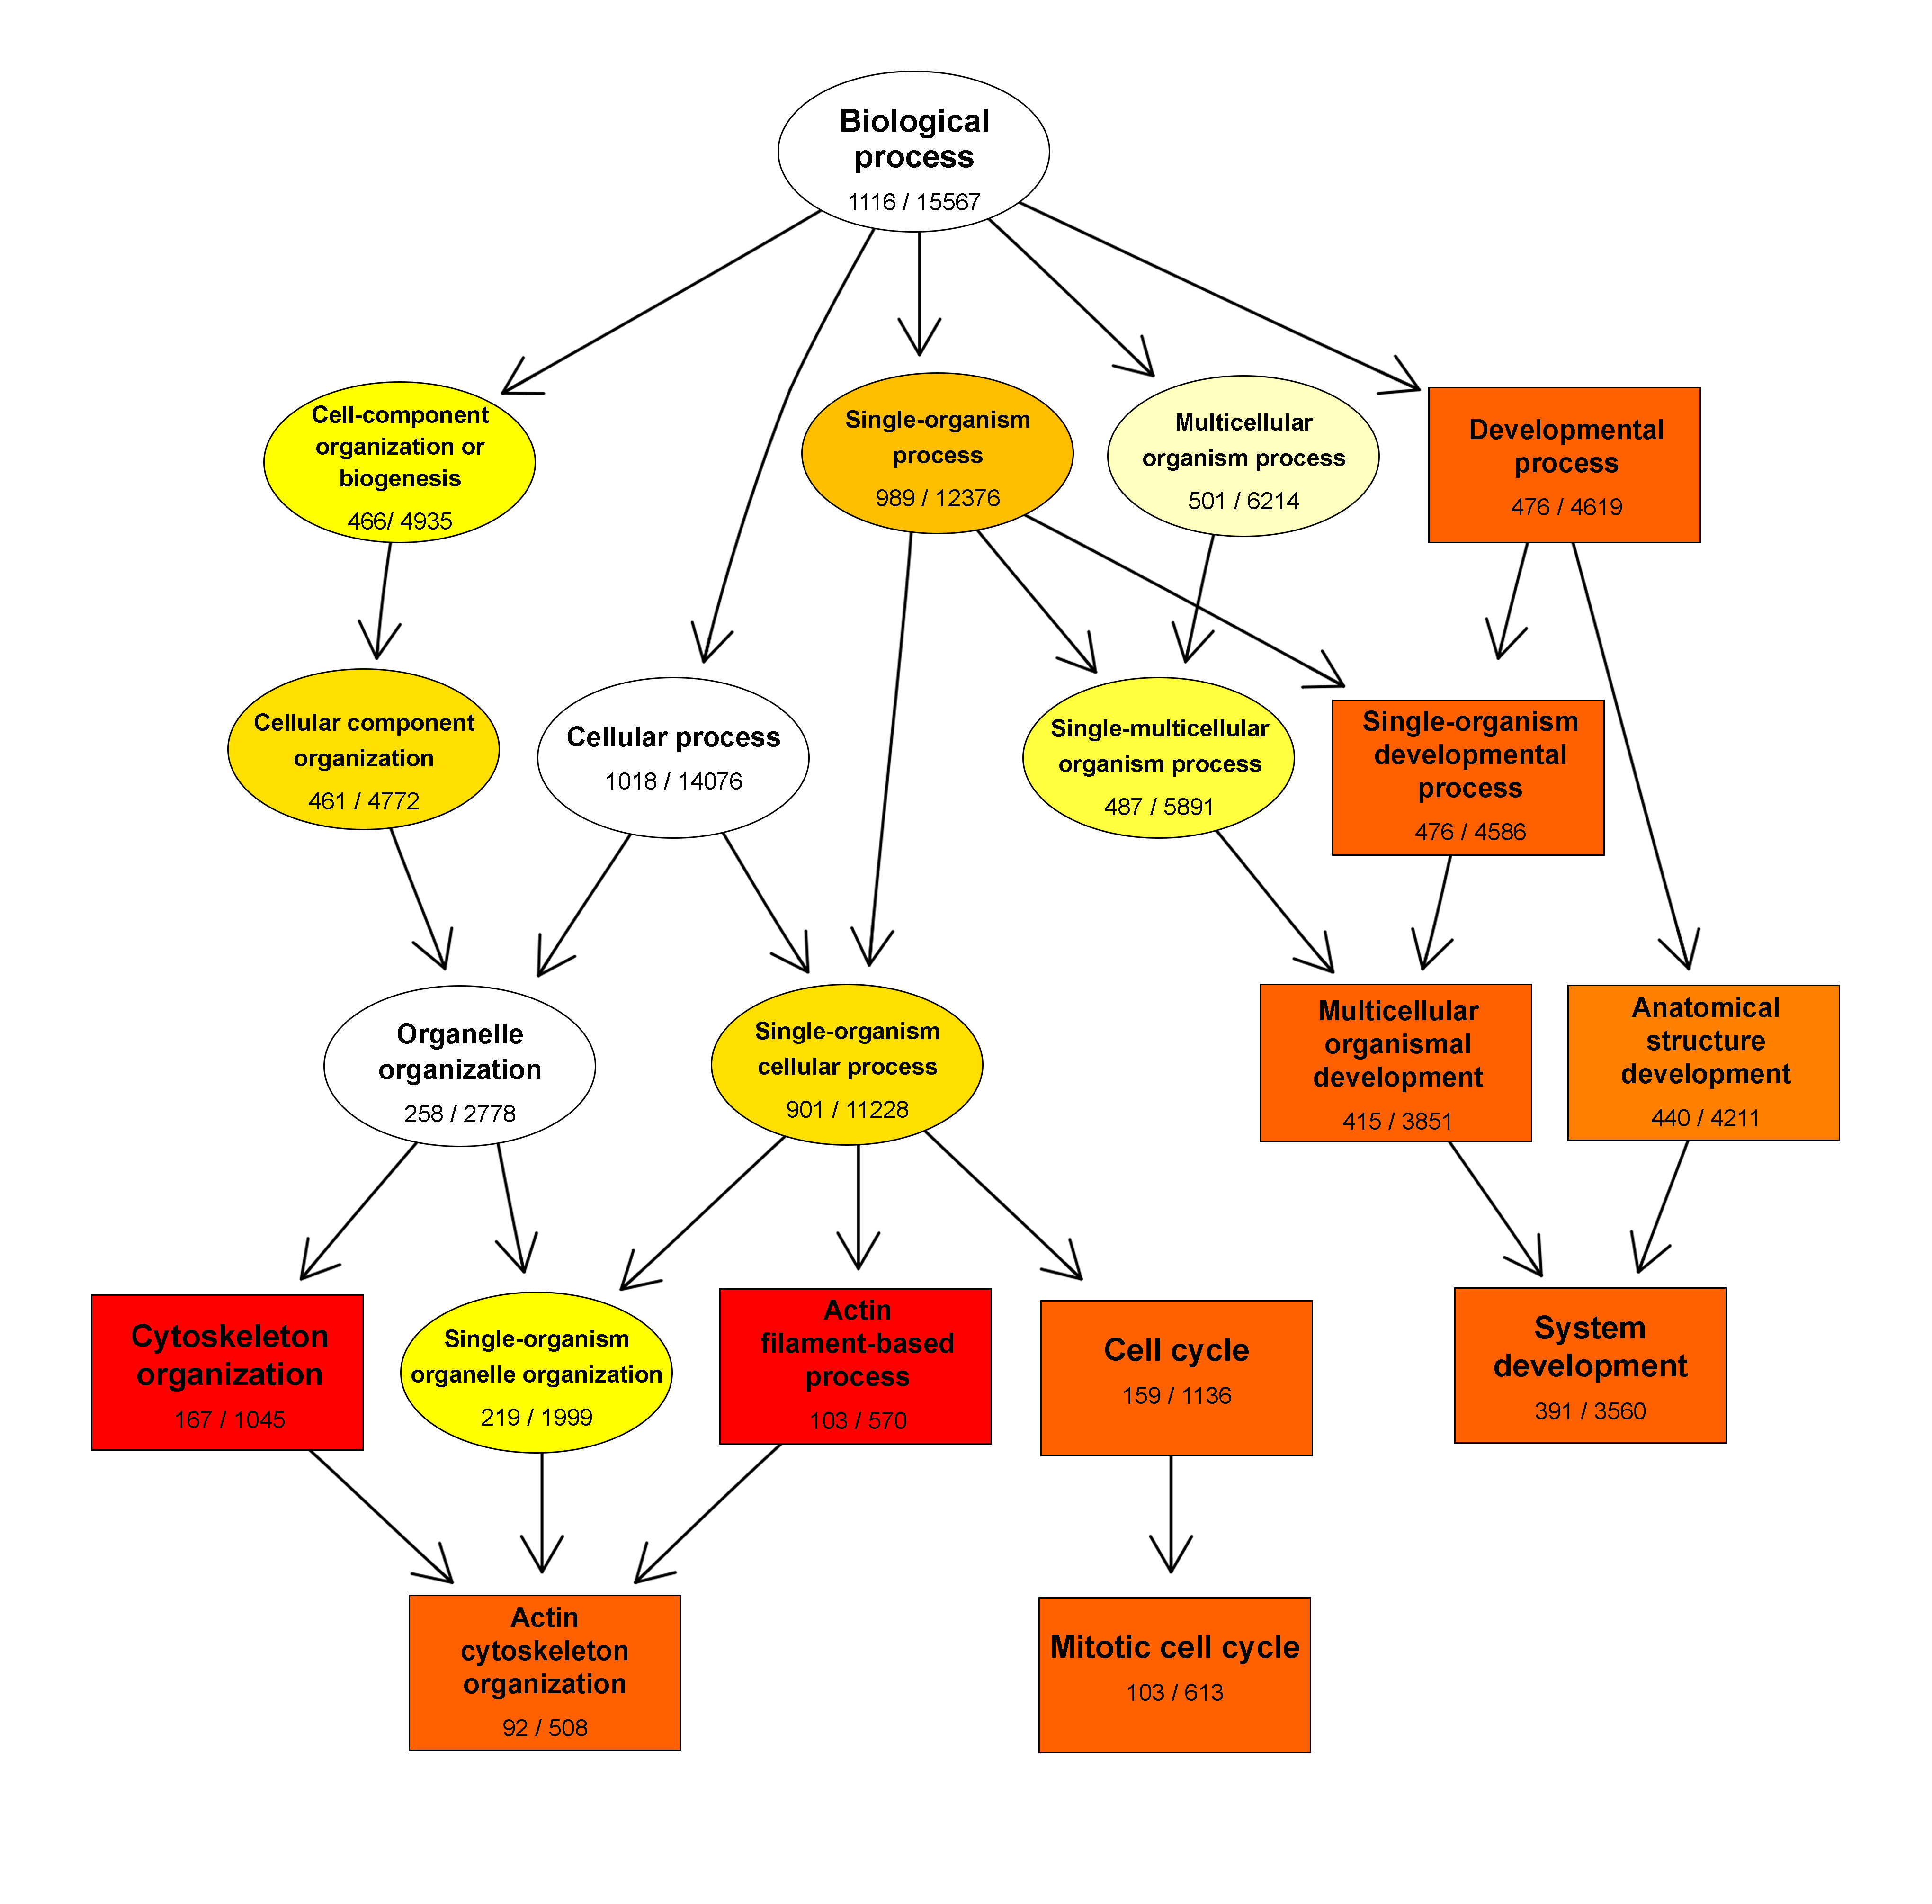
2.3. Gene Ontology Analysis
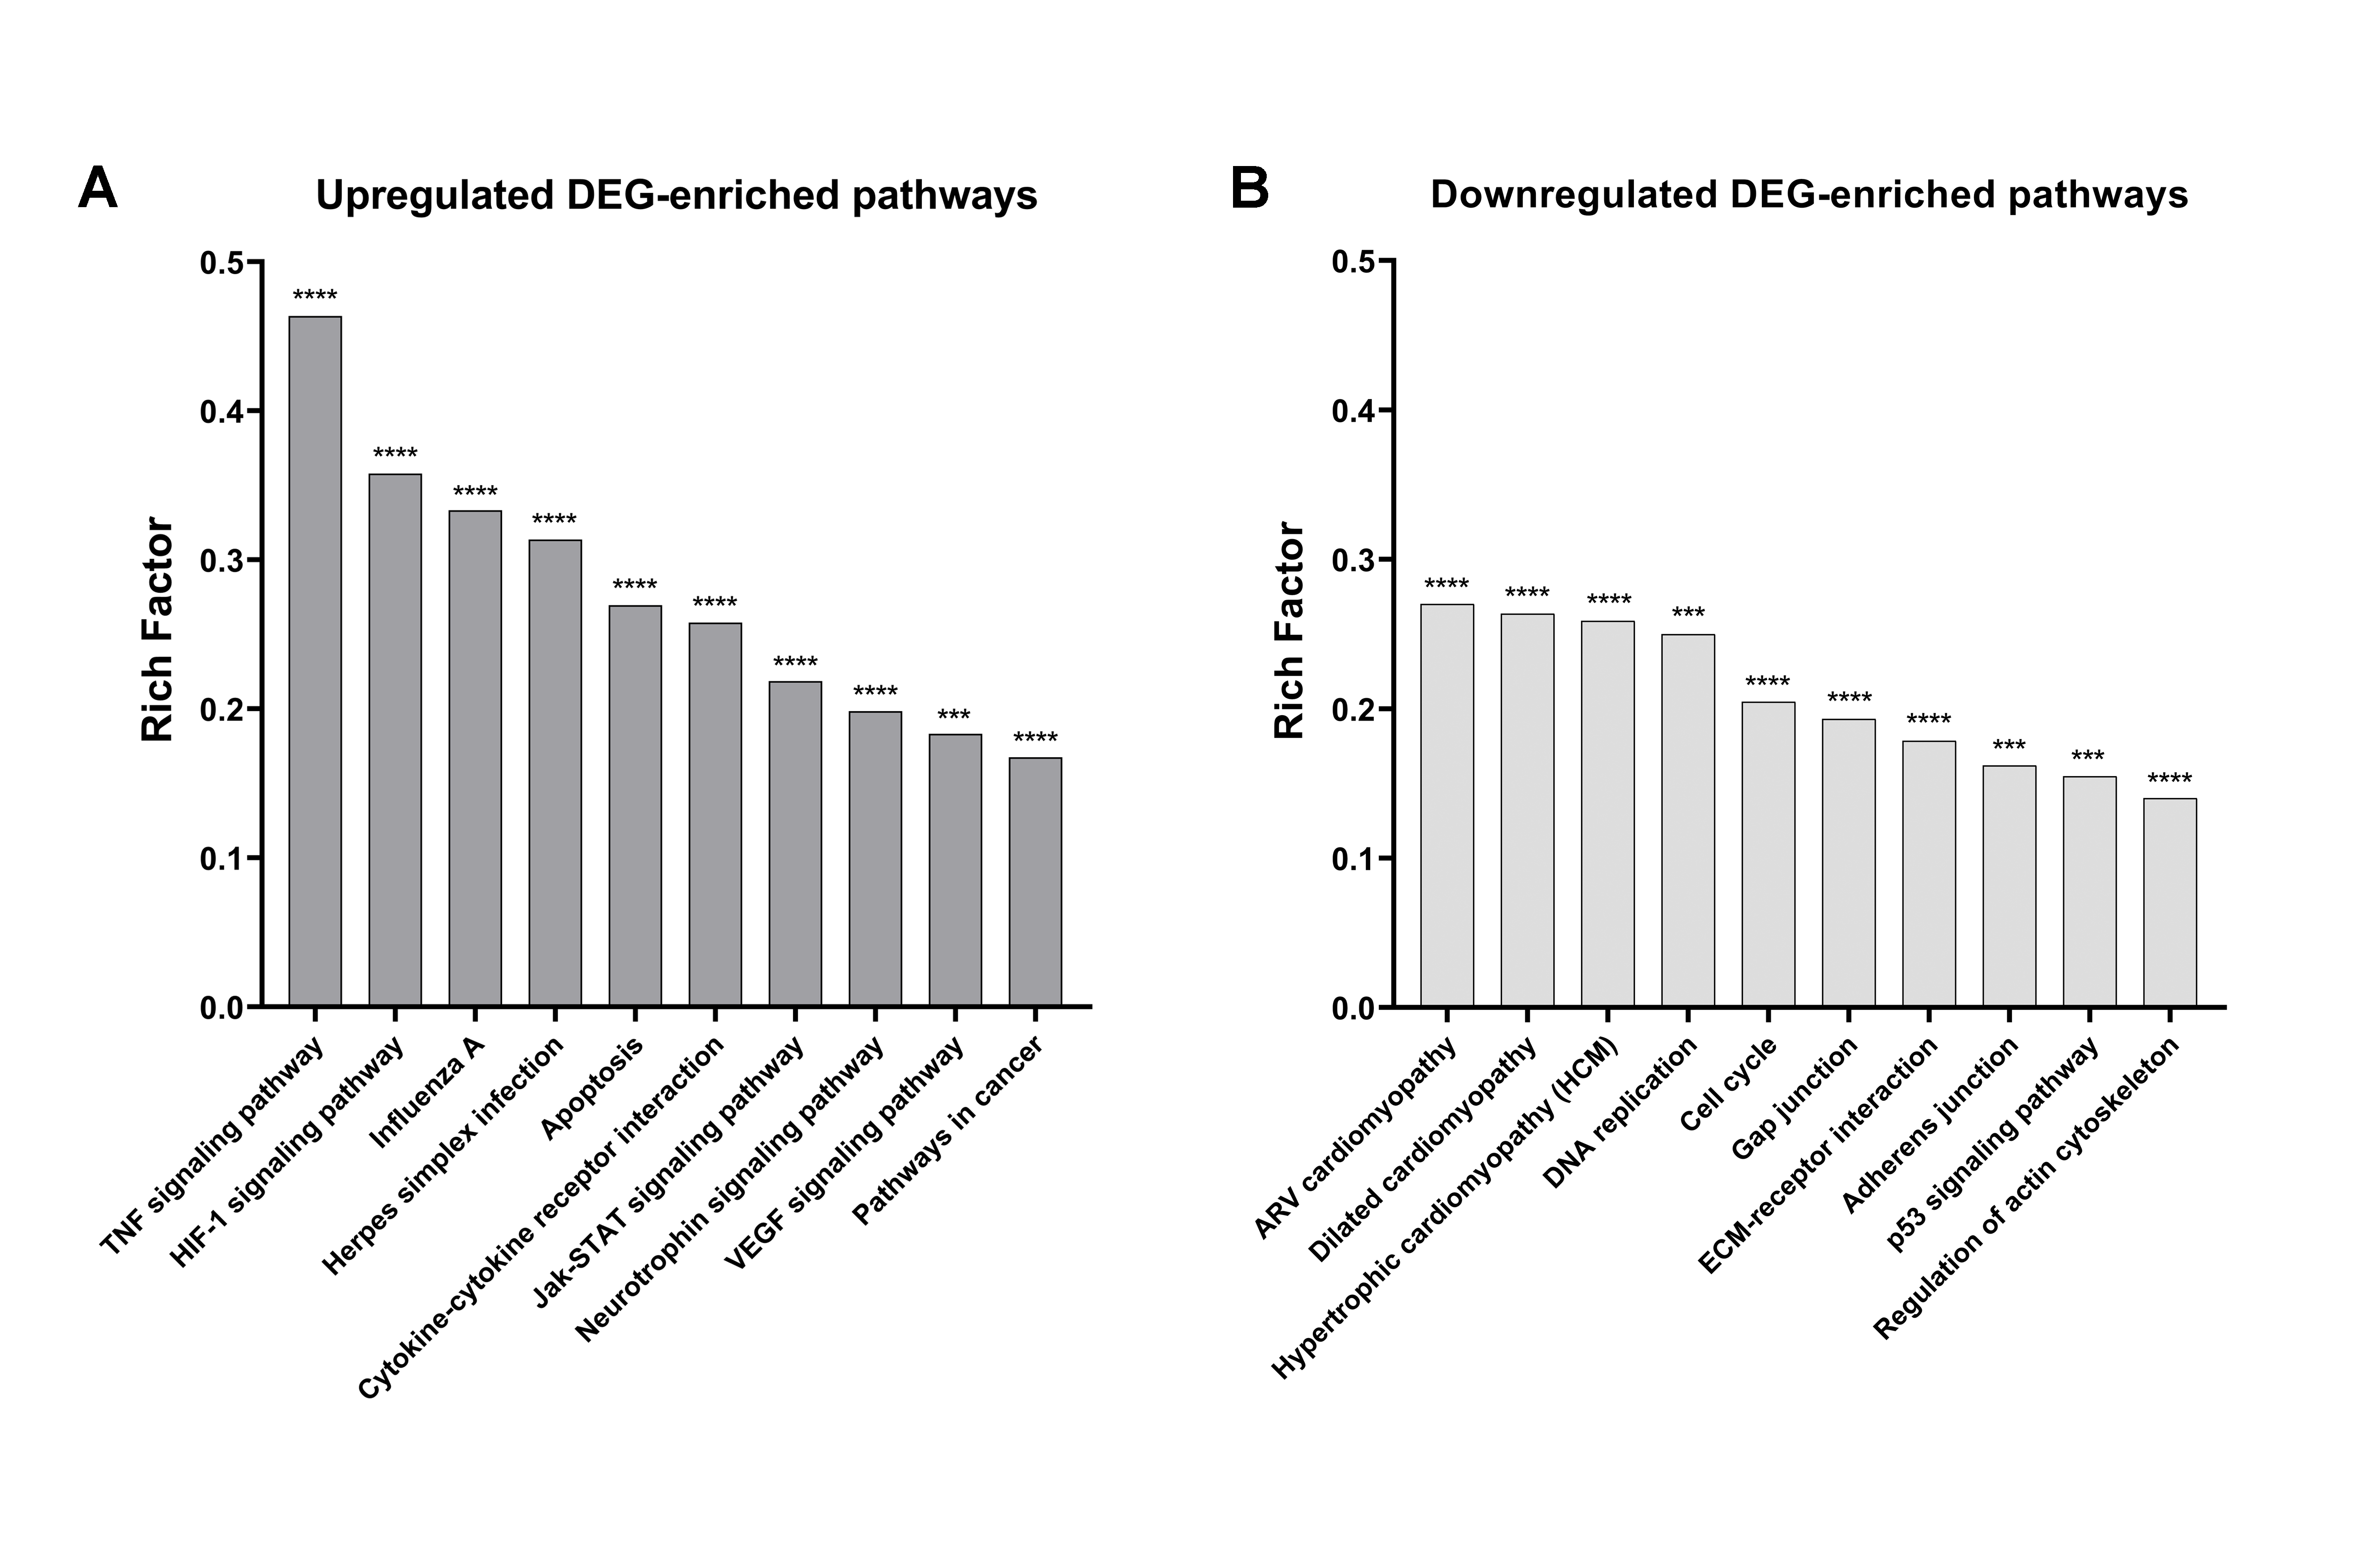
2.4. KEGG Pathway Analysis
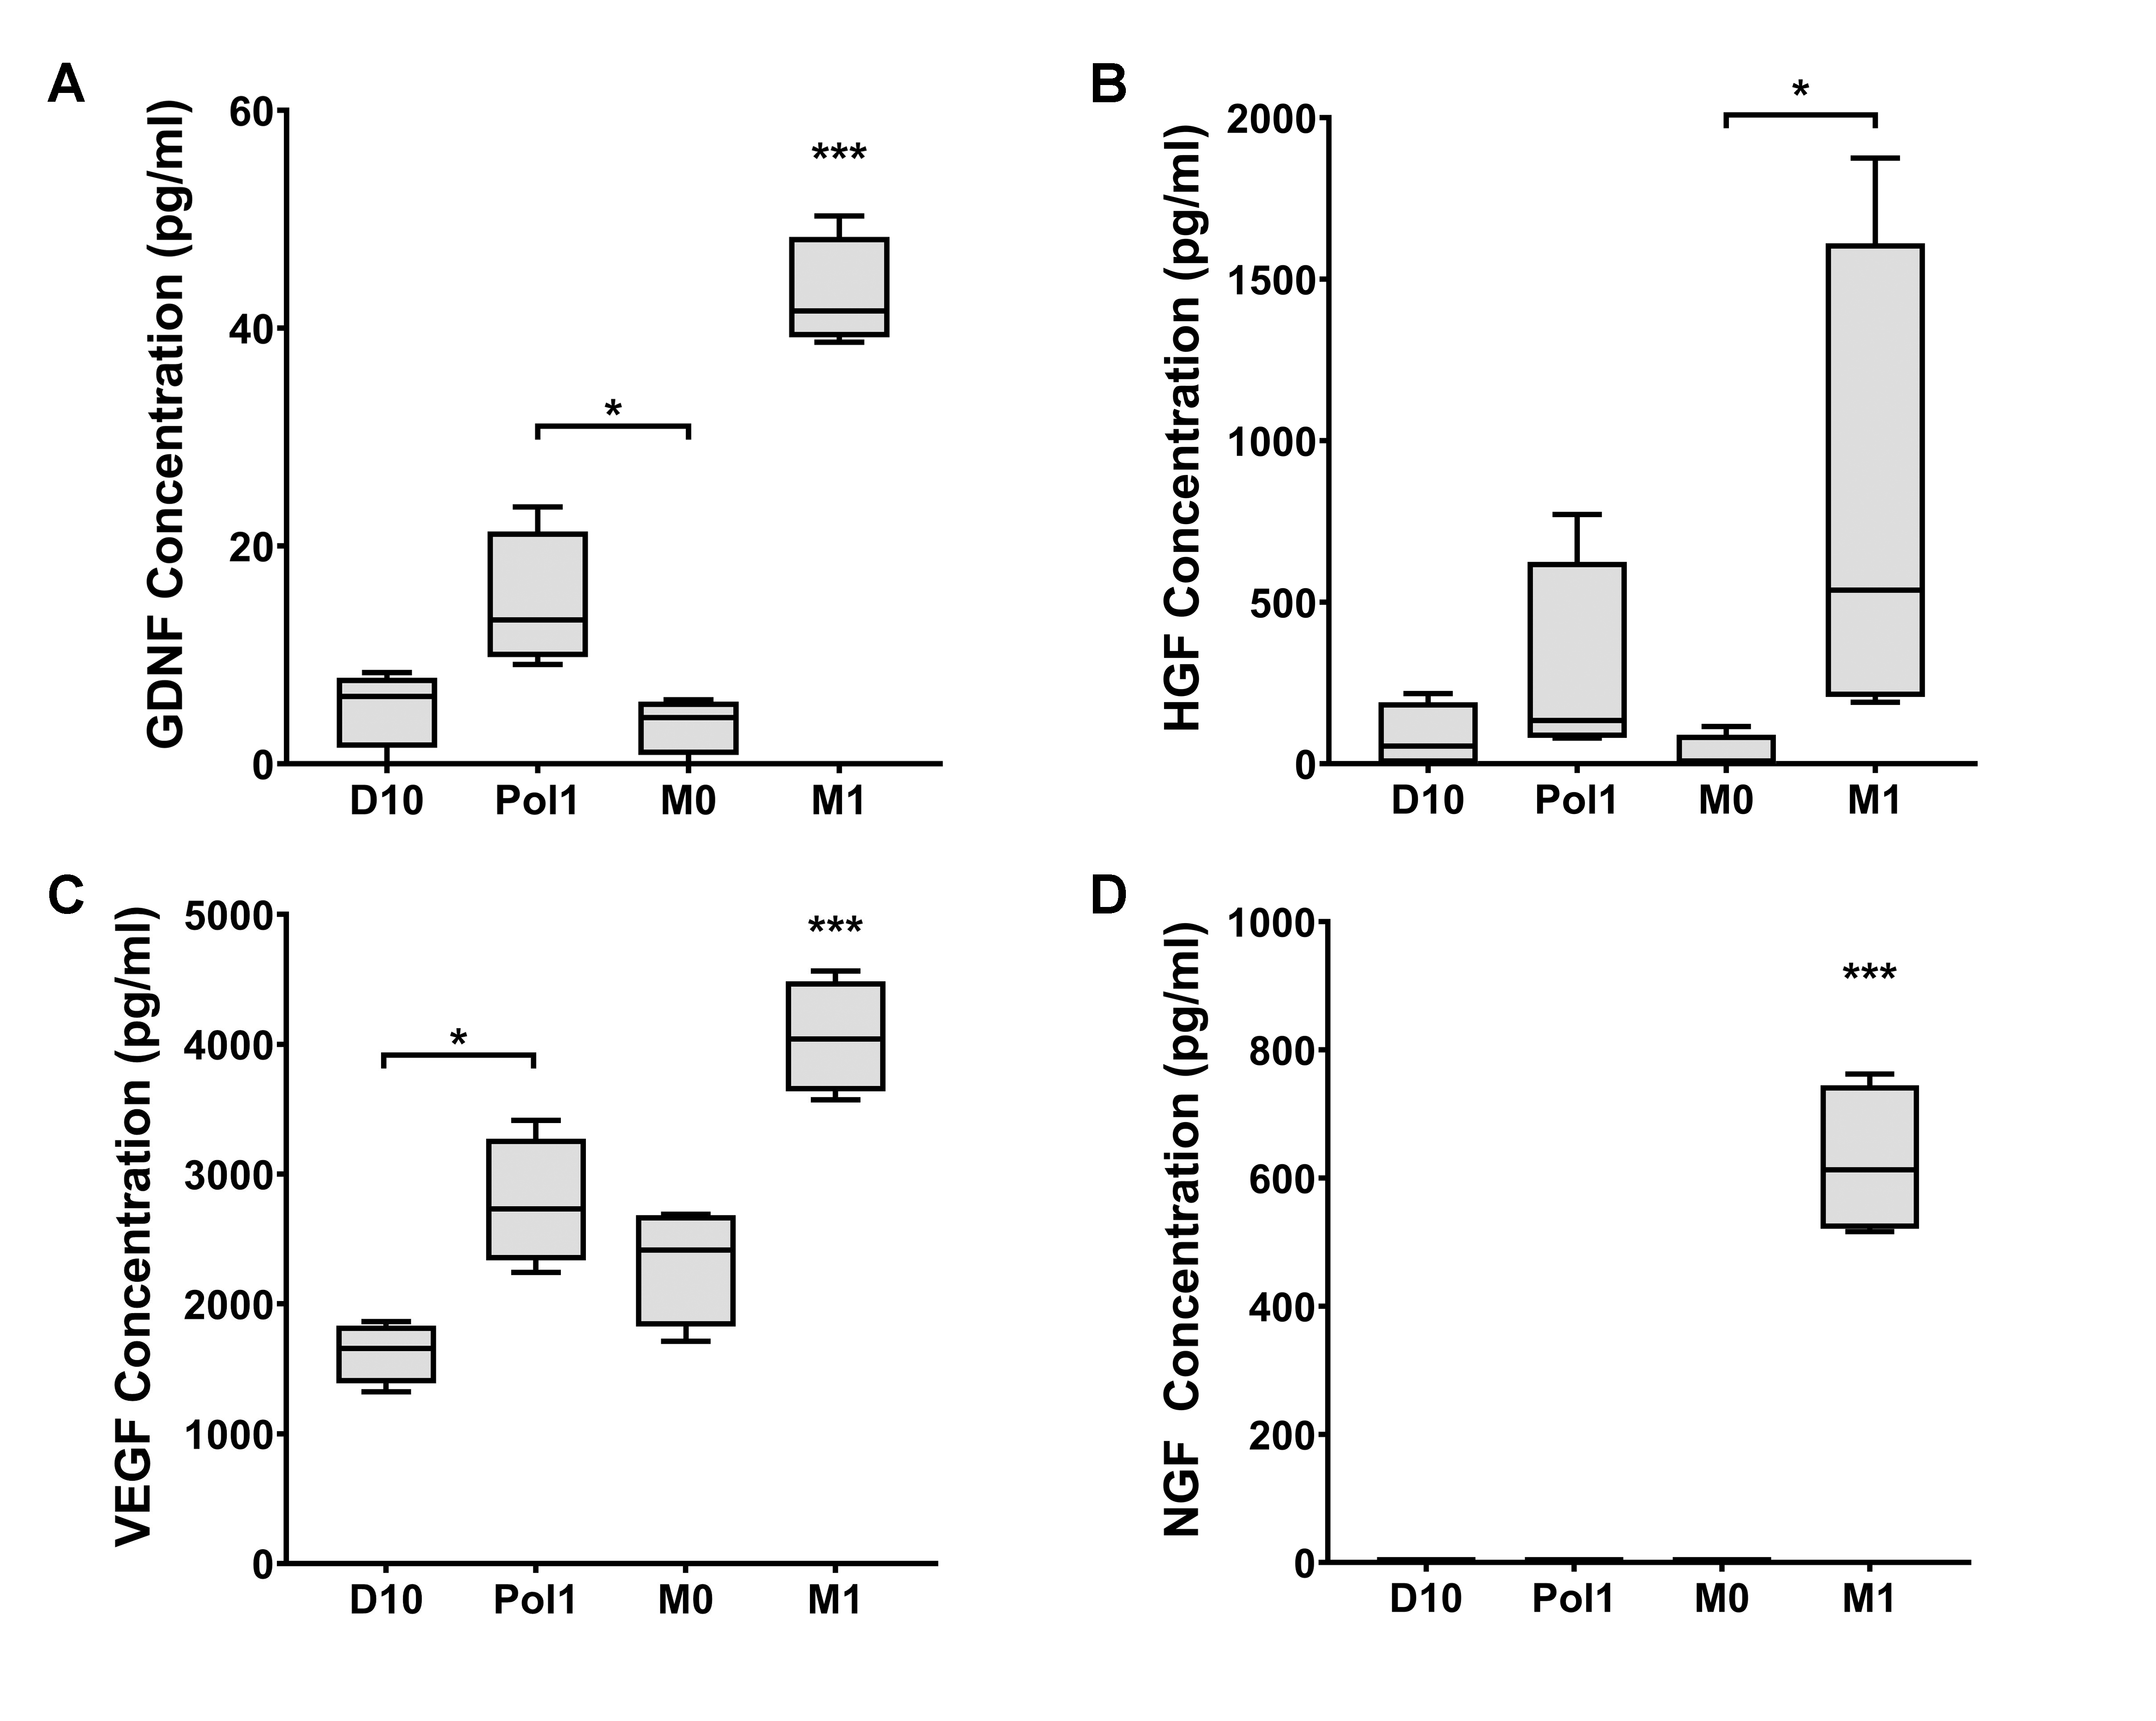
2.5. Secretome
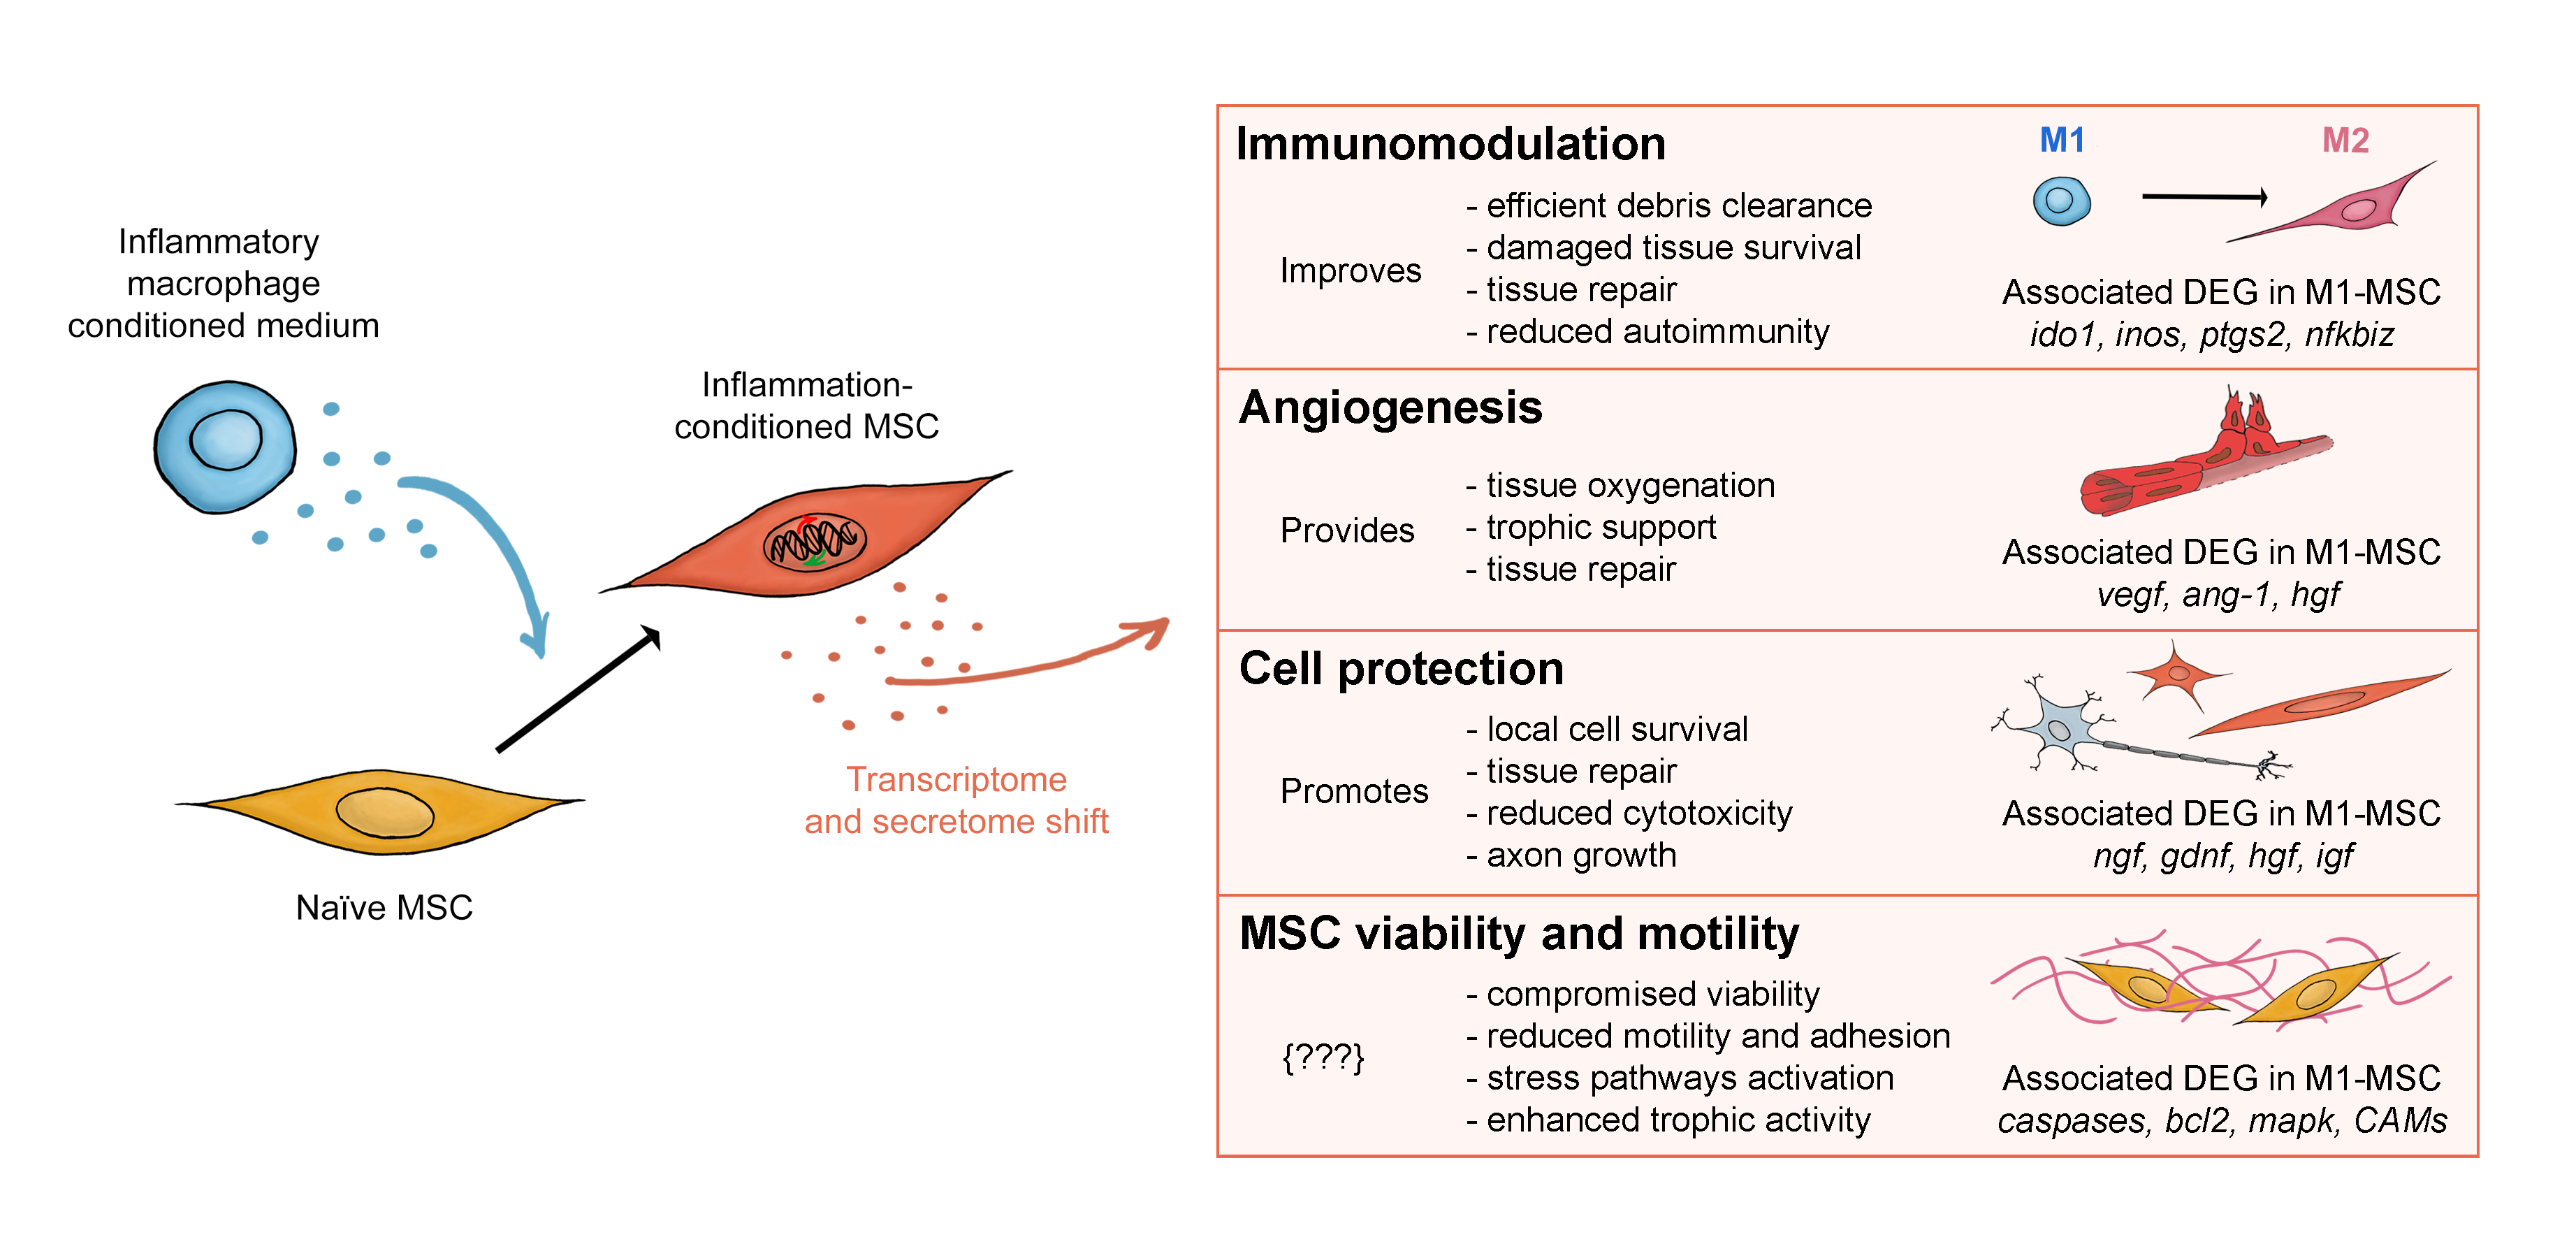
3. Discussion
4. Materials and Methods
4.1. Animals
4.2. Bone Marrow Harvest and Culture
4.3. Mesenchymal Stromal Cells
4.4. Macrophages
4.5. Flow Cytometry Cell Sorting
4.6. MSCs Conditioning
4.7. Immunoassays
4.8. RNA Extraction, Library Preparation, and Sequencing
4.9. Sequence Annotation and Differential Gene Expression
4.10. Gene Ontology and KEGG Pathway Analyses
4.11. Statistical Analysis
Supplementary Materials
Author Contributions
Funding
Institutional Review Board Statement
Informed Consent Statement
Data Availability Statement
Conflicts of Interest
Abbreviations
| MSC | Mesenchymal stromal cell |
| RNAseq | RNA high throughput sequencing |
| GO | Gene ontology |
| LPS | Lipopolysaccharide |
| D10 | Baseline medium for MSC (DMEM + fetal bovine serum + gentamycin) |
| Pol1 | Pro-inflammatory polarization medium for macrophages |
| M0CM | Conditioned medium from non-polarized macrophages (M0) |
| M1CM | Conditioned medium from pro-inflammatory macrophages (M1) |
| IFNγ | Interferon gamma |
| FACS | Fluorescence activated cell sorting |
| P2, P4 | Passage 2 or 4 |
| CM | Conditioned medium |
| PDL | Poly-(D)-Lysine |
| FPKM | Fragments Per Kilobase of transcript sequence per Millions base pairs sequenced |
| DEG | Differentially expressed gene |
| DE | Differential expression |
| BP | Biological process |
| MAPK | Mitogen activated protein kinase |
| hif1α | Hypoxia inducible factor 1 subunit alpha |
| nfkb1 | Nuclear factor kappa B subunit 1 |
| nfkbiz | Nuclear factor kappa B inhibitor zeta |
| hgf, HGF | Hepatocyte growth factor |
| ngf, NGF | Nerve growth factor |
| ido1 | Indoleamine 2,3-dioxygenase 1 |
| irfs | Interferon regulatory factors |
| DAG | Directed acyclic graph |
| p(adj) | p-value adjusted for multiple testing |
| CC | Cellular component |
| MF | Molecular function |
| MHC | Major histocompatibility complex |
| KEGG | Kyoto Encyclopedia of Genes and Genomes |
| RF | Rich factor |
| TNF | Tumor necrosis factor |
| Gdnf, GDNF | Glial derived neurotrophic factor |
| Vegf, VEGF | Vascular endothelial growth factor |
| bcl2 | B cell lymphoma 2 |
| JAK | Janus kinase |
| STAT | Signal transducer and activator of transcription |
| ELISA | Enzyme-linked immunosorbent assay |
| nos2 | Nitric oxide synthase 2 |
| il13r | Interleukin 13 receptor |
| ptgs2 | Prostaglandin synthase 2 |
| ang-1 | Angiopoietin 1 |
| egf | Endothelial growth factor |
| IGF | Insulin like growth factor |
| FGF | Fibroblast growth factor |
| bmp | Bone morphogenetic protein |
| wnt | Wingless-Int-1 protein family |
| PGE2 | Prostaglandin E2 |
| QC | Quality control |
| GEO | Gene expression omnibus |
References
- Bernardo, M.E.; Pagliara, D.; Locatelli, F. Mesenchymal stromal cell therapy: A revolution in Regenerative Medicine? Bone Marrow Transplant. 2012, 47, 164–171. [Google Scholar] [CrossRef] [Green Version]
- Cofano, F.; Boido, M.; Monticelli, M.; Zenga, F.; Ducati, A.; Vercelli, A.; Garbossa, D. Mesenchymal Stem Cells for Spinal Cord Injury: Current Options, Limitations, and Future of Cell Therapy. Int. J. Mol. Sci. 2019, 20, 2698. [Google Scholar] [CrossRef] [Green Version]
- Waterman, R.S.; Morgenweck, J.; Nossaman, B.D.; Scandurro, A.E.; Scandurro, S.A.; Betancourt, A.M. Anti-Inflammatory Mesenchymal Stem Cells (MSC2) Attenuate Symptoms of Painful Diabetic Peripheral Neuropathy. STEM CELLS Transl. Med. 2012, 1, 557–565. [Google Scholar] [CrossRef]
- Hare, J.M.; Traverse, J.H.; Henry, T.D.; Dib, N.; Strumpf, R.K.; Schulman, S.P.; Gerstenblith, G.; DeMaria, A.N.; Denktas, A.E.; Gammon, R.S.; et al. A randomized, double-blind, placebo-controlled, dose-escalation study of intravenous adult human mesenchymal stem cells (prochymal) after acute myocardial infarction. J. Am. Coll. Cardiol. 2009, 54, 2277–2286. [Google Scholar] [CrossRef] [Green Version]
- Lee, J.-W.; Lee, S.-H.; Youn, Y.-J.; Ahn, M.-S.; Kim, J.-Y.; Yoo, B.-S.; Yoon, J.; Kwon, W.; Hong, I.-S.; Lee, K.; et al. A Randomized, Open-Label, Multicenter Trial for the Safety and Efficacy of Adult Mesenchymal Stem Cells after Acute Myocardial Infarction. J. Korean Med. Sci. 2014, 29, 23–31. [Google Scholar] [CrossRef] [Green Version]
- Godoy, J.A.P.; Paiva, R.M.A.; Souza, A.M.; Kondo, A.T.; Kutner, J.M.; Okamoto, O.K. Clinical Translation of Mesenchymal Stromal Cell Therapy for Graft Versus Host Disease. Front. Cell Dev. Biol. 2019, 7, 255. [Google Scholar] [CrossRef] [PubMed] [Green Version]
- Bernardo, M.E.; Fibbe, W.E. Mesenchymal Stromal Cells: Sensors and Switchers of Inflammation. Cell Stem Cell 2013, 13, 392–402. [Google Scholar] [CrossRef] [PubMed] [Green Version]
- Caplan, A.I. Why are MSCs therapeutic? New data: New insight. J. Pathol. 2009, 217, 318–324. [Google Scholar] [CrossRef] [PubMed]
- Liu, Y.; Dulchavsky, D.S.; Gao, X.; Kwon, D.; Chopp, M.; Dulchavsky, S.; Gautam, S.C. Wound Repair by Bone Marrow Stromal Cells through Growth Factor Production. J. Surg. Res. 2006, 136, 336–341. [Google Scholar] [CrossRef] [PubMed]
- Ma, S.; Xie, N.; Li, W.; Yuan, B.; Shi, Y.; Wang, Y. Immunobiology of mesenchymal stem cells. Cell Death Differ. 2014, 21, 216–225. [Google Scholar] [CrossRef]
- Zhu, J.; Liu, Q.; Jiang, Y.; Wu, L.; Xu, G.; Liu, X.-F. Enhanced angiogenesis promoted by human umbilical mesenchymal stem cell transplantation in stroked mouse is Notch1 signaling associated. Neuroscience 2015, 290, 288–299. [Google Scholar] [CrossRef] [PubMed]
- Maldonado-Lasunción, I.; Verhaagen, J.; Oudega, M. Mesenchymal Stem Cell-Macrophage Choreography Supporting Spinal Cord Repair. Neurotherapeutics 2018, 15, 578–587. [Google Scholar] [PubMed] [Green Version]
- Chung, E.; Son, Y. Crosstalk between mesenchymal stem cells and macrophages in tissue repair. Tissue Eng. Regen. Med. 2014, 11, 431–438. [Google Scholar] [CrossRef]
- Le Blanc, K.; Mougiakakos, D. Multipotent mesenchymal stromal cells and the innate immune system. Nat. Rev. Immunol. 2012, 12, 383–396. [Google Scholar] [PubMed]
- Sanina, C.; Hare, J.M. Mesenchymal Stem Cells as a Biological Drug for Heart Disease: Where Are We with Cardiac Cell-Based Therapy? Circ. Res. 2015, 117, 229–233. [Google Scholar] [CrossRef] [Green Version]
- Loebel, C.; Burdick, J.A. Engineering Stem and Stromal Cell Therapies for Musculoskeletal Tissue Repair. Cell Stem Cell 2018, 22, 325–339. [Google Scholar] [CrossRef] [Green Version]
- Freitag, J.; Bates, D.; Boyd, R.; Shah, K.; Barnard, A.; Huguenin, L.; Tenen, A. Mesenchymal stem cell therapy in the treatment of osteoarthritis: Reparative pathways, safety and efficacy—A review. BMC Musculoskelet. Disord. 2016, 17, 230. [Google Scholar]
- Peng, Y.; Chen, X.; Liu, Q.; Zhang, X.; Huang, K.; Liu, L.; Li, H.; Zhou, M.; Huang, F.; Fan, Z.; et al. Mesenchymal stromal cells infusions improve refractory chronic graft versus host disease through an increase of CD5+ regulatory B cells producing interleukin 10. Leukemia 2015, 29, 636–646. [Google Scholar] [CrossRef] [Green Version]
- Kebriaei, P.; Robinson, S. Treatment of graft-versus-host-disease with mesenchymal stromal cells. Cytotherapy 2011, 13, 262–268. [Google Scholar] [CrossRef]
- Guo, Y.; Yu, Y.; Hu, S.; Chen, Y.; Shen, Z. The therapeutic potential of mesenchymal stem cells for cardiovascular diseases. Cell Death Dis. 2020, 11, 1–10. [Google Scholar]
- Fan, M.; Huang, Y.; Chen, Z.; Xia, Y.; Chen, A.; Lu, D.; Wu, Y.; Zhang, N.; Ge, J. Efficacy of mesenchymal stem cell therapy in systolic heart failure: A systematic review and meta-analysis. Stem Cell Res. Ther. 2019, 10, 1–14. [Google Scholar]
- Pittenger, M.F.; Discher, D.E.; Péault, B.M.; Phinney, D.G.; Hare, J.M.; Caplan, A.I. Mesenchymal stem cell perspective: Cell biology to clinical progress. NPJ Regen. Med. 2019, 4, 1–15. [Google Scholar] [CrossRef] [PubMed] [Green Version]
- De Becker, A.; Riet, I.V. Homing and migration of mesenchymal stromal cells: How to improve the efficacy of cell therapy? World J. Stem Cells 2016, 8, 73–87. [Google Scholar] [CrossRef] [PubMed]
- Herrmann, M.; Verrier, S.; Alini, M. Strategies to Stimulate Mobilization and Homing of Endogenous Stem and Progenitor Cells for Bone Tissue Repair. Front. Bioeng. Biotechnol. 2015, 3, 79. [Google Scholar] [CrossRef]
- Hocking, A.M. The Role of Chemokines in Mesenchymal Stem Cell Homing to Wounds. Adv. Wound Care New Rochelle 2015, 4, 623–630. [Google Scholar] [CrossRef]
- Zachar, L.; Bačenková, D.; Rosocha, J. Activation, homing, and role of the mesenchymal stem cells in the inflammatory environment. J. Inflamm. Res. 2016, 9, 231–240. [Google Scholar] [CrossRef] [Green Version]
- Herrmann, J.L.; Wang, Y.; Abarbanell, A.M.; Weil, B.R.; Tan, J.; Meldrum, D.R. Preconditioning mesenchymal stem cells with transforming growth factor-alpha improves mesenchymal stem cell-mediated cardioprotection. Shock 2010, 33, 24–30. [Google Scholar] [CrossRef]
- Crisostomo, P.R.; Wang, Y.; Markel, T.A.; Wang, M.; Lahm, T.; Meldrum, D.R. Human mesenchymal stem cells stimulated by TNF-alpha, LPS, or hypoxia produce growth factors by an NF kappa B- but not JNK-dependent mechanism. Am. J. Physiol. Cell Physiol. 2008, 294, C675–C682. [Google Scholar] [CrossRef]
- Ti, D.; Hao, H.; Tong, C.; Liu, J.; Dong, L.; Zheng, J.; Zhao, Y.; Liu, H.; Fu, X.; Han, W. LPS-preconditioned mesenchymal stromal cells modify macrophage polarization for resolution of chronic inflammation via exosome-shuttled let-7b. J. Transl. Med. 2015, 13, 308. [Google Scholar] [CrossRef] [Green Version]
- Waterman, R.S.; Tomchuck, S.L.; Henkle, S.L.; Betancourt, A.M. A New Mesenchymal Stem Cell (MSC) Paradigm: Polarization into a Pro-Inflammatory MSC1 or an Immunosuppressive MSC2 Phenotype. PLoS ONE 2010, 5, e10088. [Google Scholar] [CrossRef]
- Cooke, J.P. Inflammation and its role in regeneration and repair: A caution for novel anti-inflammatory therapies. Circ. Res. 2019, 124, 1166–1168. [Google Scholar] [CrossRef] [PubMed]
- Schultze, J.L.; Schmieder, A.; Goerdt, S. Macrophage activation in human diseases. Semin. Immunol. 2015, 27, 249–256. [Google Scholar] [CrossRef] [PubMed]
- Murray, P.J.; Allen, J.E.; Biswas, S.K.; Fisher, E.A.; Gilroy, D.W.; Goerdt, S.; Gordon, S.; Hamilton, J.A.; Ivashkiv, L.B.; Lawrence, T.; et al. Macrophage activation and polarization: Nomenclature and experimental guidelines. Immunity 2014, 41, 14–20. [Google Scholar] [CrossRef] [Green Version]
- Wise, A.F.; Williams, T.M.; Kiewiet, M.B.G.; Payne, N.L.; Siatskas, C.; Samuel, C.S.; Ricardo, S.D. Human mesenchymal stem cells alter macrophage phenotype and promote regeneration via homing to the kidney following ischemia-reperfusion injury. Am. J. Physiol. Physiol. 2014, 306, F1222–F1235. [Google Scholar] [CrossRef] [Green Version]
- Vallés, G.; Bensiamar, F.; Crespo, L.; Arruebo, M.; Vilaboa, N.; Saldaña, L. Topographical cues regulate the crosstalk between MSCs and macrophages. Biomaterials 2015, 37, 124–133. [Google Scholar] [CrossRef] [Green Version]
- Welch, W.J. How Cells Respond to Stress. Sci. Am. 1993, 268, 56–64. [Google Scholar] [CrossRef] [PubMed]
- Fulda, S.; Gorman, A.M.; Hori, O.; Samali, A. Cellular Stress Responses: Cell Survival and Cell Death. Int. J. Cell Biol. 2010, 2010, 1–23. [Google Scholar]
- Guimarães-Camboa, N.; Stowe, J.; Aneas, I.; Sakabe, N.; Cattaneo, P.; Henderson, L.; Kilberg, M.S.; Johnson, R.S.; Chen, J.; McCulloch, A.D.; et al. HIF1α Represses Cell Stress Pathways to Allow Proliferation of Hypoxic Fetal Cardiomyocytes. Dev. Cell 2015, 33, 507–521. [Google Scholar] [CrossRef] [Green Version]
- Palazon, A.; Goldrath, A.W.; Nizet, V.; Johnson, R.S. HIF transcription factors, inflammation, and immunity. Immunity 2014, 41, 518–528. [Google Scholar] [CrossRef] [Green Version]
- Cuomo, F.; Coppola, A.; Botti, C.; Maione, C.; Forte, A.; Scisciola, L.; Liguori, G.; Caiafa, I.; Ursini, M.V.; Galderisi, U.; et al. Pro-inflammatory cytokines activate hypoxia-inducible factor 3α via epigenetic changes in mesenchymal stromal/stem cells. Sci. Rep. 2018, 8, 1–12. [Google Scholar]
- Blouin, C.C.; Pagé, E.L.; Soucy, G.M.; Richard, D.E. Hypoxic gene activation by lipopolysaccharide in macrophages: Implication of hypoxia-inducible factor 1α. Blood 2004, 103, 1124–1130. [Google Scholar] [CrossRef] [PubMed]
- Albina, J.E.; Mastrofrancesco, B.; Vessella, J.A.; Louis, C.A.; Henry, W.L.; Reichner, J.S. HIF-1 expression in healing wounds: HIF-1α induction in primary inflammatory cells by TNF-α. Am. J. Physiol. Physiol. 2001, 281, C1971–C1977. [Google Scholar] [CrossRef] [PubMed]
- Ryan, J.M.; Barry, F.; Murphy, J.M.; Mahon, B.P. Interferon-gamma does not break, but promotes the immunosuppressive capacity of adult human mesenchymal stem cells. Clin. Exp. Immunol. 2007, 149, 353–363. [Google Scholar] [CrossRef] [PubMed]
- Németh, K.; Leelahavanichkul, A.; Yuen, P.S.T.; Mayer, B.; Parmelee, A.; Doi, K.; Robey, P.G.; Leelahavanichkul, K.; Koller, B.H.; Brown, J.M.; et al. Bone marrow stromal cells attenuate sepsis via prostaglandin E2–dependent reprogramming of host macrophages to increase their interleukin-10 production. Nat. Med. 2009, 15, 42–49. [Google Scholar] [CrossRef] [Green Version]
- Ylostalo, J.H.; Bartosh, T.J.; Coble, K.; Prockop, D.J. Human mesenchymal stem/stromal cells cultured as spheroids are self-activated to produce prostaglandin E2 that directs stimulated macrophages into an anti-inflammatory phenotype. Stem Cells 2012, 30, 2283–2296. [Google Scholar] [CrossRef] [Green Version]
- Plotnikov, E.Y.; Pulkova, N.V.; Pevzner, I.B.; Zorova, L.D.; Silachev, D.N.; Morosanova, M.A.; Sukhikh, G.T.; Zorov, D.B. Inflammatory pre-conditioning of mesenchymal multipotent stromal cells improves their immunomodulatory potency in acute pyelonephritis in rats. Cytotherapy 2013, 15, 679–689. [Google Scholar] [CrossRef]
- Spiller, K.L.; Koh, T.J. Macrophage-based therapeutic strategies in regenerative medicine. Adv. Drug Deliv. Rev. 2017, 122, 74–83. [Google Scholar] [CrossRef]
- Spiller, K.L.; Nassiri, S.; Witherel, C.E.; Anfang, R.R.; Ng, J.; Nakazawa, K.R.; Yu, T.; Vunjak-Novakovic, G. Sequential delivery of immunomodulatory cytokines to facilitate the M1-to-M2 transition of macrophages and enhance vascularization of bone scaffolds. Biomaterials 2015, 37, 194–207. [Google Scholar] [CrossRef] [Green Version]
- Wynn, T.A.; Vannella, K.M. Macrophages in tissue repair, regeneration, and fibrosis. Immunity 2016, 44, 450–462. [Google Scholar] [CrossRef] [Green Version]
- Freytes, D.O.; Kang, J.W.; Marcos-Campos, I.; Vunjak-Novakovic, G. Macrophages modulate the viability and growth of human mesenchymal stem cells. J. Cell. Biochem. 2013, 114, 220–229. [Google Scholar] [CrossRef]
- Leor, J.; Rozen, L.; Zuloff-Shani, A.; Feinberg, M.S.; Amsalem, Y.; Barbash, I.M.; Kachel, E.; Holbova, R.; Mardor, Y.; Daniels, D.; et al. Ex vivo activated human macrophages improve healing, remodeling, and function of the infarcted heart. Circulation 2006, 114 (Suppl. 1), I94–I100. [Google Scholar] [CrossRef] [PubMed] [Green Version]
- Gensel, J.C.; Zhang, B. Macrophage activation and its role in repair and pathology after spinal cord injury. Brain Res. 2015, 1619, 1–11. [Google Scholar] [CrossRef] [PubMed] [Green Version]
- Didangelos, A.; Iberl, M.; Vinsland, E.; Bartus, K.; Bradbury, E.J. Regulation of IL-10 by Chondroitinase ABC Promotes a Distinct Immune Response following Spinal Cord Injury. J. Neurosci. 2014, 34, 16424–16432. [Google Scholar] [CrossRef] [PubMed]
- Zhang, Q.Z.; Su, W.R.; Shi, S.H.; Wilder-Smith, P.; Xiang, A.P.; Wong, A.; Nguyen, A.L.; Kwon, C.W.; Le, A.D. Human gingiva-derived mesenchymal stem cells elicit polarization of m2 macrophages and enhance cutaneous wound healing. Stem Cells 2010, 28, 1856–1868. [Google Scholar] [CrossRef] [PubMed] [Green Version]
- Arnold, L.; Henry, A.; Poron, F.; Baba-Amer, Y.; Van Rooijen, N.; Plonquet, A.; Gherardi, R.K.; Chazaud, B. Inflammatory monocytes recruited after skeletal muscle injury switch into antiinflammatory macrophages to support myogenesis. J. Exp. Med. 2007, 204, 1057–1069. [Google Scholar] [CrossRef] [PubMed] [Green Version]
- Li, J.; Yang, K.Y.; Tam, R.C.Y.; Chan, V.W.; Lan, H.Y.; Hori, S.; Zhou, B.; Lui, K.O. Regulatory T-cells regulate neonatal heart regeneration by potentiating cardiomyocyte proliferation in a paracrine manner. Theranostics 2019, 9, 4324–4341. [Google Scholar] [CrossRef] [PubMed]
- Li, J.; Liang, C.; Yang, K.Y.; Huang, X.; Han, M.Y.; Li, X.; Chan, V.W.; Chan, K.S.; Liu, D.; Huang, Z.P.; et al. Specific ablation of CD4+ T-cells promotes heart regeneration in juvenile mice. Theranostics 2020, 10, 8018–8035. [Google Scholar] [CrossRef]
- Liang, C.; Yang, K.Y.; Chan, V.W.; Li, X.; Fung, T.H.W.; Wu, Y.; Tian, X.Y.; Huang, Y.; Qin, L.; Lau, J.Y.W.; et al. CD8+ T-cell plasticity regulates vascular regeneration in type-2 diabetes. Theranostics 2020, 10, 4217–4232. [Google Scholar] [CrossRef]
- Leung, O.M.; Li, J.; Li, X.; Chan, V.W.; Yang, K.Y.; Ku, M.; Ji, L.; Sun, H.; Waldmann, H.; Tian, X.Y.; et al. Regulatory T Cells Promote Apelin-Mediated Sprouting Angiogenesis in Type 2 Diabetes. Cell Rep. 2018, 24, 1610–1626. [Google Scholar] [CrossRef] [Green Version]
- Ferrara, N.; Alitalo, K. Clinical applications of angiogenic growth factors and their inhibitors. Nat. Med. 1999, 5, 1359–1364. [Google Scholar]
- Klagsbrun, M.; Moses, M.A. Molecular angiogenesis. Chem. Biol. 1999, 6, R217–R224. [Google Scholar] [CrossRef] [Green Version]
- Carmeliet, P. Mechanisms of angiogenesis and arteriogenesis. Nat. Med. 2000, 6, 389–395. [Google Scholar] [CrossRef] [PubMed]
- Lutton, C.; Young, Y.W.; Williams, R.; Meedeniya, A.C.; Mackay-Sim, A.; Goss, B. Combined VEGF and PDGF Treatment Reduces Secondary Degeneration after Spinal Cord Injury. J. Neurotrauma 2012, 29, 957–970. [Google Scholar] [CrossRef] [Green Version]
- Kleinheinz, J.; Stratmann, U.; Joos, U.; Wiesmann, H.-P. VEGF-Activated Angiogenesis during Bone Regeneration. J. Oral Maxillofac. Surg. 2005, 63, 1310–1316. [Google Scholar] [CrossRef] [PubMed]
- Augustin, H.G.; Koh, G.Y.; Thurston, G.; Alitalo, K. Control of vascular morphogenesis and homeostasis through the angiopoietin–Tie system. Nat. Rev. Mol. Cell Biol. 2009, 10, 165–177. [Google Scholar] [CrossRef]
- Coffelt, S.B.; Tal, A.O.; Scholz, A.; De Palma, M.; Patel, S.; Urbich, C.; Biswas, S.K.; Murdoch, C.; Plate, K.H.; Reiss, Y.; et al. Angiopoietin-2 regulates gene expression in TIE2-expressing monocytes and augments their inherent proangiogenic functions. Cancer Res. 2010, 70, 5270–5280. [Google Scholar] [CrossRef] [Green Version]
- Xin, X.; Yang, S.; Ingle, G.; Zlot, C.; Rangell, L.; Kowalski, J.; Schwall, R.; Ferrara, N.; Gerritsen, M.E. Hepatocyte Growth Factor Enhances Vascular Endothelial Growth Factor-Induced Angiogenesis in Vitro and in Vivo. Am. J. Pathol. 2001, 158, 1111–1120. [Google Scholar] [CrossRef] [Green Version]
- Kitamura, K.; Iwanami, A.; Nakamura, M.; Yamane, J.; Watanabe, K.; Suzuki, Y.; Miyazawa, D.; Shibata, S.; Funakoshi, H.; Miyatake, S.; et al. Hepatocyte growth factor promotes endogenous repair and functional recovery after spinal cord injury. J. Neurosci. Res. 2007, 85, 2332–2342. [Google Scholar] [CrossRef]
- Aoki, M.; Morishita, R.; Taniyama, Y.; Kida, I.; Moriguchi, A.; Matsumoto, K.; Nakamura, T.; Kaneda, Y.; Higaki, J.; Ogihara, T. Angiogenesis induced by hepatocyte growth factor in non-infarcted myocardium and infarcted myocardium: Up-regulation of essential transcription factor for angiogenesis, ets. Gene Ther. 2000, 7, 417–427. [Google Scholar] [CrossRef] [Green Version]
- Xiao, N. Neurotrophic factors: Promising candidates in tissue regeneration. Neural Regen. Res. 2016, 11, 735. [Google Scholar] [CrossRef]
- Micera, A.; Lambiase, A.; Stampachiacchiere, B.; Bonini, S.; Levi-Schaffer, F. Nerve growth factor and tissue repair remodeling: trkANGFR and p75NTR, two receptors one fate. Cytokine Growth Factor Rev. 2007, 18, 245–256. [Google Scholar] [CrossRef] [PubMed]
- Micera, A.; Vigneti, E.; Pickholtz, D.; Reich, R.; Pappo, O.; Bonini, S.; Maquart, F.X.; Aloe, L.; Levi-Schaffer, F. Nerve growth factor displays stimulatory effects on human skin and lung fibroblasts, demonstrating a direct role for this factor in tissue repair. Proc. Natl. Acad. Sci. USA 2001, 98, 6162–6167. [Google Scholar] [CrossRef] [PubMed] [Green Version]
- Wang, Z.; Li, S.; Wang, Y.; Zhang, X.; Chen, L.; Sun, D. GDNF enhances the anti-inflammatory effect of human adipose-derived mesenchymal stem cell-based therapy in renal interstitial fibrosis. Stem Cell Res. 2019, 41, 101605. [Google Scholar] [PubMed]
- Mitsiadis, T.A.; Magloire, H.; Pagella, P. Nerve growth factor signalling in pathology and regeneration of human teeth. Sci. Rep. 2017, 7, 1327. [Google Scholar] [CrossRef] [PubMed]
- Kawamoto, K.; Matsuda, H. Nerve growth factor and wound healing. Prog. Brain Res. 2004, 146, 369–384. [Google Scholar]
- Lewis, M.E.; Neff, N.T.; Contreras, P.C.; Stong, D.B.; Oppenheim, R.W.; Grebow, P.E.; Vaught, J.L. Insulin-like Growth Factor-I: Potential for Treatment of Motor Neuronal Disorders. Exp. Neurol. 1993, 124, 73–88. [Google Scholar] [CrossRef]
- Lisse, T.S.; Sharma, M.; Vishlaghi, N.; Pullagura, S.R.; Braun, R.E. GDNF promotes hair formation and cutaneous wound healing by targeting bulge stem cells. NPJ Regen. Med. 2020, 5, 1–15. [Google Scholar] [CrossRef]
- Gulhati, P.; Bowen, K.A.; Liu, J.; Stevens, P.D.; Rychahou, P.G.; Chen, M.; Lee, E.Y.; Weiss, H.L.; O’Connor, K.L.; Gao, T.; et al. mTORC1 and mTORC2 Regulate EMT, Motility, and Metastasis of Colorectal Cancer via RhoA and Rac1 Signaling Pathways. Cancer Res. 2011, 71, 3246–3256. [Google Scholar] [CrossRef] [Green Version]
- Squarize, C.H.; Castilho, R.M.; Bugge, T.H.; Gutkind, J.S. Accelerated wound healing by mTOR activation in genetically defined mouse models. PLoS ONE 2010, 5, e10643. [Google Scholar] [CrossRef]
- Fathke, C.; Wilson, L.; Shah, K.; Kim, B.; Hocking, A.M.; Moon, R.T.; Isik, F. Wnt signaling induces epithelial differentiation during cutaneous wound healing. BMC Cell Biol. 2006, 7, 4. [Google Scholar] [CrossRef] [Green Version]
- Holland, J.D.; Klaus, A.; Garratt, A.N.; Birchmeier, W. Wnt signaling in stem and cancer stem cells. Curr. Opin. Cell Biol. 2013, 25, 254–264. [Google Scholar] [CrossRef] [PubMed]
- Whyte, J.L.; Smith, A.A.; Liu, B.; Manzano, W.R.; Evans, N.D.; Dhamdhere, G.R.; Fang, M.Y.; Chang, H.Y.; Oro, A.E.; Helms, J.A. Augmenting endogenous Wnt signaling improves skin wound healing. PLoS ONE 2013, 8, e76883. [Google Scholar] [CrossRef] [PubMed] [Green Version]
- Herman, P.E.; Papatheodorou, A.; Bryant, S.A.; Waterbury, C.K.M.; Herdy, J.R.; Arcese, A.A.; Buxbaum, J.D.; Smith, J.J.; Morgan, J.R.; Bloom, O. Highly conserved molecular pathways, including Wnt signaling, promote functional recovery from spinal cord injury in lampreys. Sci. Rep. 2018, 8, 742. [Google Scholar] [CrossRef] [PubMed] [Green Version]
- Haggerty, A.E.; Maldonado-Lasunción, I.; Oudega, M. Biomaterials for revascularization and immunomodulation after spinal cord injury. Biomed. Mater. 2018, 13, 044105. [Google Scholar] [CrossRef] [Green Version]
- Kodelja, V.; Müller, C.; Tenorio, S.; Schebesch, C.; Orfanos, C.E.; Goerdt, S. Differences in angiogenic potential of classically vs alternatively activated macrophages. Immunobiology 1997, 197, 478–493. [Google Scholar] [CrossRef]
- Zajac, E.; Schweighofer, B.; Kupriyanova, T.A.; Juncker-Jensen, A.; Minder, P.; Quigley, J.P.; Deryugina, E.I. Angiogenic capacity of M1- and M2-polarized macrophages is determined by the levels of TIMP-1 complexed with their secreted proMMP-9. Blood 2013, 122, 4054–4067. [Google Scholar] [CrossRef] [Green Version]
- Fantin, A.; Vieira, J.M.; Gestri, G.; Denti, L.; Schwarz, Q.; Prykhozhij, S.; Peri, F.; Wilson, S.W.; Ruhrberg, C. Tissue macrophages act as cellular chaperones for vascular anastomosis downstream of VEGF-mediated endothelial tip cell induction. Blood 2010, 116, 829–840. [Google Scholar] [CrossRef] [Green Version]
- Lucas, T.; Waisman, A.; Ranjan, R.; Roes, J.; Krieg, T.; Müller, W.; Roers, A.; Eming, S.A. Differential Roles of Macrophages in Diverse Phases of Skin Repair. J. Immunol. 2010, 184, 3964–3977. [Google Scholar] [CrossRef] [Green Version]
- Sunderkötter, C.; Steinbrink, K.; Goebeler, M.; Bhardwaj, R.; Sorg, C. Macrophages and angiogenesis. J. Leukoc. Biol. 1994, 55, 410–422. [Google Scholar] [CrossRef]
- Sivanathan, K.N.; Rojas-Canales, D.; Grey, S.T.; Gronthos, S.; Coates, P.T. Transcriptome Profiling of IL-17A Preactivated Mesenchymal Stem Cells: A Comparative Study to Unmodified and IFN-γModified Mesenchymal Stem Cells. Stem Cells Int. 2017, 2017, 1–16. [Google Scholar] [CrossRef] [Green Version]
- Taddei, M.L.; Giannoni, E.; Fiaschi, T.; Chiarugi, P. Anoikis: An emerging hallmark in health and diseases. J. Pathol. 2012, 226, 380–393. [Google Scholar] [CrossRef] [PubMed]
- Michel, J.-B. Anoikis in the cardiovascular system: Known and unknown extracellular mediators. Arterioscler. Thromb. Vasc. Biol. 2003, 23, 2146–2154. [Google Scholar] [CrossRef] [Green Version]
- Ritfeld, G.J.; Rauck, B.M.; Novosat, T.L.; Park, D.; Patel, P.; Roos, R.A.; Wang, Y.; Oudega, M. The effect of a polyurethane-based reverse thermal gel on bone marrow stromal cell transplant survival and spinal cord repair. Biomaterials 2014, 35, 1924–1931. [Google Scholar] [CrossRef] [PubMed] [Green Version]
- Blocki, A.; Beyer, S.; Dewavrin, J.-Y.; Goralczyk, A.; Wang, Y.; Peh, P.; Yingting, W.; Moonshi, S.S.; Vuddagiri, S.; Raghunath, M.; et al. Microcapsules engineered to support mesenchymal stem cell (MSC) survival and proliferation enable long-term retention of MSCs in infarcted myocardium. Biomaterials 2015, 53, 12–24. [Google Scholar] [CrossRef] [PubMed]
- Cheung, T.S.; Galleu, A.; von Bonin, M.; Bornhäuser, M.; Dazzi, F. Apoptotic mesenchymal stromal cells induce prostaglandin E2 in monocytes: Implications for the monitoring of mesenchymal stromal cell activity. Haematologica 2019, 104, e438. [Google Scholar] [CrossRef] [Green Version]
- Galleu, A.; Riffo-Vasquez, Y.; Trento, C.; Lomas, C.; Dolcetti, L.; Cheung, T.S.; Von Bonin, M.; Barbieri, L.; Halai, K.; Ward, S.; et al. Apoptosis in mesenchymal stromal cells induces in vivo recipient-mediated immunomodulation. Sci. Transl. Med. 2017, 9, eaam7828. [Google Scholar] [CrossRef] [Green Version]
- Trapnell, C.; Pachter, L.; Salzberg, S.L. TopHat: Discovering splice junctions with RNA-Seq. Bioinformatics 2009, 25, 1105–1111. [Google Scholar] [CrossRef]
- Young, M.D.; Wakefield, M.J.; Smyth, G.K.; Oshlack, A. Gene ontology analysis for RNA-seq: Accounting for selection bias. Genome Biol. 2010, 11, R14. [Google Scholar] [CrossRef] [Green Version]
Publisher’s Note: MDPI stays neutral with regard to jurisdictional claims in published maps and institutional affiliations. |
© 2021 by the authors. Licensee MDPI, Basel, Switzerland. This article is an open access article distributed under the terms and conditions of the Creative Commons Attribution (CC BY) license (http://creativecommons.org/licenses/by/4.0/).
Share and Cite
Maldonado-Lasunción, I.; O’Neill, N.; Umland, O.; Verhaagen, J.; Oudega, M. Macrophage-Derived Inflammation Induces a Transcriptome Makeover in Mesenchymal Stromal Cells Enhancing Their Potential for Tissue Repair. Int. J. Mol. Sci. 2021, 22, 781. https://doi.org/10.3390/ijms22020781
Maldonado-Lasunción I, O’Neill N, Umland O, Verhaagen J, Oudega M. Macrophage-Derived Inflammation Induces a Transcriptome Makeover in Mesenchymal Stromal Cells Enhancing Their Potential for Tissue Repair. International Journal of Molecular Sciences. 2021; 22(2):781. https://doi.org/10.3390/ijms22020781
Chicago/Turabian StyleMaldonado-Lasunción, Inés, Nick O’Neill, Oliver Umland, Joost Verhaagen, and Martin Oudega. 2021. "Macrophage-Derived Inflammation Induces a Transcriptome Makeover in Mesenchymal Stromal Cells Enhancing Their Potential for Tissue Repair" International Journal of Molecular Sciences 22, no. 2: 781. https://doi.org/10.3390/ijms22020781