Article

Effect of Temperature Changes on the Vibration Transmissibility of XPE and PE Packaging Cushioning Material

Department of Logistics and Forwarding, Széchenyi István University, Egyetem sqr 1, 9026 Győr, Hungary
*
Author to whom correspondence should be addressed.
Appl. Sci. 2021, 11(2), 482; https://doi.org/10.3390/app11020482
Submission received: 9 December 2020 / Revised: 30 December 2020 / Accepted: 4 January 2021 / Published: 6 January 2021
(This article belongs to the Section Acoustics and Vibrations)

Abstract

:
Polyethylene (PE) and its variations are among the most traditional materials used for cushioning in packaging systems. The role of these materials is to prevent damages during handling and distribution processes from physical events such as vibration stress. This study presents new results on the characterization of properties of PE and XPE (cross-linked polyethylene) packaging materials, which have significant relevance as a protective mechanism due to their vibration transmissibility and frequency curve properties. The main goal of this study is the evaluation of vibration transmissibility of PE and XPE cushion material at varied real temperature and static load conditions through a series of experiments using a vibration tester and climate chamber to determine the peak frequencies, vibration transmissibility, and damping ratios. The results can be used by engineers in the package-design process, and can be useful in different distribution conditions. Three different kinds of static loads and a 0.5 oct/min sine sweep of vibration test were used to find the peak frequencies and vibration transmissibility at −20 °C, 0 °C, 20 °C and 40 °C to estimate the damping ratios. The results provided a better understanding of the materials and can assist in the design of suitable protective packaging systems.

1. Introduction

Physical events such as vibration are generated by vehicles and handling equipment during distribution in different kinds of temperature conditions. Therefore, packaging has a particular importance in avoiding or dampening those vibration stresses, which can affect the integrity of packaging and its protective mechanism, as well as product properties. Furthermore, sensitive products like electrical or medical devices, or porcelain and glass products, require a thorough and professional implementation of the packaging material used in package-design processes. One of the most important aims of this process is to find cost-effective materials that offer enough protection of the product against the hazards of supply chains. Cushioning materials account for the balance between product ruggedness and distribution hazards. The role of the materials is to absorb the energy of impact shock or the dynamic oscillation of vibration.
Generally, the appropriate material and placement of cushioning material used in a packaging system within a container or parcel requires a necessary isolation between the packaged item (Figure 1). M1 is the critical element of the product (M2) that can be damaged easily under impact loading. This component should be an important focus during the package-design process. The primary goal of the container (M3) is to store and hold together the product and inner packaging during the distribution. The secondary goal of the container is to absorb the kinetic energy of impacts during transportation, but this is neglected in the package-design process [1]. The protection element in the packaging system, which is known as a package cushion, usually is constructed using plastic foams [2,3]. The packaging material usually used for cushioning is a lightweight, inexpensive material that has high strength-to-weight and stiffness-to-weight ratios, and has favorable cushioning characteristics and vibration transmissibility. These materials, usually plastic foam or paper packaging, have been widely applied in secondary (master) and tertiary (transportation) packaging to protect products such as medical or electronic devices and instruments, or fragile products [4,5,6].
In the design of protective cushions for packaged-product systems, the most widely accepted method for the development of optimized systems is the Six-Step method, which includes the following steps [7]:
  • Define the shipping environment
The damage potential must be evaluated and quantified based on recording the real shipping environment during the transportation of a test package, or on an estimation.
2.
Define product fragility
During this step, the natural ability of the product to withstand shocks and vibrations from the transportation environment should be quantified.
3.
Improve the robustness of the product
In some cases, the packaged-product system can be made more economical through a redesign to increase the robustness of the product, which can reduce packaging costs.
4.
Evaluate the performance of cushioning material
For optimal packaging design, the vibration transmissibility and shock attenuation of the cushion material must be considered. Transmissibility amplification/attenuation plots and cushion curves can be developed and applied to acquire this information.
5.
Packaging design
In this step, all previously collected information about the shipping environment, product, and cushioning material are used to create a packaging design.
6.
Test and validate the packaged-product system
The prototype packaged-product system is tested to ensure that all design goals were achieved.
This technique takes into the consideration the requirements of cushioning material for protection from shocks and vibration resonance. During this process, different aspects are considered by packaging professionals. The thickness of cushioning materials and the load-bearing area should offer enough protection against the different dynamic inputs to minimize the cost of product damage. However, these factors should be also minimized to keep the package costs and volumes down.
The cushion characteristics of a polymer foam are affected by their mechanical properties. Based on a study by Gibson and Ashby [8], these are related to the properties of the polymer’s cell wall and cell geometry and can be understood in terms of bending, elastic buckling, and plastic collapse. New simple formulas and description of a large data for mechanical properties of polymeric foams were developed. Maiti et al. [9] constructed mechanism-mode maps and used them to create energy-absorption diagrams for foams. The energy of the impact that must be absorbed by the foam can be determined by Equation (1):
W = 0 ε 0 σ   d ε   +   ε 0 ε * σ ( ε )   d ε ,
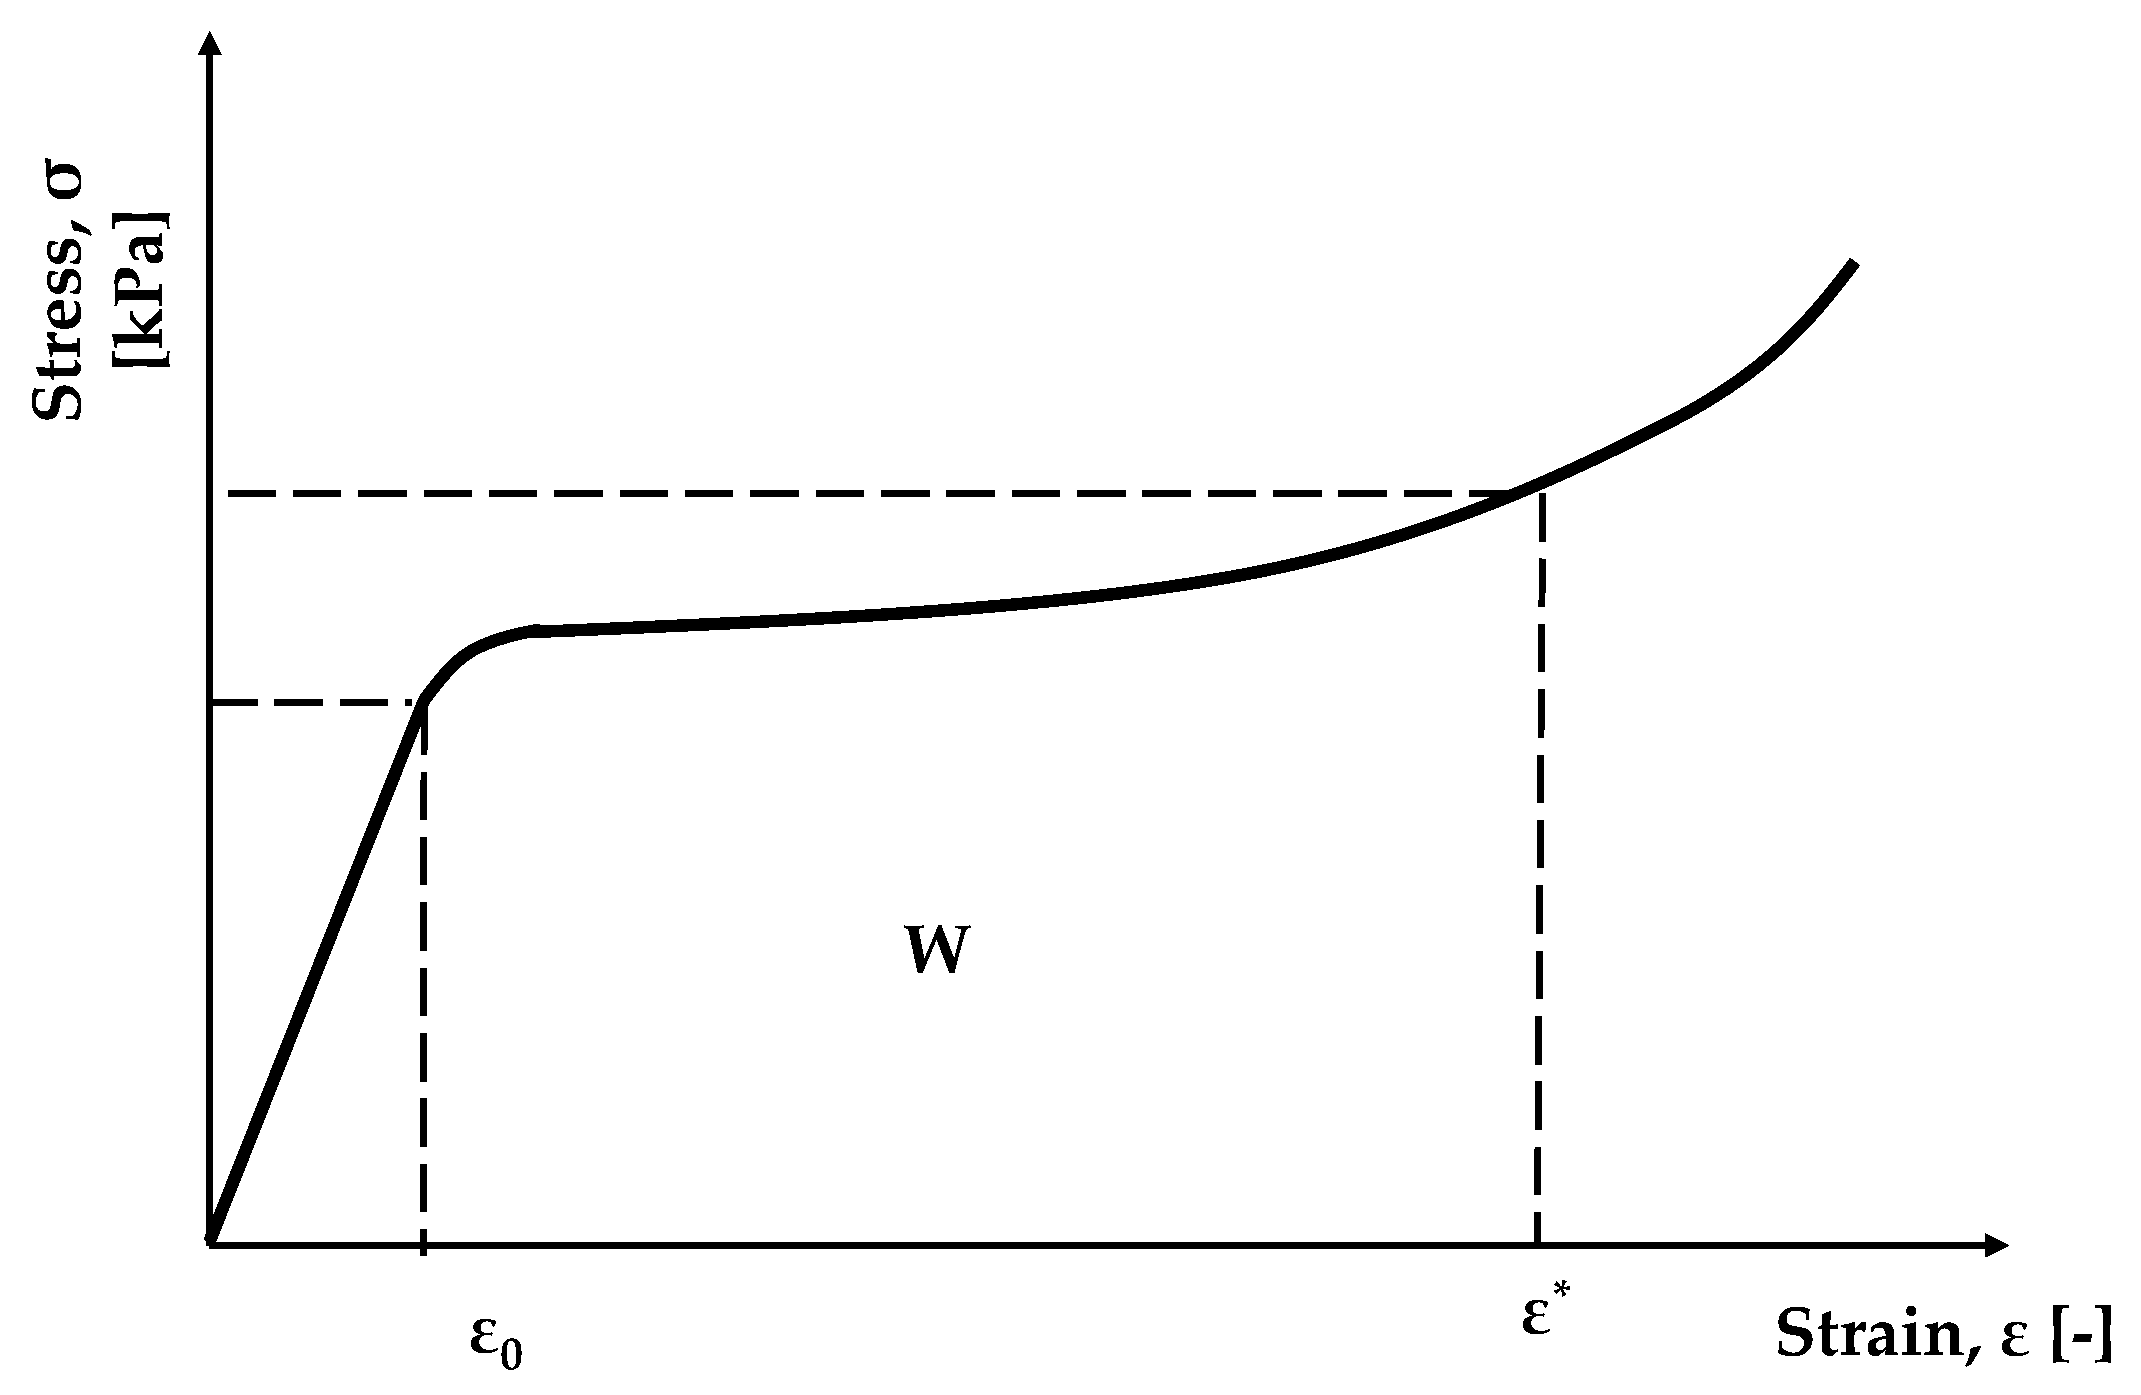
where W is the energy absorbed per unit volume (J/m3), ε 0 is the strain at the linear-elastic limit, ε is the nominal compressive strain, ε * is the strain, and σ is the stress. Figure 2 shows a general stress–strain curve for a foam [9]. The optimum foam material and density can be determined using energy-absorption diagrams. Two examples of the application of this method can be seen in the study by Gibson [10].
The modelization of stress–strain relation and the calculation of energy absorption and its efficiency for different cushion materials have been studied [11,12,13,14,15,16,17]. Another method used in cushion design is the Janssen factor, which is the ratio of the actual peak acceleration of the actual foam divided by the acceleration of an ideal foam [18].
Zhang and Ashby [19] developed packaging-selection diagrams with greater generality and simplicity than those developed using the Janssen factor or energy-absorption diagrams. Their diagrams can be used to narrow down the range of densities and choices of foams to be tested during the determining process for the cushion curves.
Cushion curves are mainly applied during the design of protective packaging both in the packaging industry and in the Six-Step method [7,19,20,21,22]. The performance properties of cushioning materials against shock or vibration inputs are represented in these curves. A large amount of experimental data is required to determine these, as new curves must be developed for each drop height, and every curve contains values for different thicknesses and static stresses of the loading [19].
Many researchers have developed methods for designing cushion curves that are less time-consuming and more cost-effective [23]. These studies were mostly based on the use of static compressive stress–strain data [24,25,26], dynamic stress vs. energy curves [27,28,29,30,31,32,33] and strain and strain rate (DF, or dynamic factor) [34,35]. Gilbert and Batt developed an impact oscillator model that is able to predict a shock pulse’s shape, duration, and amplitude at various static stresses and drop heights [36]. FEA (finite element analysis) also can be applied to evaluate the performance of cushioning materials [37,38].
Kuang et al. [39] and Ji et al. [40] studied the dropping shock response of a tangent nonlinear packaging system and developed the homotopy perturbation method using an auxiliary term and Li–He’s modified homotopy perturbation method coupled with the energy method.
Ge and Rice [41] and Ge et al. [42] investigated the damping characteristics of foams, which are relatively unfamiliar to the packaging industry compared to the cushion curve. Ref. [41] proposed a contact force law based on a nonlinear viscoelastic model for modeling impacts of a cushion foam. In [42], the authors studied the damping properties of a 3D-printed photopolymer with Kelvin model due to impact loading.
The standardized method to obtain the cushioning characteristics of a specific material was described in the American Society for Testing and Materials [43,44].
In addition to shock events, vibration inputs to items also can be critical if their frequencies are the same or similar to the natural frequencies of the product or packaging. Cushioning must be offered protection from these inputs as well. Therefore, the cushioning material must attenuate vibration inputs at those frequencies or similar ones.
However, cushion curves cannot be applied in the prediction of the characterization of the frequency response of a given material, because they represent only static loading vs. shock experienced as the cushioning is impacted [45]. The packaging industry does not have a standard method for testing the designed frequency response of a cushioning material [45]. Developing a transmissibility curve is one of the possible ways to determine the frequency response of a given material [45]. Such a curve can be generated by using a sine sweep or random vibration inputs. The curve is limited to the sample parameter [46]. Several researchers have determined vibration transmissibility curves for different materials, but only in normal temperatures [4,47,48,49,50,51,52]. An application of a vibration-attenuation plot during the package-design process was shown by Kim et al. [52].
Sek et al. [53], White et al. [54], and Batt [45] developed different techniques to study and model the nonlinear effect of cushioning on the estimation of vibration transmissibility, but without investigating temperature changes. The lack of knowledge about the effect of temperature changes on dynamic packaging properties, including vibration transmissibility, limits these applications in designing protective packaging for products.
Despite the fact that mechanical properties of PE are affected by temperature, and packaged products encounter different temperature conditions (in extreme cases from −20 °C to 50 °C, according to McGee et al. [33]) in the distribution environment, limited published studies are available on the effect of temperature on cushioning designs.
Marcondes et al. [55], Szymanski [56], and McGee et al. [33] studied the effect of temperature on the shock properties. Marcondes et al. [55] also observed the effect of temperature on vibration transmissibility, but it was only applied during a preconditioning period, and was not used during testing. Furthermore, the study used random vibration signals, which are not a clear harmonic-generated motion, and it was only applied to normal PE foam and EPS (extruded polystyrene).
However, we could not find any published laboratory cushioning research that measured and analyzed the vibration transmissibility and damping ratios of XPE for package cushioning using different temperature and static-load conditions, or for PE material that applied temperature conditions during the entire measurement. Our study presents new measured and analyzed data that can help packaging engineers gain a better understanding of the characteristics of these materials, and to design appropriate protective packaging for sensitive goods.
The main goal of our study is to present the critical frequency bands and possible damping ratios of PE and XPE cushion material for cushioning. This paper also discusses the effect of temperature changes during vibration circumstances and gives relevant information for varied static loads. The data from this research can be compared to previous research that was performed for shock properties of PE materials. This new data can be a useful technical support for engineers in packaging design.
Our study provides more accurate details about the vibration transmissibility of plastic foams at different temperatures, and clearly shows the effect of temperature. A better understanding of the resonant frequencies of cushioning materials at different temperatures helps engineers to select an optimal design with regard to the natural frequency of product.

2. Materials and Method

2.1. Experimental Materials

Various materials can be used as cushioning, but generally the base classes can be defined as closed-cell and open-cell. The samples used for this study (PE and XPE) are closed-cell materials (Figure 3). The closed-cell foam structure was constructed by blowing an agent that decomposes at the fusion point of the plastic material, releasing gas bubbles during the process. All samples were supplied by Green Packaging Ltd. (Budapest, Hungary). The experimental materials used were XPE and PE foams with three different kinds of density. Two kinds of PE foam with densities of 25.25 kg/m3 (PE25 in this study) and 30.12 kg/m3 (PE30 in this study) were selected as experimental materials, and one more XPE foam with a density of 29.55 kg/m3 (XPE in this study). The only difference between the PE foams was the density. The samples used for measurements were cut into blocks with dimensions of 150 mm × 150 mm × 20 mm (length × width × thickness).

2.2. Method for Conditioning

Before each test, the test samples were preconditioned and maintained for 24 h at −20 °C, 0 °C, 20 °C, and 40 °C to ensure that they reached their equilibrium temperature. This temperature condition was maintained during the entire measurement process. An ANYVIB 600 C 10 climate chamber was used to combine the vibration test with the environmental conditions. The relevant specification of the equipment can be seen in Table 1.

2.3. Method for Static Load

Three static loads were selected for each material and temperature, since vibration transmissibility is influenced by static load [57]. Weighted concrete mass blocks were used as the static loads, which were placed on top of the test samples and then clamped. The three static loads were 3.488 kPa, 4.651 kPa, and 6.976 kPa.

2.4. Method for Vibration Transmissibility

The vibration transmissibility of materials for the cushioning of packages is generally described as the relationship between the vibration transmissibility and the peak frequency [57]. Transmissibility is a nondimensional ratio of the response acceleration amplitude of the packaged product in a steady-state forced vibration to the excitation acceleration amplitude [58]. Both magnification and transmissibility compare the output response to the forced vibration input, as shown in Equation (2):
M   =   1 1 ( f f f n ) 2   =   o u t p u t i n p u t ,
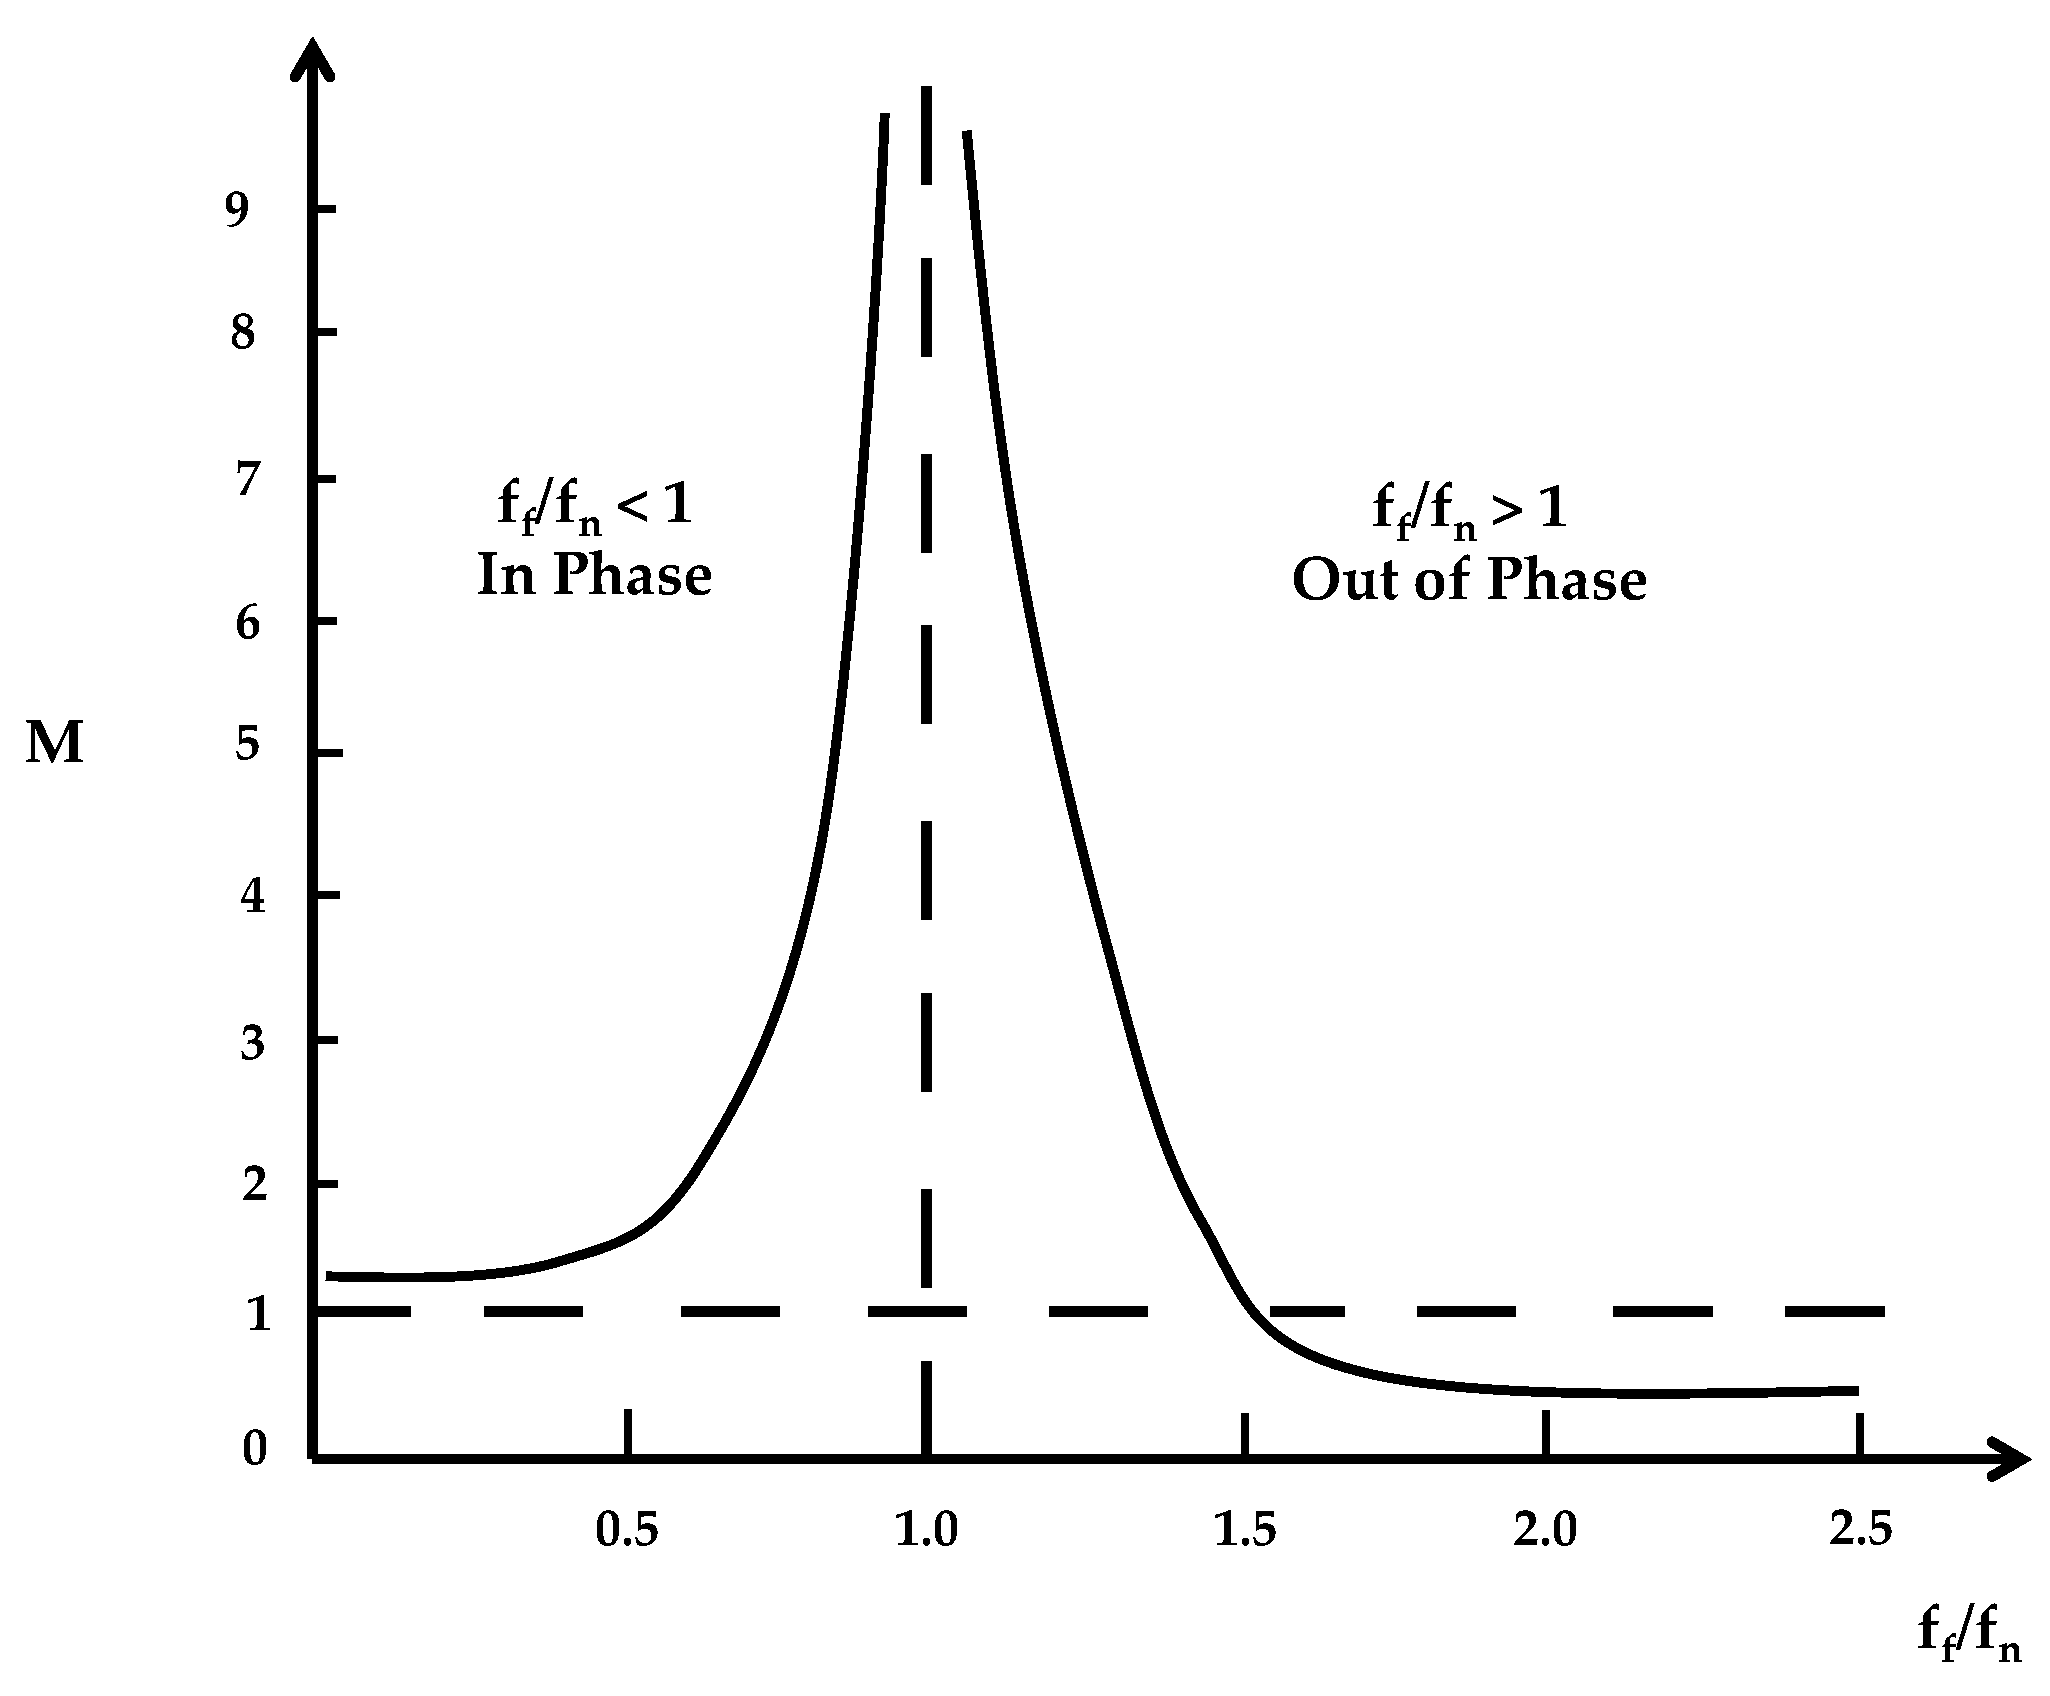
where M is the magnification factor, f f is the forcing frequency [Hz], and f n is the natural frequency [Hz]. Magnification of an undamped spring system is shown in Figure 4. When f f / f n equals 1, the value of M is the maximum (∞), revealing the resonance point.
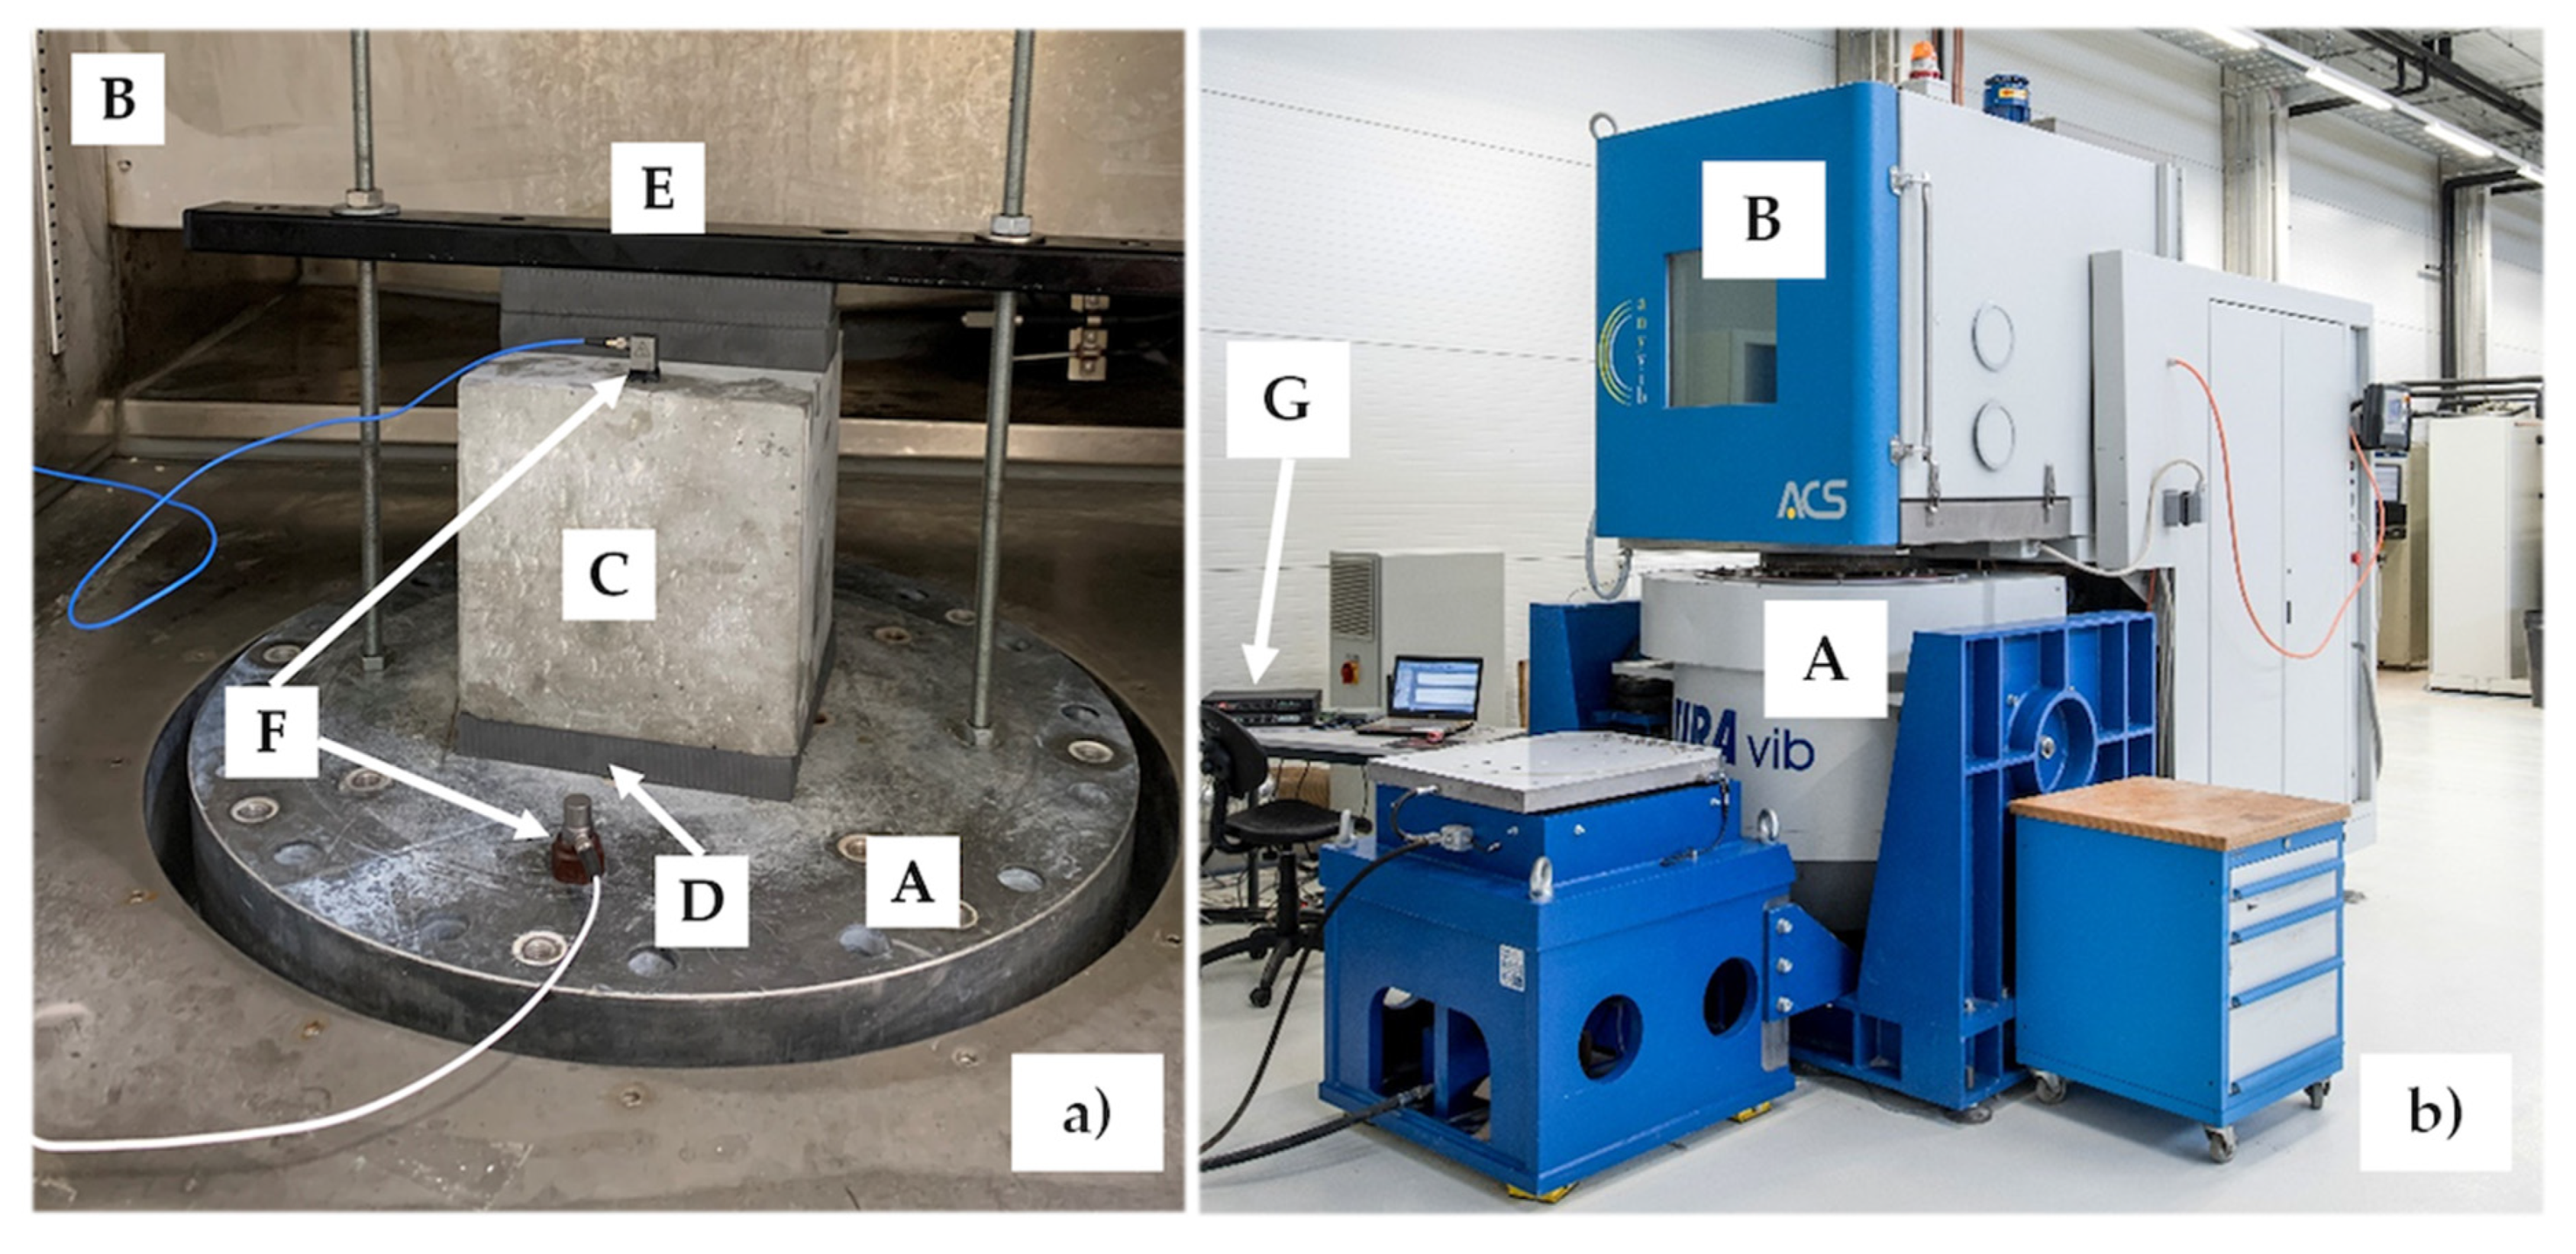
The test system (Figure 5) consisted of an electrodynamic vibration tester (TIRA TV59355/AIT-440; Figure 5b), a vibration testing controller and acquisition system (VR 9500), and VibrationView software. The relevant specifications of the equipment are shown in Table 1. The fixtures for the test are also shown in Figure 5. During the measurement process, each sample was placed in this test fixture, and the mass block was placed on top of the test specimen.
The vibration setup for each measurement was as follows: sine sweep 0.5 oct/min; amplitude 0.5 g (zero-to-peak); frequency band 3–300 Hz; sampling frequency 10,000 Hz. The reason for using this frequency band is that the most common and relative high amplitude vibration during distribution can be found between 3–300 Hz. This is also the band that is used in many vibration test standards for simulation circumstances [3]. The static load was adjusted by changing the blocks. One acceleration sensor was attached to the platform of the vibration head expander (inside the climate chamber) to control the excitation input, and another was placed on the mass block to measure the response acceleration. The measured acceleration records were analyzed and presented in the form of a vibration transmissibility and frequency curves. Following the series of tests, the vibration transmissibility and frequency curves at different static loads were evaluated. The numerical results for resonance frequency bands were naturally reported for this study.

2.5. Method for Estimation of Damping Ratio

The damping ratio was estimated by applying linear vibration theory with a single degree-of-freedom system with viscous damping by using Equations (5) and (6). The equation of motion is given by [47]:
m x ¨ + c x ˙   + k x   = c u ˙   + k u ,
where m is the mass of the moving object, c is the linear viscous damping coefficient, k is the linear elastic stiffness coefficient, and x and u are the response displacement and the excitation displacement, respectively. The transmissibility value ( T r ) for a linear spring-mass system with a single degree-of-freedom system with viscous damping was calculated using the following equation, a Fourier transformation of Equation (3) [46]:
T r   = 1   +   [ 2   ξ ( f f f n ) ] 2 [ 1 ( f f f n ) 2 ] 2   +   [ 2   ξ ( f f f n ) ] 2   ,  
where f f is the forcing frequency [Hz], f n is the natural frequency [Hz], and ξ is the damping ratio. When f f   f n , the damping ratio can be estimated using Equation (4) [47]:
ξ   =   1 2   ×   1 T r 2   1 ,
When T r   1 , the damping ratio can be estimated using Equation (5) [47]:
ξ   1 2 T r ,  
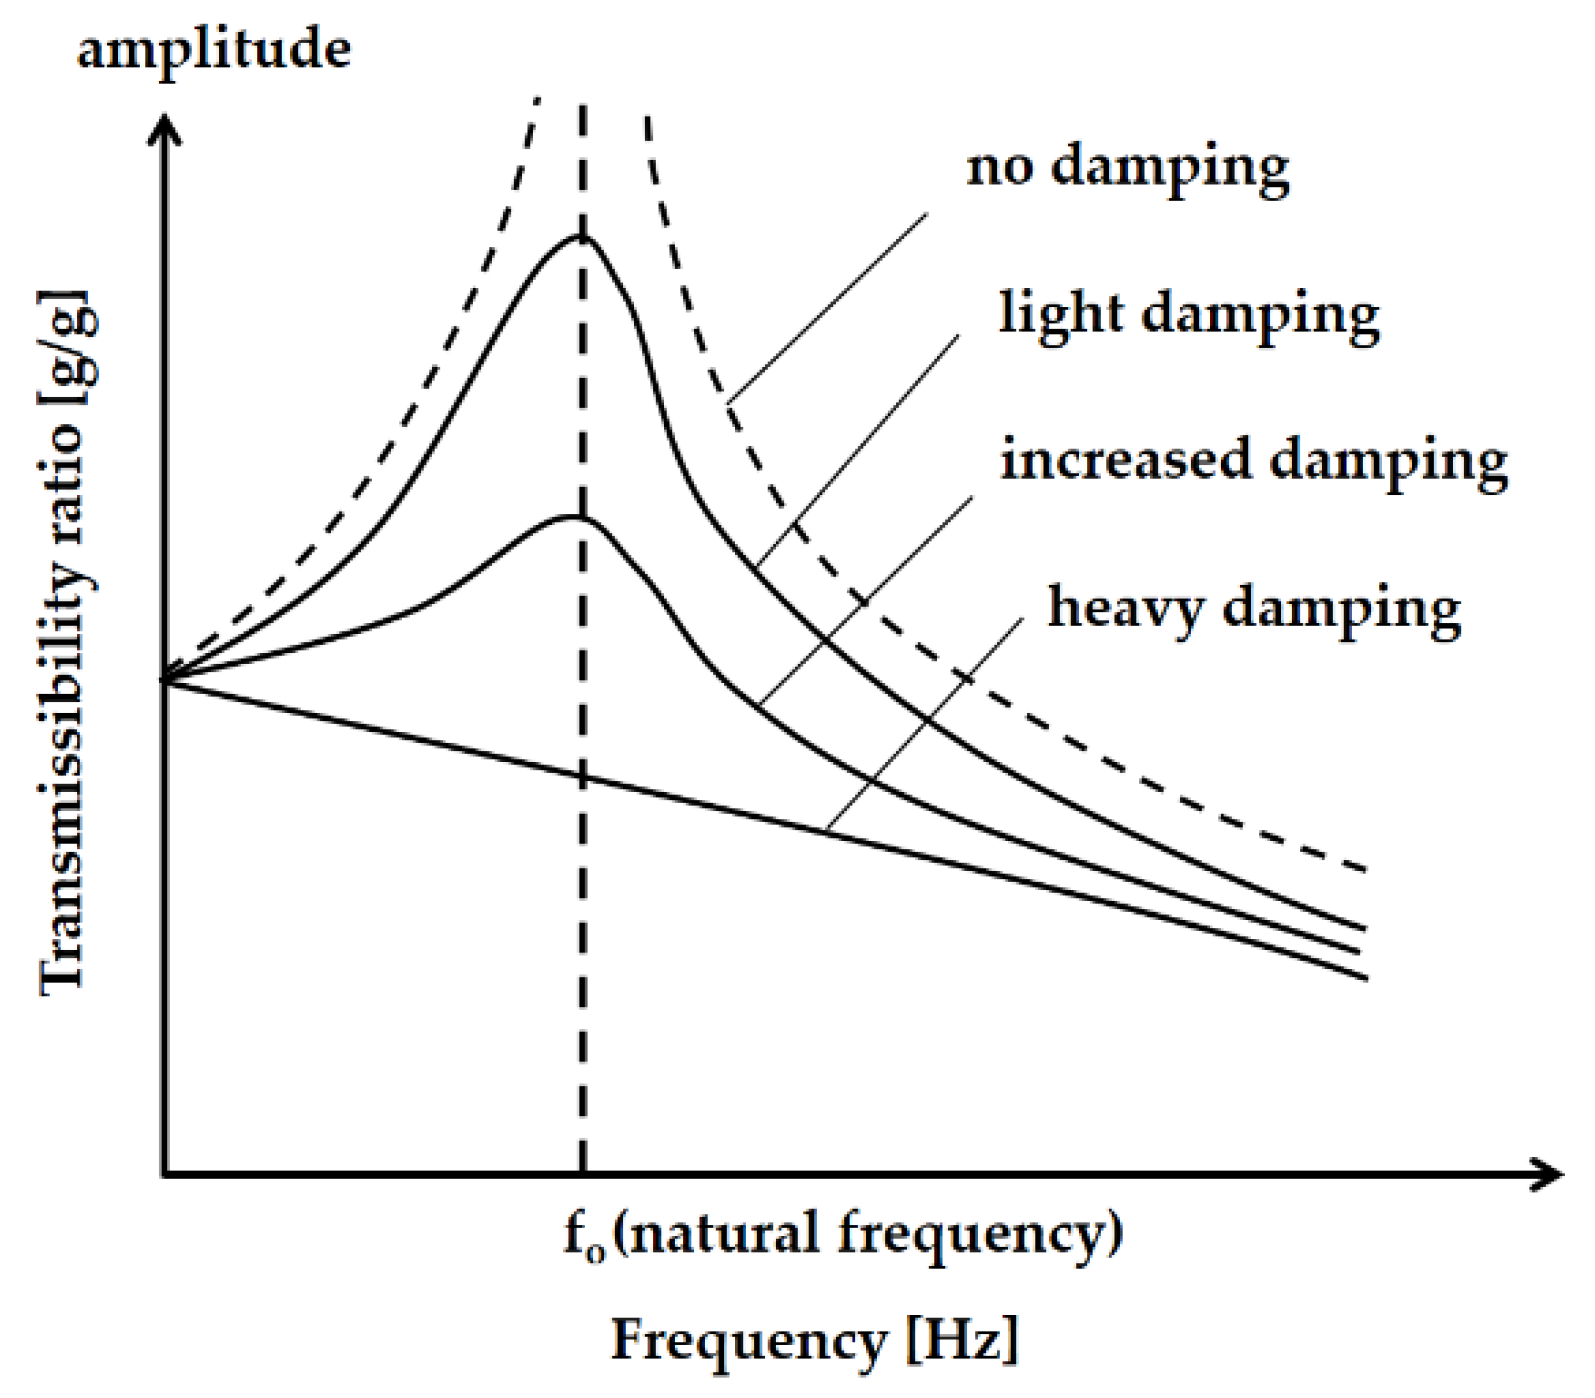
Transmissibility curves of damped systems are shown in Figure 6.
The evaluation of the effects of temperature on vibration transmission are arranged in sequence below:
  • Preparation of the samples and mass blocks (size, weight)
  • Conditioning of the elements (temperature, time)
  • Assembly of the measurement system (fixture, static stress)
  • Parameter setting and setup of the vibration measurement (frequency band, sweep rate, amplitude, frequency range)
  • Expression of the measured and calculated results (applied equations, units).

3. Results and Discussion

3.1. Experimental Results

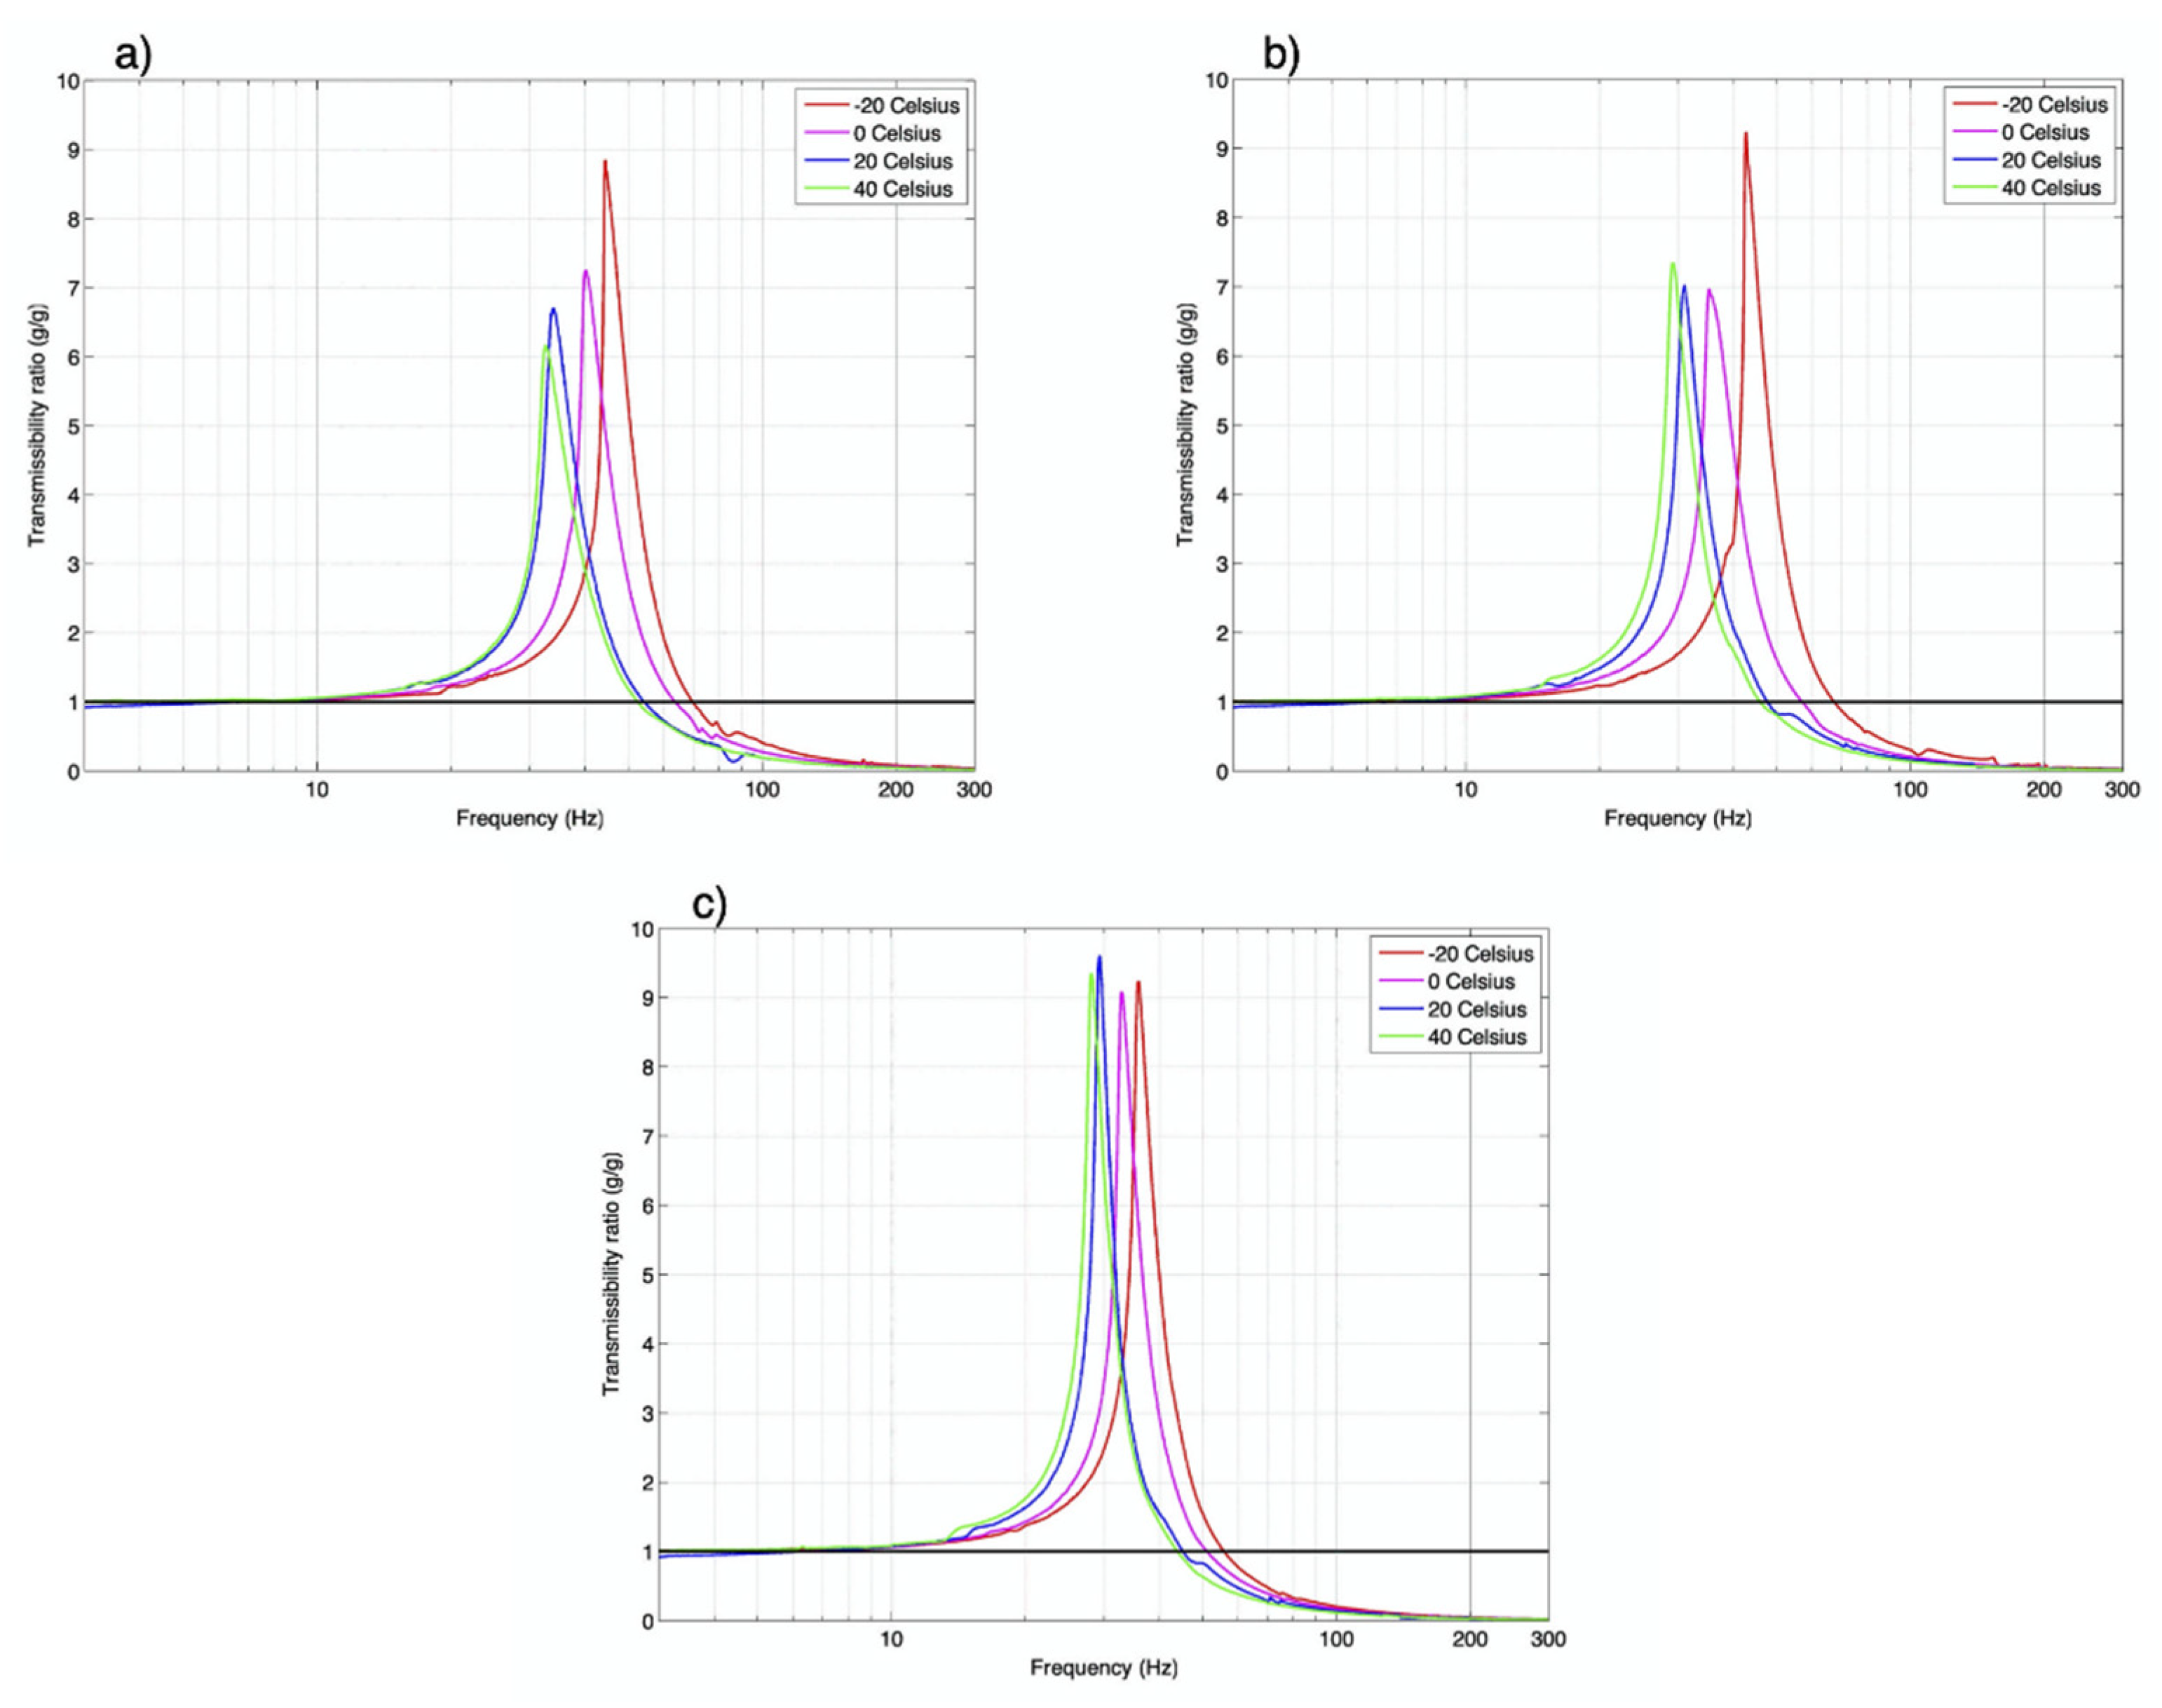
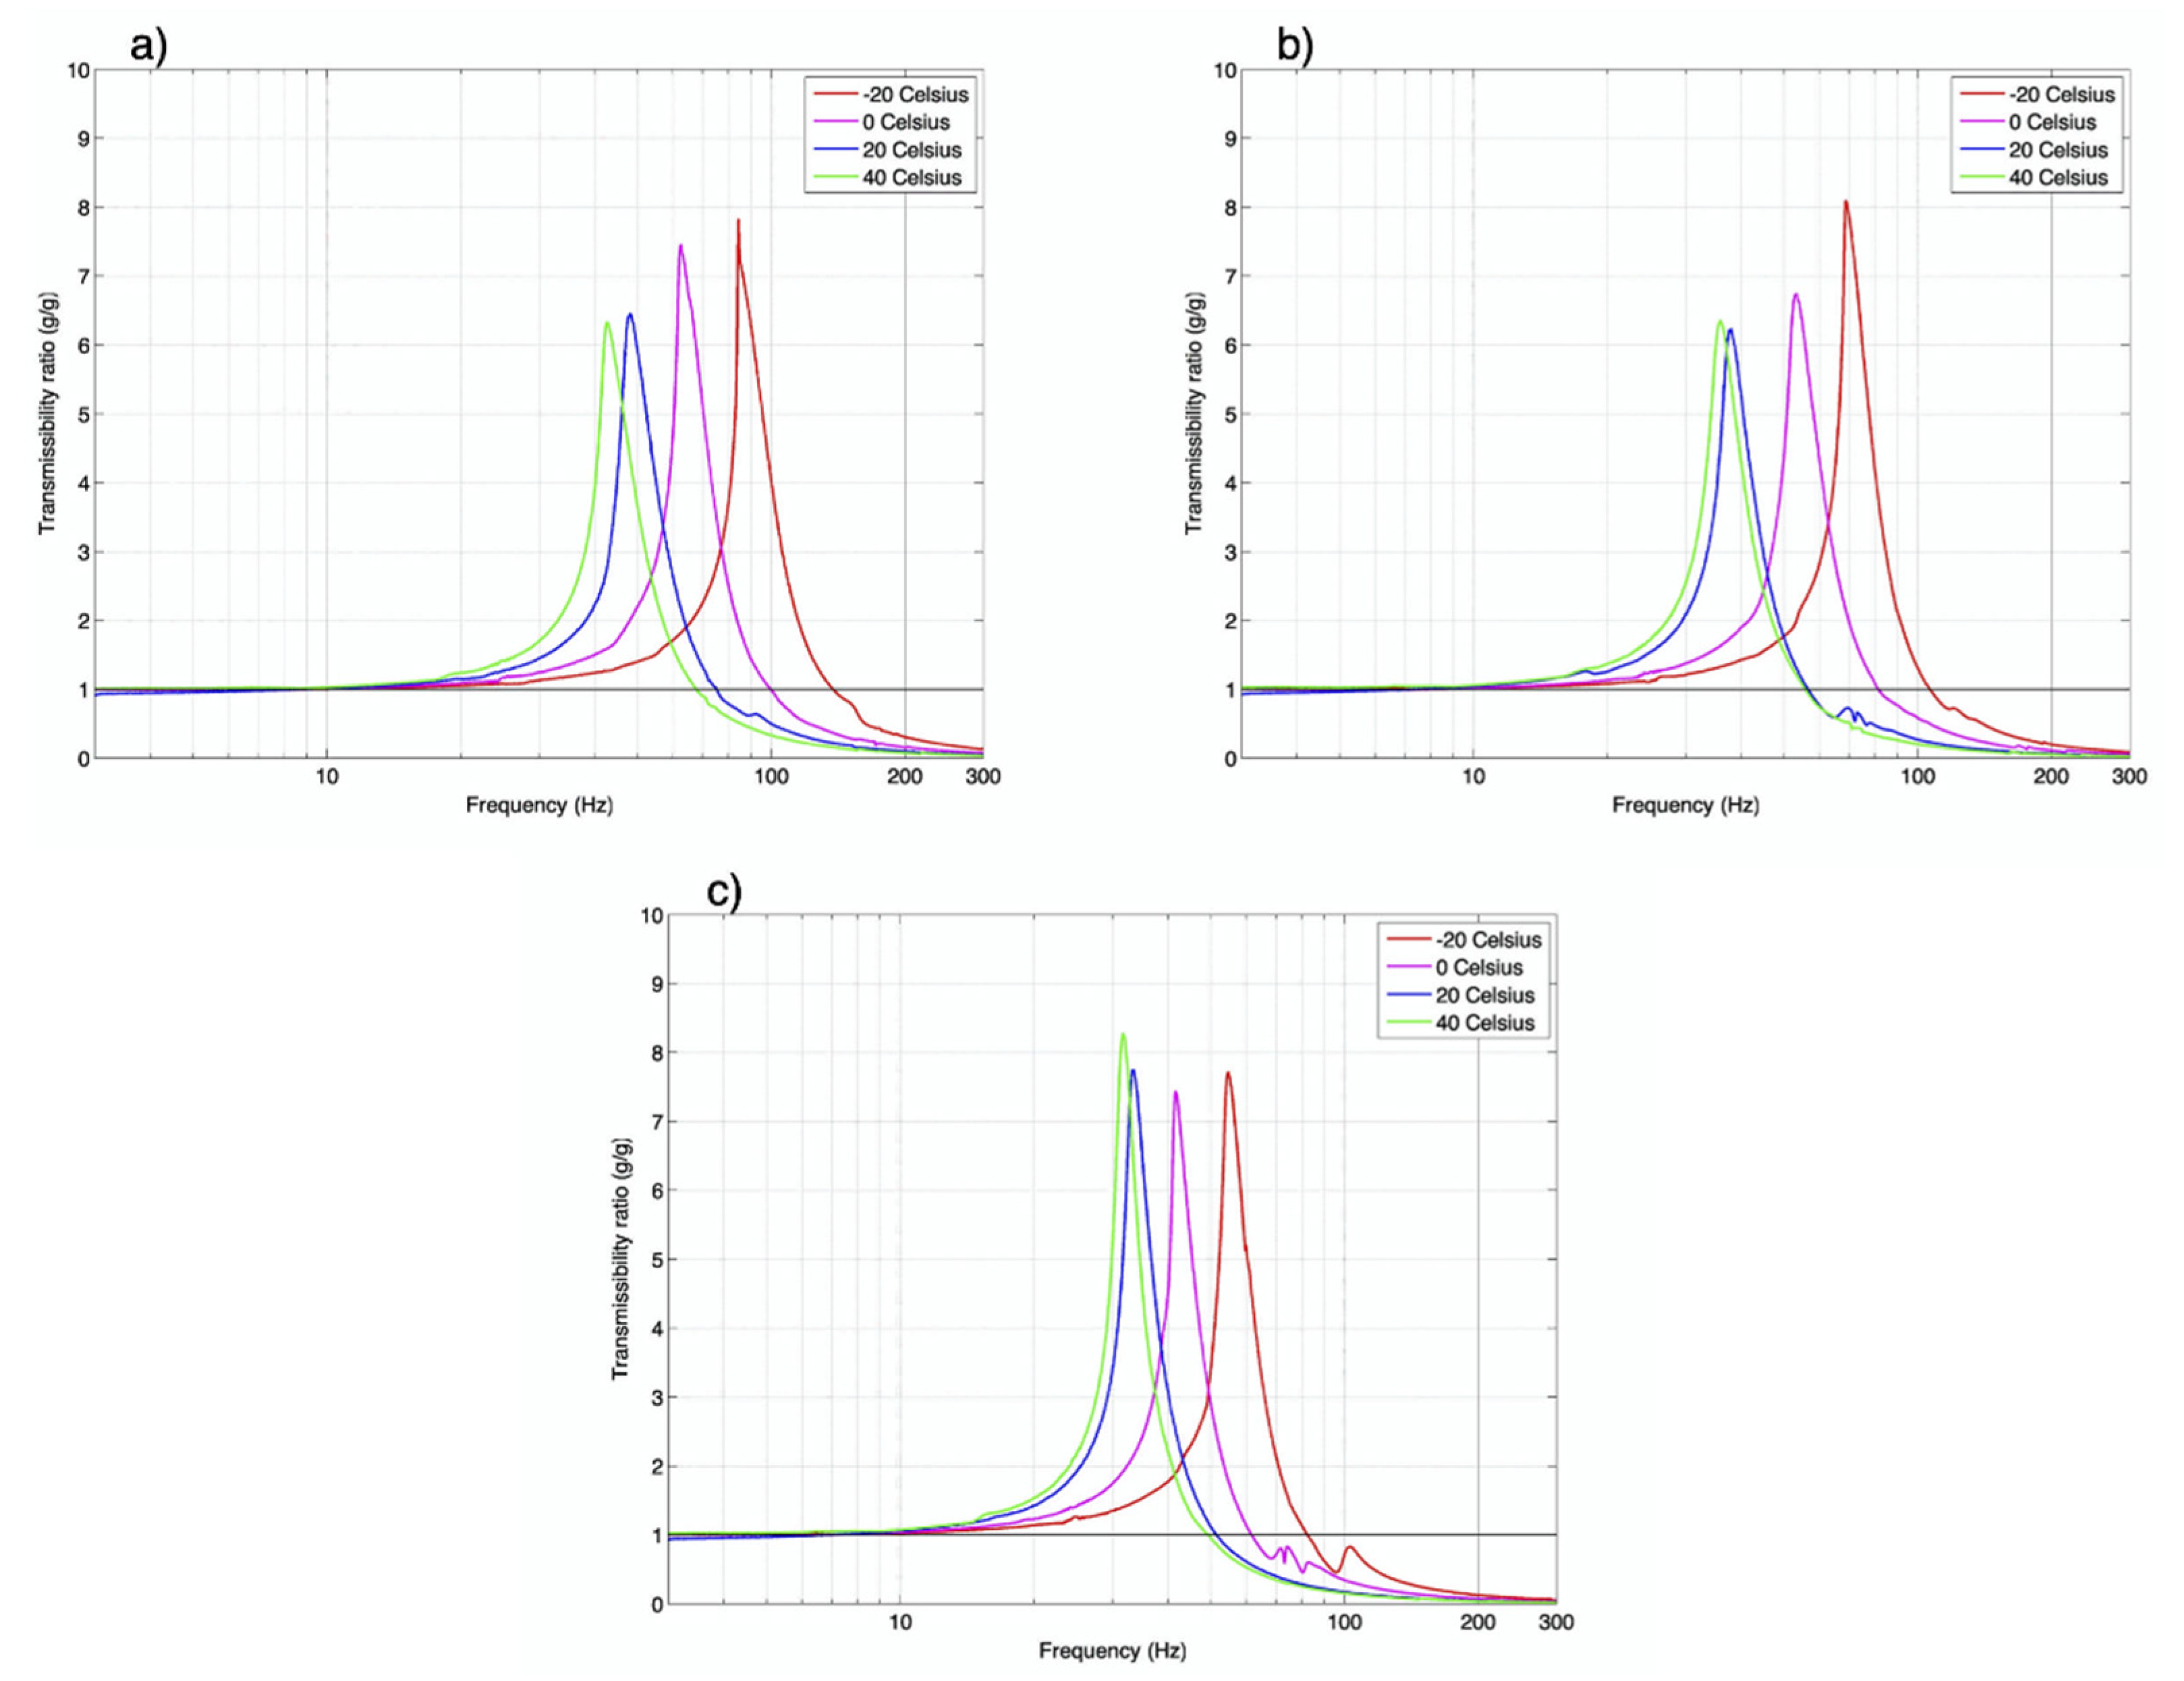
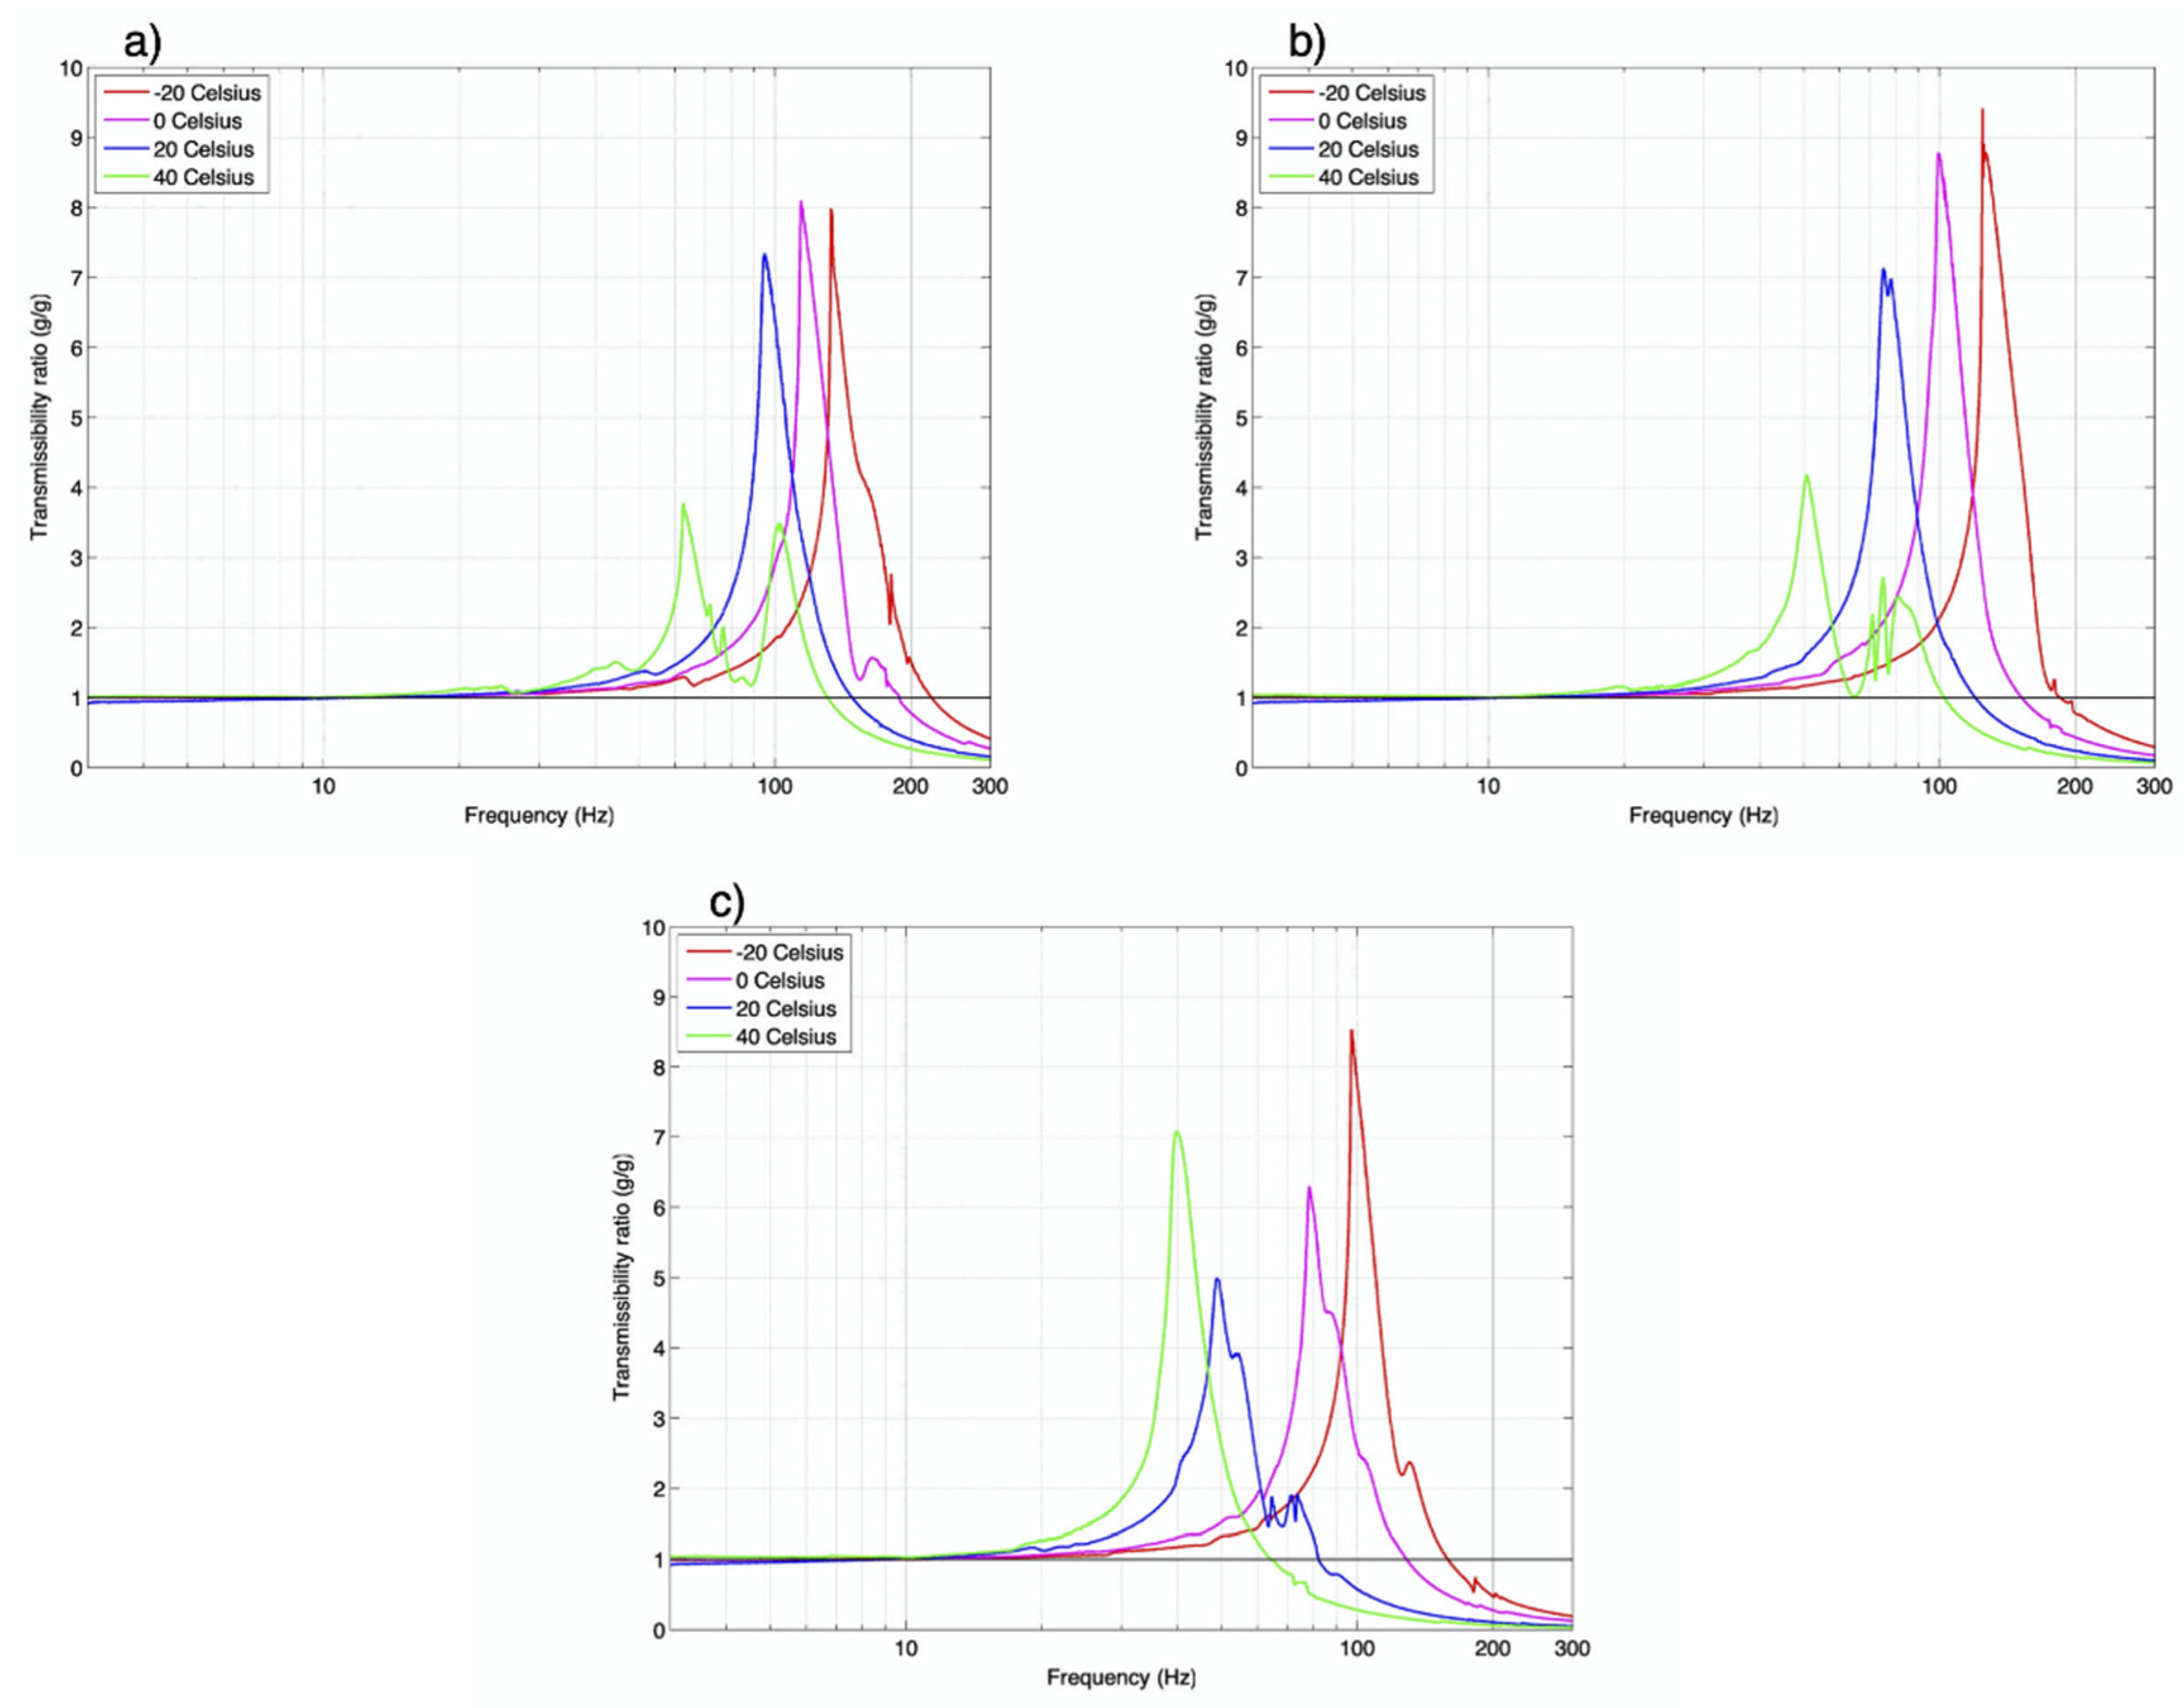
The vibration tests were performed at different temperatures with different cushioning materials, according to the test method described in Section 2. Frequency ranges, vibration transmissibility, and damping ratios were determined. Frequency ranges and vibration transmissibility were measured using vibration tests directly. Three frequency values were stated at each temperature and static load. The first value was T r   1.1 . The transmissibility plot left the direct coupling zone and reached the amplification zone stable, according to our observation. The strict border between direct coupling and amplification zone occurs when Tr > 1, but the observed measured value showed that the transmissibility was not 1 strictly in the direct coupling zone, but varied between 0.9 and 1.1. However, once the transmissibility reached 1.1, the plot did not return to the direct coupling zone. The second frequency value was the maximum value of the transmissibility, and the third frequency value showed the interface between the amplification and attenuation. Vibration transmissibility and frequency curves of the tested materials at different temperatures at different static loads are shown in Figure 7, Figure 8 and Figure 9. Figure 7 shows the curves for PE25 at static loads 3.488 kPa, 4.651 kPa, and 6.976 kPa; Figure 8 shows the curves for PE30; and Figure 9 shows the curves for XPE at the same static loads.
The damping ratios were estimated by applying linear vibration theory with single degree-of-freedom system with viscous damping based on Equations (5) and (6). Equation (5) was used when f f   f n , and Equation (6) was used when T r   1 (Table 2, Table 3 and Table 4). Each table separately provides the experimental results of PE25, PE30, and XPE cushioning materials at different temperatures and at different static loads.

3.2. Findings from the Experimental Results

After comparing and analyzing the experimental results of vibration transmissibility and frequency curves of PE25, PE30, and XPE cushioning materials at different static loads and temperatures, the following observations were obtained.
The results showed an influence of temperature on the performance of all tested materials. At all static loads, as the temperature decreased from 40 °C to −20 °C, the frequency of maximum vibration amplification, or resonant frequency, increased. These results also showed a stronger influence of temperature on the resonant frequency of XPE and PE30 compared to PE25. For instance, when a static stress of 3.488 kPa was exerted on XPE or PE30, the resonant frequency at −20 °C was about two times as much as that at 40 °C. However, for the same static stress level, the difference in resonant frequency of PE25 at −20 °C and 40 °C was only about 27%.
When the frequency was over 70 Hz, the frequency range reached the attenuation zone of PE25. This point was approximately 138 Hz for PE30 and approximately 222 Hz for XPE.
Generally, XPE has the lowest, second-lowest, and third-lowest vibration transmissibility values when considering all materials, temperatures, and static loads. The resonant frequencies were 48.8345 Hz (+20 °C, 6.976 kPa), 50.6682 Hz (+40 °C, 4.651 kPa), and 62.6298 Hz (+40 °C, 3.488 kPa); while their vibration transmissibilities were 4.9942, 4.1833, and 3.7688.
The lowest peak vibration transmissibility value was 7.7215 at −20 °C (PE30, 6.976 kPa). At 0 °C, it was 6.2941 (XPE, 6.976 kPa). The lowest vibration transmissibility values for the other two temperatures were 4.9942 and 3.7688.
Vibration transmissibility is influenced by the static load of the cushioning system. Similarly, regarding the effect of temperature, the results also showed a stronger influence of static load on the resonant frequency of XPE and PE30 compared to PE25. For example, the average increase of resonance frequencies when the static load was decreased from 6.976 kPa to 3.488 kPa was 59% and 46% for XPE and PE 30, respectively, but only 19% for PE25.
For the XPE material at loads of 3.488 kPa and 4.651 kPa and at 40 °C, a second peak frequency was observed around 100 Hz. This phenomenon was attributed to the softer XPE material at 40 °C and its shorter compression distance, which resulted in a higher amplitude in the cross section of the specimen.

3.3. Analysis of the Experimental Results

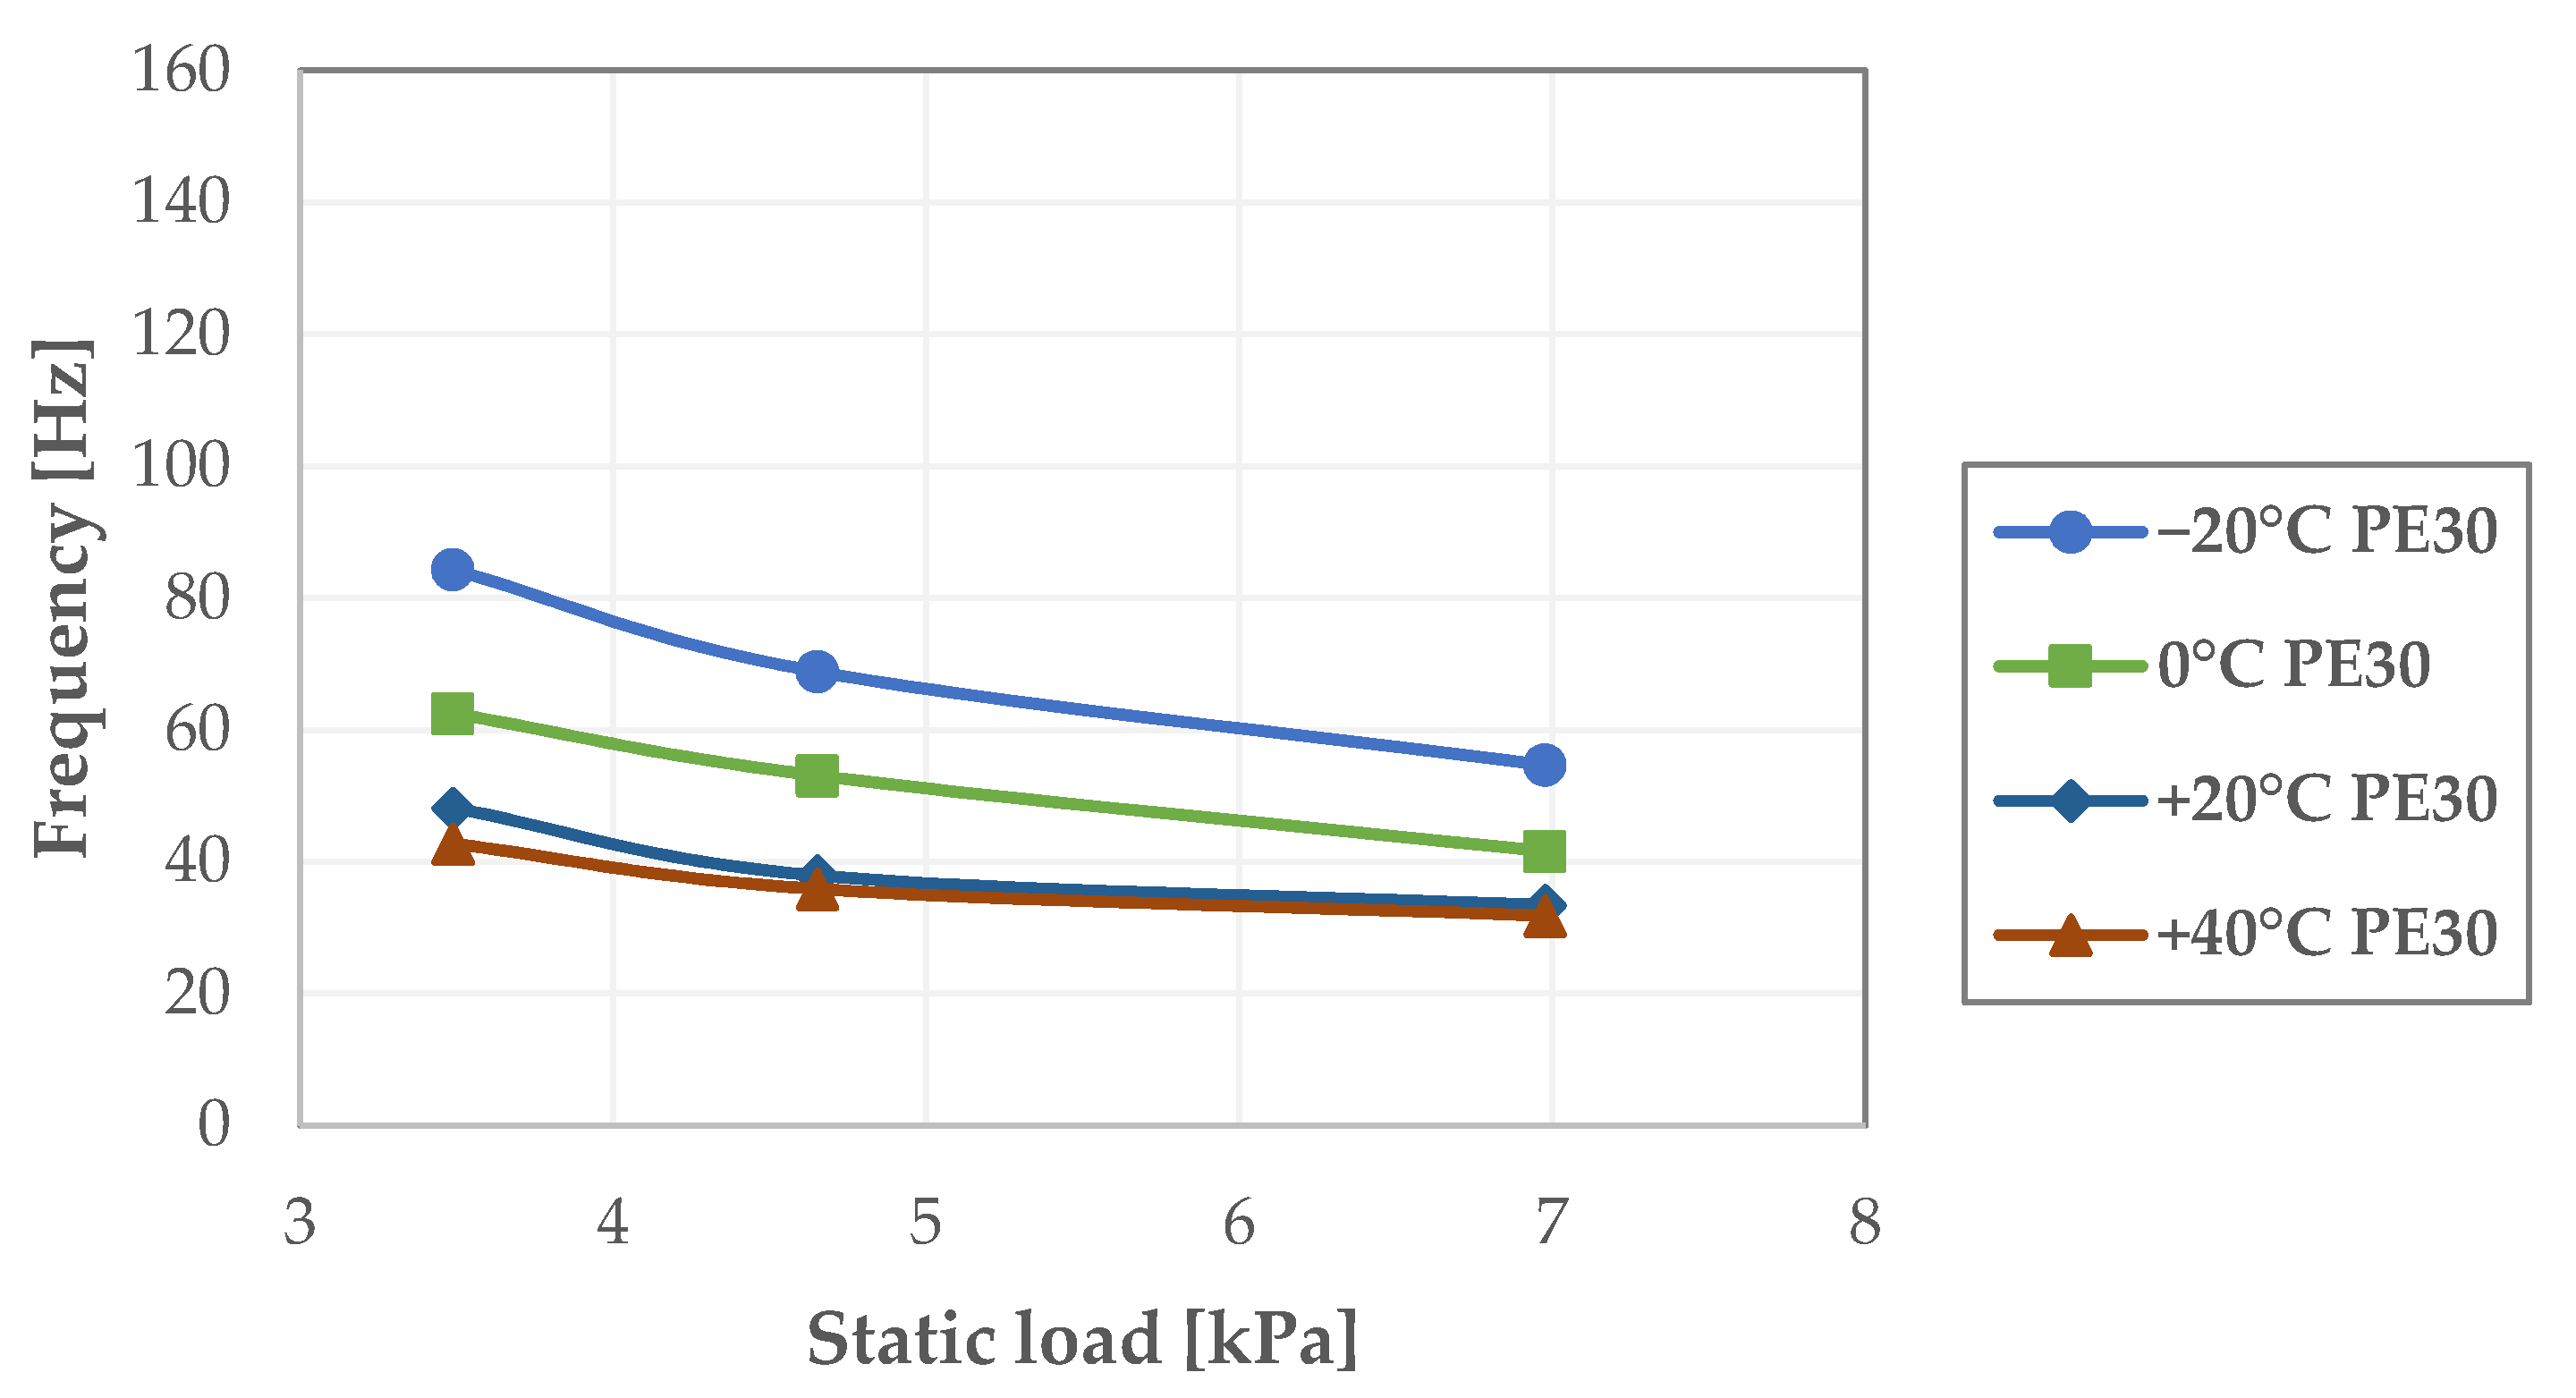
As shown in Figure 10, Figure 11 and Figure 12, all resonant frequencies decreased when the temperature increased. These curves show how the resonant frequency varied as the temperature varied for each material.
The results of the vibration tests showed a more emphasized influence of temperature on the performance of XPE compared to PE30 and PE25. Generally, PE25 showed the lowest influence due to temperature changes. When the temperature was increased from −20 °C to +40 °C, the smallest change was also measured in this material (7.7884 Hz, 6.976 kPa static load, −20 °C to +40 °C). The resonant frequency was moved on the transmissibility plot by at least 22 Hz for PE30 and 57 Hz for XPE, depending on the static load. The maximum changes were more than 70 Hz for XPE, 40 Hz for PE30, and 13 Hz for PE25, depending on the static load. Therefore, packaging engineers must take into consideration the effects of temperature on the resonant frequency of the applied cushioning material, especially for XPE, which showed the highest influence of varying the temperature, based on the experimental results.
Packaged products can experience different climate conditions when shipped between continents. However, it is rare, even in modern supply chains, that packaged products can be exposed to all values in the wide temperature range used in our study. The temperature usually only ranges between 20 °C and 40 °C. Furthermore, most of the available data on the resonance frequency of cushioning materials was obtained at normal temperatures. For this reason, packaging professionals need to know the changes in the resonant frequencies under different temperature conditions. The resonant frequencies of PE25 and PE30 were less influenced than XPE by all changes in temperature. As the temperature moved from 20 °C to 40 °C, the change in resonant frequency was minimal for PE30 and PE25. These materials were mostly affected by a decrease in temperature. XPE was significantly influenced by both decreasing and increasing the temperature.
The effect of the static loads on the function of temperature was not clear. At the same temperature, the resonant frequency decreased when the static load was increased. However, when the temperature was increased from −20 °C to +40 °C, the highest changes in the resonant frequency were at 4.651 kPa for XPE and PE25, but at 3.488 kPa for PE30.

3.4. Comparison to Expanded Polyethylene (EPE)

The direct comparison of the results of this study to previous published results is relatively difficult. Studies on the topic of transmissibility and damping ratio are limited. As stated in the introduction, the effect of temperature on resonant frequencies of plastic foams were investigated only by Marcondes et al. [55]. However, strict values are mostly not available from that study; they can be only estimated based on two figures: resonant frequencies of expanded polyethylene as a function of temperature, and resonant frequencies of expanded polystyrene as a function of temperature. Furthermore, the transmissibility values and damping ratios were not published directly. The results for EPE (expanded polyethylene, ~35.24 kg/m3) showed an effect of temperature similar to what was found in our study. When the temperature decreased, the resonant frequency mostly increased. The only exception was the observed resonant frequency at 0.5 psi (3.447 kPa), where it was approximately 70 Hz at 3 °C and 68 Hz at −17 °C. In contrast, in our study, the resonant frequencies of PE25, PE30, and XPE at 3.488 kPa (~0.506 psi) were 44.4331 Hz, 84.3035 Hz, and 133.3350 Hz at −20 °C; and 40.1499 Hz, 62.4857 Hz, and 114.5280 Hz at 0 °C. All resonant frequencies decreased when the temperature was increased. In [55], the vibration tests were performed at normal room temperature after preconditioning.
Furthermore, as [55] showed, the resonant frequencies at 3 °C and 23 °C at 0.75 psi (5.17 kPa) and 1.0 psi (6.89 KPa) were quite equal. The differences were also minimal at 23° C and 43° C with 1.5 psi (10.34 kPa). In our study, the resonant frequency of PE25 decreased at 6.976 kPa (~1.012 psi) from 40.1499 Hz to 34.0133 Hz when the temperature was increased from 0 °C to +20 °C. These values were 62.4857 Hz and 48.1642 Hz for PE30, and 114.5280 Hz and 94.8137 Hz for XPE. The resonant frequency of XPE and PE30 at −20 °C was about two times as much as that at 40 °C. In [55], the resonant frequency decreased from 68 Hz to 52 Hz at 0.5 psi (~3.447 kPa) when the temperature increased from −17 °C to 43 °C. In our study, these values were 44.4331 Hz and 32.5566 Hz for PE25 at 3.488 kPa when the temperature increased from −20 °C to 40 °C. Generally, PE25 was the least influenced by temperature changes in our study. PE25 at 1.1922 Hz (PE25, 6.976 kPa static load, +20 °C to +40 °C) also showed the smallest changes. Generally, the changes in PE25 were similar to the results for EPE35 in [55].

3.5. Comparison to Paper-Based Packaging

In [4,47], the authors determined the resonant frequency, transmissibility and damping ratio for honeycomb paperboard and X-PLY corrugated paperboard at different static loads, but without changes in temperature. The temperature during the tests was 21 °C for honeycomb and 23 °C for X-PLY. The studies showed that in general, the vibration transmissibility of X-PLY was low when the peak frequency was higher than 212 Hz. The value for honeycomb was 350 Hz.
A similar study was performed in [51] for single-layer, two-layer, and three-layer corrugated paperboard pads. The critical frequencies found were 191 Hz for the single-layer pad, 208 Hz for the two-layer pad, and 185 Hz for the three-layer pad.
At these frequency levels, PE25, PE30, and XPE attenuated the vibration intensity at all static loads and investigated temperature levels. Furthermore, when using honeycomb paperboard and X-PLY corrugated paperboard as cushioning in a package, it must be considered that the mechanical properties of these materials are highly influenced by changes in temperature and humidity.

4. Conclusions

Our study showed the important properties of cross-linked and non-cross-linked polyethylene foam. The resonant frequencies and vibration transmissibility were measured, and the damping ratios were calculated. The results showed that when the frequency is over 138 Hz for non-cross-linked PE and over 222 Hz for cross-linked PE, the vibration transmissibility was under 1 at all investigated temperatures and static loads.
The results of this paper provide new information for packaging engineers on cushioning elements that use PE and XPE materials that can assist in finding optimal packaging solutions that provide suitable protection to products and reduce the weight of packaging used in practice. The results provide a better and more professional determination of the optimal plastic foam cushioning to be used for product protection in variable-temperature supply chains. When protective packaging materials are characterized, the effect of temperature must be considered, especially in the application of XPE, and for PE25 and PE30 in cold temperatures.
We plan to engage in further research on this subject, with the aim of combining the rheological properties of cushioning materials with the results of the effect of temperature changes found in this study.

Author Contributions

Supervision: P.B.; research design: P.C., P.B.; measurements and experiments: P.C.; development and analysis of data and presentation of results: P.C., P.B.; original draft: P.C.; final draft: P.B. All authors have read and agreed to the published version of the manuscript.

Funding

This research received no external funding.

Institutional Review Board Statement

Not Applicable.

Informed Consent Statement

Not Applicable.

Data Availability Statement

The data presented in this study are available on request from the corresponding author.

Conflicts of Interest

The authors declare no conflict of interest.

References

  1. Lu, F.; Gao, D. Impact Responses of Composite Cushioning System considering Critical Component with Simply Supported Beam Type. Adv. Mech. Eng. 2014, 6, 1–6. [Google Scholar] [CrossRef] [Green Version]
  2. Hanlon, J.; Kelsey, R.; Forcinio, H. Handbook of Package Engineering, 3rd ed.; Technomic Publishing Company Inc.: Boca Raton, FL, USA, 1998. [Google Scholar]
  3. Yam, K.L. The Wiley Encyclopedia of Packaging Technology, 2nd ed.; John Wiley & Sons: Hoboken, NJ, USA, 2010. [Google Scholar]
  4. Guo, Y.; Xu, W.; Fu, Y.; Wang, H. Dynamic shock cushioning characteristics and vibration transmissibility of X-PLY corrugated paperboard. Shock Vib. 2011, 18, 525–535. [Google Scholar] [CrossRef]
  5. Sherman, M. Medical Device Packaging Handbook, 1st ed.; CRC Press: Boca Raton, FL, USA, 1988. [Google Scholar]
  6. Böröcz, P.; Singh, S.P. Measurement and analysis of delivery van vibration levels to simulate package testing for parcel delivery in Hungary. Packag. Technol. Sci. 2018, 31, 342–352. [Google Scholar] [CrossRef]
  7. Parker, A.J. A Method of Characterisation of the Nonlinear Vibration Transmissibility of Cushioning Materials. Ph.D. Thesis, Victoria University, Melbourne, Australia, 2007. Available online: http://vuir.vu.edu.au/id/eprint/1531 (accessed on 1 December 2020).
  8. Gibson, I.J.; Ashby, M.F. The Mechanics of Three-Dimensional Cellular Materials. Proc. R. Soc. Lond. A 1982, 382, 43–59. [Google Scholar] [CrossRef]
  9. Maiti, S.K.; Gibson, L.J.; Ashby, M.F. Deformation and energy absorption diagrams for cellular solids. Acta Metall. 1984, 32, 1963–1975. [Google Scholar] [CrossRef]
  10. Gibson, L.J. Modelling the mechanical behavior of cellular materials. Mater. Sci. Eng. A 1989, 110, 1–36. [Google Scholar] [CrossRef]
  11. Ozturk, U.E.; Anlas, G. Energy absorption calculations in multiple compressive loading of polymeric foams. Mater. Des. 2009, 30, 15–22. [Google Scholar] [CrossRef]
  12. Zhang, J.; Kikuchi, N.; Li, V.; Yee, A.; Nusholtz, G. Constitutive modeling of polymeric foam material subjected to dynamic crash loading. Int. J. Impact Eng. 1998, 21, 369–386. [Google Scholar] [CrossRef]
  13. Avalle, M.; Belingardi, G.; Ibba, A. Mechanical models of cellular solids: Parameters identification from experimental tests. Int. J. Impact Eng. 2007, 34, 3–27. [Google Scholar] [CrossRef]
  14. Sherwood, J.A.; Frost, C.C. Constitutive modeling and simulation of energy absorbing polyurethane foam under impact loading. Polym. Eng. Sci. 1992, 32, 1138–1146. [Google Scholar] [CrossRef]
  15. Avallea, M.; Belingardia, G.; Montaninib, R. Characterization of polymeric structural foams under compressive impact loading by means of energy-absorption diagram. Int. J. Impact Eng. 2001, 25, 455–472. [Google Scholar] [CrossRef]
  16. Miltz, J.; Ramon, O. Energy absorption characteristics of polymeric foams used as cushioning materials. Polym. Eng. Sci. 1990, 30, 129–133. [Google Scholar] [CrossRef]
  17. Andena, L.; Caimmi, F.; Leonardi, L.; Nacucchi, M.; De Pascalis, F. Compression of polystyrene and polypropylene foams for energy absorption applications: A combined mechanical and microstructural study. J. Cell. Plast. 2019, 55, 49–72. [Google Scholar] [CrossRef]
  18. Woolam, W.E. A Study of the Dynamics of Low Energy Cushioning Materials Using Scale Models. J. Cell. Plast. 1968, 4, 79–83. [Google Scholar] [CrossRef]
  19. Zhang, J.; Ashby, M.F. Mechanical selection of foams and honeycombs used for packaging and energy absorption. J. Mater. Sci. 1994, 29, 157–163. [Google Scholar] [CrossRef]
  20. Jalil, S.A. Optimization of 3D Printable Cellular Array Structures for Cushioning. Ph.D. Thesis, Nanyang Technological University, Singapore, 2019. [Google Scholar] [CrossRef]
  21. Navarro-Javierre, P.; Garcia-Romeu-Martinez, M.A.; Cloquell-Ballester, V.A.; de-la-Cruz-Navarro, E. Evaluation of Two Simplified Methods for Determining Cushion Curves of Closed Cell Foams. Packag. Technol. Sci. 2012, 25, 217–231. [Google Scholar] [CrossRef]
  22. Ruiz-Herrero, J.L.; Rodríguez-Pérez, M.A.; de Saja, J.A. Prediction of Cushion Curves for Closed Cell Polyethylene-Based Foams. Part I. Modelling. Cell. Polym. 2005, 24, 329–346. [Google Scholar] [CrossRef]
  23. Ge, C. Theory and practice of cushion curve: A supplementary discussion. Packag. Technol. Sci. 2019, 32, 185–197. [Google Scholar] [CrossRef]
  24. Gruenbaum, G.; Miltz, J. Static versus dynamic evaluation of cushioning properties of plastic foams. J. Appl. Polym. Sci. 1983, 28, 135–143. [Google Scholar] [CrossRef]
  25. Ramon, O.; Miltz, J. Prediction of dynamic properties of plastic foams from constant–strain rate measurements. J. Appl. Polym. Sci. 1990, 40, 1683–1692. [Google Scholar] [CrossRef]
  26. Iannace, F.; Iannace, S.; Caprino, G.; Nicolais, L. Prediction of impact properties of polyolefin foams. Polym. Test. 2001, 20, 643–647. [Google Scholar] [CrossRef]
  27. Daum, M. A simplified process for determining cushion curves: The stress–energy method. In Dimensions 2006; International Safe Transit Association: East Lansing, MI, USA, 2006. [Google Scholar]
  28. Burgess, G. Generation of cushion curves from one shock pulse. Packag. Technol. Sci. 1994, 7, 169–173. [Google Scholar] [CrossRef]
  29. Daum, M. Simplified Presentation of the Stress-Energy Method for General Commercial Use. J. Test. Eval. 2008, 36, 100–102. [Google Scholar] [CrossRef]
  30. Paulin, K.; Batt, G.; Daum, M. Statistical Analysis of the Stress-Energy Methodology Applied to Cushion Curve Determination. J. Test. Eval. 2013, 41, 409–416. [Google Scholar] [CrossRef] [Green Version]
  31. Singh, J.; Ignatova, L.; Olsen, E.; Singh, P. Evaluation of the Stress-Energy Methodology to Predict Transmitted Shock through Expanded Foam Cushions. J. Test. Eval. 2010, 38, 724–730. [Google Scholar] [CrossRef]
  32. Daum, M. Evaluation of Predicted Deceleration Values From the Stress-Energy Method Compared to Actual Deceleration Values From the ASTM D1596 Test Method. J. Test. Eval. 2011, 39, 1103–1108. [Google Scholar] [CrossRef]
  33. McGee, S.D.; Batt, G.S.; Gibert, J.M.; Darby, D.O. Predicting the effect of temperature on the shock absorption properties of polyethylene foam. Packag. Technol. Sci. 2017, 30, 477–494. [Google Scholar] [CrossRef]
  34. Sek, M.A.; Minett, M.; Rouillard, V.; Bruscella, B. A new method for the determination of cushion curves. Packag. Technol. Sci. 2000, 13, 249–255. [Google Scholar] [CrossRef]
  35. Li, G.; Rouillard, V.; Sek, M.A. Evaluation of Static and Dynamic Cushioning Properties of Polyethylene Foam for Determining Its Cushion Curves. Packag. Technol. Sci. 2015, 28, 47–57. [Google Scholar] [CrossRef]
  36. Gibert, J.; Batt, G. Impact oscillator model for the prediction of dynamic cushion curves of open cell foams. Packag. Technol. Sci. 2015, 28, 227–239. [Google Scholar] [CrossRef]
  37. Mills, N.J.; Masso-Moreu, Y. Finite element analysis (FEA) applied to polyethylene foam cushions in package drop tests. Packag. Technol. Sci. 2005, 18, 29–38. [Google Scholar] [CrossRef]
  38. Ozturka, U.E.; Anlas, G. Finite element analysis of expanded polystyrene foam under multiple compressive loading and unloading. Mater. Des. 2011, 32, 773–780. [Google Scholar] [CrossRef]
  39. Kuang, W.; Wang, J.; Huang, C.; Lu, L.; Gao, D.; Wang, Z.; Ge, C. Homotopy perturbation method with an auxiliary term for the optimal design of a tangent nonlinear packaging system. J. Low Freq. Noise Vib. Act. Control 2019, 38, 1075–1080. [Google Scholar] [CrossRef]
  40. Ji, Q.; Wang, J.; Lu, L.; Ge, C. Li–He’s modified homotopy perturbation method coupled with the energy method for the dropping shock response of a tangent nonlinear packaging system. J. Low Freq. Noise Vib. Act. Control 2020. [Google Scholar] [CrossRef]
  41. Ge, C.; Rice, B. Impact damping ratio of a nonlinear viscoelastic foam. Polym. Test. 2018, 72, 187–195. [Google Scholar] [CrossRef]
  42. Ge, C.; Cormier, D.; Rice, B. Damping and cushioning characteristics of Polyjet 3D printed photopolymer with Kelvin model. J. Cell. Plast. 2020. [Google Scholar] [CrossRef]
  43. ASTM International. ASTM D1596: Standard test method for dynamic cushion shock cushioning characteristics of packaging material. In Annual Book of ASTM Standards; ASTM International: West Conshohocken, PA, USA, 2014. [Google Scholar]
  44. ASTM International. ASTM D4168: Standard test methods for transmitted shock characteristics of foam-in-place cushioning materials. In Annual Book of ASTM Standards; ASTM International: West Conshohocken, PA, USA, 2015. [Google Scholar]
  45. Batt, G. Primary Resonance Behavior of Expanded Polymer Cushion Material under Low-Intensity Harmonic Excitations. Ph.D. Thesis, Clemson University, Clemson, SC, USA, 2013. Available online: https://tigerprints.clemson.edu/all_dissertations/1260 (accessed on 1 December 2020).
  46. Goodwin, D.; Young, D. Protective Packaging for Distribution; DEStech Publications Inc.: Lancaster, PA, USA, 2011. [Google Scholar]
  47. Guo, Y.; Zhang, J. Shock absorbing characteristics and vibration transmissibility of honeycomb paperboard. Shock Vib. 2004, 11, 521–531. [Google Scholar] [CrossRef]
  48. Wang, Z.W.; Wang, L.J.; Xu, C.Y.; Zhang, Y. Influence of Low-Intensity Repeated Impacts on Energy Absorption and Vibration Transmissibility of Honeycomb Paperboard. Packag. Technol. Sci. 2016, 29, 585–600. [Google Scholar] [CrossRef]
  49. Latif, N.A.; Rus, A.Z.M. Vibration Transmissibility Study of High Density Solid Waste Biopolymer Foam. J. Mech. Eng. Sci. 2014, 6, 772–781. [Google Scholar] [CrossRef]
  50. Godshall, W.D. Vibration Transmissibility Characteristics of Corrugated Fiberboard; Defense Technical Information Center: Fort Belvoir, VA, USA, 1973. [Google Scholar]
  51. Guo, Y.; Xu, W.; Fu, Y.; Zhang, W. Comparison Studies on Dynamic Packaging Properties of Corrugated Paperboard Pads. Engineering 2010, 2, 378–386. [Google Scholar] [CrossRef] [Green Version]
  52. Kim, J.N.; Sim, J.M.; Park, M.J.; Kim, G.S.; Kim, J.; Park, J.M. Analysis and Modelling of Vibration Performance for Multi-layered Corrugated Structure. Biosyst. Eng. 2013, 38, 327–334. [Google Scholar] [CrossRef]
  53. Sek, M.A.; Rouillard, V.; Parker, A.J. A Study of Nonlinear Effects in a Cushion-Product System on its Vibration Transmissibility Estimates with the Reverse Multiple Input–Single Output Technique. Packag. Technol. Sci. 2013, 26, 125–135. [Google Scholar] [CrossRef]
  54. White, S.W.; Kim, S.K.; Bajaj, A.K.; Davies, P.; Showers, D.K.; Liedtke, P.E. Experimental Techniques and Identification of Nonlinear and Viscoelastic Properties of Flexible Polyurethane Foam. Nonlinear Dyn. 2000, 22, 281–313. [Google Scholar] [CrossRef]
  55. Marcondes, J.; Hatton, K.; Graham, J.; Schueneman, H. Effect of temperature on the cushioning properties of some foamed plastic materials. Packag. Technol. Sci. 2003, 16, 69–76. [Google Scholar] [CrossRef]
  56. Szymanski, J. The Effect of Temperature and Humidity on the Cushioning Properties of Expanded Polylactic Acid Foam. Master’s Thesis, Clemson University, Clemson, SC, USA, 2010. [Google Scholar]
  57. Brandenburg, R.K.; Lee, J.J. Fundamentals of Packaging Dynamics; L.A.B. Equipment Inc.: Itasca, IL, USA, 2001. [Google Scholar]
  58. Harris, C.M.; Crede, E.E.; Hatae, M.T. Shock and Vibration Handbook, Packaging Design; McGraw-Hill Book Inc.: New York, NY, USA, 1961. [Google Scholar]
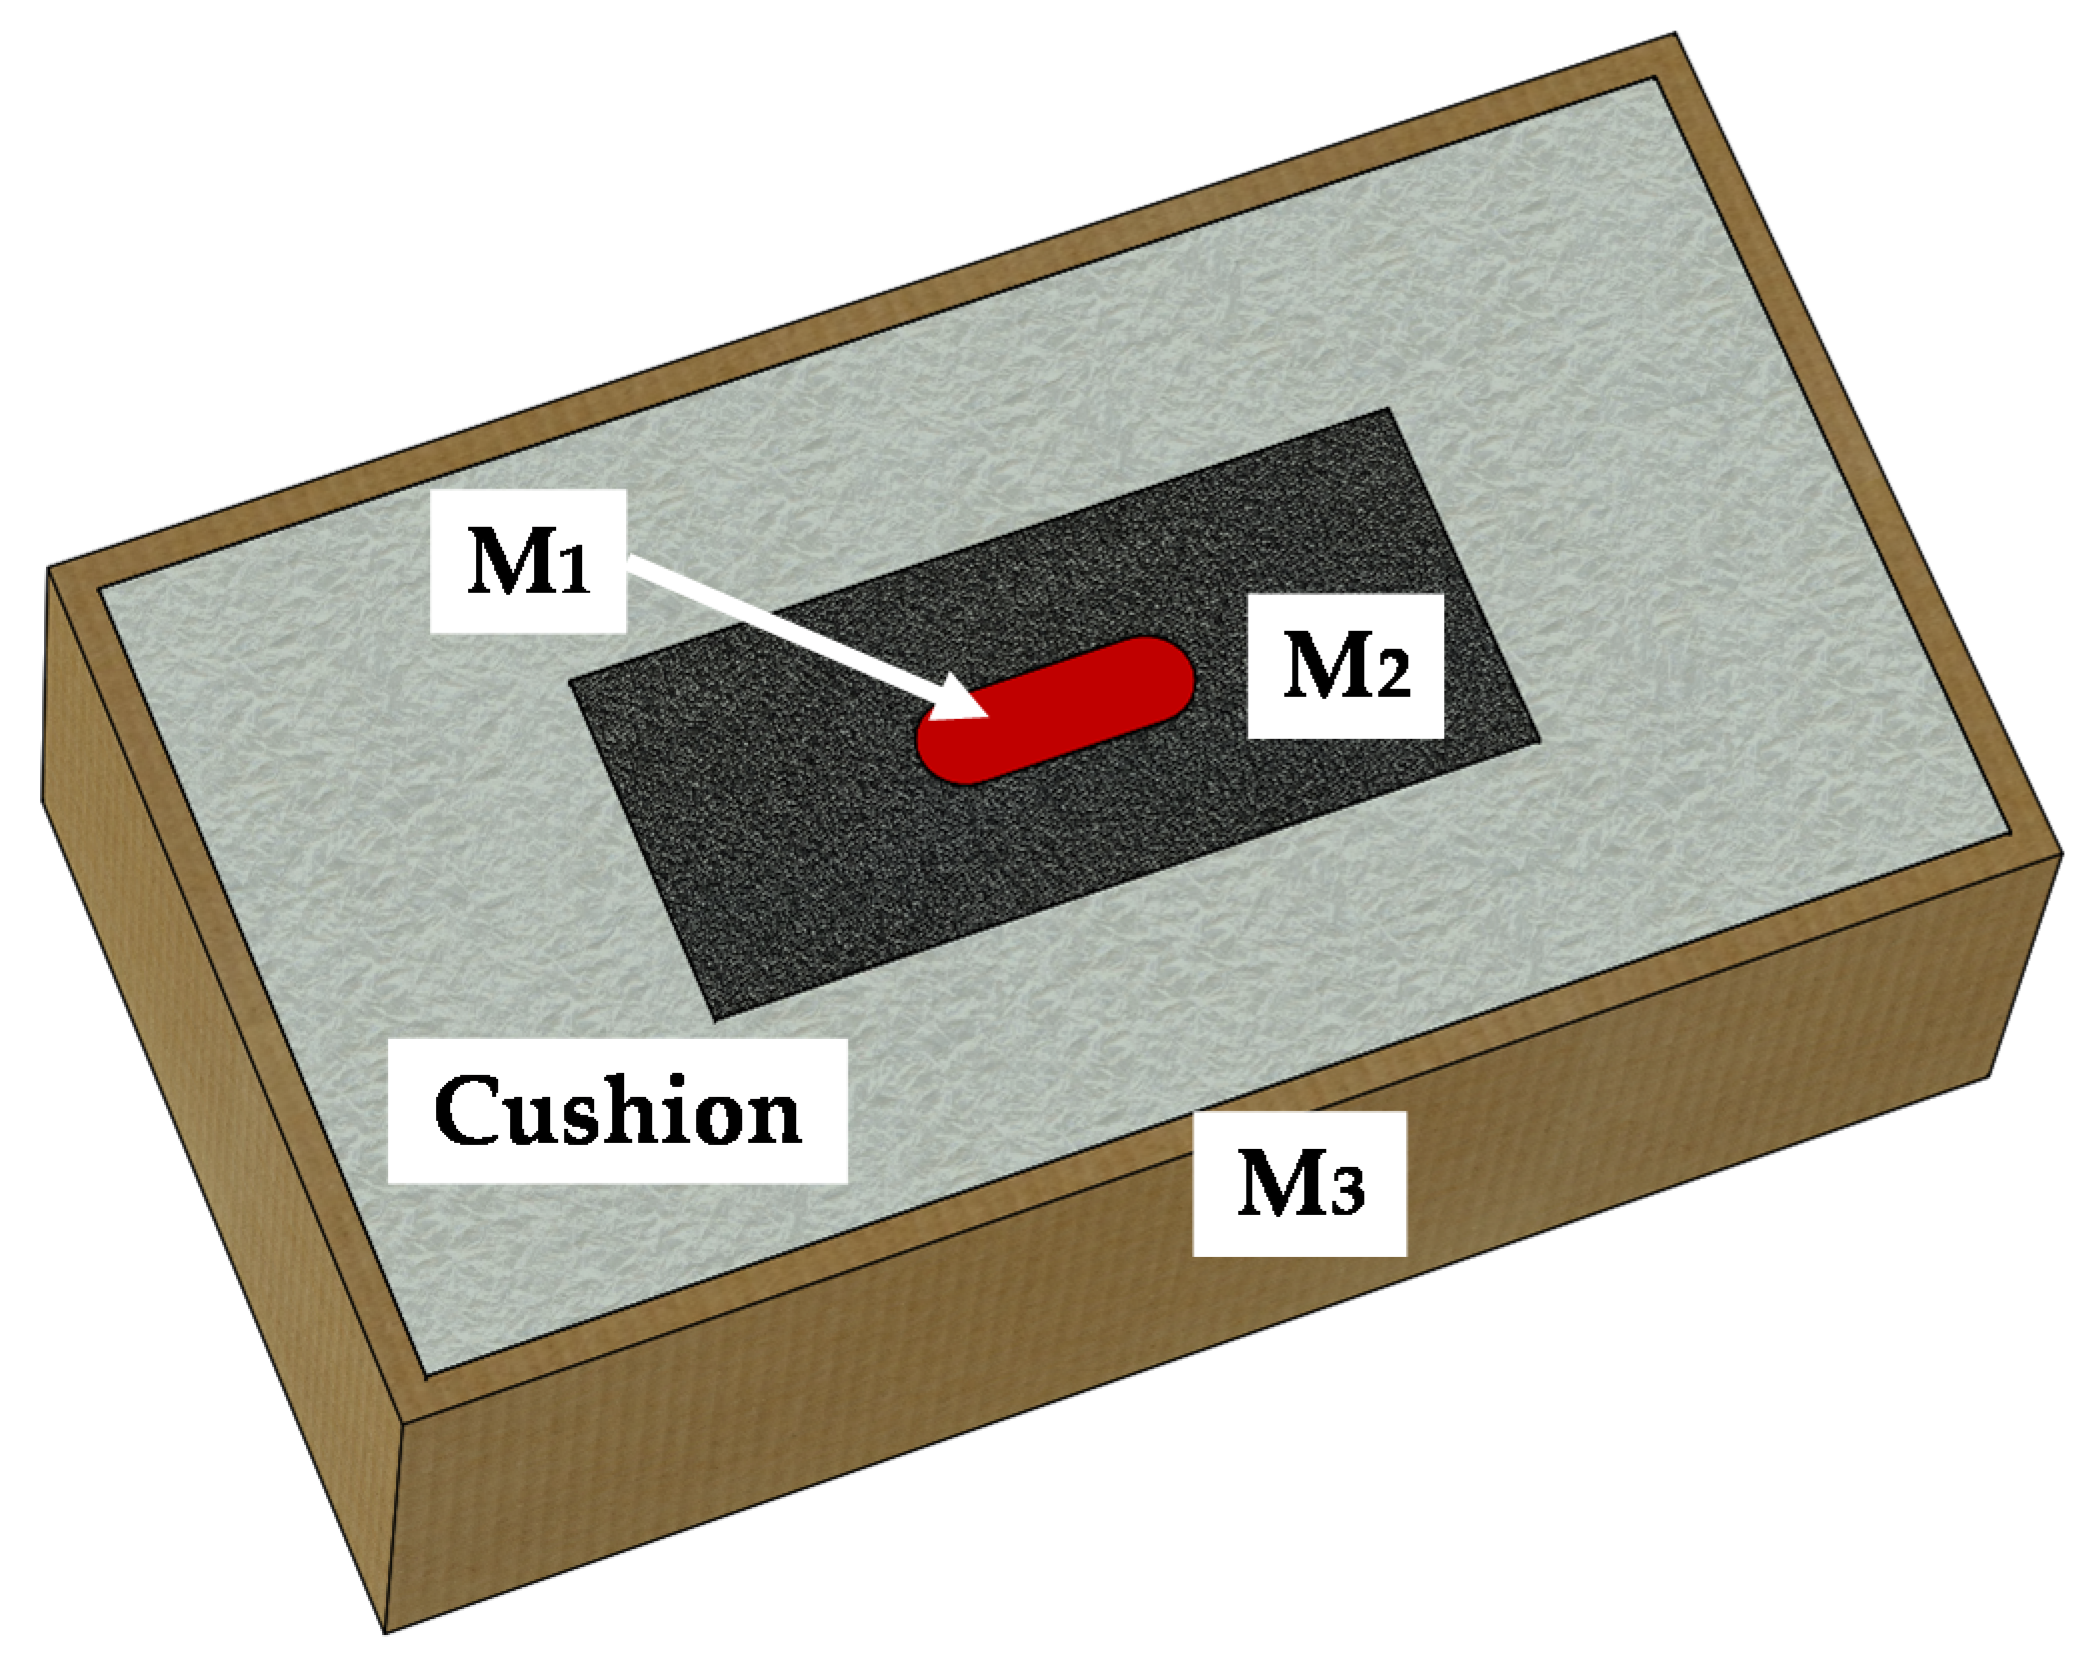
Figure 1. The conceptual structure of a packaging system using cushioning material.
Applsci 11 00482 g001
Figure 2. A stress–strain curve for a foam.
Applsci 11 00482 g002
Figure 3. Samples used in this study. (A) PE25, (B) PE30, and (C) XPE.
Applsci 11 00482 g003
Figure 4. Magnification of an undamped spring system.
Applsci 11 00482 g004
Figure 5. (a) The measurement system used in this study (inner view): (A) vibration system, (B) climate chamber, (C) concrete block, (D) test specimen, (E) fixtures, and (F) acceleration sensors. (b) The measurement system used in this study (outer view): (A) vibration system, (B) climate chamber, (G) vibration testing controller and acquisition system.
Applsci 11 00482 g005
Figure 6. Transmissibility curves with varying damping.
Applsci 11 00482 g006
Figure 7. Vibration transmissibility and frequency curves for (a) PE25 at a static load of 3.488 kPa, (b) PE25 at a static load of 4.651 kPa, and (c) PE25 at a static load of 6.976 kPa (frequency is in logarithmic scale).
Applsci 11 00482 g007
Figure 8. Vibration transmissibility and frequency curves for (a) PE30 at a static load of 3.488 kPa, (b) PE30 at a static load of 4.651 kPa, and (c) PE30 at a static load of 6.976 kPa (frequency is in logarithmic scale).
Applsci 11 00482 g008
Figure 9. Vibration transmissibility and frequency curves for (a) XPE at a static load of 3.488 kPa, (b) XPE at a static load of 4.651 kPa, and (c) XPE at a static load of 6.976 kPa (frequency is in logarithmic scale).
Applsci 11 00482 g009
Figure 10. Resonant frequencies of XPE as a function of temperature.
Applsci 11 00482 g010
Figure 11. Resonant frequencies of PE30 as a function of temperature.
Applsci 11 00482 g011
Figure 12. Resonant frequencies of PE25 as a function of temperature.
Applsci 11 00482 g012
Table 1. Specifications of measurement instruments used in this study.
EquipmentManufacturerParameter
Vibration Test System TV 59355/AIT-440TIRA GmbH
(Germany)
Rated peak force Sinepkmax. 55,000 N
Frequency max. 2500 Hz
Max. velocity Sine2.0 m/s
Max. acceleration Sine100 g
AV600 C 10Angelantoni Industrie Srl (Italy)Useful capacity (L)max. 610
Temperature range (°C)−75 to +180
VR9500Vibration Research(USA)Frequency rangeDC to 50,000 Hz
Sample frequency10,000 Hz to 200,000 Hz
Sweep rateLinear from zero to 100,000 Hz/min or logarithmic from zero to 100,000 octaves/min
Table 2. Vibration transmissibility and damping ratio of PE25 cushion material.
Static Load [kPa]Zone InterfaceTemperature [°C]
−200+20+40
3.488Direct coupling/amplificationFrequency [Hz]15.939813.978312.230012.0621
Transmissibility1.10041.10161.10031.1007
Damping ratio1.08901.08211.08941.0869
Peak transmissibilityFrequency [Hz]44.433140.149934.013332.5566
Transmissibility8.84977.24796.70846.1717
Damping ratio0.05650.06900.07450.0810
Amplification/attenuationFrequency [Hz]69.952863.941954.419052.4496
Transmissibility0.99000.98760.99480.9989
Damping ratio
4.651Direct coupling/amplificationFrequency [Hz]13.978312.486211.413310.6266
Transmissibility1.10031.10121.10041.1026
Damping ratio1.08941.08451.08861.0767
Peak transmissibilityFrequency [Hz]42.628335.290431.019129.2830
Transmissibility9.24236.95817.03257.3457
Damping ratio0.05410.07190.07110.0681
Amplification/attenuationFrequency [Hz]67.421357.116447.612645.8895
Transmissibility0.99400.99330.99790.9985
Damping ratio
6.976Direct coupling/amplificationFrequency [Hz]11.979011.545510.949710.1481
Transmissibility1.10111.10061.10011.1007
Damping ratio1.08511.08791.09081.0870
Peak transmissibilityFrequency [Hz]35.946832.858029.350628.1584
Transmissibility9.24409.08609.61139.3520
Damping ratio0.05410.05500.05200.0535
Amplification/attenuationFrequency [Hz]55.944451.137245.155443.9242
Transmissibility0.99760.99840.99030.9931
Damping ratio
Table 3. Vibration transmissibility and damping ratio of PE30 cushion material.
Static Load [kPa]Zone InterfaceTemperature [°C]
−200+20+40
3.488Direct coupling/amplificationFrequency [Hz]28.158421.259217.041115.0825
Transmissibility1.10031.10141.10121.1011
Damping ratio1.08941.08341.08451.0849
Peak transmissibilityFrequency [Hz]84.303562.485748.164242.7266
Transmissibility7.83307.46286.45796.2995
Damping ratio0.06380.06700.07740.0794
Amplification/attenuationFrequency [Hz]137.70699.742975.304567.8889
Transmissibility0.99560.99600.99500.9935
Damping ratio
4.651Direct coupling/amplificationFrequency [Hz]21.905517.762612.865812.1458
Transmissibility1.10731.10101.10201.1013
Damping ratio1.05171.08551.07971.0837
Peak transmissibilityFrequency [Hz]68.833853.057337.902935.8641
Transmissibility8.09476.73406.18726.3288
Damping ratio0.06180.07430.08080.0790
Amplification/attenuationFrequency [Hz]106.38981.440156.592555.9444
Transmissibility0.98830.99770.99300.9937
Damping ratio
6.976Direct coupling/amplificationFrequency [Hz]17.238614.238311.951511.0511
Transmissibility1.10061.10091.10501.1022
Damping ratio1.08751.08601.06351.0789
Peak transmissibilityFrequency [Hz]54.670341.561633.392231.8152
Transmissibility7.72157.42787.73908.2612
Damping ratio0.06480.06730.06460.0605
Amplification/attenuationFrequency [Hz]82.383661.770151.491949.1732
Transmissibility0.99970.99370.99270.9938
Damping ratio
Table 4. Vibration transmissibility and damping ratio of XPE cushion material.
Static Load [kPa]Zone InterfaceTemperature [°C]
−200+20+40
3.488Direct coupling/amplificationFrequency [Hz]39.32636.029730.947718.9899
Transmissibility1.10021.10331.10281.1012
Damping ratio1.08971.07291.07531.0846
Peak transmissibilityFrequency [Hz]133.3350114.528094.813762.6298
Transmissibility7.96398.09857.34463.7688
Damping ratio0.06280.06170.06810.1327
Amplification/attenuationFrequency [Hz]222.36188.808148.241130.9
Transmissibility0.99480.98240.99920.9939
Damping ratio
4.651Direct coupling/amplificationFrequency [Hz]36.784630.242925.977117.4785
Transmissibility1.10301.10101.10251.1028
Damping ratio1.07411.08521.07711.0754
Peak transmissibilityFrequency [Hz]124.718099.513475.131250.6682
Transmissibility9.41448.77957.13304.1833
Damping ratio0.05310.05700.07010.1195
Amplification/attenuationFrequency [Hz]184.934152.396119.928102.303
Transmissibility0.99800.99450.99990.9959
Damping ratio
6.976Direct coupling/amplificationFrequency [Hz]29.148424.130916.386614.9786
Transmissibility1.10431.10111.10021.1006
Damping ratio1.06711.08491.09001.0878
Peak transmissibilityFrequency [Hz]97.023378.312248.834539.8734
Transmissibility8.53426.29414.99427.0873
Damping ratio0.05860.07940.10010.0705
Amplification/attenuationFrequency [Hz]158.849128.80682.004964.0894
Transmissibility0.99680.99190.99770.9971
Damping ratio
Publisher’s Note: MDPI stays neutral with regard to jurisdictional claims in published maps and institutional affiliations.