Identification of Groundwater Potential Zones Using Remote Sensing and GIS Techniques: A Case Study of the Shatt Al-Arab Basin


Abstract
:
1. Introduction
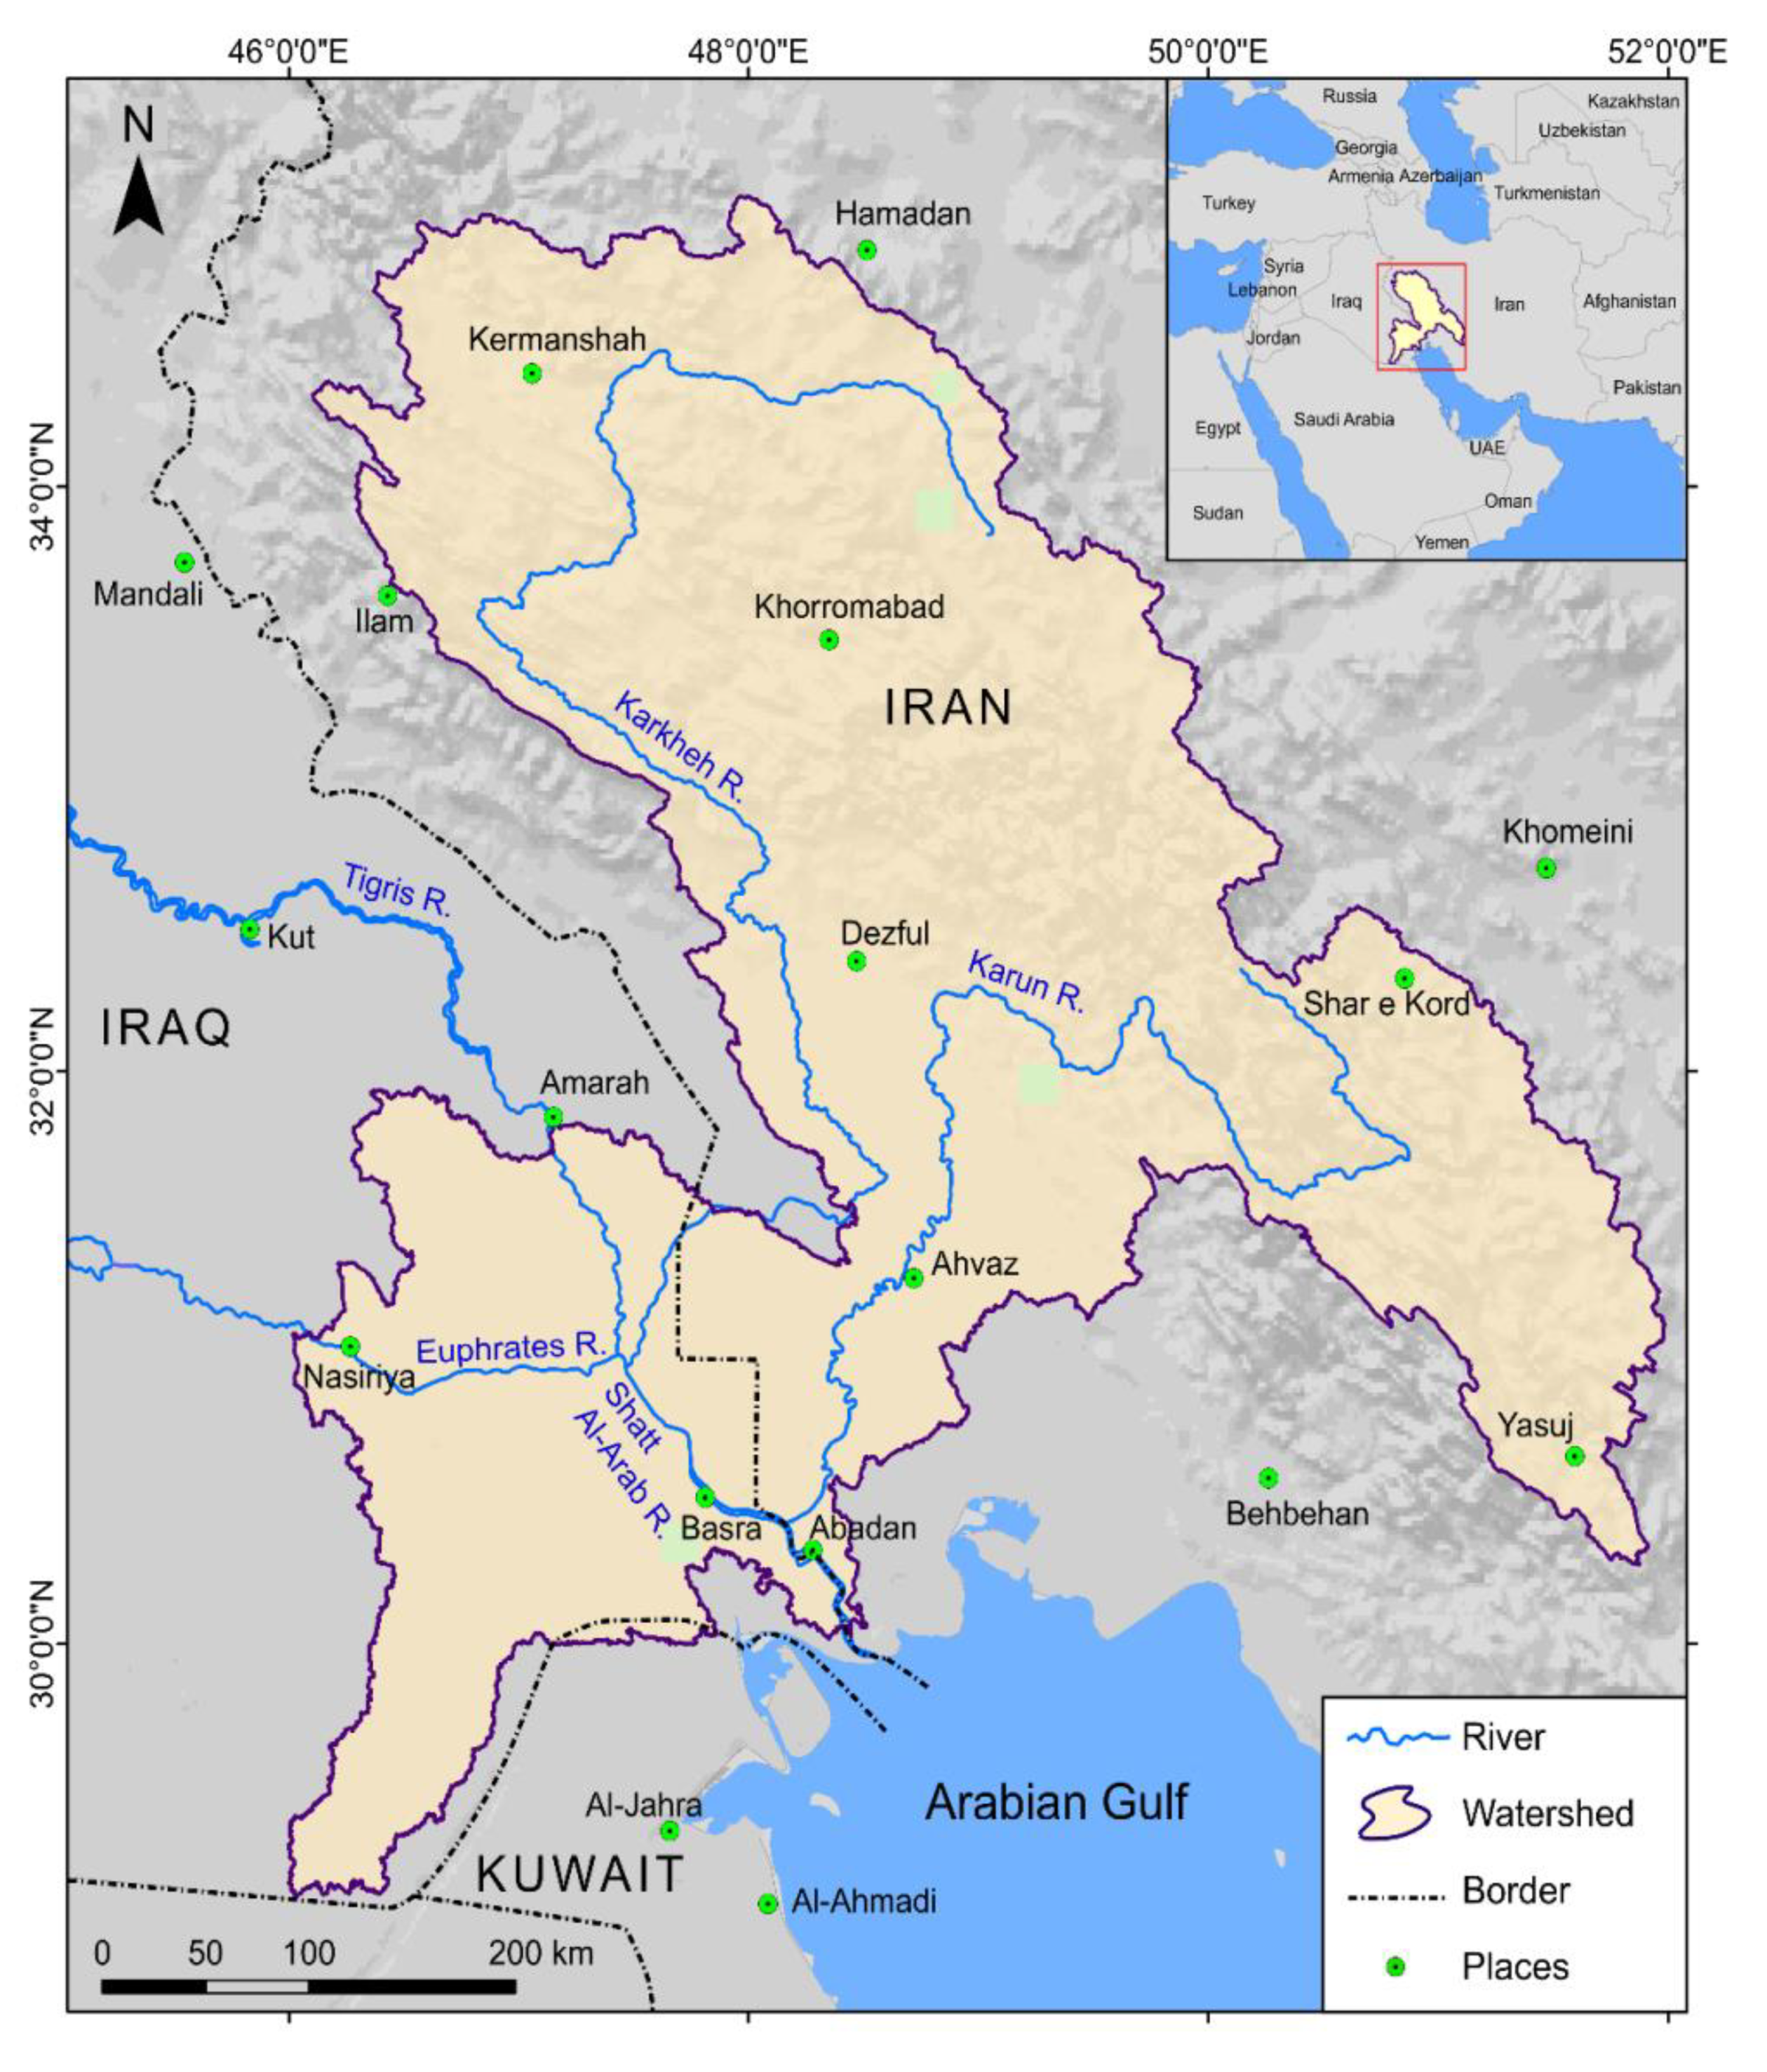
2. Study Area
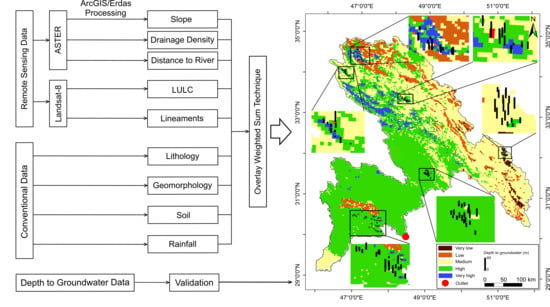
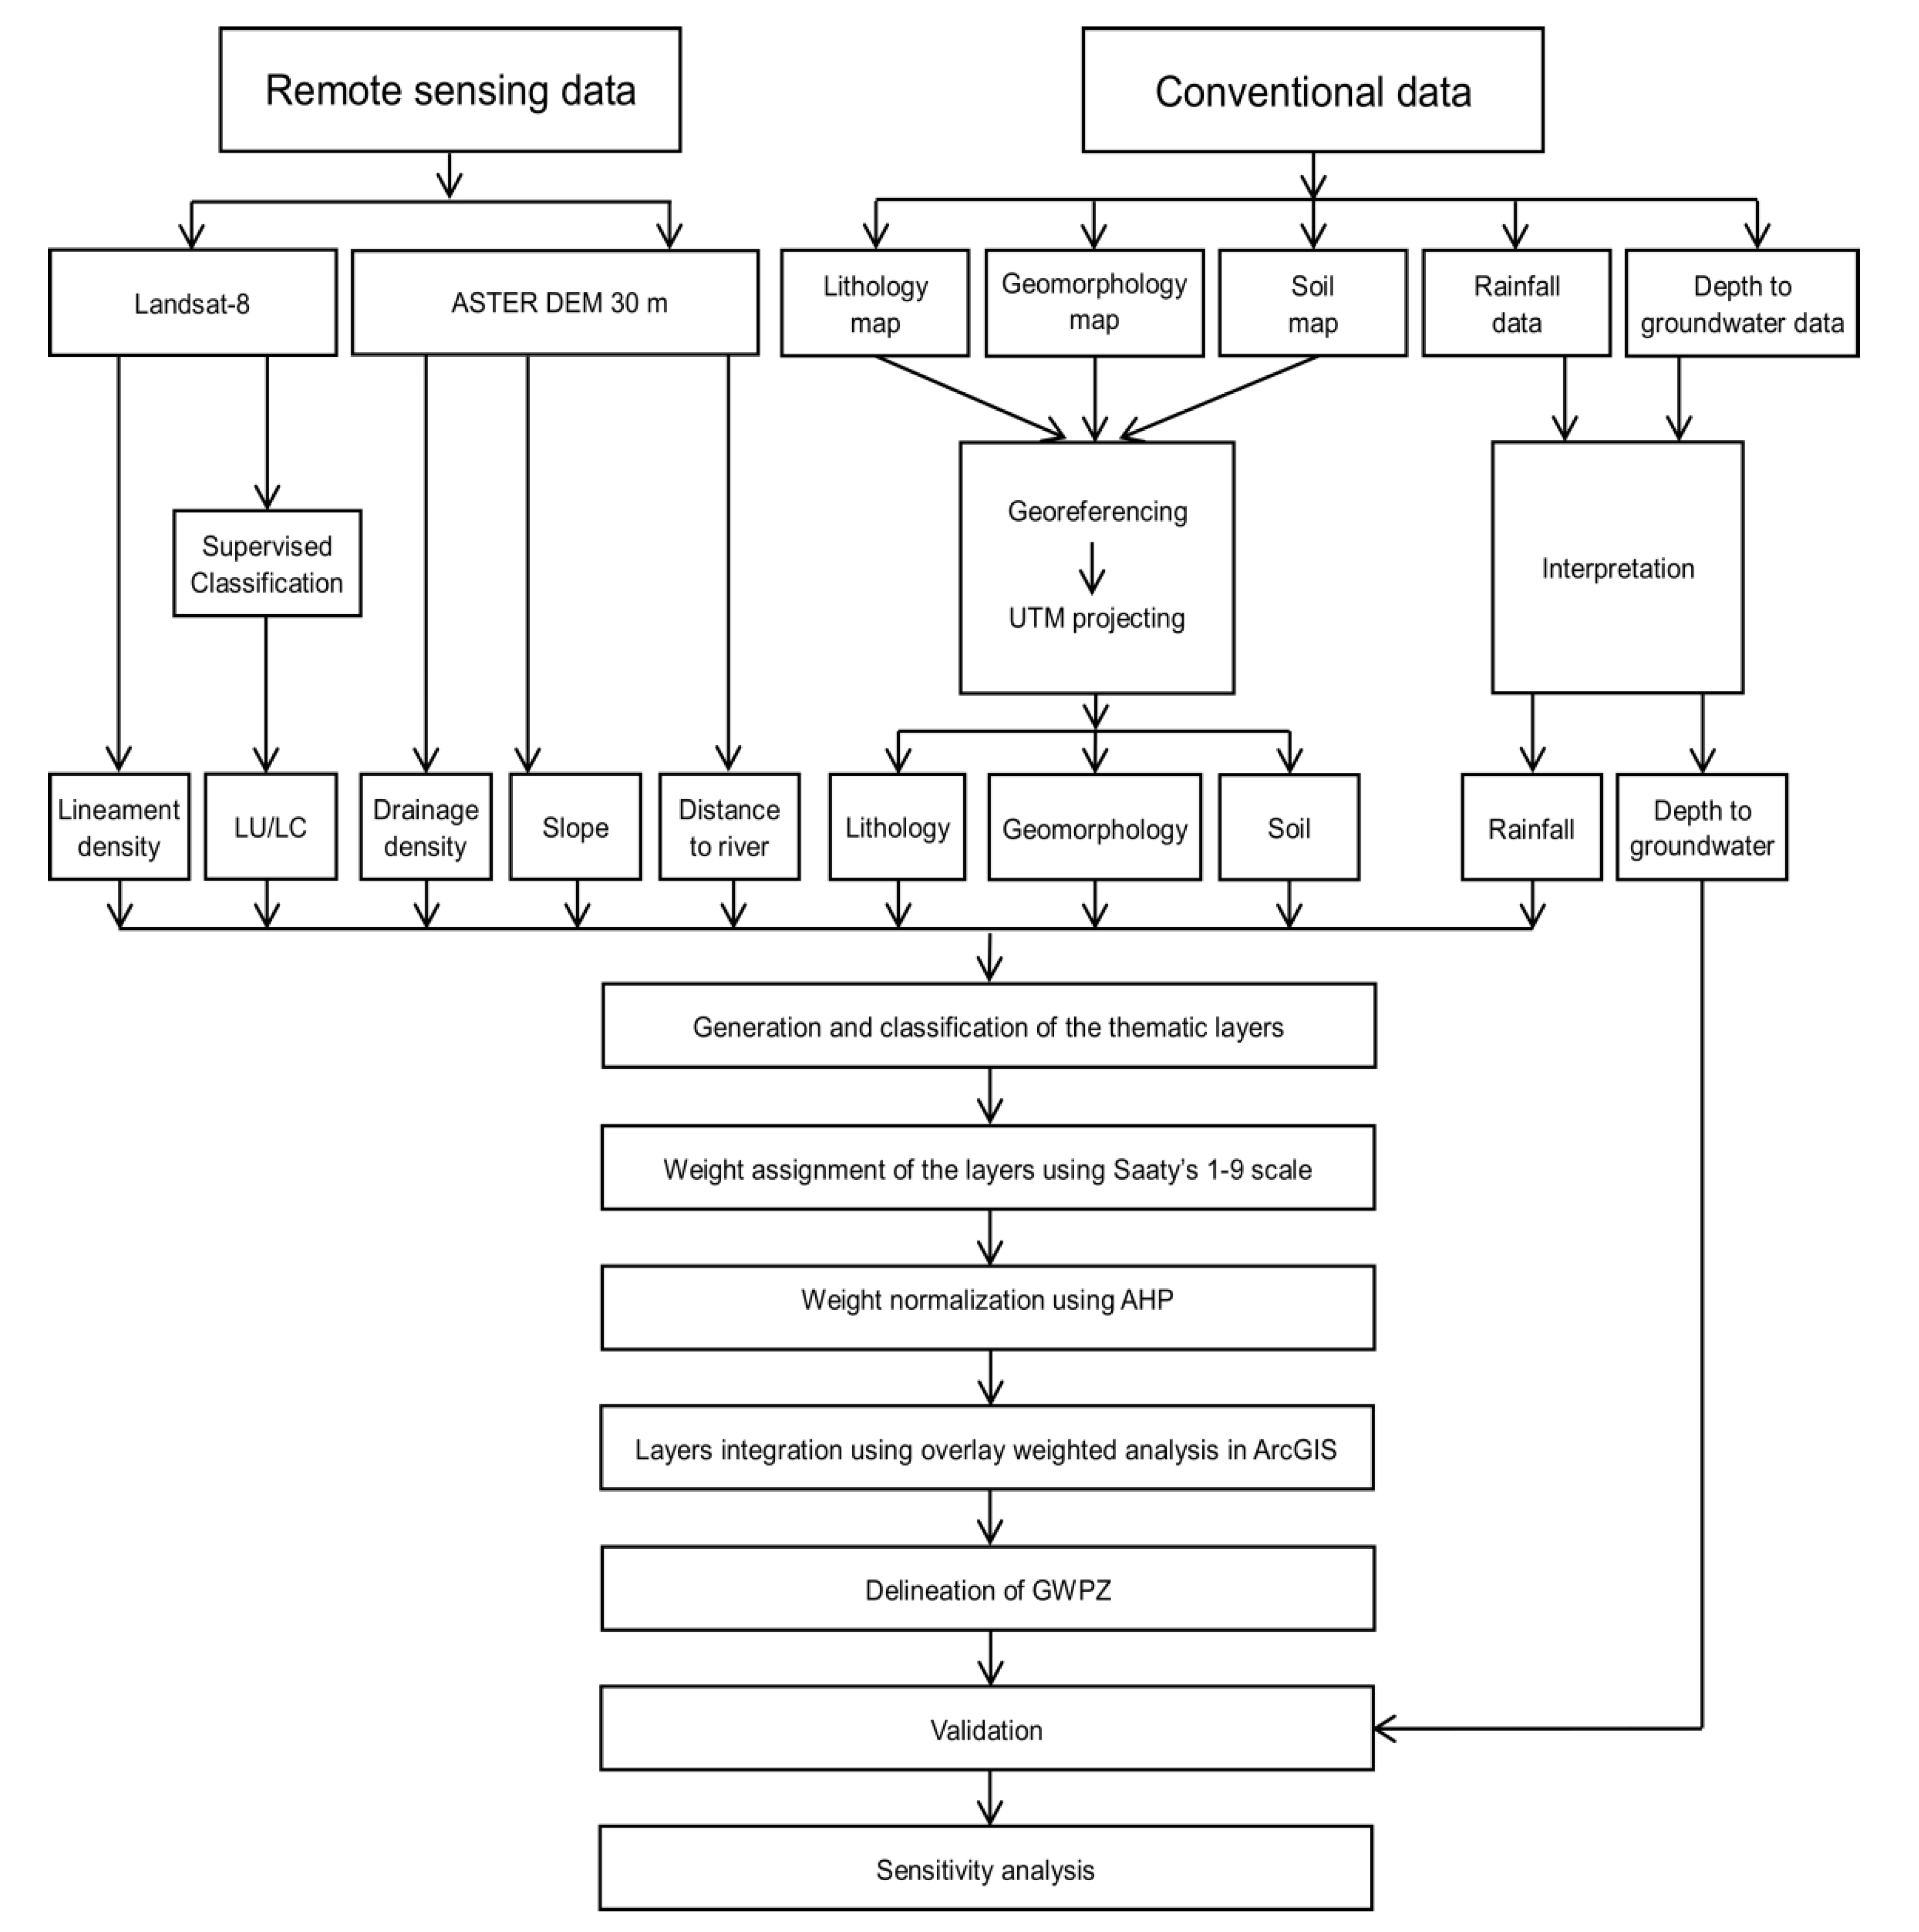
3. Methods
3.1. Analytic Hierarchy Process (AHP)
3.1.1. Selection of Parameters Controlling Groundwater Recharge
3.1.2. Pairwise Comparison Matrix
3.1.3. Assessing Matrix Consistency
3.2. Identification of Groundwater Potential Zones
3.3. Digital Elevation Model and Watershed Delineation
3.4. Factors Influencing Groundwater Recharge Zones
3.4.1. Lithology
3.4.2. Rainfall
3.4.3. Geomorphology
3.4.4. Slope
3.4.5. Drainage Density
3.4.6. Distance to River
3.4.7. Soil Features
3.4.8. Land Use/Land Cover (LULC)
3.4.9. Lineament Density
3.5. Results Validation
3.6. Sensitivity Analysis
4. Results
4.1. Factors Influencing Groundwater Recharge Zones
4.1.1. Lithology
4.1.2. Rainfall
4.1.3. Geomorphology Units
4.1.4. Slope
4.1.5. Drainage Density
4.1.6. Distance to River
4.1.7. Soil Features
4.1.8. Land Use/Land Cover
4.1.9. Lineament Density
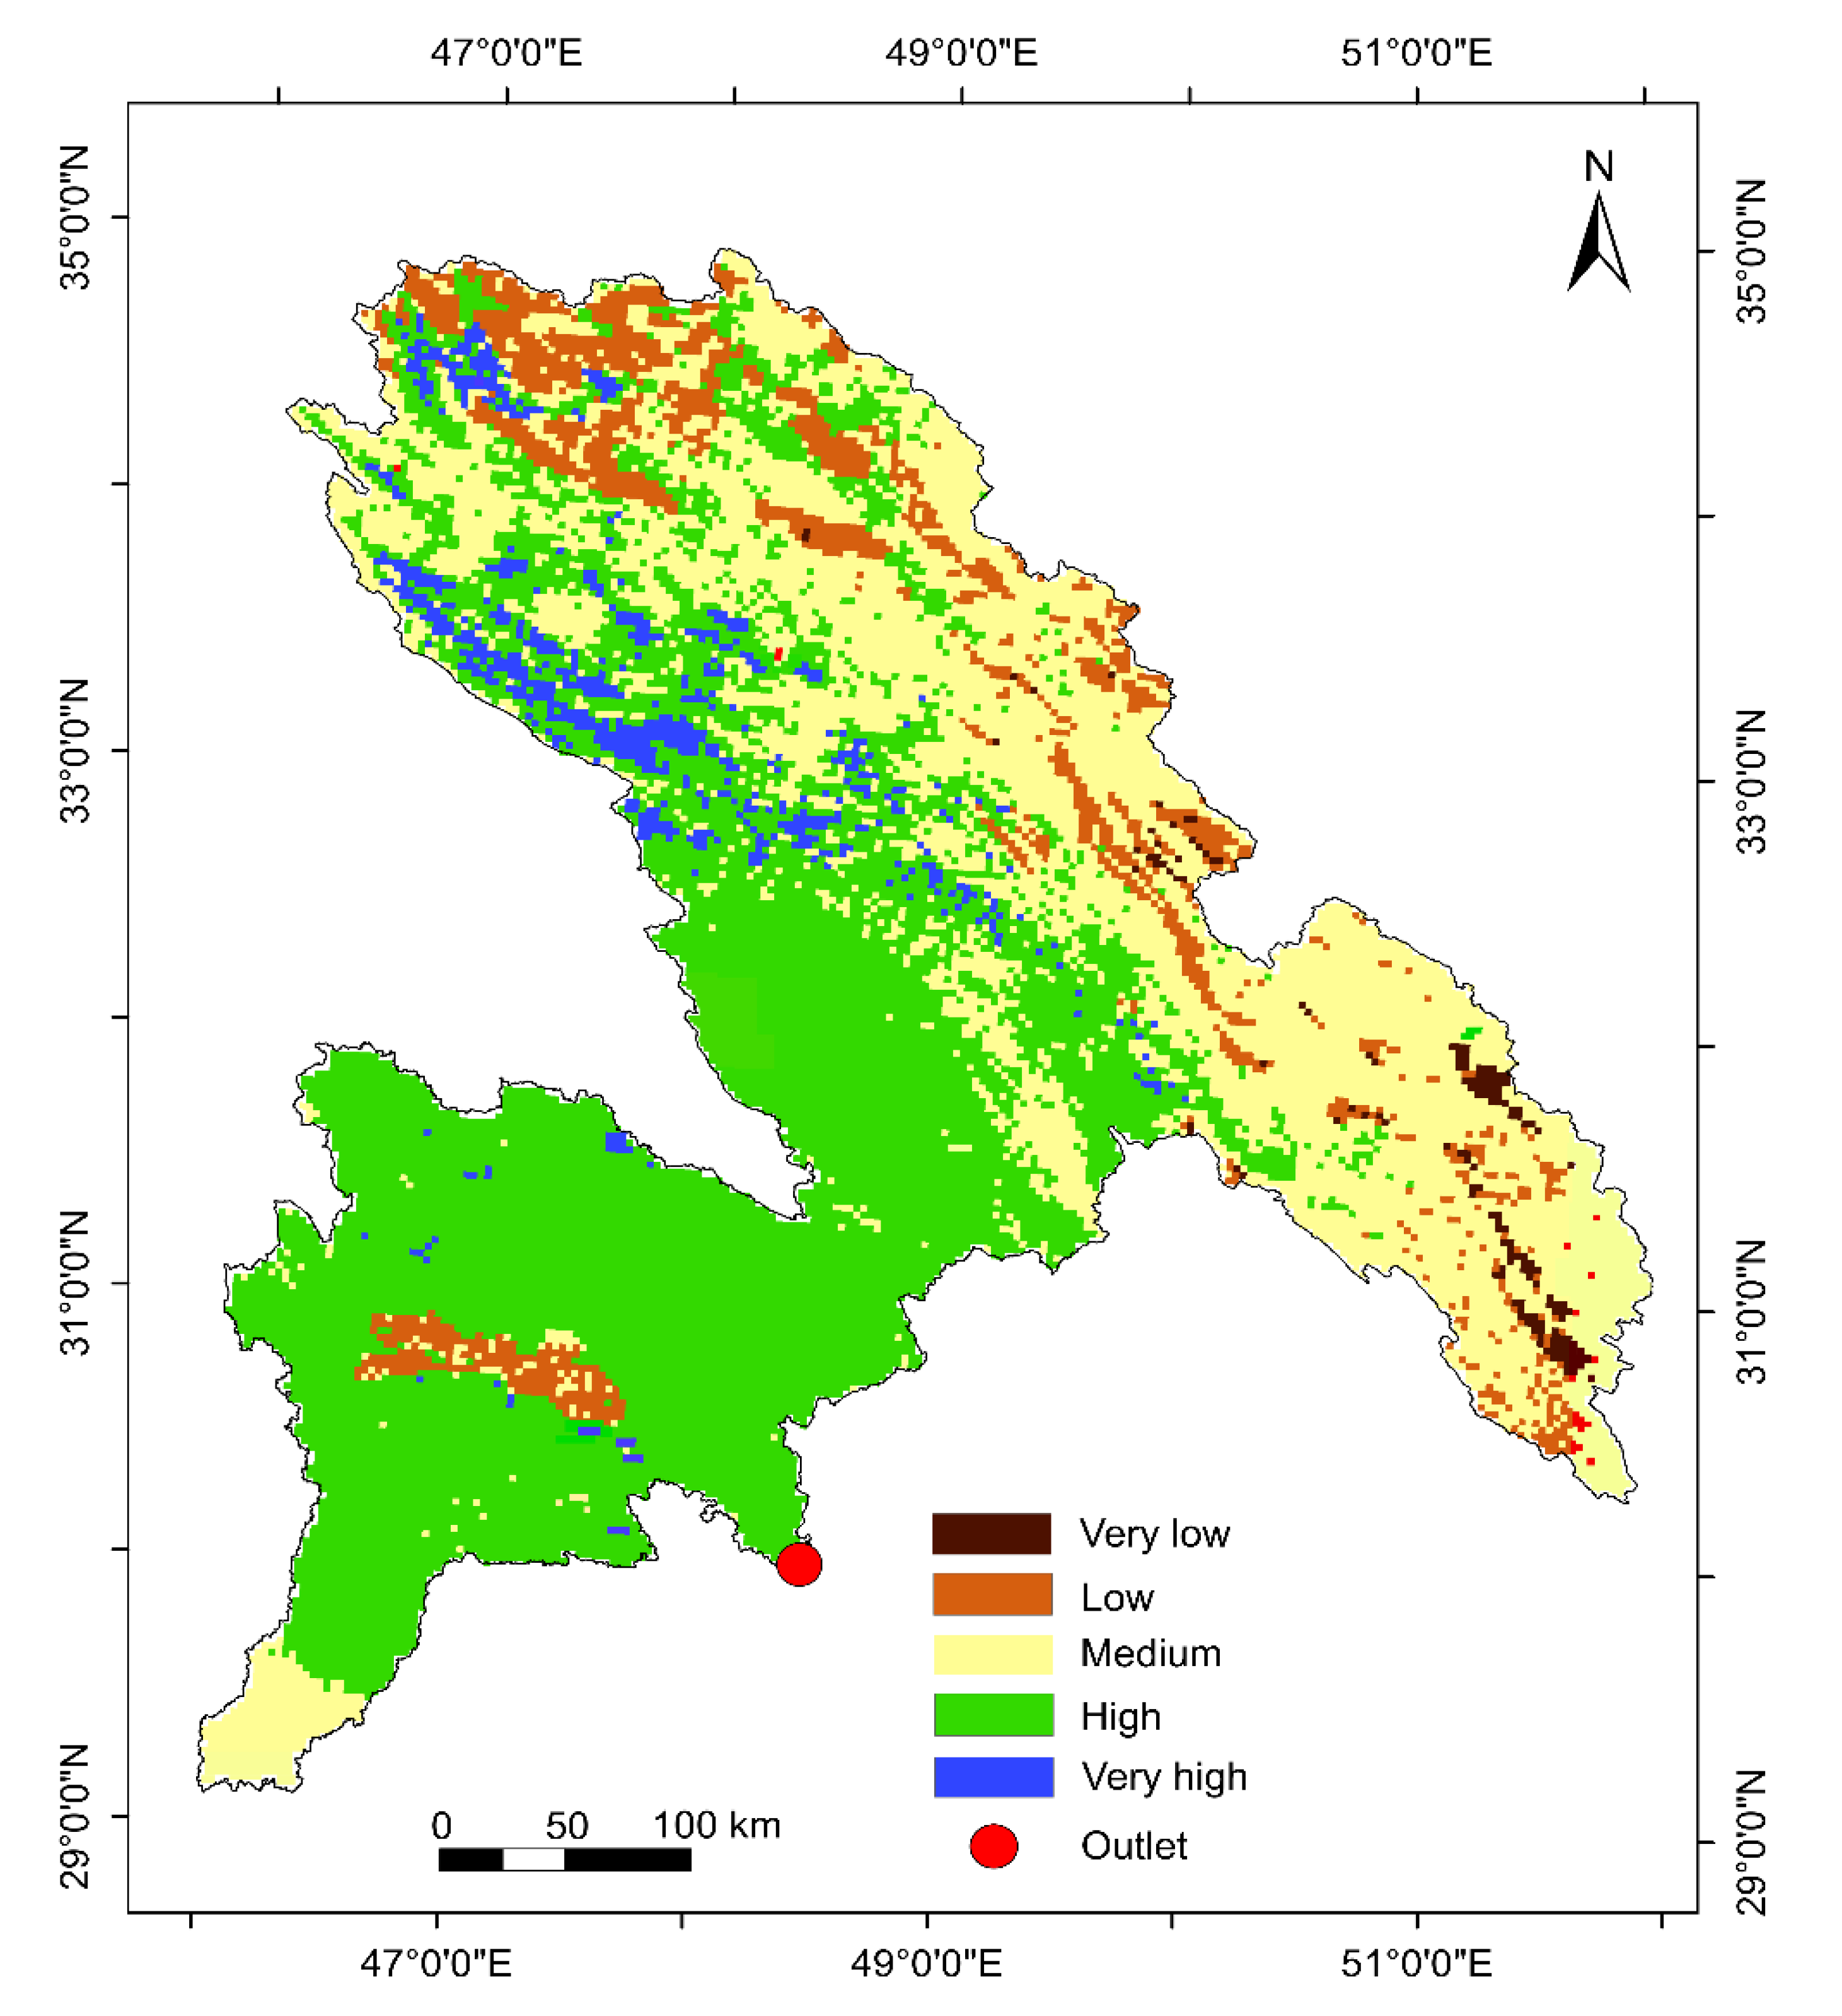
4.2. Groundwater Potential Zoning
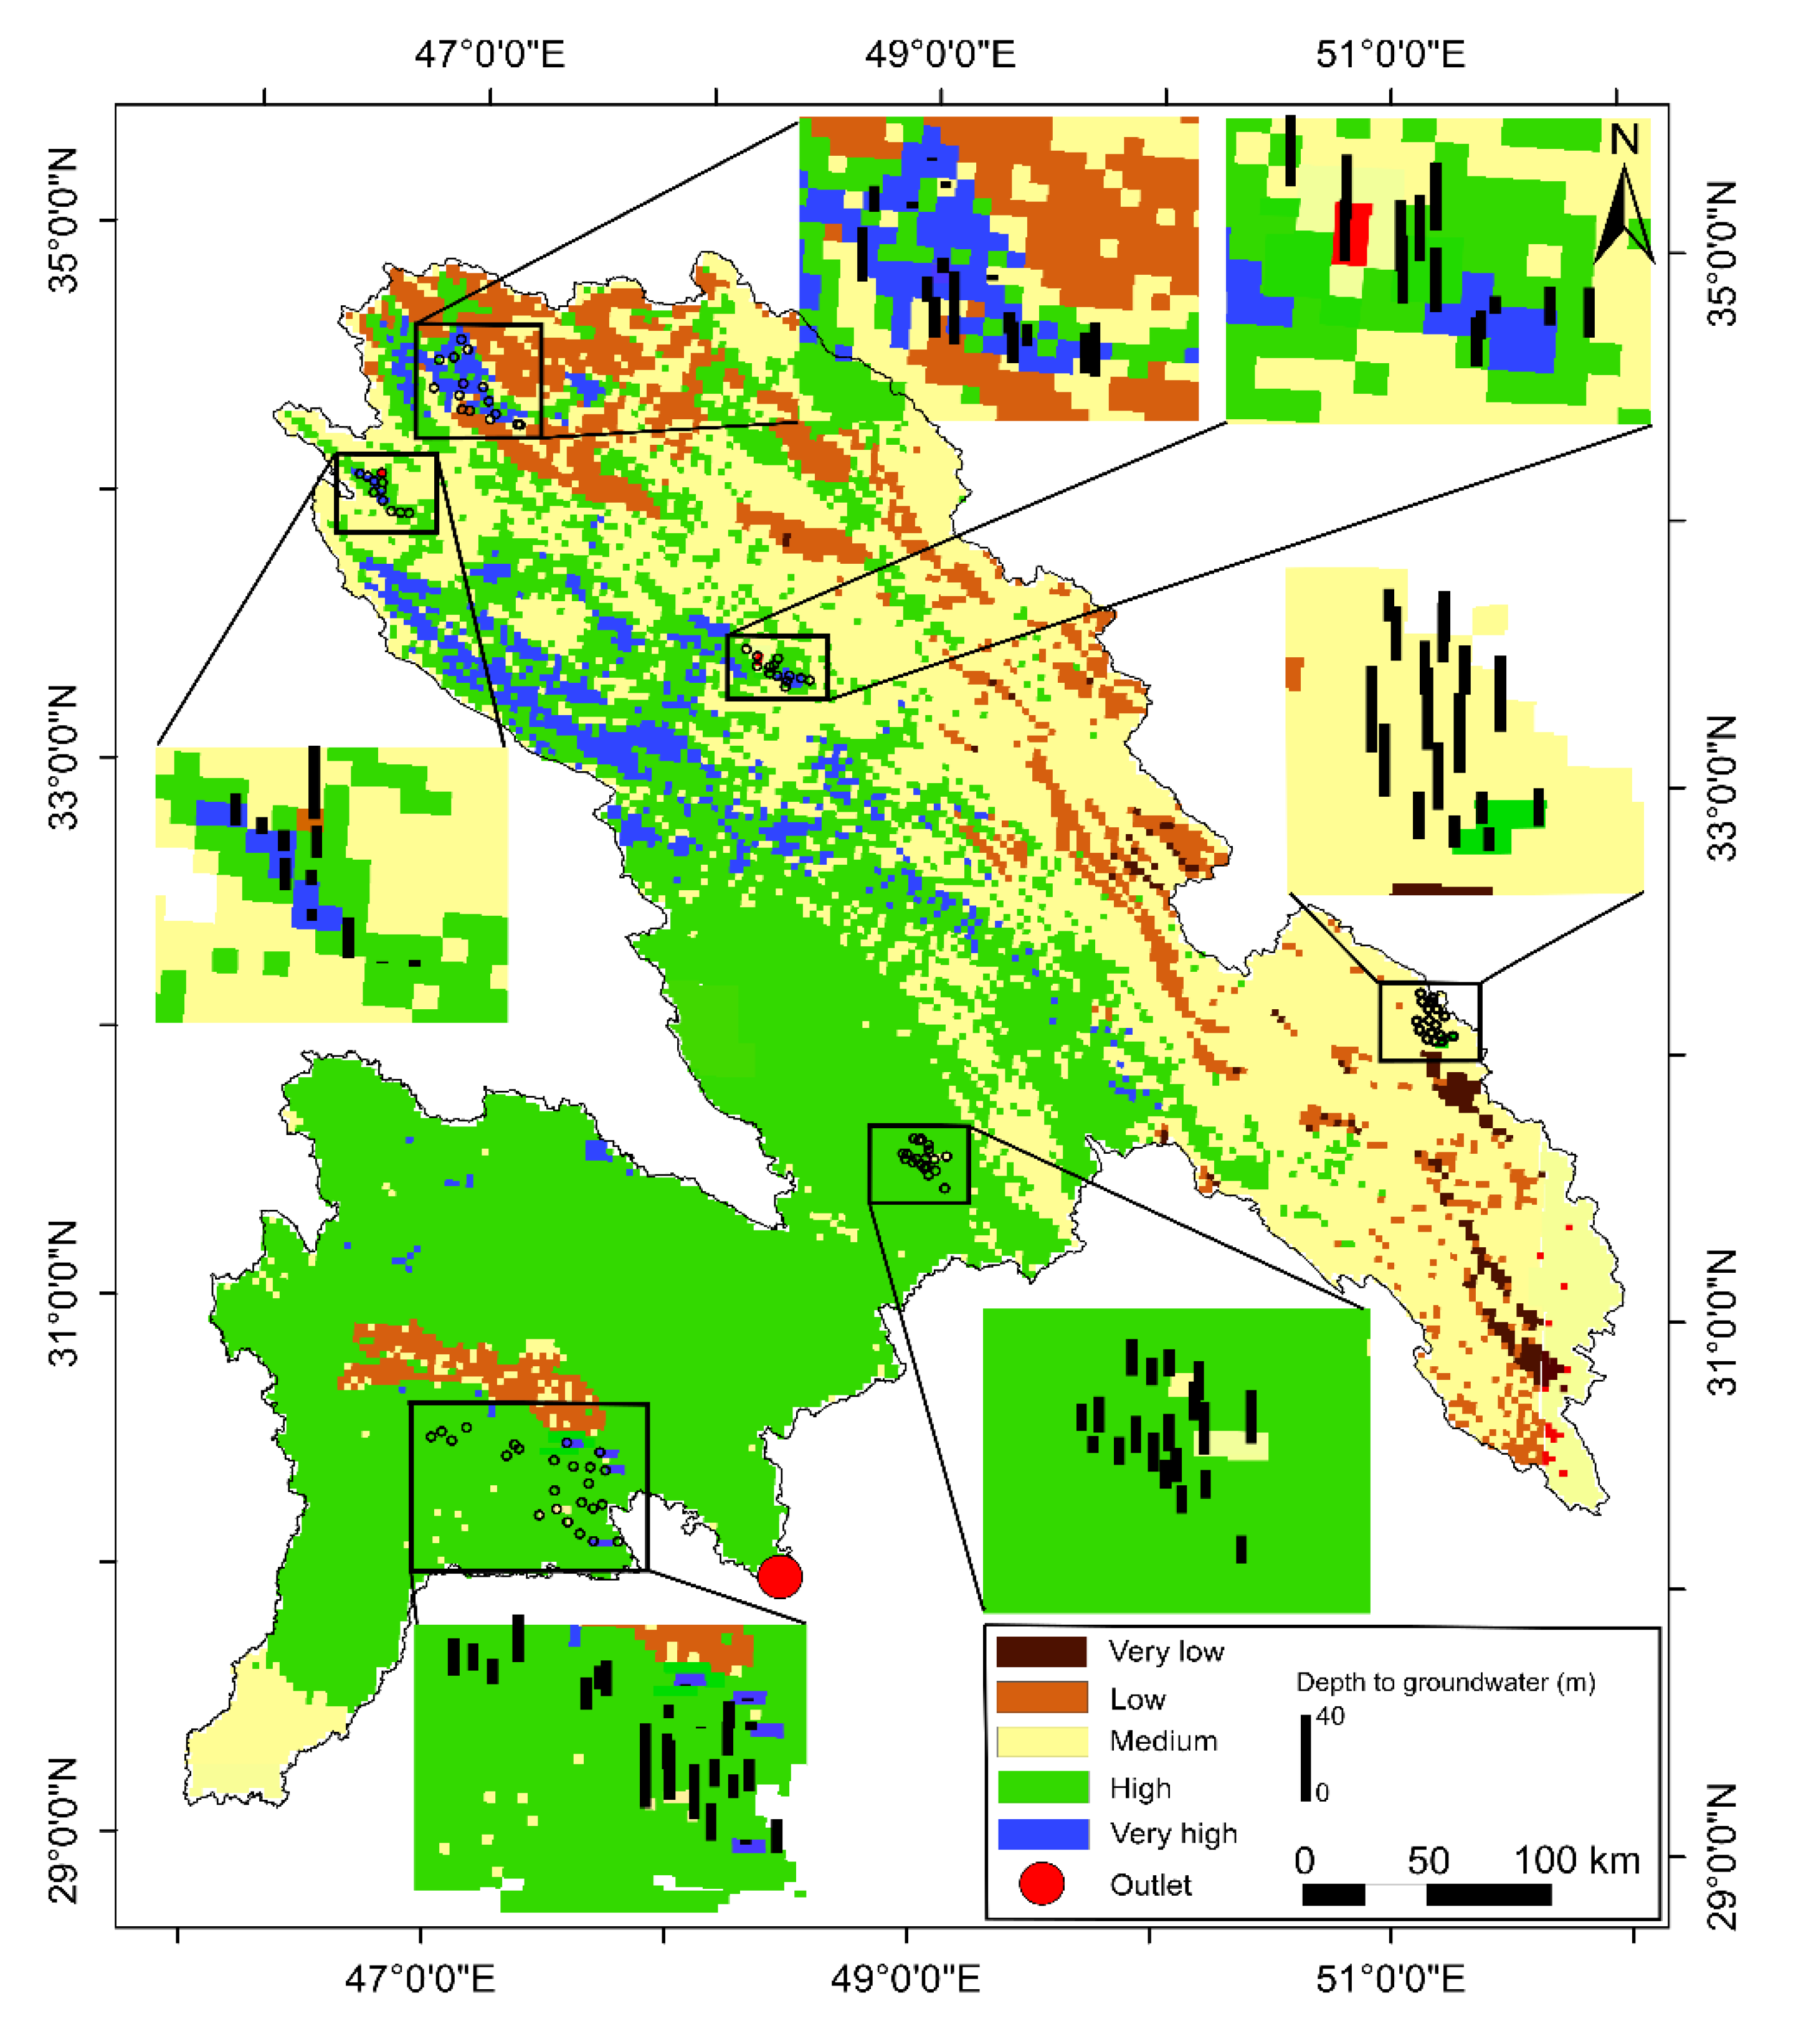
4.3. Results Validation
4.4. Sensitivity Analysis
5. Discussion
5.1. Factors Influencing Groundwater Recharge Zones
5.1.1. Lithology
5.1.2. Rainfall
5.1.3. Geomorphology Units
5.1.4. Slope
5.1.5. Drainage Density
5.1.6. Distance to River
5.1.7. Soil Features
5.1.8. Land Use/Land Cover
5.1.9. Lineament Density
5.2. Groundwater Potential Zoning
5.3. Results Validation
5.4. Sensitivity Analysis
6. Conclusions
Supplementary Materials
Author Contributions
Funding
Data Availability Statement
Acknowledgments
Conflicts of Interest
References
- Heyns, P. Water conservation in arid and semi-arid regions. Water Resources Management—Vol. I. Saveniji, H.H.G., Hoekstra, A.Y., Eds.; Encyclopedia of Life Support Systems (EOLSS)/UNESCO, 2009. Available online: https://www.eolss.net/ebooklib/bookinfo/water-resources-management.aspx# (accessed on 30 December 2020).
- Singh, P.; Thakur, J.; Kumar, S. Delineating groundwater potential zones in a hardrock terrain using geospatial tools. Hydrol. Sci. J. 2013, 58, 213–223. [Google Scholar] [CrossRef] [Green Version]
- Kahil, M.; Dinar, A.; Albiac, J. Modeling water scarcity and droughts for policy adaptation to climate change in arid and semiarid regions. J. Hydrol. 2015, 522, 95–109. [Google Scholar] [CrossRef] [Green Version]
- Opp, C.; Wagemann, J.; Banadjschafie, S.; Abbasi, H. Aral Sea Syndrome and Lake Urmia crisis—A comparison of causes, effects and strategies for problem solutions. In Geoparks and Geo-Tourism in Iran; Dittmann, A., Ed.; Schriften zur Internationalen Entwicklungs- und Umweltforschung; PL Academic Research: Frankfurt, Germany; Bern, Switzerland; Brussels, Belgium; New York, NY, USA; Oxford, UK; Warszawa, Poland; Wien, Austria, 2017; Volume 34, pp. 169–183. [Google Scholar]
- Li, P.; He, S.; Yang, N.; Xiang, G. Groundwater quality assessment for domestic and agricultural purposes in Yan’an City, Northwest China: Implications to sustainable groundwater quality management on the Loess Plateau. Environ. Earth Sci. 2018, 77, 775. [Google Scholar] [CrossRef]
- Li, P.; Qian, H.; Wu, J. Conjunctive use of groundwater and surface water to reduce soil salinization in the Yinchuan Plain, North-West China. Int. J. Water Resour. Dev. 2018, 34, 337–353. [Google Scholar] [CrossRef]
- Scott, K. Can The Middle East Solve Its Water Problem? Available online: https://edition.cnn.com/2018/07/11/middleeast/middle-east-water/index.html (accessed on 6 December 2020).
- Michel, D. Iran’s Impending Water Crisis. Water, Security and US Foreign Policy. In Water, Security and US Foreign Policy; Reed, D., Ed.; Routledge: New York, NY, USA, 2017; pp. 168–188. [Google Scholar]
- Alkhafaji, H. Iraq’s Water Crisis Challenges and Solutions. Al-Bayan Center for Planning and Studies. Available online: http://www.bayancenter.org/en/wp-content/uploads/2018/01/980987665.pdf (accessed on 6 December 2020).
- UNESCO & EU Launching The Second Module of Capacity Building Support For The National Water Sector Of Iraq [EN/AR]—Iraq. Available online: https://reliefweb.int/report/iraq/unesco-eu-launching-second-module-capacity-building-support-national-water-sector-iraq (accessed on 6 December 2020).
- Nabavi, E. Failed policies, falling aquifers: Unpacking groundwater overabstraction in Iran. Water Altern. 2018, 11, 699–724. [Google Scholar]
- Abdullah, A.; Masih, I.; van der Zaag, P.; Karim, U.; Popescu, I.; Al Suhail, Q. Shatt al Arab River system under escalating pressure: A preliminary exploration of the issues and options for mitigation. Int. J. River Basin Manag. 2015, 13, 215–227. [Google Scholar] [CrossRef]
- Al-Tawash, B.; Al-Lafta, H.; Merkel, B. Preliminary Assessment of Shatt Al-Arab Riverine Environment, Basra Governorate, Southern Iraq. J. Nat. Sci. Res. 2013, 3, 120–136. [Google Scholar]
- Al-Saad, H.; Salman, N. Status of Oil Pollution in the Arabian Gulf and Shatt Al-Arab Estuary: A Review. In Coastal Environments: Focus on Asian Regions; Subramanian, V., Ed.; Springer: Dordrecht, The Netherlands, 2012. [Google Scholar] [CrossRef]
- Moyel, M.; Hussain, N. Water quality assessment of the Shatt al-Arab River, Southern Iraq. J. Coast. Life Med. 2015, 3, 459–465. [Google Scholar]
- Mahdi, B. Environmental pollution in Shatt Al-Arab estuary. J. Int. Acad. Res. Multidiscip. 2015, 3, 32–42. [Google Scholar]
- Al-Saedi, A.; Smith, M.; Moles, N.; Alwhaely, U. Implications of Human Activities on the Shatt al Arab River and Khor al Zubair in City of Basra, Southern Iraq. In Proceedings of the 20th EGU General Assembly, EGU2018, Vienna, Austria, 8–13 April 2018; p. 17773. [Google Scholar]
- Maltby, E. An Environmental and Ecological Study of the Marshlands of Mesopotamia: Draft Consultive Bulletin; AMAR Appeals Trust: London, UK, 1994. [Google Scholar]
- Richardson, C.; Reiss, P.; Hussain, N.; Alwash, A.; Pool, D. The Restoration Potential of the Mesopotamian Marshes of Iraq. Science 2005, 307, 1307–1311. [Google Scholar] [CrossRef] [Green Version]
- Al-Gburi, H.; Al-Tawash, B.; Al-Lafta, H. Environmental assessment of Al-Hammar Marsh, Southern Iraq. Heliyon 2017, 3, e00256. [Google Scholar] [CrossRef] [PubMed] [Green Version]
- Abdullah, A.; Karim, U.; Masih, I.; Popescu, I.; Van der Zaag, P. Anthropogenic and tidal influences on salinity levels of the Shatt al-Arab River, Basra, Iraq. Int. J. River Basin Manag. 2016, 14, 357–366. [Google Scholar] [CrossRef]
- Al-Yamani, F. Importance of the freshwater influx from the Shatt-Al-Arab River on the Gulf marine environment. In Protecting the Gulf’s Marine Ecosystems from Pollution; Abuzinada, A.H., Barth, H.J., Krupp, F., Böer, B., Al Abdessalaam, T.Z., Eds.; Birkhäuser: Basel, Switzerland, 2008. [Google Scholar] [CrossRef]
- Motagh, M.; Walter, T.; Sharifi, M.; Fielding, E. Land subsidence in Iran caused by widespread water reservoir overexploitation. Geophys. Res. Lett. 2008, 35, L16403. [Google Scholar] [CrossRef] [Green Version]
- Abdullah, T.; Ali, S.; Al-Ansari, N.; Knutsson, S. Hydrogeochemical Evaluation of Groundwater and Its Suitability for Domestic Uses in Halabja Saidsadiq Basin, Iraq. Water 2019, 11, 690. [Google Scholar] [CrossRef] [Green Version]
- Lashkaripour, G.; Ghafoor, M. The Effects of Water Table Decline on the Groundwater Quality in Aquifer of Torbat Jam Plain, Northeast Iran. Int. J. Emerg. Sci. 2011, 1, 153–163. [Google Scholar]
- Al-Azawi, A.; Ward, F. Groundwater use and policy options for sustainable management in Southern Iraq. Int. J. Water Resour. Dev. 2016, 33, 628–648. [Google Scholar] [CrossRef]
- Voss, K.; Famiglietti, J.; Lo, M.; De Linage, C.; Rodell, M.; Swenson, S. Groundwater depletion in the Middle East from GRACE with implications for transboundary water management in the Tigris-Euphrates-Western Iran region. Water Resour. Res. 2013, 49, 904–914. [Google Scholar] [CrossRef] [Green Version]
- Al-Abadi, A.; Ghlaib, H.; Shahid, S. Flowing well potential zoning at Iraqi southern and western deserts using frequency ratio and geographic information system. Int. J. Environ. Sci. Technol. 2017, 14, 2249–2268. [Google Scholar] [CrossRef]
- Ozdemir, A. Using a binary logistic regression method and GIS for evaluating and mapping the gorundwarer spring potential in the Sultan Mountians (Aksehir, Turkey). J. Hydrol. 2011, 405, 123–136. [Google Scholar] [CrossRef]
- Etikala, B.; Golla, V.; Li, P.; Renati, S. Deciphering groundwater potential zones using MIF technique and GIS: A study from Tirupati area, Chittoor District, Andhra Pradesh, India. HydroResearch 2019, 1, 1–7. [Google Scholar] [CrossRef]
- Anbazhagan, S.; Jothibasu, A. Geoinformatics in groundwater potential mapping and sustainable development: A case study from southern India. Hydrol. Sci. J. 2016, 61, 1109–1123. [Google Scholar] [CrossRef] [Green Version]
- Battaglin, W.; Ltay, L.; Parker, R.; Leavesley, G. Applications of a gis for modeling the sensitivity of water resources to alternations in climate in the gunnisan river basin, Colorado. Water Resour. Bull. Am. Water Res. Assoc. 1993, 25, 1021–1028. [Google Scholar] [CrossRef]
- Saraf, A.K. A Report on Landscape Modelling in Gis for Bankura District, Project Sponsored by DST; NRDMS division Government of India: New Delhi, Delhi, India, 1999. [Google Scholar]
- Das, D.; Behara, S.C.; Kar, A.; Narendra, P.; Guha, S. Hydrogeomorphological mapping in groundwater exploration using remotely sensed data—A case study in Keonjhar District, Orissa. J. Indian Soc. Remote Sens. 1997, 25, 247–259. [Google Scholar] [CrossRef]
- Ravindran, K.V.; Jeyaram, A. Groundwater prospects of Shahbad Tehsil, basan district, eastern Rajasthan. A remote sensing approach. J. Indian Soc. Remote Sens. 1997, 25, 239–246. [Google Scholar] [CrossRef]
- Srinivas Rao, Y.; Reddy, T.; Nayudu, P. Groundwater targeting in hard rock terrain using fracture battern modelling, Niva river basin, Andhra Pradesh, India. Hydrogeol. J. 2000, 8, 494–502. [Google Scholar]
- Sree Devi, P.D.; Srinivasalu, S.; Kesava Raju, K. Hydrogeomorphological and groundwater prospects of the Peregu river basin by using remote sensing data. Environ. Geol. 2001, 40, 1088–1094. [Google Scholar] [CrossRef]
- Gopinath, G.; Saralathan, P. Identification of groundwater prospective zones using IRS-1D LISS and pump test methods. J. Indian Soc. Remote Sens. 2004, 32, 329–342. [Google Scholar] [CrossRef]
- Kuria, D.; Gachari, M.; Macharia, M.; Mungai, E. Mapping groundwater potential in Kitui District, Kenyausing geospatial technologies. Int. J. Water Res. Environ. Eng. 2012, 4, 15–22. [Google Scholar]
- Lillesand, T.M.; Kiefer, R.W.; Chipman, J. Remote Sensing and Image Interpretation; Wiley: New York, NY, USA, 2000. [Google Scholar]
- Murthy, K. Groundwater potential in a semi-arid region of Andhra Pradeshda geographical information system approach. Int. J. Remote Sens. 2000, 21, 1867–1884. [Google Scholar] [CrossRef]
- Solomon, S. Groundwater study using remote sensing and geographic information systems (GIS) in the central highlands of Eritrea. Hydrogeol. J. 2006, 29, 1034–1041. [Google Scholar]
- Chowdhury, A.; Jha, M.; Chowdary, V.; Mal, B. Integrated remote sensing and GIS-based approach for assessing groundwater potential in West Medinipur district, West Bengal, India. Int. J. Remote Sens. 2009, 30, 231–250. [Google Scholar] [CrossRef]
- Murugesan, B.; Thirunavukkarasu, R.; Senapathi, V.; Balasubramanian, G. Application of remote sensing and GIS analysis for groundwater potential zone in Kodaikanal Taluka, South India. Front. Earth Sci. 2012, 7, 65–75. [Google Scholar]
- Elbeih, S. An overview of integrated remote sensing and GIS for groundwater mapping in Egypt. Ain Shams Eng. J. 2014, 6, 1–15. [Google Scholar] [CrossRef] [Green Version]
- Sar, N.; Khan, A.; Chatterjee, S.; Das, A. Hydrologic delineation of ground water potential zones using geospatial technique for Keleghai river basin, India. Model. Earth Syst. Environ. 2015, 1, 25. [Google Scholar] [CrossRef] [Green Version]
- Selvam, S.; Magesh, N.; Chidambaram, S.; Rajamanickam, M.; Sashikkumar, M. A GIS based identification of groundwater recharge potential zones using RS and IF technique: A case study in Ottapidaram taluk, Tuticorin district, Tamil Nadu. Environ. Earth Sci. 2015, 73, 3785–3799. [Google Scholar] [CrossRef]
- Jothibasu, A.; Anbazhagan, S. Spatial mapping of groundwater potential in Ponnaiyar River basin using probabilistic-based frequency ratio model. Model. Earth Syst. Environ. 2017, 3, 33. [Google Scholar] [CrossRef]
- Dar, I.; Sankar, K.; Dar, M. Deciphering groundwater potential zones in hard rock terrain using geospatial technology. Environ. Monit. Assess. 2011, 173, 597–610. [Google Scholar] [CrossRef]
- Hutti, B.; Nijagunappa, R. Identification of groundwater potential zone using Geoinformatics in Ghataprabha basin, North Karnataka, India. Int. J. Geomat. Geosci. 2011, 2, 91–109. [Google Scholar]
- Magesh, N.; Chandrasekar, N.; Soundranayagam, J. Delineation of groundwater potential zones in Theni district, Tamil Nadu, using remote sensing, GIS and MIF techniques. Geosci. Front. 2012, 3, 189–196. [Google Scholar] [CrossRef] [Green Version]
- Mukherjee, P.; Singh, C.; Mukherjee, S. Delineation of groundwater potential zones in arid region of India—A remote sensing and GIS approach. Water Resour. Manag. 2012, 26, 2643–2672. [Google Scholar] [CrossRef]
- Agarwal, E.; Agarwal, R.; Garg, R.; Garg, P. Delineation of groundwater potential zone: An AHP/ANP approach. J. Earth Syst. Sci. 2013, 122, 887–898. [Google Scholar] [CrossRef] [Green Version]
- Awawdeh, M.; Obeidat, M.; Al-Mohammad, M.; Al-Qudah, K.; Jaradat, R. Integrated GIS and remote sensing for mapping groundwater potentiality in the Tulul al Ashaqif, Northeast Jordan. Arab. J. Geosci. 2013, 7, 2377–2392. [Google Scholar] [CrossRef]
- Fashae, O.; Tijani, M.; Talabi, A.; Adedeji, O. Delineation of groundwater potential zones in the crystalline basement terrain of SW-Nigeria: An integrated GIS and remote sensing approach. Appl. Water Sci. 2014, 4, 19–38. [Google Scholar] [CrossRef] [Green Version]
- Kaliraj, S.; Chandrasekar, N.; Magesh, N. Identification of potential groundwater recharge zones in Vaigai upper basin, Tamil Nadu, using GIS-based analytical hierarchical process (AHP) technique. Arab. J. Geosci. 2014, 7, 1385–1401. [Google Scholar] [CrossRef]
- Kumar, T.; Gautam, A.; Kumar, T. Appraising the accuracy of GIS-based multi-criteria decision-making technique for delineation of groundwater potential zones. Water Resour. Manag. 2014, 28, 4449–4466. [Google Scholar] [CrossRef]
- Ghosh, P.; Bandyopadhyay, S.; Jana, N. Mapping of groundwater potential zones in hard rock terrain using geoinformatics: A case of Kumari watershed in western part of West Bengal. Model. Earth Syst. Environ. 2016, 2, 1. [Google Scholar] [CrossRef]
- Hussein, A.; Govindu, V.; Nigusse, A. Evaluation of groundwater potential using geospatial techniques. Appl. Water Sci. 2017, 7, 2447–2461. [Google Scholar] [CrossRef] [Green Version]
- Yeh, H.; Cheng, Y.; Lin, H.; Lee, C. Mapping Groundwater Recharge Potential Zone Using a GIS Approach in Hualian River, Taiwan. Sustain. Environ. Res. 2016, 26, 33–43. [Google Scholar] [CrossRef] [Green Version]
- Maity, D.; Mandal, S. Identification of groundwater potential zones of the Kumari river basin, India: An RS & GIS based semi-quantitative approach. Environ. Dev. Sustain. 2017, 21, 1013–1034. [Google Scholar] [CrossRef]
- Pinto, D.; Shrestha, S.; Babel, M.; Ninsawat, S. Delineation of groundwater potential zones in the Comoro watershed, Timor Leste using GIS, remote sensing and analytic hierarchy process (AHP) technique. Appl. Water Sci. 2017, 7, 503–519. [Google Scholar] [CrossRef] [Green Version]
- Das, B.; Pal, S.; Malik, S.; Chakrabortty, R. Modeling groundwater potential zones of Puruliya district, West Bengal, India using remote sensing and GIS techniques. Geol. Ecol. Landsc. 2018, 3, 223–237. [Google Scholar] [CrossRef] [Green Version]
- Gnanachandrasamy, G.; Yongzhang, Z.; Bagyaraj, M.; Venkatramanan, S.; Ramkumar, T.; Shugong, W. Remote Sensing and GIS Based Groundwater Potential Zone Mapping in Ariyalur District, Tamil Nadu. J. Geol. Soc. India 2018, 92, 484–490. [Google Scholar] [CrossRef]
- Lakshmi, S.; Reddy, Y. Identification of groundwater potential zones using GIS and remote sensing. Int. J. Pure Appl. Math. 2018, 119, 3195–3210. [Google Scholar]
- Nasir, M.; Khan, S.; Zahid, H.; Khan, A. Delineation of groundwater potential zones using GIS and multi influence factor (MIF) techniques: A study of district Swat, Khyber Pakhtunkhwa, Pakistan. Environ. Earth Sci. 2018, 77, 367. [Google Scholar] [CrossRef]
- Patra, S.; Mishra, P.; Mahapatra, S. Delineation of groundwater potential zone for sustainable development: A case study from Ganga Alluvial Plain covering Hooghly district of India using remote sensing, geographic information system and analytic hierarchy process. J. Clean. Prod. 2018, 172, 2485–2502. [Google Scholar] [CrossRef]
- Arulbalaji, P.; Padmalal, D.; Sreelash, K. GIS and AHP Techniques Based Delineation of Groundwater Potential Zones: A case study from Southern Western Ghats, India. Sci. Rep. 2019, 9, 2082. [Google Scholar] [CrossRef]
- Choubin, B.; Rahmati, O.; Soleimani, F.; Alilou, H.; Moradi, E.; Alamdari, N. Regional Groundwater Potential Analysis Using Classification and Regression Trees. In Spatial Modeling in GIS and R for Earth and Environmental Sciences, 1st ed.; Pourghasemi, H.R., Gokceoglu, C., Eds.; Elsevier: Amsterdam, The Netherlands, 2019; pp. 485–498. [Google Scholar] [CrossRef]
- Kanagaraj, G.; Suganthi, S.; Elango, L.; Magesh, N. Assessment of groundwater potential zones in Vellore district, Tamil Nadu, India using geospatial techniques. Earth Sci. Inf. 2019, 12, 211–223. [Google Scholar] [CrossRef]
- Raju, R.; Raju, G.; Rajasekhar, M. Identification of groundwater potential zones in Mandavi River basin, Andhra Pradesh, India using remote sensing, GIS and MIF techniques. HydroResearch 2019, 2, 1–11. [Google Scholar] [CrossRef]
- Arshad, A.; Zhang, Z.; Zhang, W.; Dilawar, A. Mapping favorable groundwater potential recharge zones using a GIS-based analytical hierarchical process and probability frequency ratio model: A case study from an agro-urban region of Pakistan. Geosci. Front. 2020. [Google Scholar] [CrossRef]
- Benjmel, K.; Amraoui, F.; Boutaleb, S.; Ouchchen, M.; Tahiri, A.; Touab, A. Mapping of Groundwater Potential Zones in Crystalline Terrain Using Remote Sensing, GIS Techniques, and Multicriteria Data Analysis (Case of the Ighrem Region, Western Anti-Atlas, Morocco). Water 2020, 12, 471. [Google Scholar] [CrossRef] [Green Version]
- Dar, T.; Rai, N.; Bhat, A. Delineation of potential groundwater recharge zones using analytical hierarchy process (AHP). Geol. Ecol. Landsc. 2020. [Google Scholar] [CrossRef] [Green Version]
- Kolli, M.; Opp, C.; Groll, M. Mapping of potential groundwater recharge zones in the Kolleru Lake catchment, India, by using remote sensing and GIS techniques. Nat. Resour. 2020, 11, 127–145. [Google Scholar] [CrossRef] [Green Version]
- Kumar, V.; Mondal, N.; Ahmed, S. Identification of Groundwater Potential Zones Using RS, GIS and AHP Techniques: A Case Study in a Part of Deccan Volcanic Province (DVP), Maharashtra, India. J. Indian Soc. Remote Sens. 2020, 48, 497–511. [Google Scholar] [CrossRef]
- Selvarani, A.G.; Elangovan, K.; Kumar, C. Evaluation of groundwater potential zones using electrical resistivity and GIS in Noyyal River basin, Tamil Nadu. J. Geol. Soc. India 2016, 87, 573–582. [Google Scholar] [CrossRef]
- Machiwal, D.; Madan, K.; Jha, M.; Bimal, C.; Mal, B. Assessment of groundwater potential in a semi-arid region of India using remote sensing, GIS and MCDM techniques. Water Resour. Manag. 2011, 25, 1359–1386. [Google Scholar] [CrossRef]
- Falah, F.; Ghorbani Nejad, S.; Rahmati, O.; Daneshfar, M.; Zeinivand, H. Applicability of generalized additive model in groundwater potential modelling and comparison its performance by bivariate statistical methods. Geocarto Int. 2017, 32, 1069–1089. [Google Scholar] [CrossRef]
- Sashikkumar, M.; Selvam, S.; Kalyanasundaram, V.; Johnny, J. GIS based groundwater modeling study to assess the effect of artificial recharge: A case study from Kodaganar river basin, Dindigul district, Tamil Nadu. J. Geol. Soc. India 2017, 89, 57–64. [Google Scholar] [CrossRef]
- Saranya, T.; Saravanan, S. Groundwater potential zone mapping using analytical hierarchy process (AHP) and GIS for Kancheepuram District, Tamilnadu, India. Model. Earth Syst. Environ. 2020, 6, 1105–1122. [Google Scholar] [CrossRef]
- Saaty, T. Group decision making and the AHP. In The Analytic Hierarchy Process; Golden, B.L., Wasil, E.A., Harker, P.T., Eds.; Springer: Berlin/Heidelberg, Germany, 1980. [Google Scholar]
- Saaty, T. The Analytic Hierarchy Process, 12th ed.; McGraw-Hill International Book Co.: New York, NY, USA, 1980. [Google Scholar]
- Saaty, T. Decision Making for Leaders: The Analytic Hierarchy Process for Decisions in a Complex World; RWS Publications: Pittsburgh, PA, USA, 2014. [Google Scholar]
- Brunelli, M. Introduction to the Analytic Hierarchy Process; Springer: New York, NY, USA, 2015. [Google Scholar]
- Souissi, D.; Msaddek, M.; Zouhri, L.; Chenini, I.; El May, M.; Dlala, M. Mapping groundwater recharge potential zones in arid region using GIS and Landsat approaches, southeast Tunisia. Hydrol. Sci. J. 2018, 63, 251–268. [Google Scholar] [CrossRef]
- Rahaman, S.; Ajeez, S.; Aruchamy, S.; Jegankumar, R. Prioritization of Sub Watershed Based on Morphometric Characteristics Using Fuzzy Analytical Hierarchy Process and Geographical Information System—A Study of Kallar Watershed, Tamil Nadu. Aquat. Procedia 2015, 4, 1322–1330. [Google Scholar] [CrossRef]
- Bisson, R.; Lehr, J. Sudan Case Studies and Model. In Modern Groundwater Exploration; Bisson, R.A., Lehr, J.H., Eds.; John Wiley & Sons: Hoboken, NJ, USA, 2014. [Google Scholar]
- Naghibi, S.; Pourghasemi, H.; Pourtaghi, Z.; Rezaei, A. Groundwater qanat potential mapping using frequency ratio and Shannon’s entropy models in the Moghan watershed, Iran. Earth Sci. Inf. 2015, 8, 171–186. [Google Scholar] [CrossRef]
- Mallick, J.; Khan, R.; Ahmed, M.; Alqadhi, S.; Alsubih, M.; Falqi, I.; Abul Hasan, M. Modeling Groundwater Potential Zone in a Semi-Arid Region of Aseer Using Fuzzy-AHP and Geoinformation Techniques. Water 2019, 11, 2656. [Google Scholar] [CrossRef] [Green Version]
- Malczewski, J. GIS-based multicriteria decision analysis: A survey of the literature. Int. J. Geogr. Inf. Sci. 2006, 20, 703–726. [Google Scholar] [CrossRef]
- UN-ESCWA and BGR (United Nations Economic and Social Commission for Western Asia; Bundesanstalt für Geowissenschaften und Rohstoffe). Inventory of Shared Water Resources in Western Asia. Beirut. Available online: https://waterinventory.org/sites/waterinventory.org/files/chapters/Chapter-05-Shatt-al-Arab-Karkheh-and-Karun-Rivers-web_0.pdf (accessed on 6 December 2020).
- Buday, T.; Jassim, S. Final Report and the Regional Geological Survey of Iraq; Unpub. Report SOM; Library Tectonic Framework: Baghdad, Iraq, 1984; Volume 2. [Google Scholar]
- Aqrawi, A.; Goff, J.; Horbury, A.; Sadooni, F. The Petroleum Geology of Iraq; Scientific Press Ltd.: Beaconsfield, UK, 2010; 424p. [Google Scholar]
- Al-Musawi, F.; Idan, R.; Salih, A. Reservoir Properties and Facies Distribution of Mishrif Formation in Ratawi Oilfield, Southern Iraq. In The Structural Geology Contribution to the Africa-Eurasia Geology: Basement and Reservoir Structure, Ore Mineralisation and Tectonic Modelling; Rossetti, F., Blanc, A.C., Riguzzi, F., Leroux, E., Pavlopoulos, K., Bellier, O., Kapsimalis, V., Eds.; Advances in Science, Technology & Innovation (IEREK Interdisciplinary Series for Sustainable Development); Springer: Cham, Switzerland, 2019. [Google Scholar] [CrossRef]
- Idan, R.; Al-Musawi, F.; Salih, A.; Al-Qaraghuli, S. The Petroleum System of Zubair Formation in Zubair Subzone, Southern Iraq. J. Pet. Res. Stud. 2019, 25, E57–E73. [Google Scholar]
- Berberian, M.; King, G. Towards the paleogeography and tectonic evolution of Iran. Can. J. Earth Sci. 1981, 18, 210–265. [Google Scholar] [CrossRef]
- Issar, I. The groundwater provinces of Iran. Bull. Int. Assoc. Sci. Hydrol. 1969, 14, 87–99. [Google Scholar] [CrossRef]
- Country Data Info. Available online: https://www.laenderdaten.info/ (accessed on 6 December 2020).
- Riad, P.; Billib, M.; Hassan, A.; Salam, M.A.; El Din, M.N. Application of the overlay weighted model and boolean logic to determine the best locations for artificial recharge of groundwater. J. Urban Environ. Eng. 2011, 5, 57–66. [Google Scholar] [CrossRef]
- Lentswe, G.; Molwalefhe, L. Delineation of potential groundwater recharge zones using analytic hierarchy process-guided GIS in the semi-arid Motloutse watershed, eastern Botswana. J. Hydrol. Reg. Stud. 2020, 28, 100674. [Google Scholar] [CrossRef]
- Selvam, S.; Farooq, A.; Magesh, N.; Singaraja, C.; Venkatramanan, S.; Chung, S. Application of remote sensing and GIS for delineating groundwater recharge potential zones of Kovilpatti Municipality, Tamil Nadu using IF technique. Earth Sci. Inf. 2016, 9, 137–150. [Google Scholar] [CrossRef]
- Tolche, A. Groundwater potential mapping using geospatial techniques: A case study of Dhungeta-Ramis sub-basin, Ethiopia. Geol. Ecol. Landsc. 2020. [Google Scholar] [CrossRef]
- Rahmati, O.; Samani, A.; Mahdavi, M.; Pourghasemi, H.; Zeinivand, H. Groundwater potential mapping at Kurdistan region of Iran using the analytic hierarchy process and GIS. Arab. J. Geosci. 2015, 8, 7059–7071. [Google Scholar] [CrossRef]
- Waikar, M.; Nilawar, A. Identification of Groundwater Potential Zone using Remote Sensing and GIS Technique. Int. J. Innov. Res. Sci. Eng. Technol. 2014, 3, 12163–12174. [Google Scholar]
- Al Saud, M. Mapping potential areas for groundwater storage in Wadi Aurnah Basin, western Arabian Peninsula, using remote sensing and geographic information system techniques. Hydrogeol. J. 2018, 18, 1481–1495. [Google Scholar] [CrossRef]
- Strahler, A. Quantitative Geomorphology of Drainage Basins and Channel Networks. In Handbook of Applied Hydrology; Chow, V., Ed.; McGraw Hill: New York, NY, USA, 1964; pp. 439–476. [Google Scholar]
- Chowdhury, A.; Jha, M.; Chowdary, V. Delineation of groundwater recharge zones and identification of artificial recharge sites in West Medinipur district, West Bengal, using RS, GIS and MCDM techniques. Environ. Earth Sci. 2010, 9, 1209–1222. [Google Scholar] [CrossRef]
- Opp, C. Bodenkörper. In Geographie—Physische Geographie und Humangeographie, 3rd ed.; Gebhardt, H., Glaser, R., Radtke, U., Reuber, P., Vött, A., Eds.; Springer: Berlin, Germany, 2011; pp. 485–490. [Google Scholar]
- Saaty, T. Decision-making with the AHP: Why is the principal eigenvector necessary. Eur. J. Oper. Res. 2003, 145, 85–91. [Google Scholar] [CrossRef]
- Goepel, K. Implementing the Analytic Hierarchy Process as a Standard Method for Multi-Criteria Decision Making in Corporate Enterprises—A New AHP Excel Template with Multiple Inputs. In Proceedings of the International Symposium on the Analytic Hierarchy Process, Kuala Lumpur, Malaysia, 23–26 June 2013. [Google Scholar] [CrossRef] [Green Version]
- Machiwal, D.; Rangi, N.; Sharma, A. Integrated knowledge- and data-driven approaches for groundwater potential zoning using GIS and multi-criteria decision-making techniques on hard-rock terrain of Ahar catchment, Rajasthan, India. Environ. Earth Sci. 2015, 73, 1871–1892. [Google Scholar] [CrossRef]
- Saaty, T. How to make a decision: The analytic hierarchy process? Eur. J. Oper. Res. 1990, 48, 9–26. [Google Scholar] [CrossRef]
- Malczewski, J. GIS and Multicriteria Decision Analysis; Wiley: Hoboken, NJ, USA, 1999. [Google Scholar]
- Shaban, A.; Khawlie, M.; Abdallah, C. Use of remote sensing and GIS to determine recharge potential zone: The case of Occidental Lebanon. Hydrogeol. J. 2006, 14, 433–443. [Google Scholar] [CrossRef]
- El-Baz, F.; Himida, I. Groundwater Potential of the Sinai Peninsula, Egypt; Boston University: Boston, MA, USA, 1995. [Google Scholar]
- Universität Hamburg. Available online: https://www.geo.uni-hamburg.de/geologie/forschung/geochemie/glim.html (accessed on 6 December 2020).
- Gebhardt, H.; Glaser, R.; Radtke, U.; Reuber, P. (Eds.) Geographie. Physische Geographie und Humangeographie, 2nd ed.; Springer: Berlin/Heidelberg, Germany, 2011. [Google Scholar]
- Krishnamurthy, J.; Srinivas, G. Role of geological and geomorphological factors in ground water exploration: A study using IRS LISS data. Int. J. Remote Sens. 1995, 16, 2595–2618. [Google Scholar] [CrossRef]
- Suganthi, S.; Elango, L.; Subramanian, S. Groundwater potential zonation by Remote Sensing and GIS techniques and its relation to the Groundwater level in the Coastal part of the Arani and Koratalai River Basin, Southern India. Earth Sci. Res. J. 2013, 17, 87–95. [Google Scholar]
- Gupta, M.; Srivastava, P. Integrating GIS and remote sensing for identification of groundwater potential zones in the hilly terrain of Pavagarh, Gujarat, India. Water Int. 2010, 35, 233–245. [Google Scholar] [CrossRef]
- Satapathy, I.; Syed, T. Characterization of groundwater potential and artificial recharge sites in Bokaro District, Jharkhand (India), using remote sensing and GIS-based techniques. Environ. Earth Sci. 2015, 74, 4215–4232. [Google Scholar] [CrossRef]
- Wooding, R. A hydraulic modelfor the catchment stream problem. III Comparison with runoff observations. J. Hydrol. 1966, 4, 21–37. [Google Scholar] [CrossRef]
- Sener, E.; Davraz, A.; Ozcelik, M. An integration of GIS and remote sensing in groundwater investigations: A case study in Burdur, Turkey. Hydrogeol. J. 2005, 13, 826–834. [Google Scholar] [CrossRef]
- Rajaveni, S.; Brindha, K.; Elango, L. Geological and geomorphological controls on groundwater occurrence in a hard rock region. Appl. Water Sci. 2015, 7, 1377–1389. [Google Scholar] [CrossRef] [Green Version]
- Moghaddam, D.; Rezaei, M.; Pourghasemi, H.; Pourtaghie, Z.; Pradhan, B. Groundwater spring potential mapping using bivariate statistical model and GIS in the Taleghan Watershed, Iran. Arab. J. Geosci. 2015, 8, 913–929. [Google Scholar] [CrossRef]
- Anbazhagan, S.; Ramasamy, S.; Das Gupta, S. Remote sensing and GIS for artificial recharge study, runoff estimation and planning in Ayyar basin, Tamil Nadu, India. Environ. Geol. 2005, 48, 158–170. [Google Scholar] [CrossRef]
- Scanlon, B.; Reedy, R.; Stonestrom, D.; Prudic, D.; Dennehy, K. Impact of land use and land cover change on groundwater recharge and quality in the southwestern US. Glob. Chang. Biol. 2005, 11, 1577–1593. [Google Scholar] [CrossRef]
- USGS. Available online: https://www.usgs.gov/special-topic/water-science-school/science/infiltration-and-water-cycle?qt-science_center_objects=0#qt-science_center_objects (accessed on 6 December 2020).
- Enderle, D.; Weih, R. Integrating supervised and unsupervised classification methods to develop a more accurate land cover classification. J. Ark. Acad. Sci. 2005, 59, 65–73. Available online: http://scholarworks.uark.edu/jaas/vol59/iss1/10 (accessed on 6 December 2020).
- O’Leary, D.; Friedman, J.; Pohn, H. Lineament, linear, lineation: Some proposed new standards for old terms. Geol. Soc. Am. Bull. 1976, 87, 1463–1469. [Google Scholar] [CrossRef]
- Bahiru, E.; Woldai, T. Integrated geological mapping approach and gold mineralization in Buhweju area, Uganda. Ore Geol. Rev. 2016, 72, 777–793. [Google Scholar] [CrossRef]
- Saepuloh, A.; Haeruddin, H.; Heriawan, M.; Kubo, T.; Koike, K.; Malik, D. Application of lineament density extracted from dual orbit of synthetic aperture radar (SAR) images to detecting fluids paths in the Wayang Windu geothermal field (West Java, Indonesia). Geothermics 2018, 72, 145–155. [Google Scholar] [CrossRef]
- Krishna, R.; Kishan, D.; Sarup, J. Lineament extraction and lineament density assessment of Omkareshwar, M P, India, using GIS Techniques. Int. J. Eng. Manag. Res. 2015, 5, 717–720. [Google Scholar]
- Soe, M.; Ryutaro, T.; Ishiyama, D.; Takashima, I.; Won-In, K.; Charusiri, P. Remote sensing and GIS based approach for earthquake probability map: A case study of the northern Sagaing fault area, Myanmar. J. Geol. Soc. Thail. 2009, 1, 29–46. [Google Scholar]
- Muthumaniraja, C.K.; Anbazhagan, S.; Jothibasu, A.; Chinnamuthu, M. Remote Sensing and Fuzzy Logic Approach for Artificial Recharge Studies in Hard Rock Terrain of South India. In GIS and Geostatistical Techniques for Groundwater Science; Elsevier: Amsterdam, The Netherlands, 2019; pp. 91–112. [Google Scholar] [CrossRef]
- Qari, M. Lineament extraction from multi-resolution satellite imagery: A pilot study on Wadi Bani Malik, Jeddah, Kingdom of Saudi Arabia. Arab. J. Geosci. 2011, 4, 1363–1371. [Google Scholar] [CrossRef]
- Chitsazan, M.; Akhtari, Y. A GIS-based DRASTIC Model for Assessing Aquifer Vulnerability in Kherran Plain, Khuzestan, Iran. Water Resour. Manag. 2009, 23, 1137–1155. [Google Scholar] [CrossRef]
- Khodabakhshi, N.; Asadollahfardi, G.; Heidarzadeh, N. Application of a GIS-based DRASTIC model and groundwater quality index method for evaluation of groundwater vulnerability: A case study, Sefid-Dasht. Water Sci. Technol. Water Supply 2015, 15, 784–792. [Google Scholar] [CrossRef]
- Alkinani, M.; Kanoua, W.; Merkel, B. Uranium in groundwater of the Al-Batin Alluvial Fan aquifer, south Iraq. Environ. Earth Sci. 2016, 75, 869. [Google Scholar] [CrossRef]
- Goumehei, E.; Geravandi, Y.; Yan, W. A GIS-Based Study to Investigate Effect of Water Table Changes on DRASTIC Model: A Case Study of Kermanshah, Iran. Int. J. Environ. Geoinform. 2016, 3, 76–82. [Google Scholar] [CrossRef] [Green Version]
- Taheri, K.; Taheri, M.; Parise, M. Impact of intensive groundwater exploitation on an unprotected covered karst aquifer: A case study in Kermanshah Province, western Iran. Environ. Earth Sci. 2016, 75, 1221. [Google Scholar] [CrossRef]
- Yousefi, H.; Haghizadeh, A.; Yarahmadi, Y.; Hasanpour, P.; Noormohamadi, P. Groundwater pollution potential evaluation in Khorramabad-Lorestan Plain, western Iran. J. Afr. Earth. Sci. 2018, 147, 647–656. [Google Scholar] [CrossRef]
- Gogu, R.; Dassargues, A. Sensitivity analysis for the EPIK method of vulnerability assessment in a small karstic aquifer, southern Belgium. Hydrogeol. J. 2000, 8, 337–345. [Google Scholar] [CrossRef]
- Pathak, D.; Hiratsuka, A.; Awata, I.; Chen, L. Groundwater vulnerability assessment in shallow aquifer of Kathmandu Valley using GIS-based DRASTIC model. Environ. Geol. 2009, 57, 1569–1578. [Google Scholar] [CrossRef]
- Lodwick, W.A.; Monson, W.; Svoboda, L. Attribute error and sensitivity analysis of map operations in geographical information systems: Suitability analysis. Int. J. Geogr. Inf. Sci. 1990, 4, 413–428. [Google Scholar] [CrossRef]
- Domas, J. The Geology of Karbala–Kut–Ali Al-Gharbi Area; GEOSURV: Baghdad, Iraq, 1985. [Google Scholar]
- Earle, S. Physical Geology, 2nd ed.; BCcampus: Victoria, BC, Canada, 2019; Available online: https://opentextbc.ca/physicalgeology2ed/ (accessed on 6 December 2020).
- Rekha, V.B.; Thomas, A.P.; Suma, M.; Vijith, H. An integration of spatial information technology for groundwater potential and quality investigations in Koduvan Ar Sub—Watershed of Meenachil River Basin, Kerala, India. J. Indian Soc. Remote Sens. 2011, 39, 63–71. [Google Scholar] [CrossRef]
- Kotchoni, D.; Vouillamoz, J.; Lawson, F.; Adjomayi, P.; Boukari, M.; Taylor, R. Relationships between rainfall and groundwater recharge in seasonally humid Benin: A comparative analysis of long-term hydrographs in sedimentary and crystalline aquifers. Hydrogeol. J. 2019, 27, 447–457. [Google Scholar] [CrossRef] [Green Version]
- Thapa, R.; Gupta, S.; Guin, S.; Kaur, H. Assessment of groundwater potential zones using multi-influencing factor (MIF) and GIS: A case study from Birbhum district, West Bengal. Appl. Water Sci. 2017, 7, 4117–4131. [Google Scholar] [CrossRef]
- Sankar, K. Evaluation of Groundwater Potential Zones Using Remote Sensing Data In Upper Vaigai River Basin, Tamil Nadu, India. J. Indian Soc. Remote Sens. 2002, 30, 119–129. [Google Scholar] [CrossRef]
- Sharma, D.; Jugran, D.K. Hydrogeomorphological Studies around PinjaurMomi-Kala Arab Area, Ambala District (Hariyana) and Sirmour District (Himachala Pradesh). J. Indian Soc. Remote Sens. 1992, 20, 187–197. [Google Scholar] [CrossRef]
- Sparks, B. Landforms in arid and semi-arid climates. In Geomorphology, 2nd ed.; Longman Group Ltd.: London, UK, 1960; pp. 335–341. [Google Scholar]
- Ramaiah, S.; Gopalakrishna, G.; Vittala, S.; Najeeb, K. Geomorphological mapping for identification of ground water potential zones in hard rock areas using geo-spatial information—A case study in Malur Taluk, Kolar District, Karnataka, India. Nat. Environ. Pollut. Technol. 2012, 11, 369–376. [Google Scholar]
- Al-Djazouli, M.; Elmorabiti, K.; Rahimi, A.; Amellah, O.; Fadil, O. Delineating of groundwater potential zones based on remote sensing, GIS and analytical hierarchical process: A case of Waddai, eastern Chad. GeoJournal 2020. [Google Scholar] [CrossRef]
- Subba Rao, N. Groundwater potential index in a crystalline terrain using remote sensing data. Environ. Geol. 2006, 50, 1067–1076. [Google Scholar] [CrossRef]
- Mogaji, K.; Omosuyi, G.; Adelusi, A.; Lim, H. Application of GIS-Based Evidential Belief Function Model to Regional Groundwater Recharge Potential Zones Mapping in Hardrock Geologic Terrain. Environ. Process. 2016, 3, 93–123. [Google Scholar] [CrossRef]
- Razavi-Termeh, S.; Sadeghi-Niaraki, A.; Choi, S. Groundwater Potential Mapping Using an Integrated Ensemble of Three Bivariate Statistical Models with Random Forest and Logistic Model Tree Models. Water 2019, 11, 1596. [Google Scholar] [CrossRef] [Green Version]
- Oh, H.; Kim, Y.; Choi, J.; Park, E.; Lee, S. GIS mapping of regional probabilistic groundwater potential in the area of Pohang City, Korea. J. Hydrol. 2011, 399, 158–172. [Google Scholar] [CrossRef]
- Gee, G.; Fayer, M.; Rockhold, M.; Campbell, M. Variation in recharge at the Hanford site. Northwest Sci. 1992, 66, 237–250. [Google Scholar]
- Brouwer, C.; Prins, K.; Kay, M.; Heibloem, M. Irrigation Water Management: Irrigation Methods; Training Manual No. 5. Food and Agriculture Organization of the United Nations, 1988. Available online: http://www.fao.org/3/S8684E/s8684e00.htm#Contents (accessed on 9 November 2020).
- Owuor, S.; Butterbach-Bahl, K.; Guzha, A.; Rufino, M.; Pelster, D.; Díaz-Pinés, E.; Breuer, L. Groundwater recharge rates and surface runoff response to land use and land cover changes in semi-arid environments. Ecol. Process. 2016, 5, 16. [Google Scholar] [CrossRef] [Green Version]
- Albhaisi, M.; Brendonck, L.; Batelaan, O. Predicted impacts of land use change on groundwater recharge of the upper Berg catchment, South Africa. Water SA 2013, 39, 2. [Google Scholar] [CrossRef] [Green Version]
- Roark, D.; Healy, D. Quantification of Deep Percolation from Two Flood-Irrigated Alfalfa Fields, Roswell Basin, New Mexico; USGS Water Resources Investigation Report 98-4096; U.S. Department of the Interior, U.S. Geological Survey: Albuquerque, NM, USA, 1998; 32p. Available online: https://pubs.usgs.gov/wri/1998/4096/report.pdf (accessed on 30 December 2020).
- Jat, M.; Khare, D.; Garg, P. Urbanization and its impact on groundwater: A remote sensing and GIS-based assessment approach. Environmentalist 2009, 29, 17–32. [Google Scholar] [CrossRef]
- British Geological Survey. Available online: https://www.bgs.ac.uk/discoveringGeology/hazards/earthquakes/plateTectonics.html (accessed on 6 December 2020).
- Saraf, A.; Choudhury, P. Integrated remote sensing and GIS for groundwater exploration and identification of artificial recharge sites. Int. J. Remote Sens. 1998, 19, 1825–1841. [Google Scholar] [CrossRef]
- Raviraj, A.; Kuruppath, N.; Kannan, B. Identification of Potential Groundwater Recharge Zones Using Remote Sensing and Geographical Information System in Amaravathy Basin. J. Remote Sens. GIS 2017, 6, 213. [Google Scholar] [CrossRef]


| Country | |||
|---|---|---|---|
| Iraq | Iran | Germany | |
| Mid 2019 | 39.3 | 83.9 | 83.1 |
| 2035 | 55.3 | 100.6 | 82.2 |
| 2050 | 70.9 | 113.3 | 79.2 |
| Population number per square kilometer cultivable land | 786 | 571 | 706 |
| Literature | Lt | Ge | So | DEM | Rf | Sl | LD | DD | LU | DR | WT |
|---|---|---|---|---|---|---|---|---|---|---|---|
| [49] | ✓ | ✓ | ✓ | ✓ | ✓ | ||||||
| [50] | ✓ | ✓ | ✓ | ✓ | ✓ | ||||||
| [51] | ✓ | ✓ | ✓ | ✓ | ✓ | ✓ | ✓ | ||||
| [52] | ✓ | ✓ | ✓ | ✓ | ✓ | ✓ | ✓ | ✓ | |||
| [53] | ✓ | ✓ | ✓ | ✓ | ✓ | ✓ | ✓ | ✓ | |||
| [54] | ✓ | ✓ | ✓ | ✓ | ✓ | ✓ | ✓ | ✓ | |||
| [55] | ✓ | ✓ | ✓ | ✓ | ✓ | ✓ | ✓ | ✓ | |||
| [56] | ✓ | ✓ | ✓ | ✓ | ✓ | ✓ | ✓ | ||||
| [57] | ✓ | ✓ | ✓ | ✓ | ✓ | ✓ | ✓ | ||||
| [58] | ✓ | ✓ | ✓ | ✓ | ✓ | ✓ | |||||
| [59] | ✓ | ✓ | ✓ | ✓ | ✓ | ✓ | ✓ | ✓ | |||
| [60] | ✓ | ✓ | ✓ | ✓ | ✓ | ||||||
| [61] | ✓ | ✓ | ✓ | ✓ | ✓ | ✓ | ✓ | ✓ | ✓ | ✓ | |
| [62] | ✓ | ✓ | ✓ | ✓ | ✓ | ✓ | ✓ | ✓ | |||
| [63] | ✓ | ✓ | ✓ | ✓ | ✓ | ✓ | ✓ | ||||
| [64] | ✓ | ✓ | ✓ | ✓ | ✓ | ✓ | ✓ | ||||
| [65] | ✓ | ✓ | ✓ | ✓ | ✓ | ✓ | ✓ | ✓ | |||
| [66] | ✓ | ✓ | ✓ | ✓ | ✓ | ✓ | ✓ | ||||
| [67] | ✓ | ✓ | ✓ | ✓ | ✓ | ✓ | ✓ | ✓ | ✓ | ||
| [68] | ✓ | ✓ | ✓ | ✓ | ✓ | ✓ | ✓ | ✓ | |||
| [69] | ✓ | ✓ | ✓ | ✓ | ✓ | ✓ | |||||
| [30] | ✓ | ✓ | ✓ | ✓ | ✓ | ✓ | ✓ | ✓ | |||
| [70] | ✓ | ✓ | ✓ | ✓ | ✓ | ✓ | ✓ | ✓ | |||
| [71] | ✓ | ✓ | ✓ | ✓ | ✓ | ✓ | ✓ | ✓ | ✓ | ||
| [72] | ✓ | ✓ | ✓ | ✓ | ✓ | ✓ | |||||
| [73] | ✓ | ✓ | ✓ | ✓ | ✓ | ||||||
| [74] | ✓ | ✓ | ✓ | ✓ | ✓ | ✓ | ✓ | ✓ | |||
| [75] | ✓ | ✓ | ✓ | ✓ | ✓ | ✓ | ✓ | ||||
| [76] | ✓ | ✓ | ✓ | ✓ | ✓ | ✓ | ✓ |
| Strength of Significance | Explanation |
|---|---|
| 1 | Equal significance |
| 3 | Medium significance |
| 5 | Strong |
| 7 | Very strong significance |
| 9 | Maximum significance |
| 2, 4, 6, and 8 | Interim number between two adjacent numbers |
| Lt | Rf | Ge | Sl | DD | DR | So | LULC | LD | Normalized Principal Eigenvector | |
|---|---|---|---|---|---|---|---|---|---|---|
| Lt | 1 | 2 | 3 | 3 | 3 | 2 | 2 | 4 | 4 | 24.06% |
| Rf | 1/2 | 1 | 1 | 1 | 2 | 2 | 3 | 3 | 3 1/3 | 15.05% |
| Ge | 1/3 | 1 | 1 | 1 3/7 | 1 3/7 | 2 | 3 | 3 | 3 1/3 | 14.52% |
| Sl | 1/3 | 1 | 2/3 | 1 | 4/5 | 2 | 4/5 | 2 | 2 | 9.96% |
| DD | 1/3 | 1/2 | 2/3 | 1 1/4 | 1 | 2 | 1/2 | 2 | 2 | 9.38% |
| DR | 1/2 | 1/2 | 1/2 | 1/2 | 1/2 | 1 | 3 | 1 3/7 | 2 | 9.02% |
| So | 1/2 | 1/3 | 1/3 | 1 1/4 | 2 | 1/3 | 1 | 1 1/9 | 1 1/4 | 7.94% |
| LULC | 1/4 | 1/3 | 1/3 | 1/2 | 1/2 | 2/3 | 8/9 | 1 | 2 | 5.60% |
| LD | 1/4 | 2/7 | 2/7 | 1/2 | 1/2 | 1/2 | 4/5 | 1/2 | 1 | 4.47% |
| Sum | 4.0 | 7.0 | 7.9 | 10.4 | 11.7 | 12.5 | 15.0 | 18.0 | 20.9 | |
| Total | 100.00% | |||||||||
| Column Sums (Row 11 of Table 4) | Eigenvectors (Column 11 of Table 4) | Parameter Rank | |
|---|---|---|---|
| (1) | (2) | (1) × (2) | |
| Lt | 4.0 | 0.24 | 0.96 |
| Rf | 7.0 | 0.15 | 1.05 |
| Ge | 7.9 | 0.15 | 1.14 |
| Sl | 10.4 | 0.10 | 1.04 |
| DD | 11.7 | 0.09 | 1.10 |
| DR | 12.5 | 0.09 | 1.13 |
| So | 15.0 | 0.08 | 1.19 |
| LULC | 18.0 | 0.06 | 1.01 |
| LD | 20.9 | 0.04 | 0.93 |
| Sum (λmax) | 9.558 |
| N | 3 | 4 | 5 | 6 | 7 | 8 | 9 | 10 |
|---|---|---|---|---|---|---|---|---|
| RI | 0.58 | 0.89 | 1.12 | 1.24 | 1.32 | 1.41 | 1.45 | 1.49 |
| Factor (Unit) | Class | Groundwater Potentiality | Parameter Weight | Class Rank |
|---|---|---|---|---|
| Lithology | Evaporites | Very low | 24 | 1 |
| Metamorphic | Low | 4.5 | ||
| Plutonic Igneous | Low | 8 | ||
| Volcanic Igneous | Low | 11.5 | ||
| Siliciclastic Sedimentary | Medium | 15 | ||
| Mixed Sedimentary | High | 18.5 | ||
| Carbonate Sedimentary | High | 22 | ||
| Unconsolidated Sediments | Very high | 24 | ||
| Rainfall (mm/yr) | <100–200 | Low | 15 | 1 |
| 200–300 | Moderate | 5 | ||
| 300–400 | High | 10 | ||
| 400–500 | Very high | 15 | ||
| Geomorphology unit | Floodplain | Very high | 14 | 14 |
| Bajada | Very high | 14 | ||
| Valley fill | Very high | 14 | ||
| Pediplain | High | 9 | ||
| Pediment | Moderate | 4 | ||
| Badland | Very low | 1 | ||
| Cuesta | Very low | 1 | ||
| Denudational hill | Very low | 1 | ||
| Slop (degree) | <10 | Very high | 10 | 10 |
| 10–20 | High | 7 | ||
| 20–30 | Moderate | 5 | ||
| 30–40 | Low | 3 | ||
| >40 | Very low | 1 | ||
| Drainage density (km/km2) | <0.75 | Very high | 9 | 9 |
| 0.75–1.5 | High | 7 | ||
| 1.5–2.25 | Moderate | 5 | ||
| 2.25–3 | Low | 3 | ||
| >3 | Very low | 1 | ||
| Distance to river (km) | 0–35 | Very high | 9 | 9 |
| 35–70 | High | 7 | ||
| 70–105 | Moderate | 5 | ||
| 105–140 | Low | 3 | ||
| >140 | Very low | 1 | ||
| Soil | Clay | Extremely low | 8 | 1 |
| Silty clay | Very low | 2 | ||
| Sandy clay | Low | 3 | ||
| Clay loam | Moderate | 4 | ||
| Loam | High | 5 | ||
| Loamy sand | Very High | 7 | ||
| Sand | Extremely high | 8 | ||
| Land use/land cover | Urban | Very low | 6 | 1 |
| Shrub land (36%) | Low | 3 | ||
| Cropland (12%) | Moderate | 4 | ||
| Bare land (~50%) | High | 5 | ||
| Water | Very high | 6 | ||
| Lineament density (km/km2) | <0.018 | Very low | 4 | 1 |
| 0.018–0.071 | Low | 1.75 | ||
| 0.071–0.143 | Moderate | 2.50 | ||
| 0.143–0.232 | High | 3.25 | ||
| 0.232–0.391 | Very High | 4 |
| Factor Eliminated | Variation Index (%) | |||
|---|---|---|---|---|
| Min | Max | Mean | SD | |
| Lithology | 0.60 | 5.56 | 2.78 | 0.80 |
| Geomorphology units | 0.35 | 4.60 | 1.27 | 0.95 |
| LULC | 0.51 | 11.10 | 1.00 | 0.76 |
| Rainfall | 0.53 | 11.11 | 0.96 | 0.82 |
| Lineament density | 0.82 | 1.39 | 0.89 | 0.25 |
| Soil features | 0.95 | 2.19 | 0.73 | 0.33 |
| Distance to river | 0.78 | 1.39 | 0.72 | 0.25 |
| Slope | 0.35 | 1.52 | 0.62 | 0.28 |
| Drainage density | 0.49 | 2.32 | 0.46 | 0.31 |
| Factor Eliminated | Zone Category Change ((+/−) %) | ||||
|---|---|---|---|---|---|
| Very Poor | Poor | Moderate | Good | Very Good | |
| Lithology | 6.7 | 70.6 | 38.5 | −74.3 | −100.0 |
| Rainfall | 38.9 | −29.0 | −14.2 | −17.3 | 54.3 |
| Geomorphology units | −6.7 | −30.3 | −28.3 | 32.7 | −93.0 |
| Slope | 7.3 | 1.4 | −5.9 | −0.8 | 80.4 |
| Drainage density | 39.9 | −0.6 | −9.2 | 1.2 | 83.5 |
| Distance to river | 50.8 | 6.6 | −1.4 | −2.8 | 26.5 |
| Soil features | 69.9 | 12.3 | 0.9 | −6.0 | 27.0 |
| LULC | −9.3 | −5.9 | −7.7 | 3.1 | 66.5 |
| Lineament density | 8.8 | −11.0 | −4.8 | 1.2 | 70.9 |
Publisher’s Note: MDPI stays neutral with regard to jurisdictional claims in published maps and institutional affiliations. |
© 2020 by the authors. Licensee MDPI, Basel, Switzerland. This article is an open access article distributed under the terms and conditions of the Creative Commons Attribution (CC BY) license (http://creativecommons.org/licenses/by/4.0/).
Share and Cite
Allafta, H.; Opp, C.; Patra, S. Identification of Groundwater Potential Zones Using Remote Sensing and GIS Techniques: A Case Study of the Shatt Al-Arab Basin. Remote Sens. 2021, 13, 112. https://doi.org/10.3390/rs13010112
Allafta H, Opp C, Patra S. Identification of Groundwater Potential Zones Using Remote Sensing and GIS Techniques: A Case Study of the Shatt Al-Arab Basin. Remote Sensing. 2021; 13(1):112. https://doi.org/10.3390/rs13010112
Chicago/Turabian StyleAllafta, Hadi, Christian Opp, and Suman Patra. 2021. "Identification of Groundwater Potential Zones Using Remote Sensing and GIS Techniques: A Case Study of the Shatt Al-Arab Basin" Remote Sensing 13, no. 1: 112. https://doi.org/10.3390/rs13010112
APA StyleAllafta, H., Opp, C., & Patra, S. (2021). Identification of Groundwater Potential Zones Using Remote Sensing and GIS Techniques: A Case Study of the Shatt Al-Arab Basin. Remote Sensing, 13(1), 112. https://doi.org/10.3390/rs13010112