Spatiotemporal Variations in Particulate Matter and Air Quality over China: National, Regional and Urban Scales


Abstract
1. Introduction
2. Data and Methods
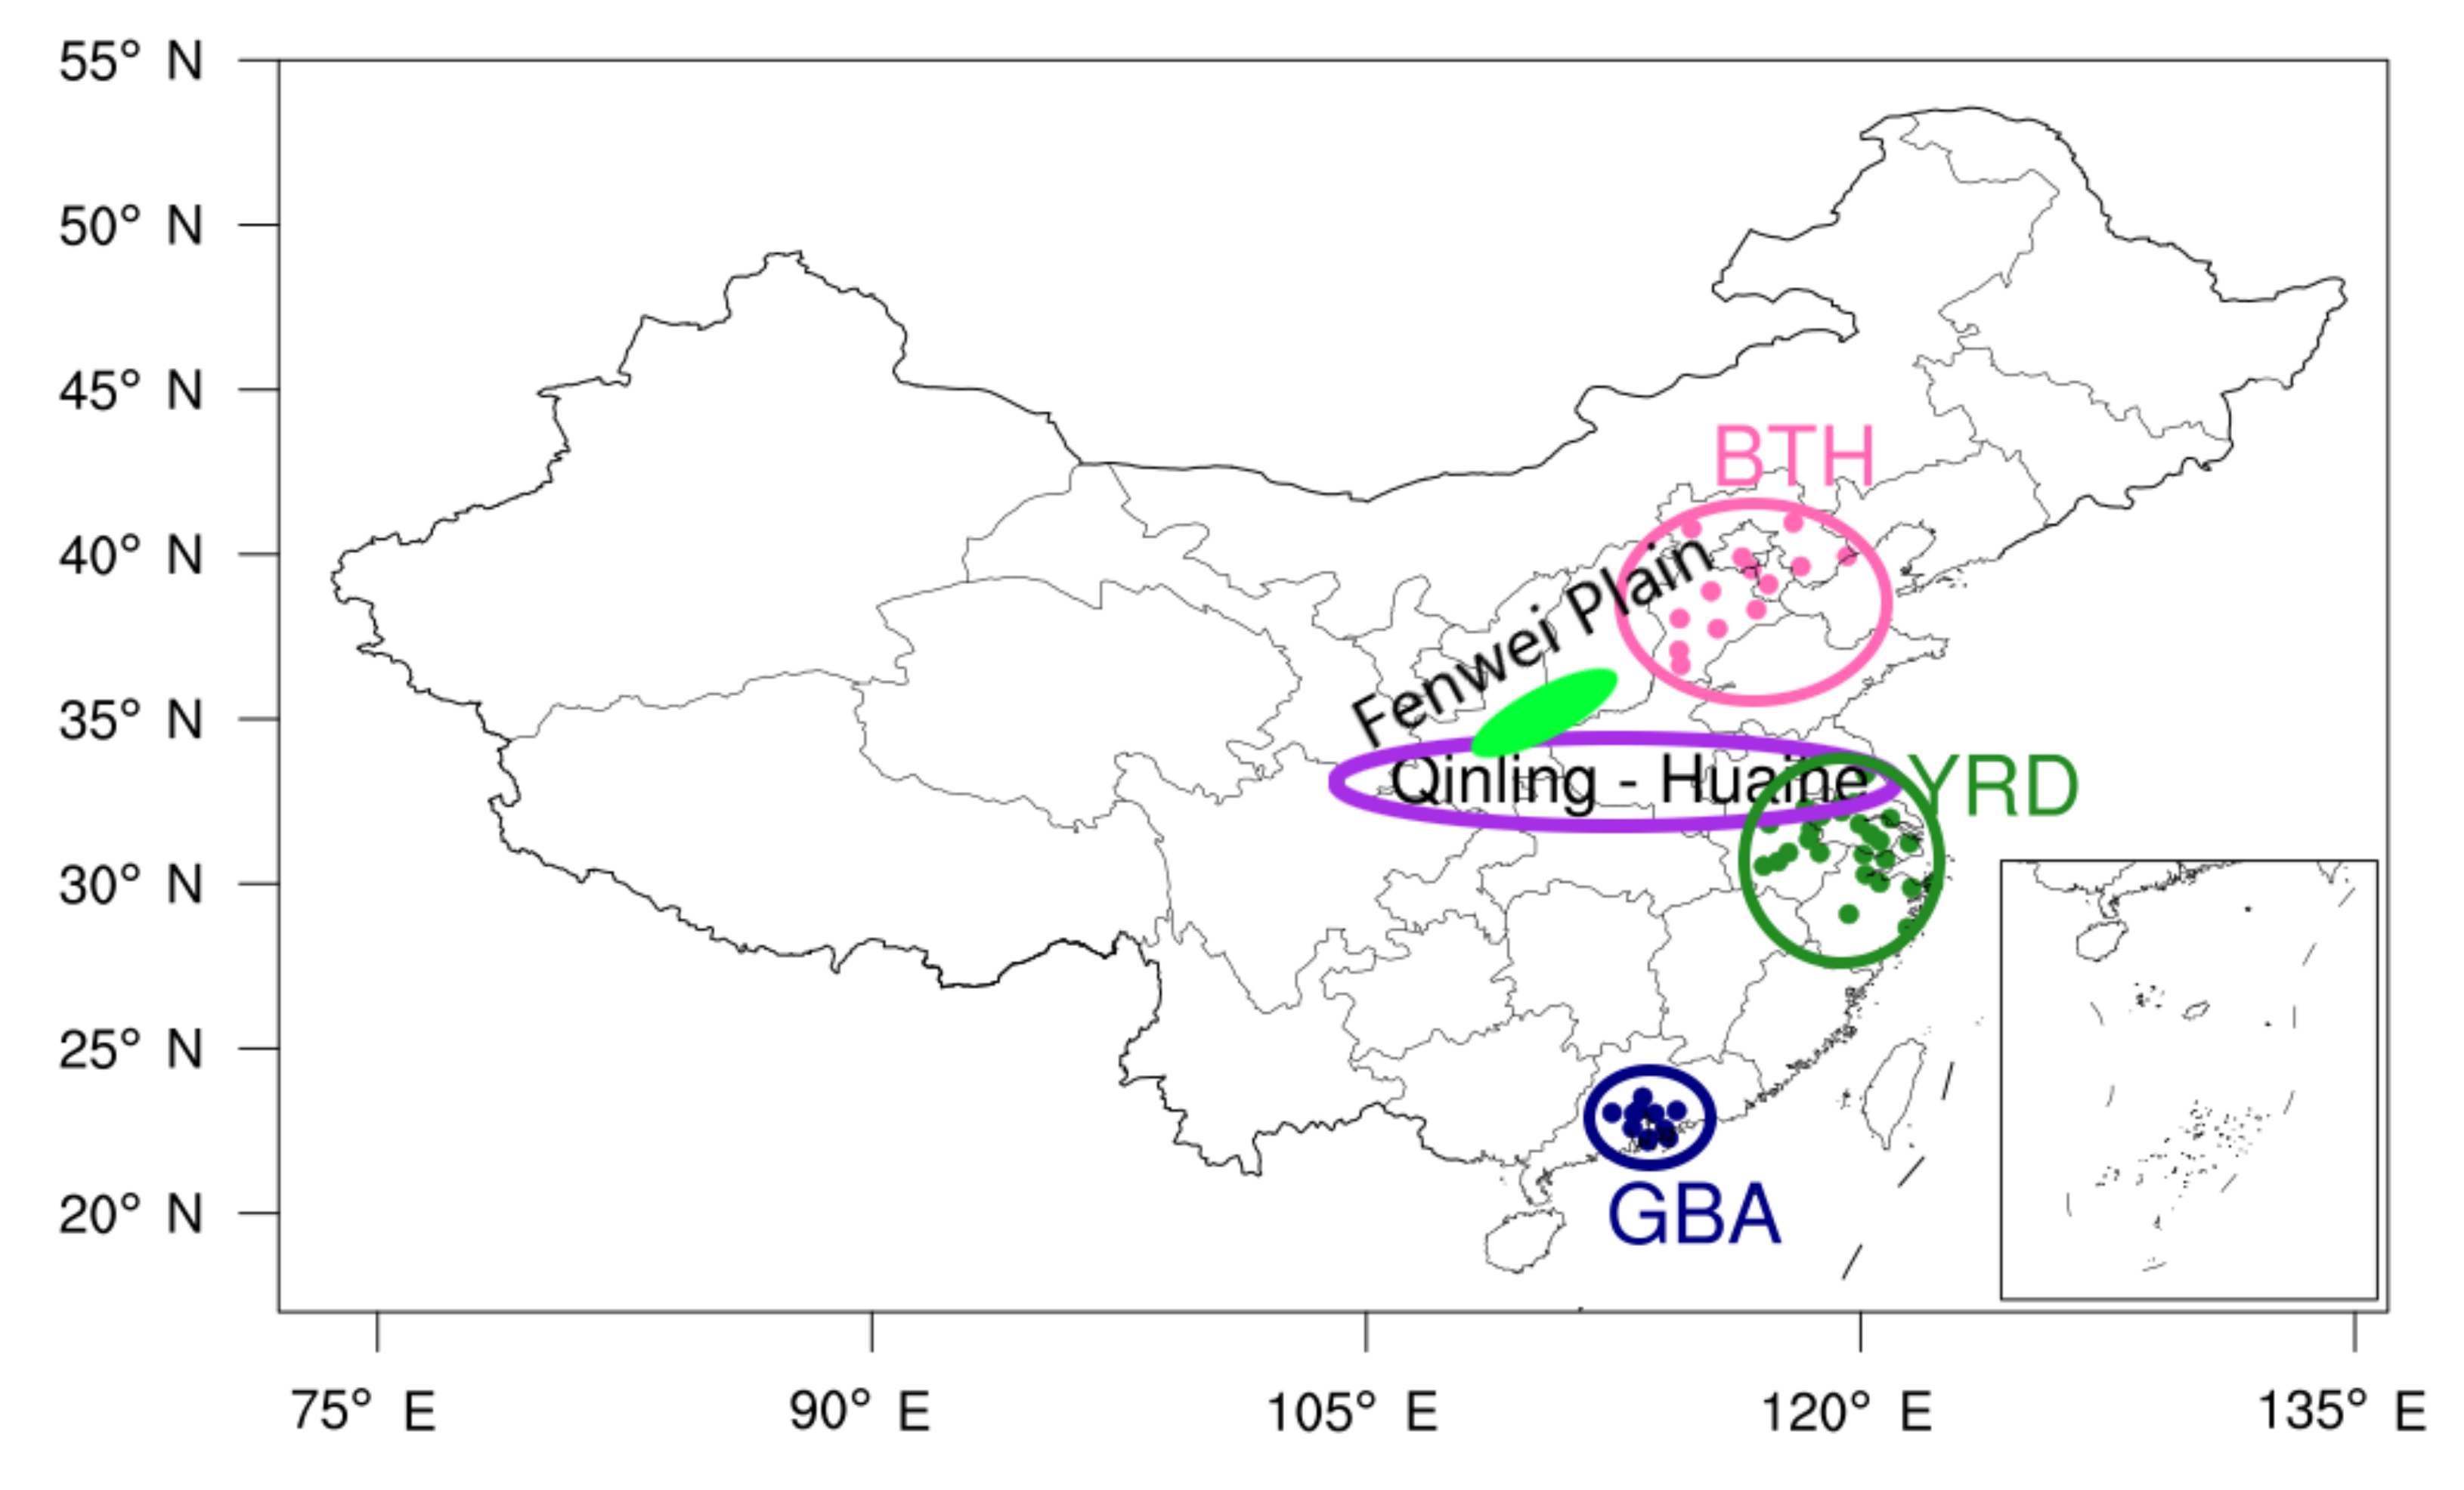
2.1. Study Areas
2.2. Air Quality and Ground-Based Meteorological Data
2.3. The Spatial Interpolation Method of AQI and PM Concentrations
2.4. The Method for the Identification of PM Pollution Processes
3. Results and Discussion
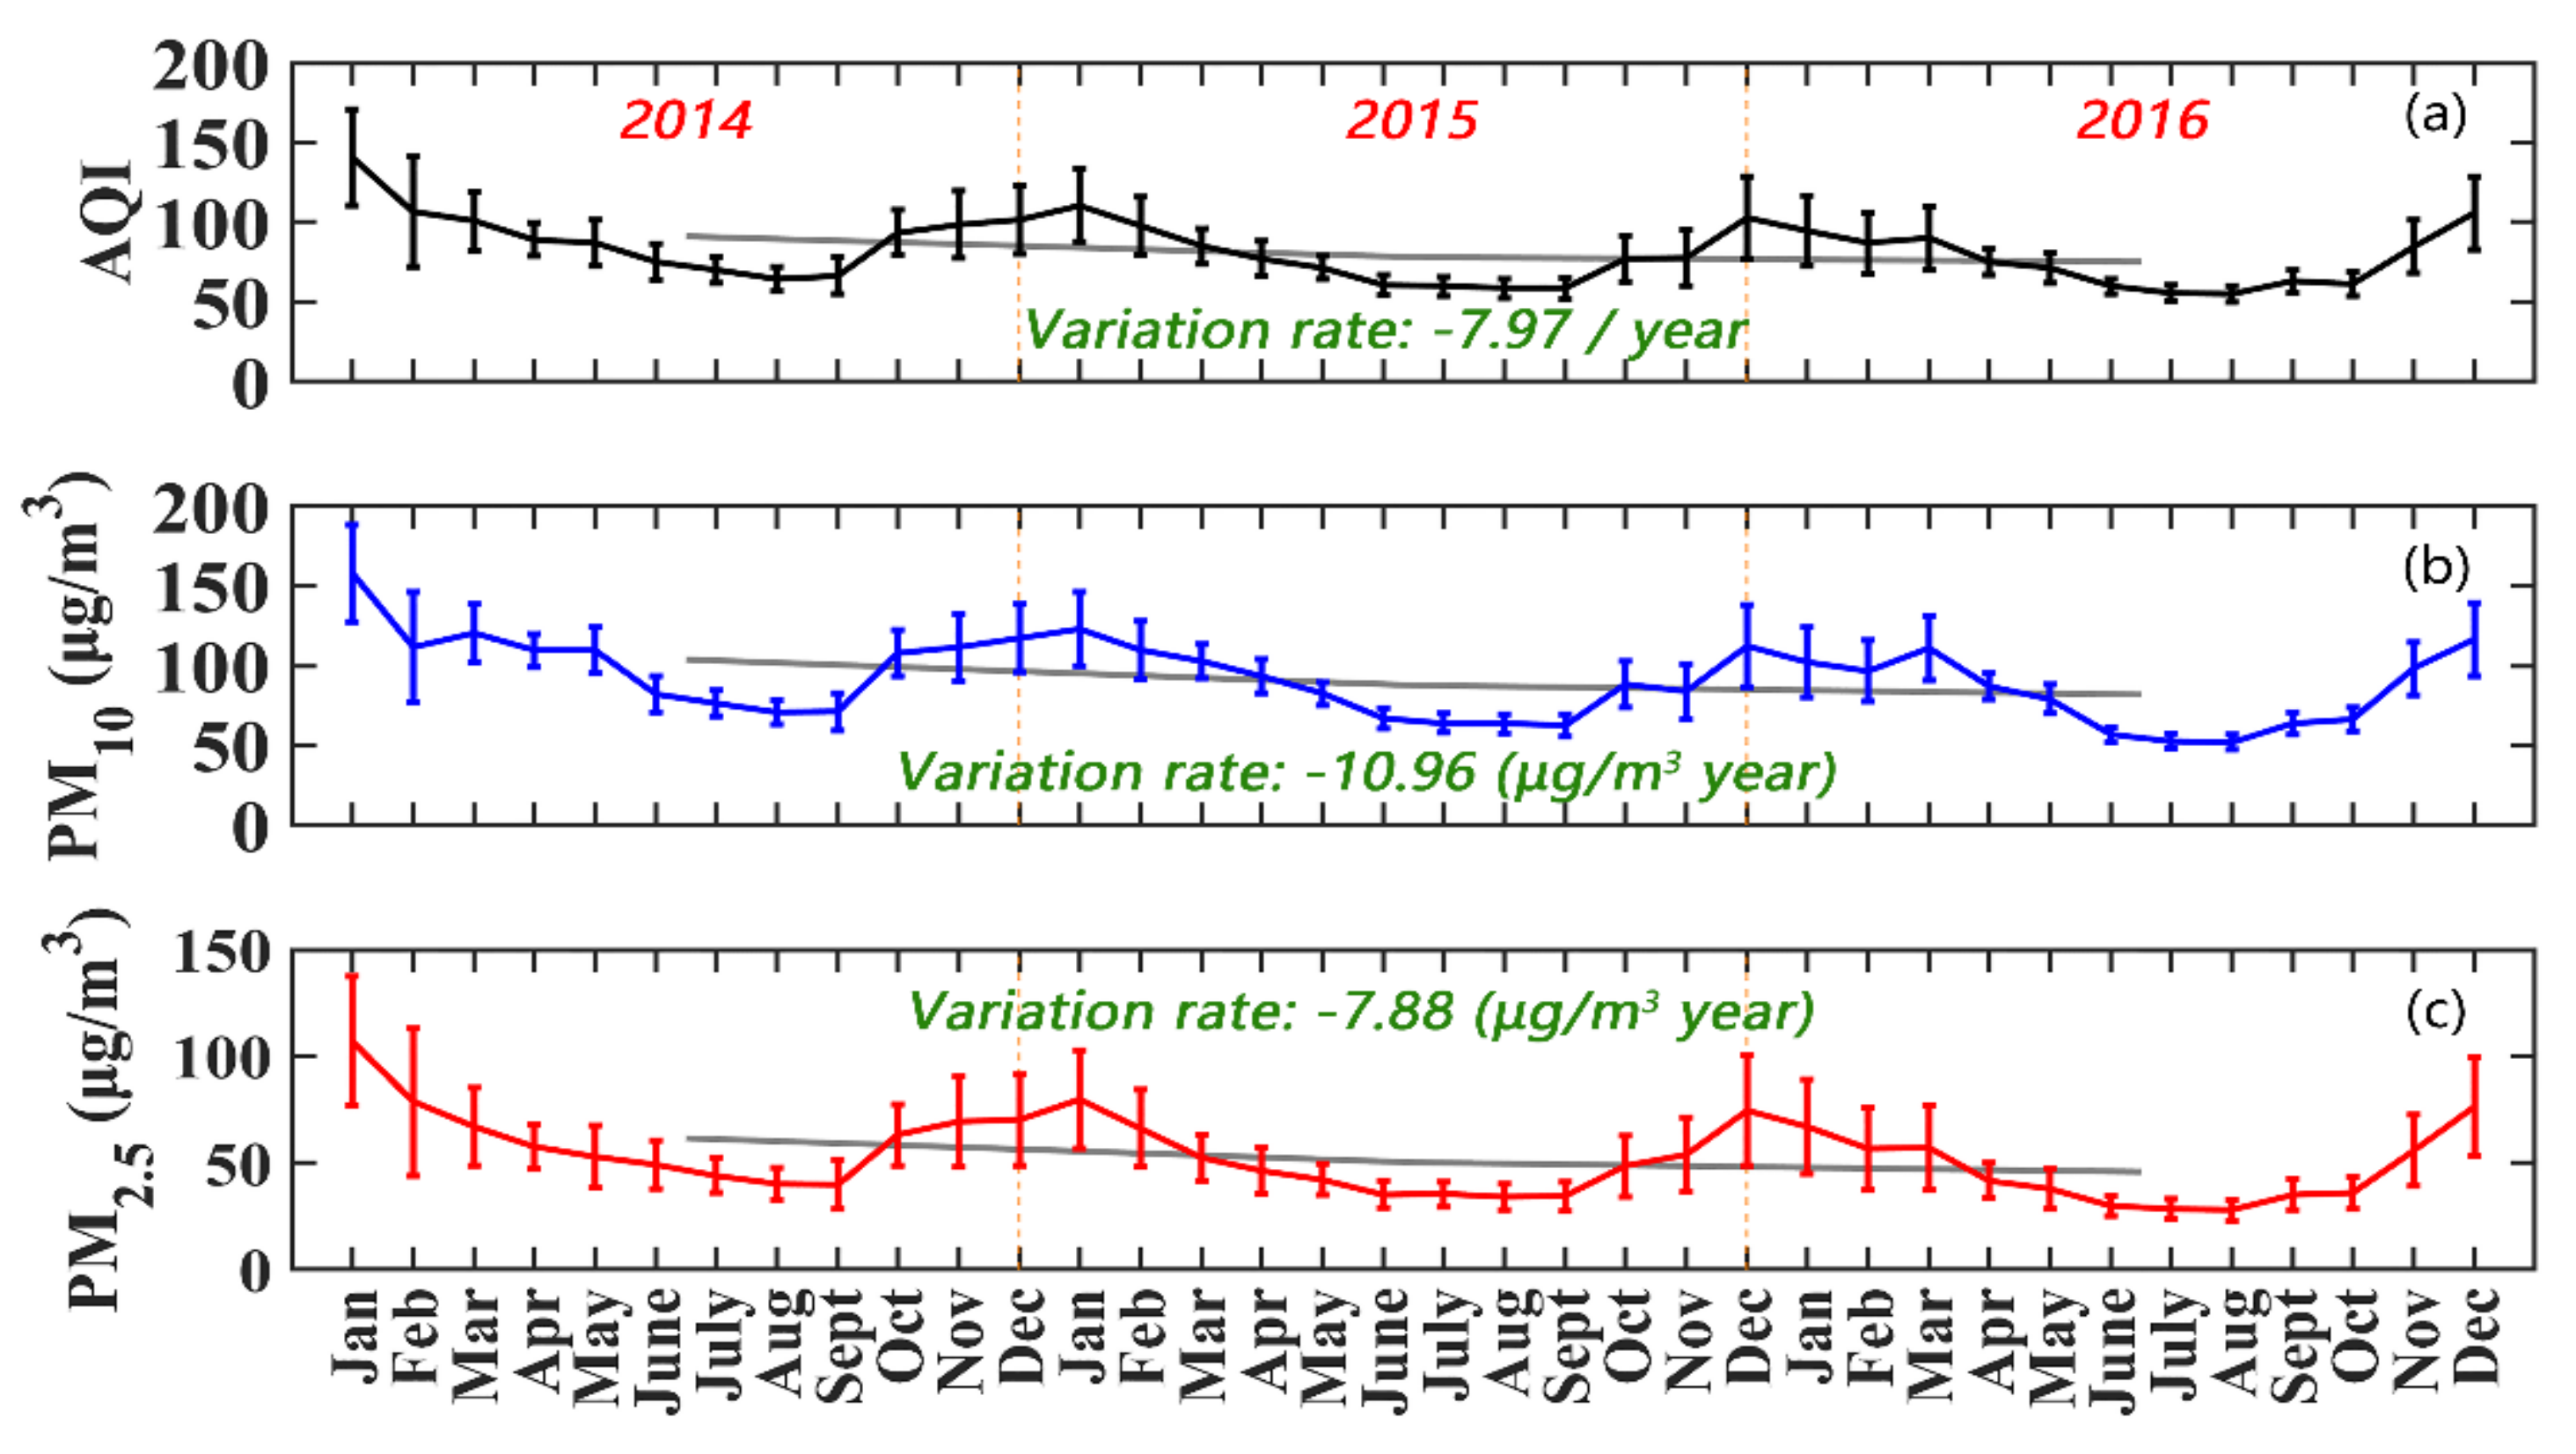
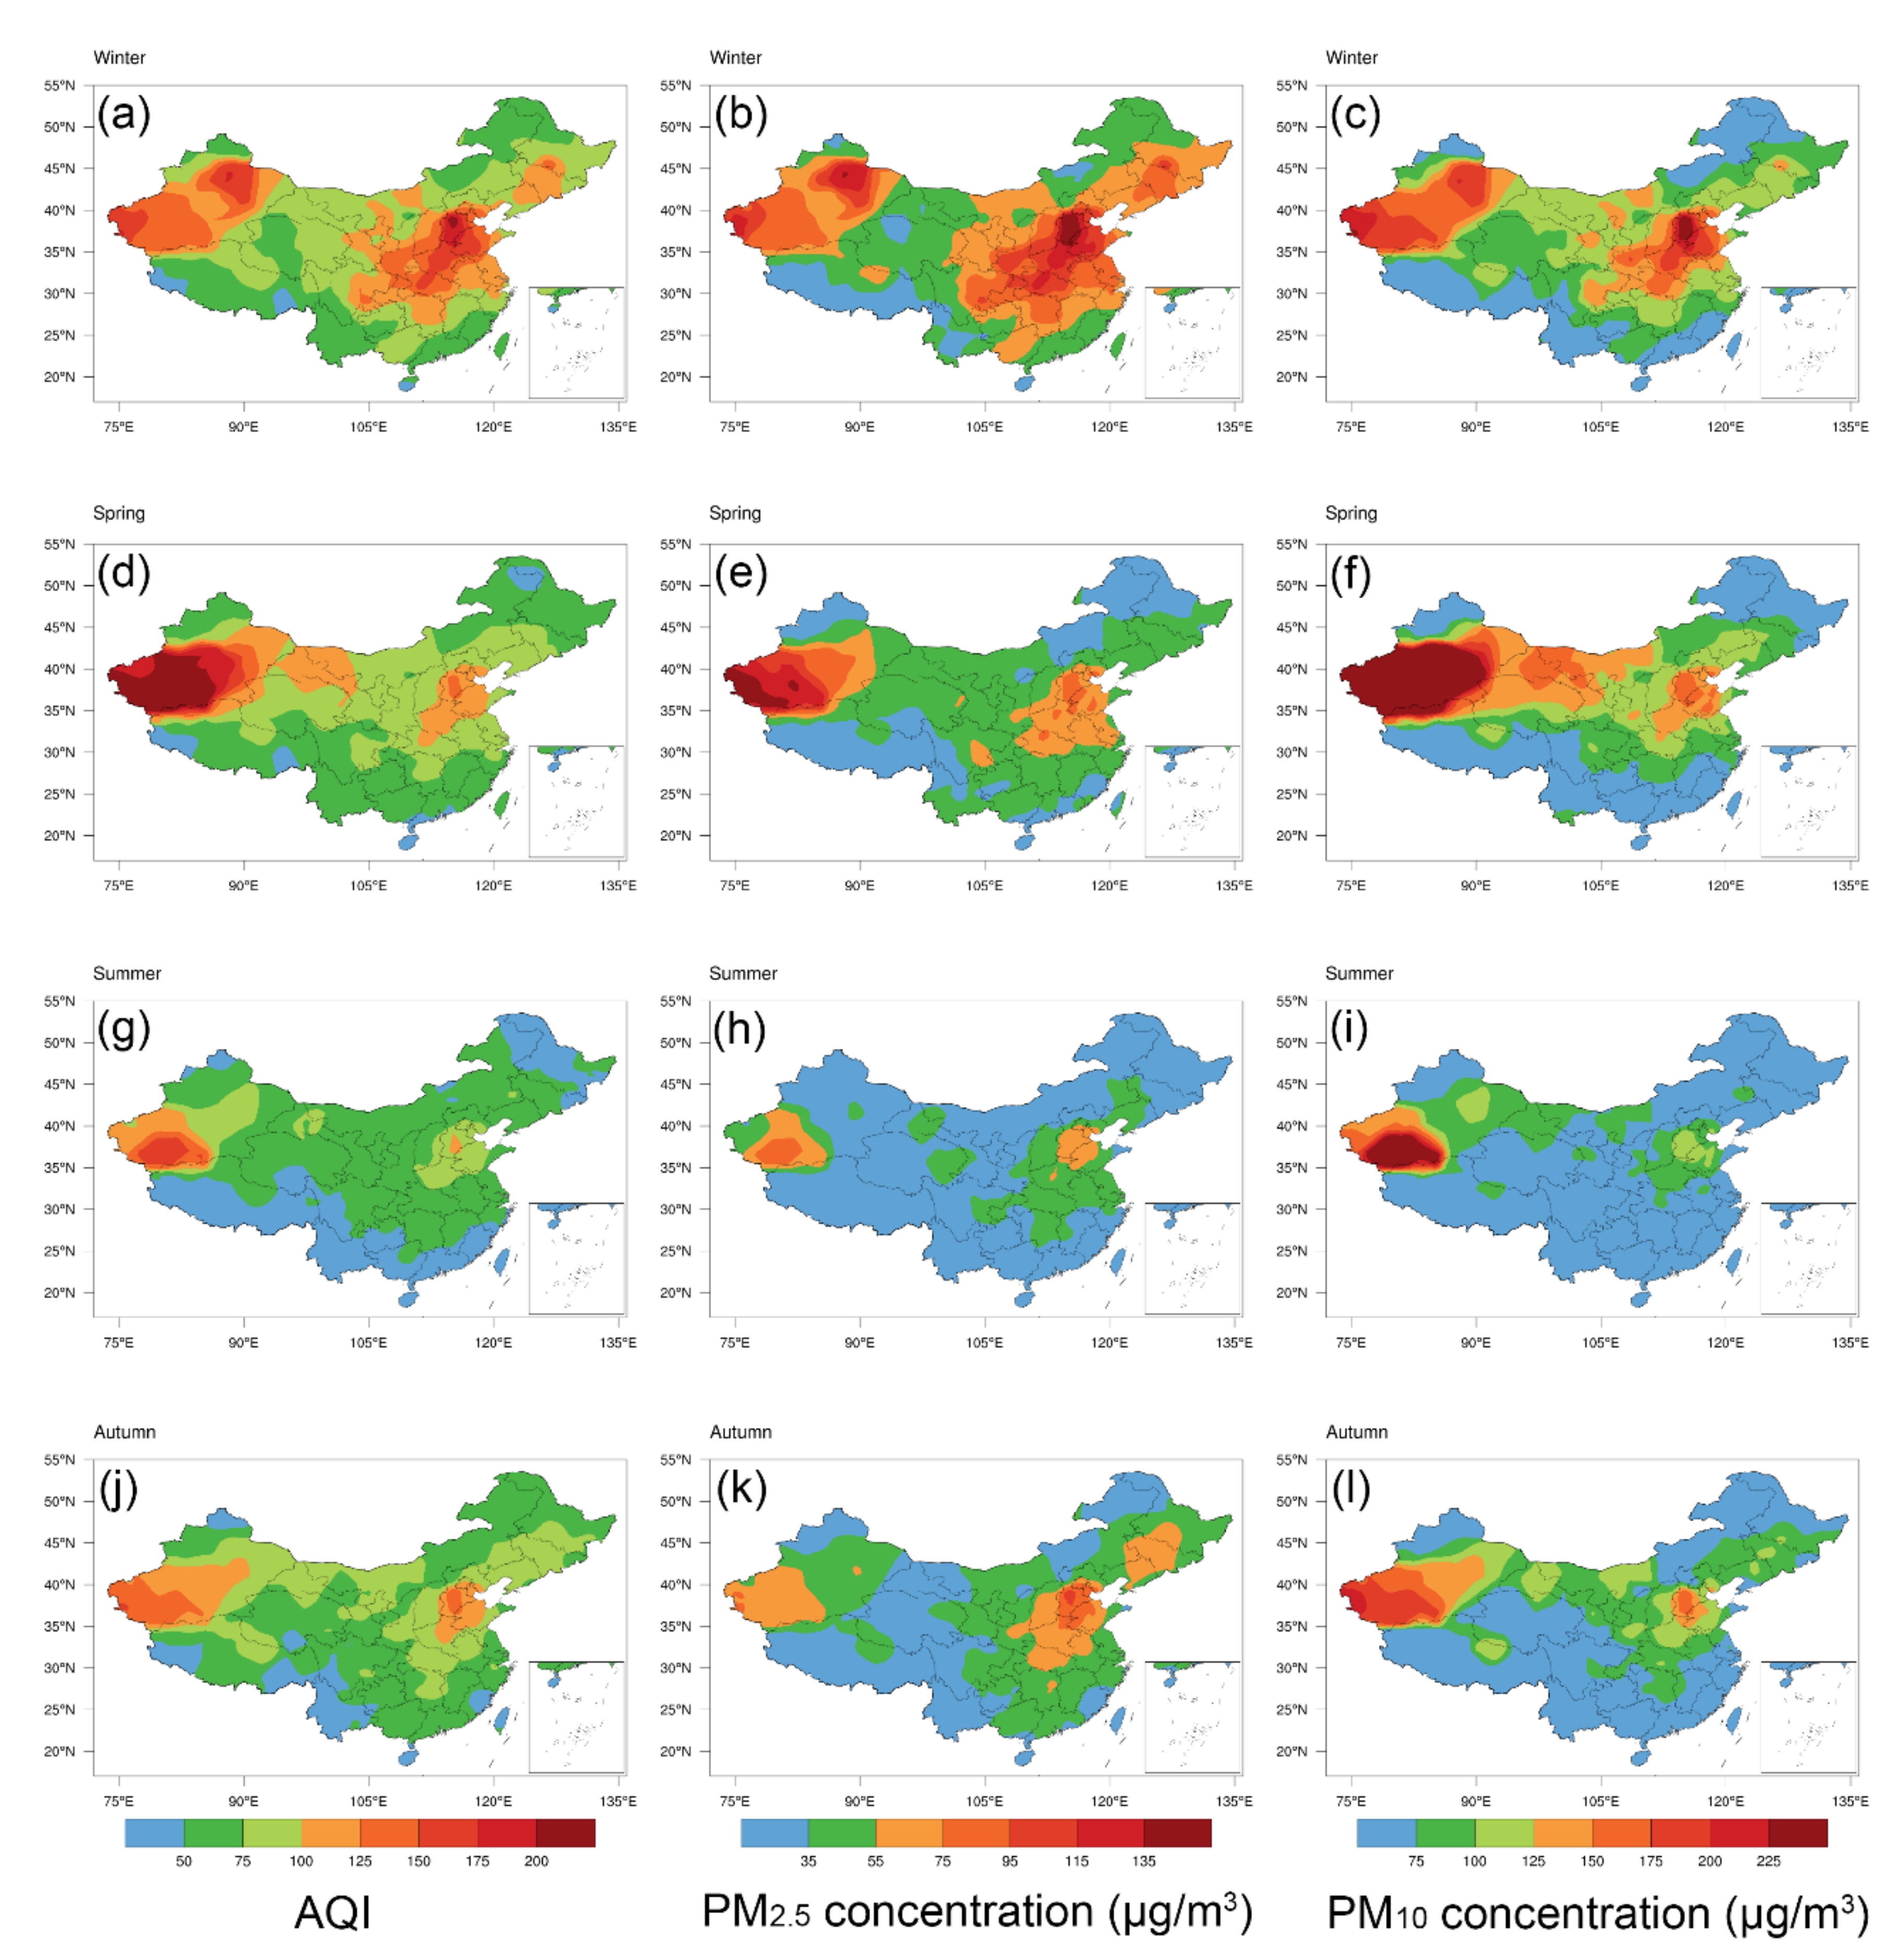
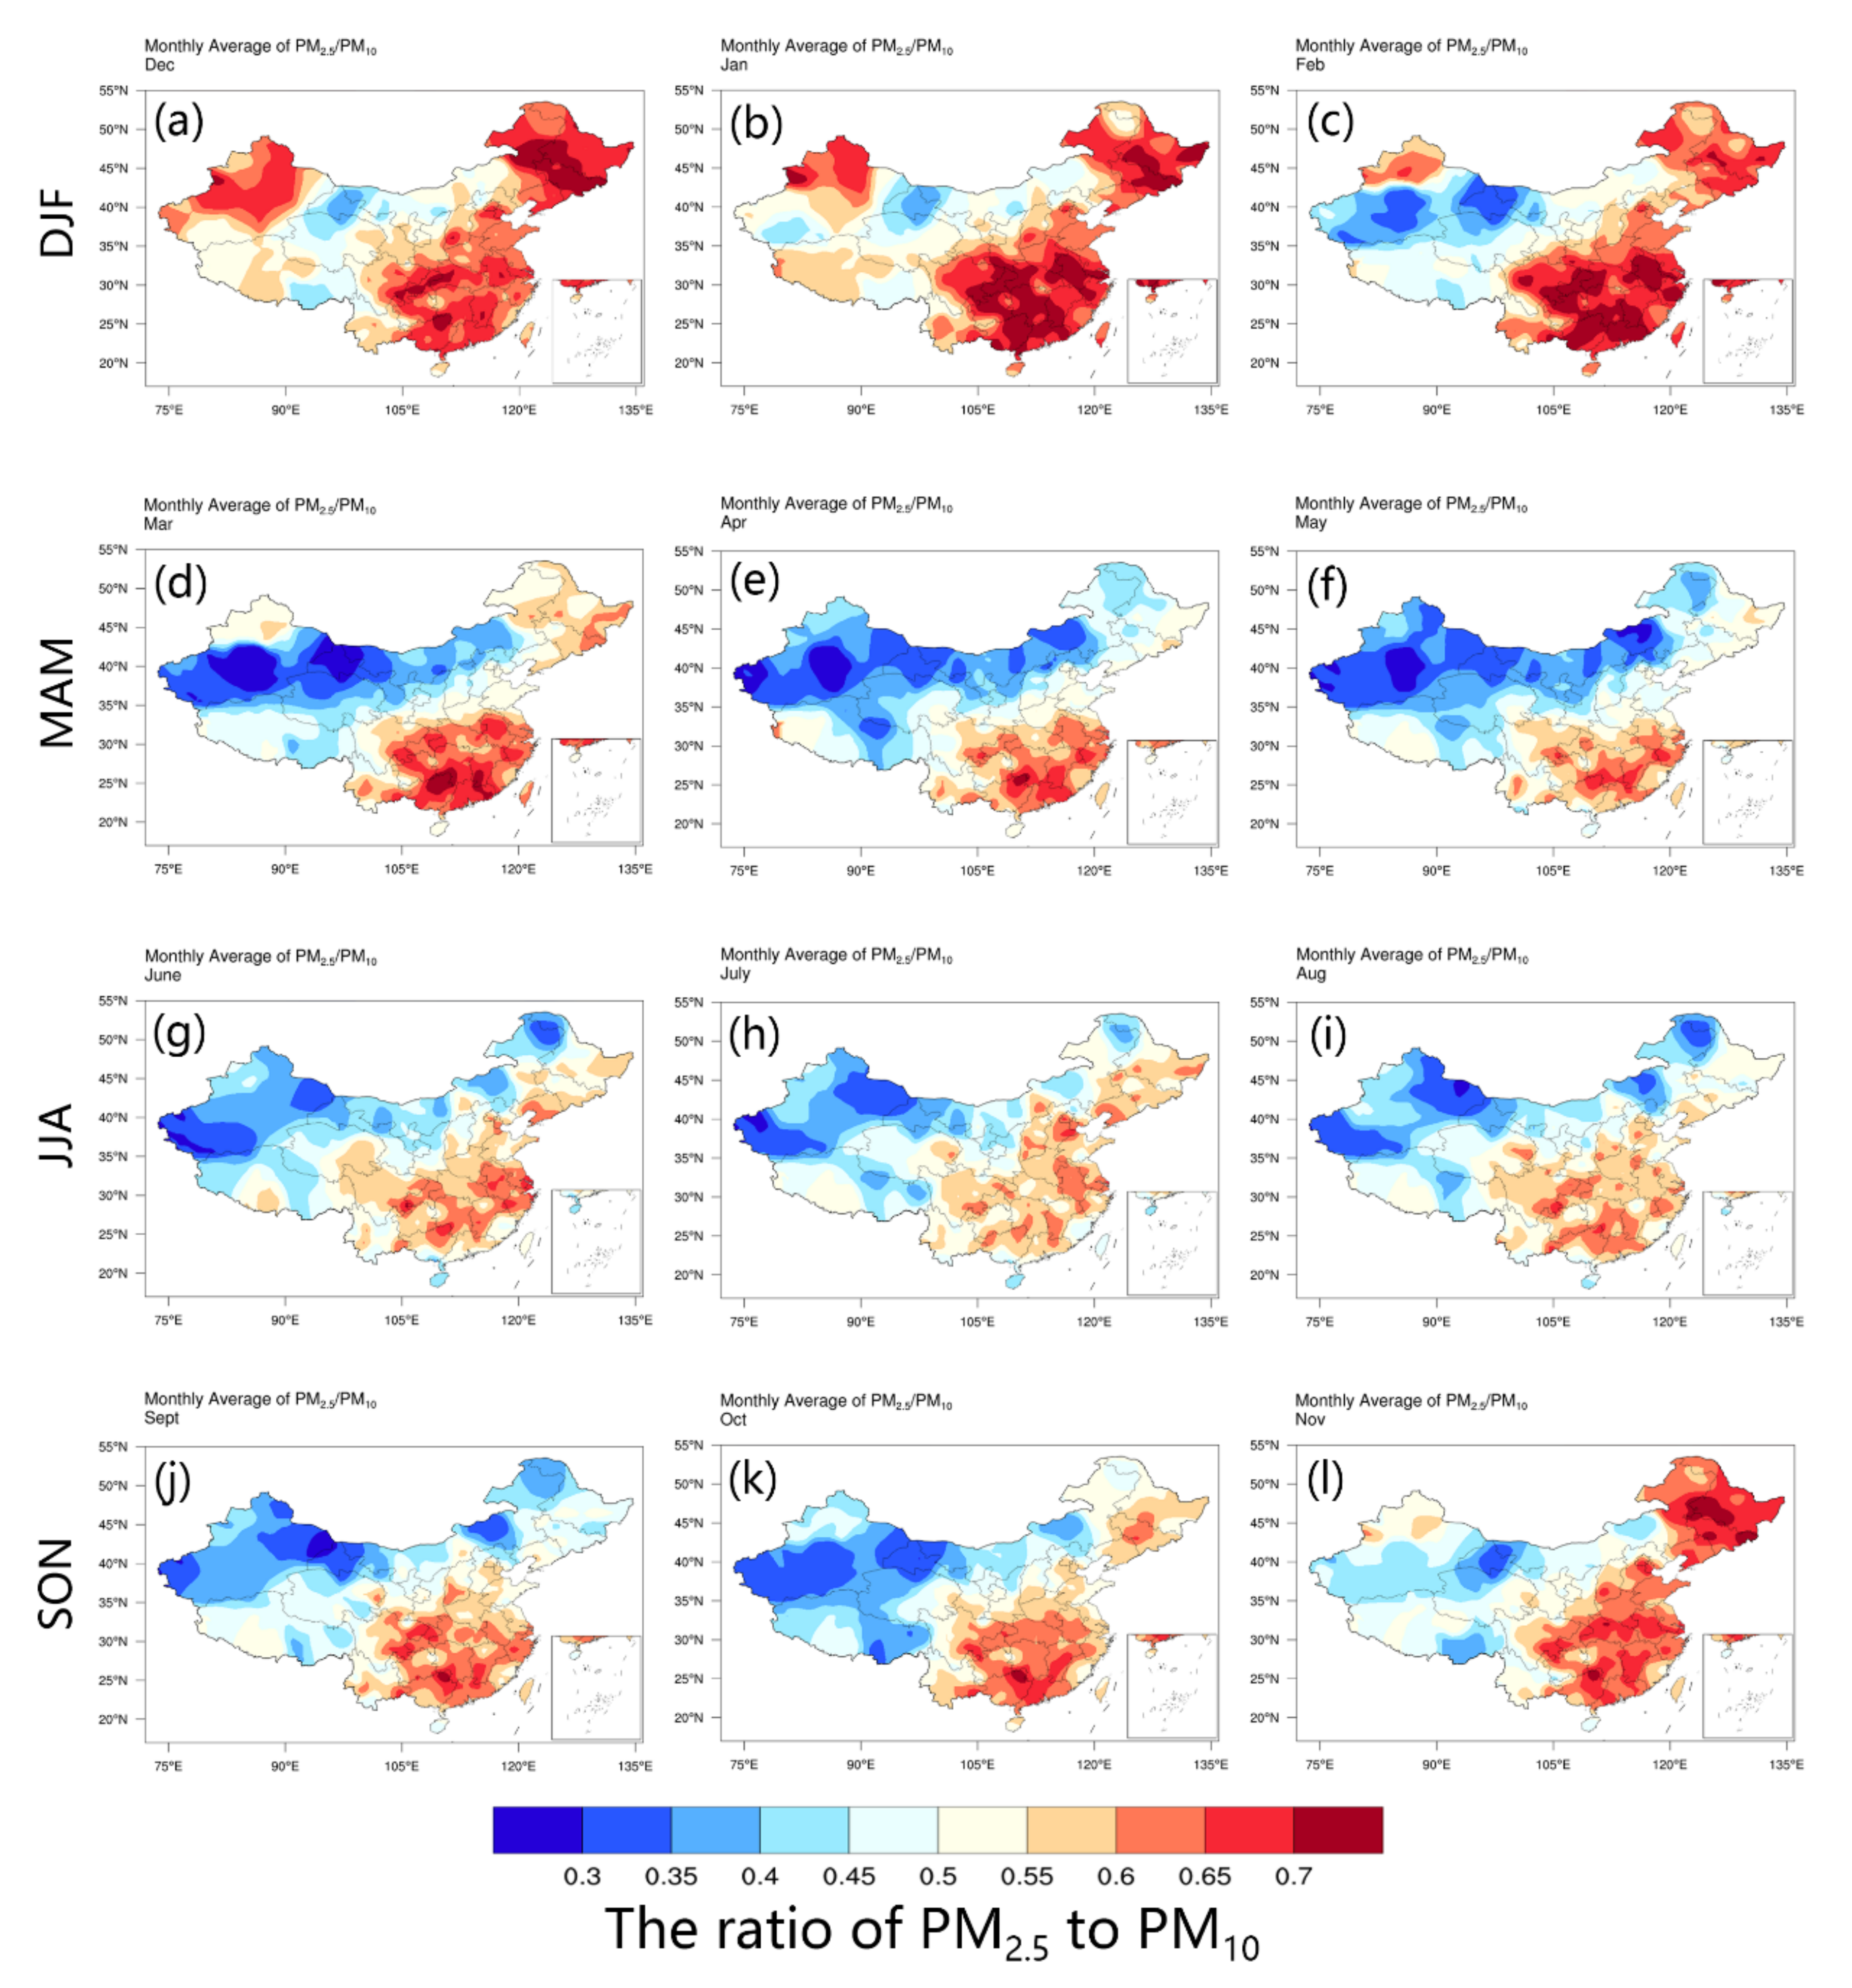
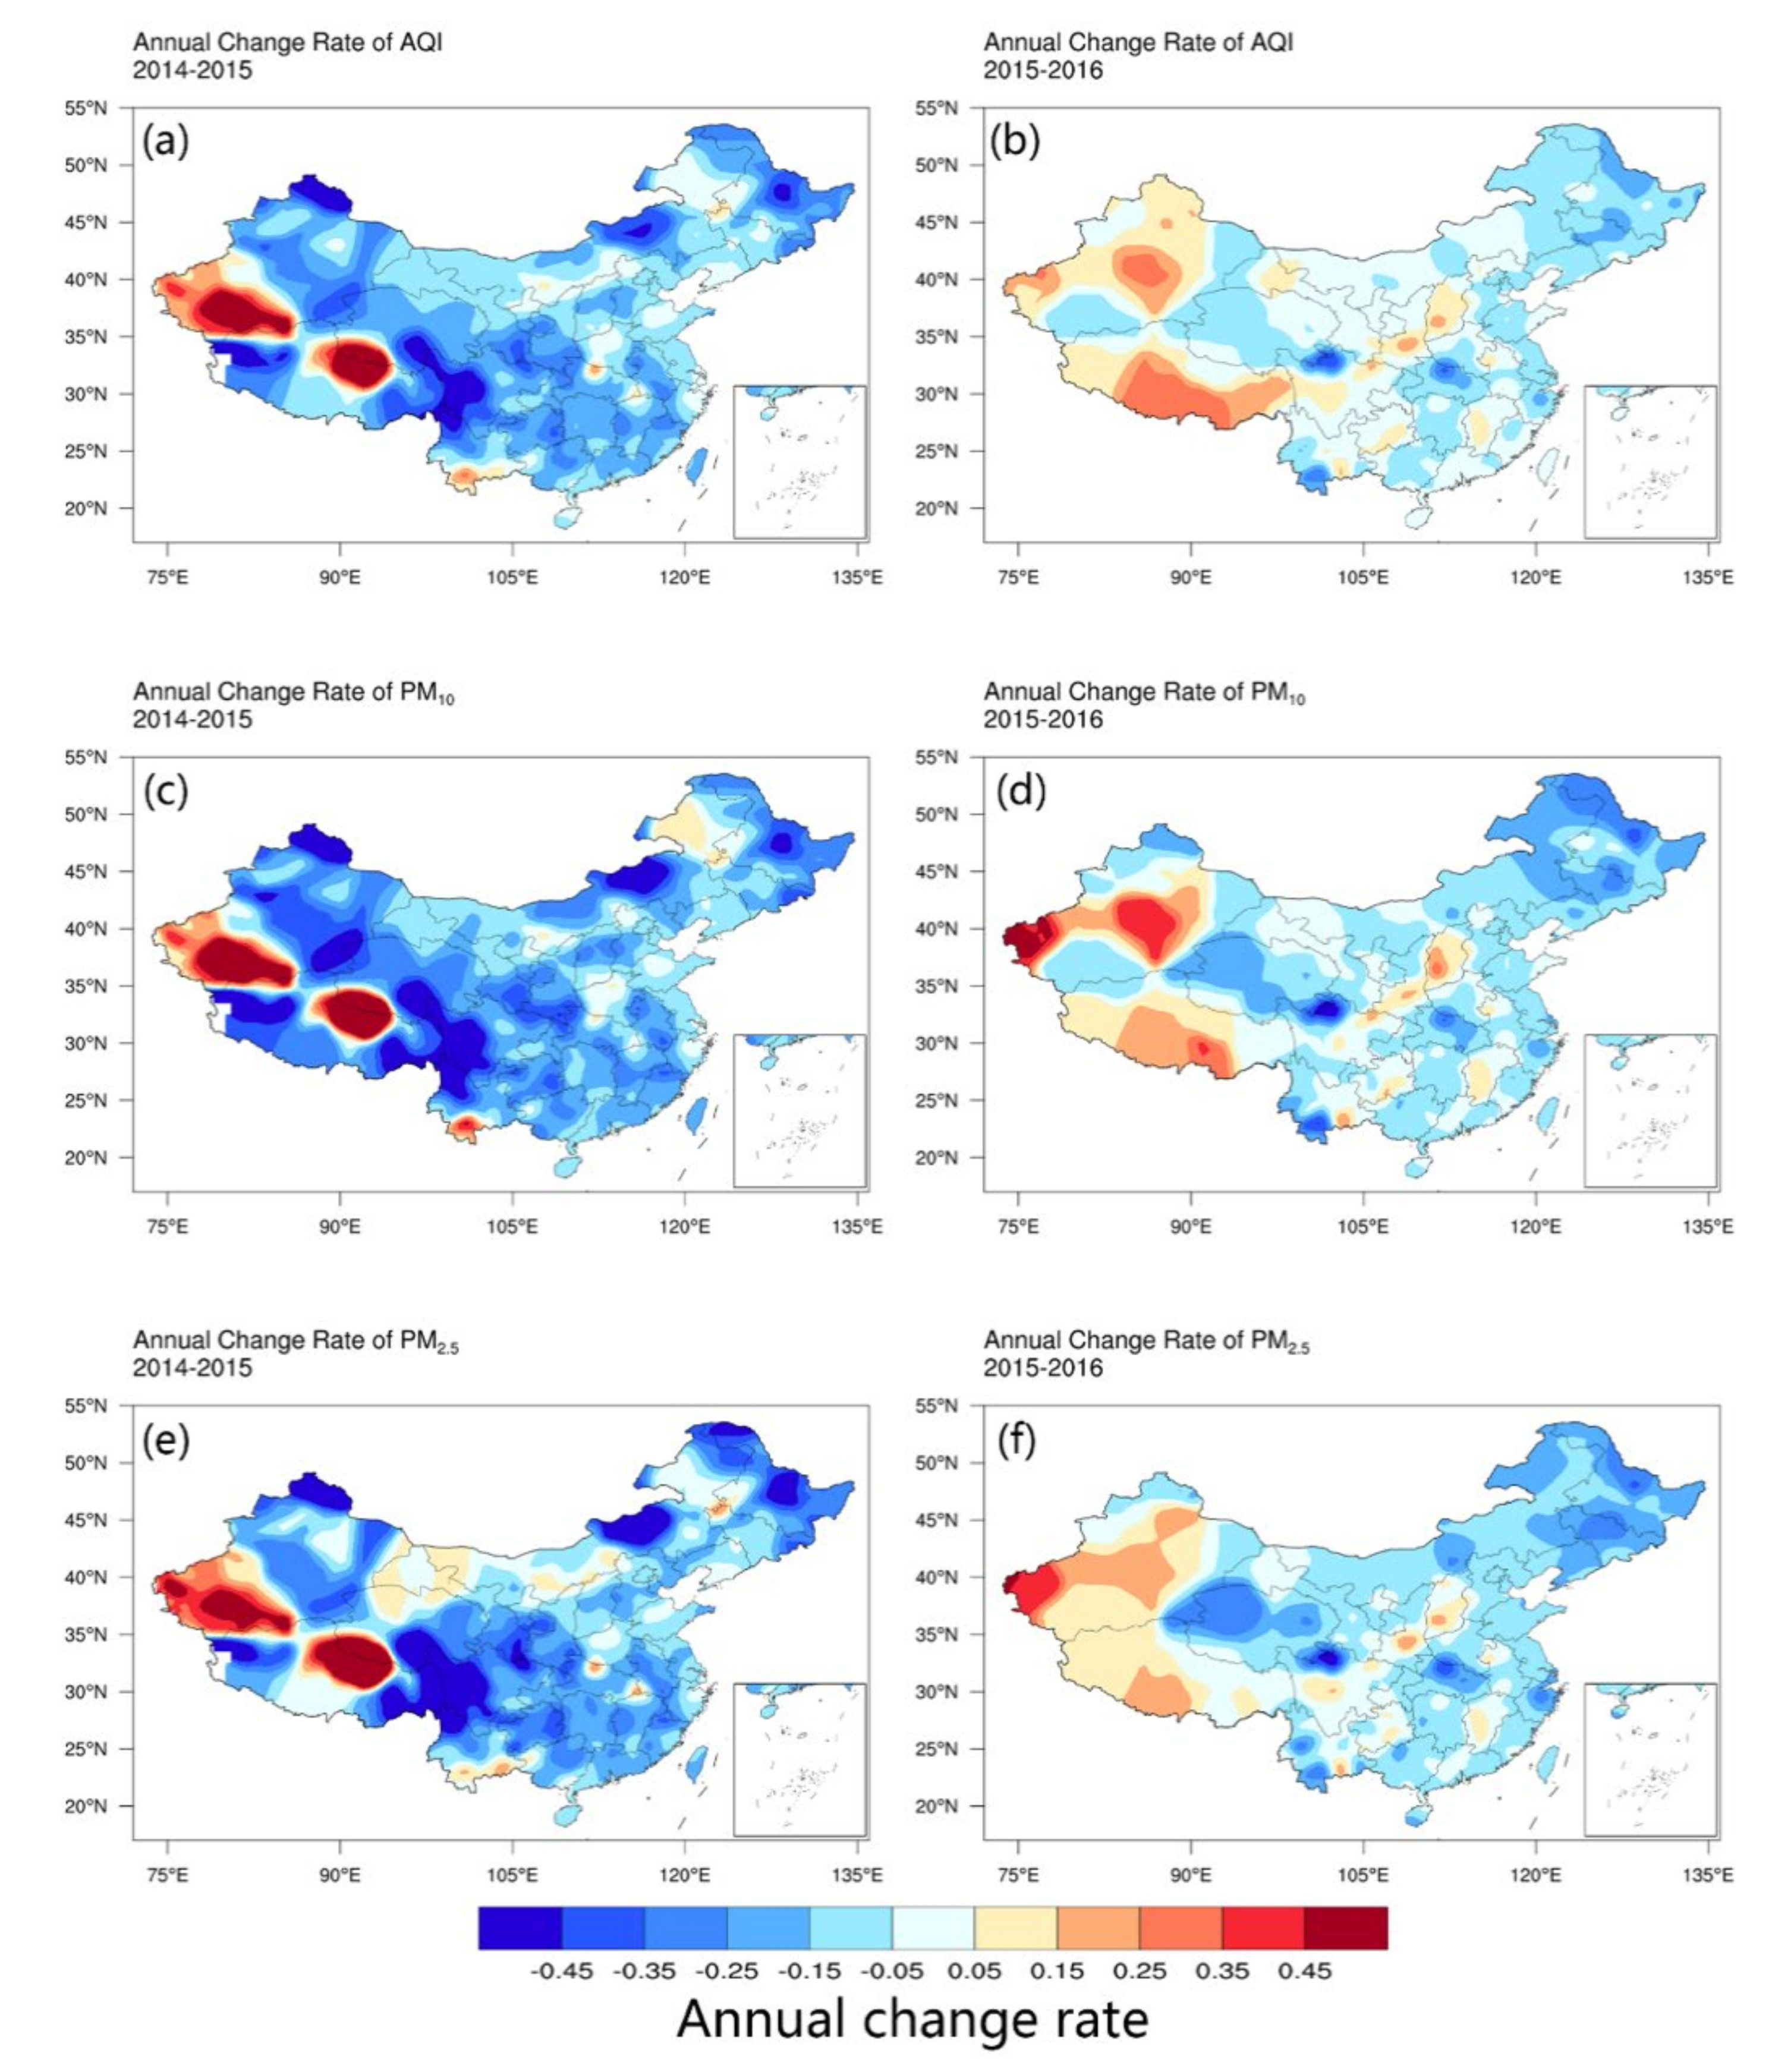
3.1. Spatiotemporal Variations of AQI and PM in China
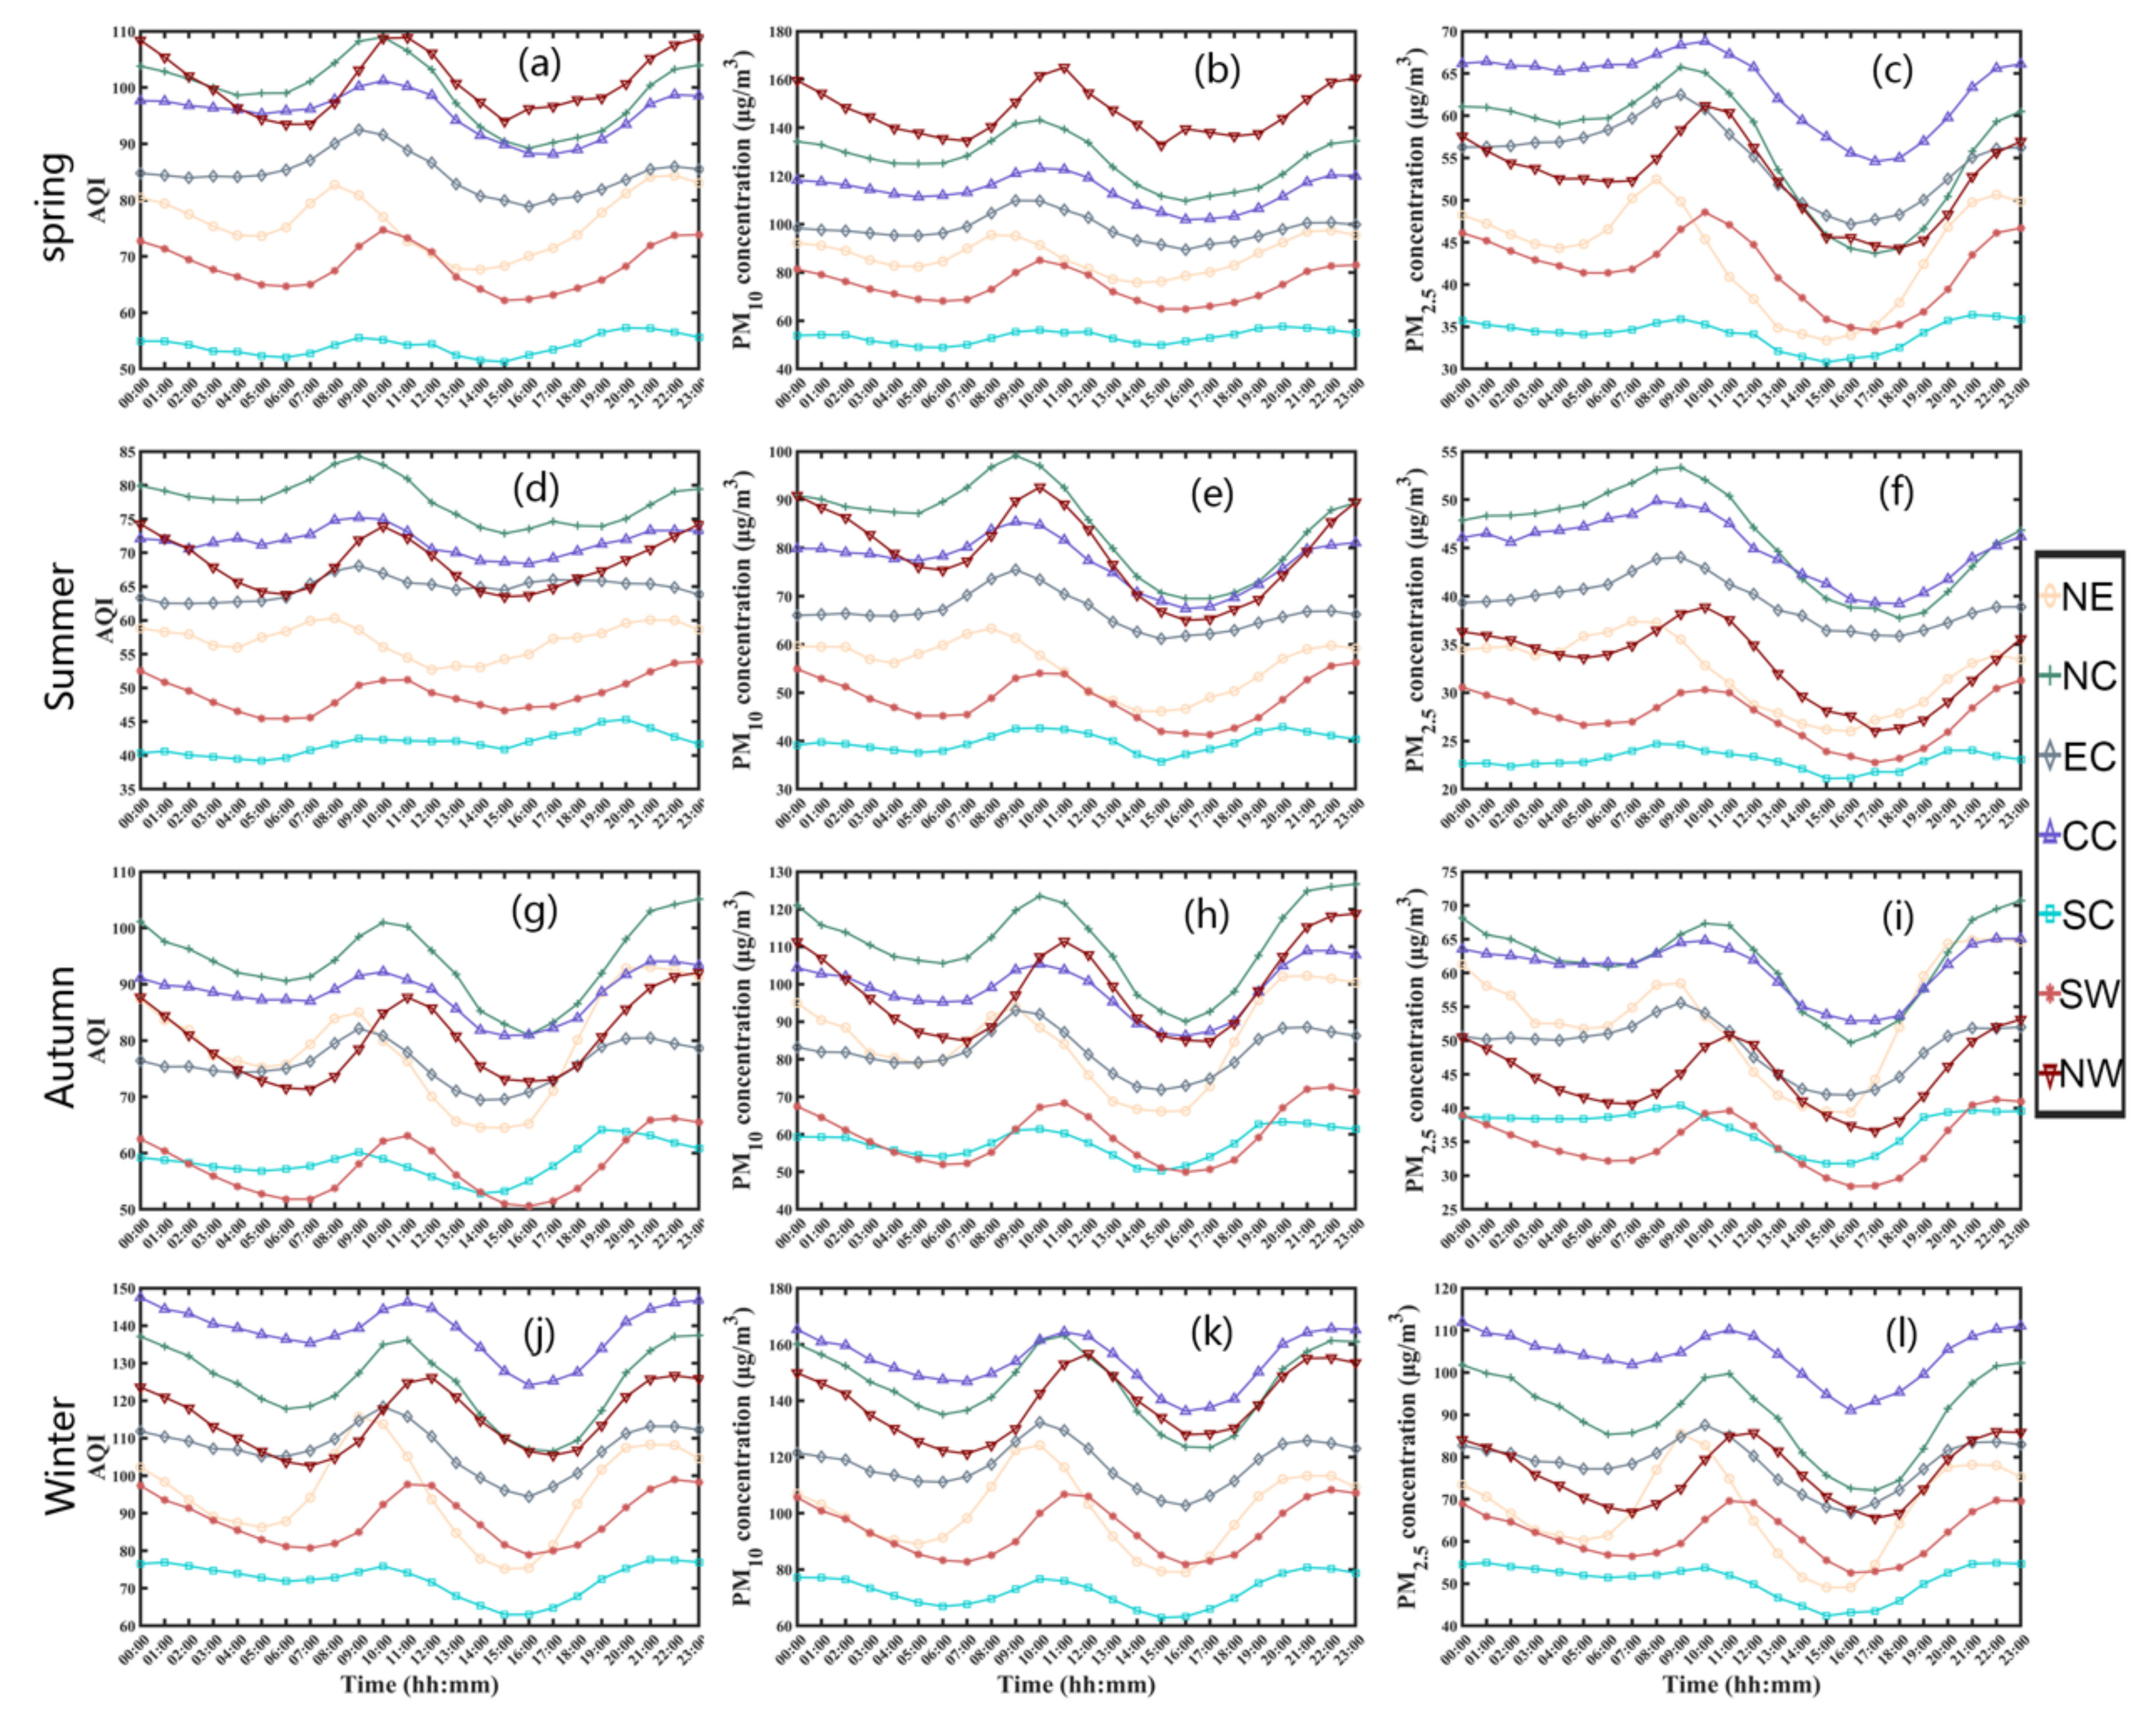
3.2. Comparisons of Air Pollution in Seven Geographic Regions
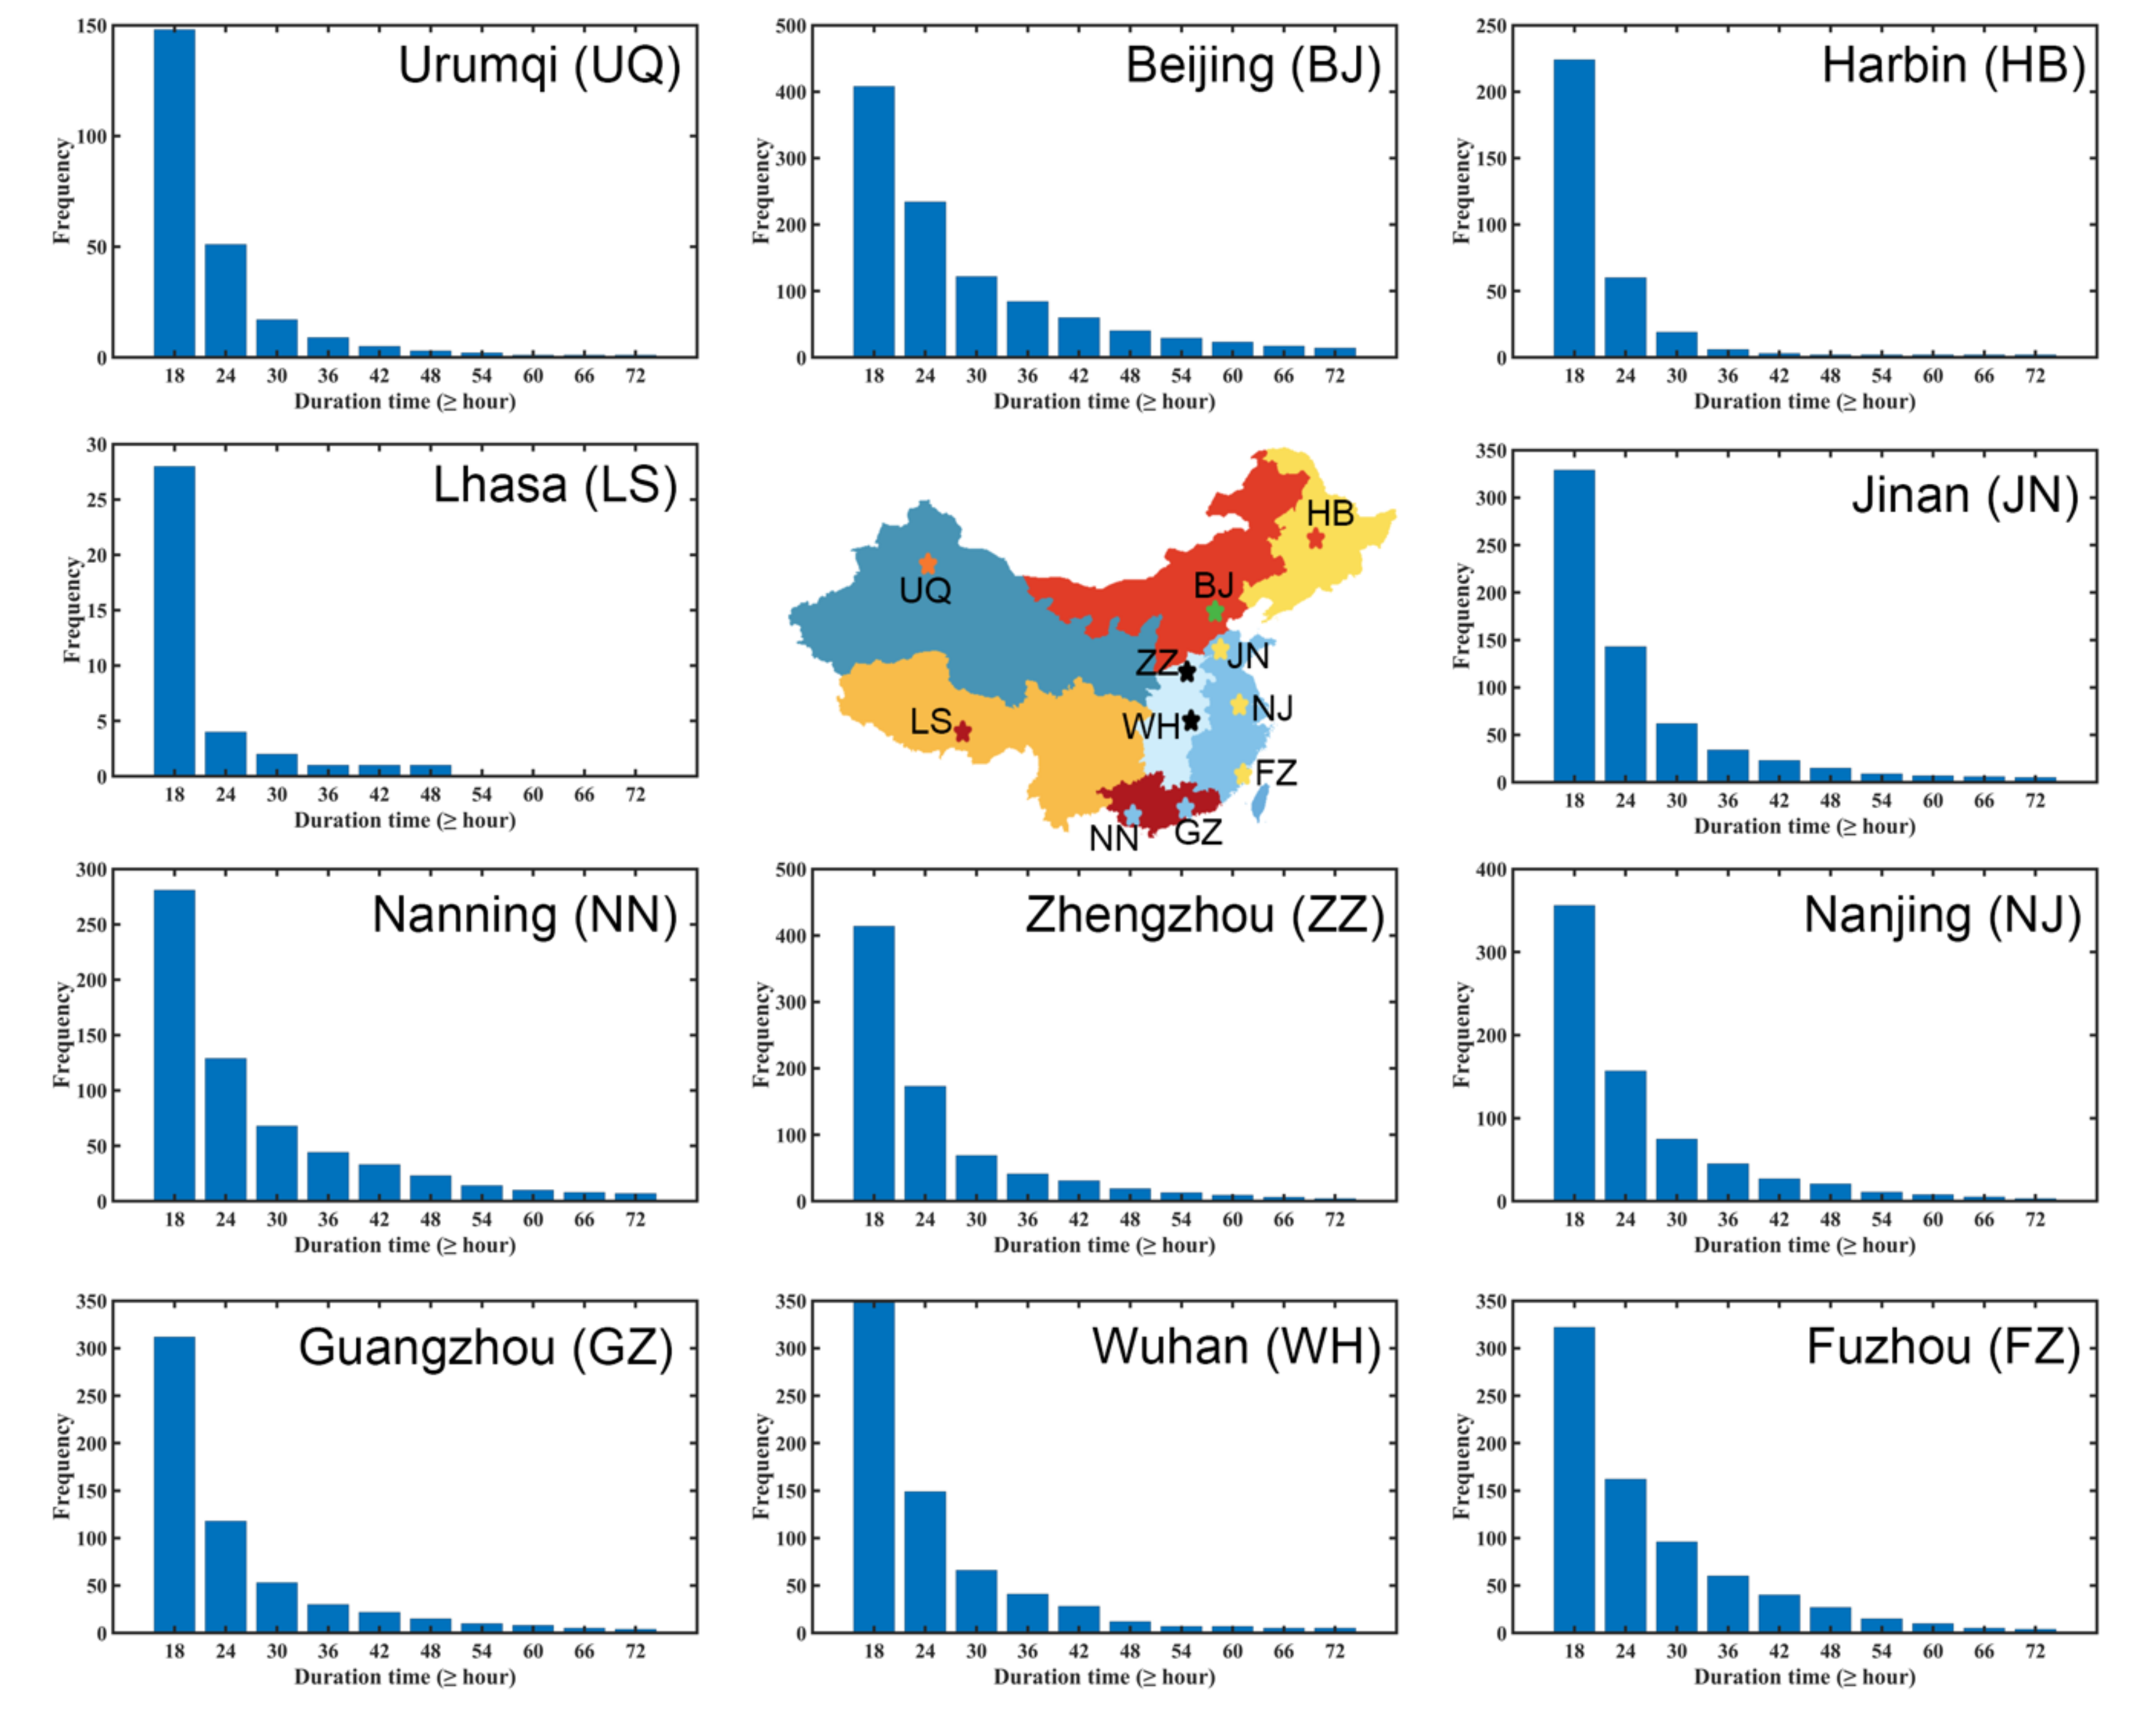
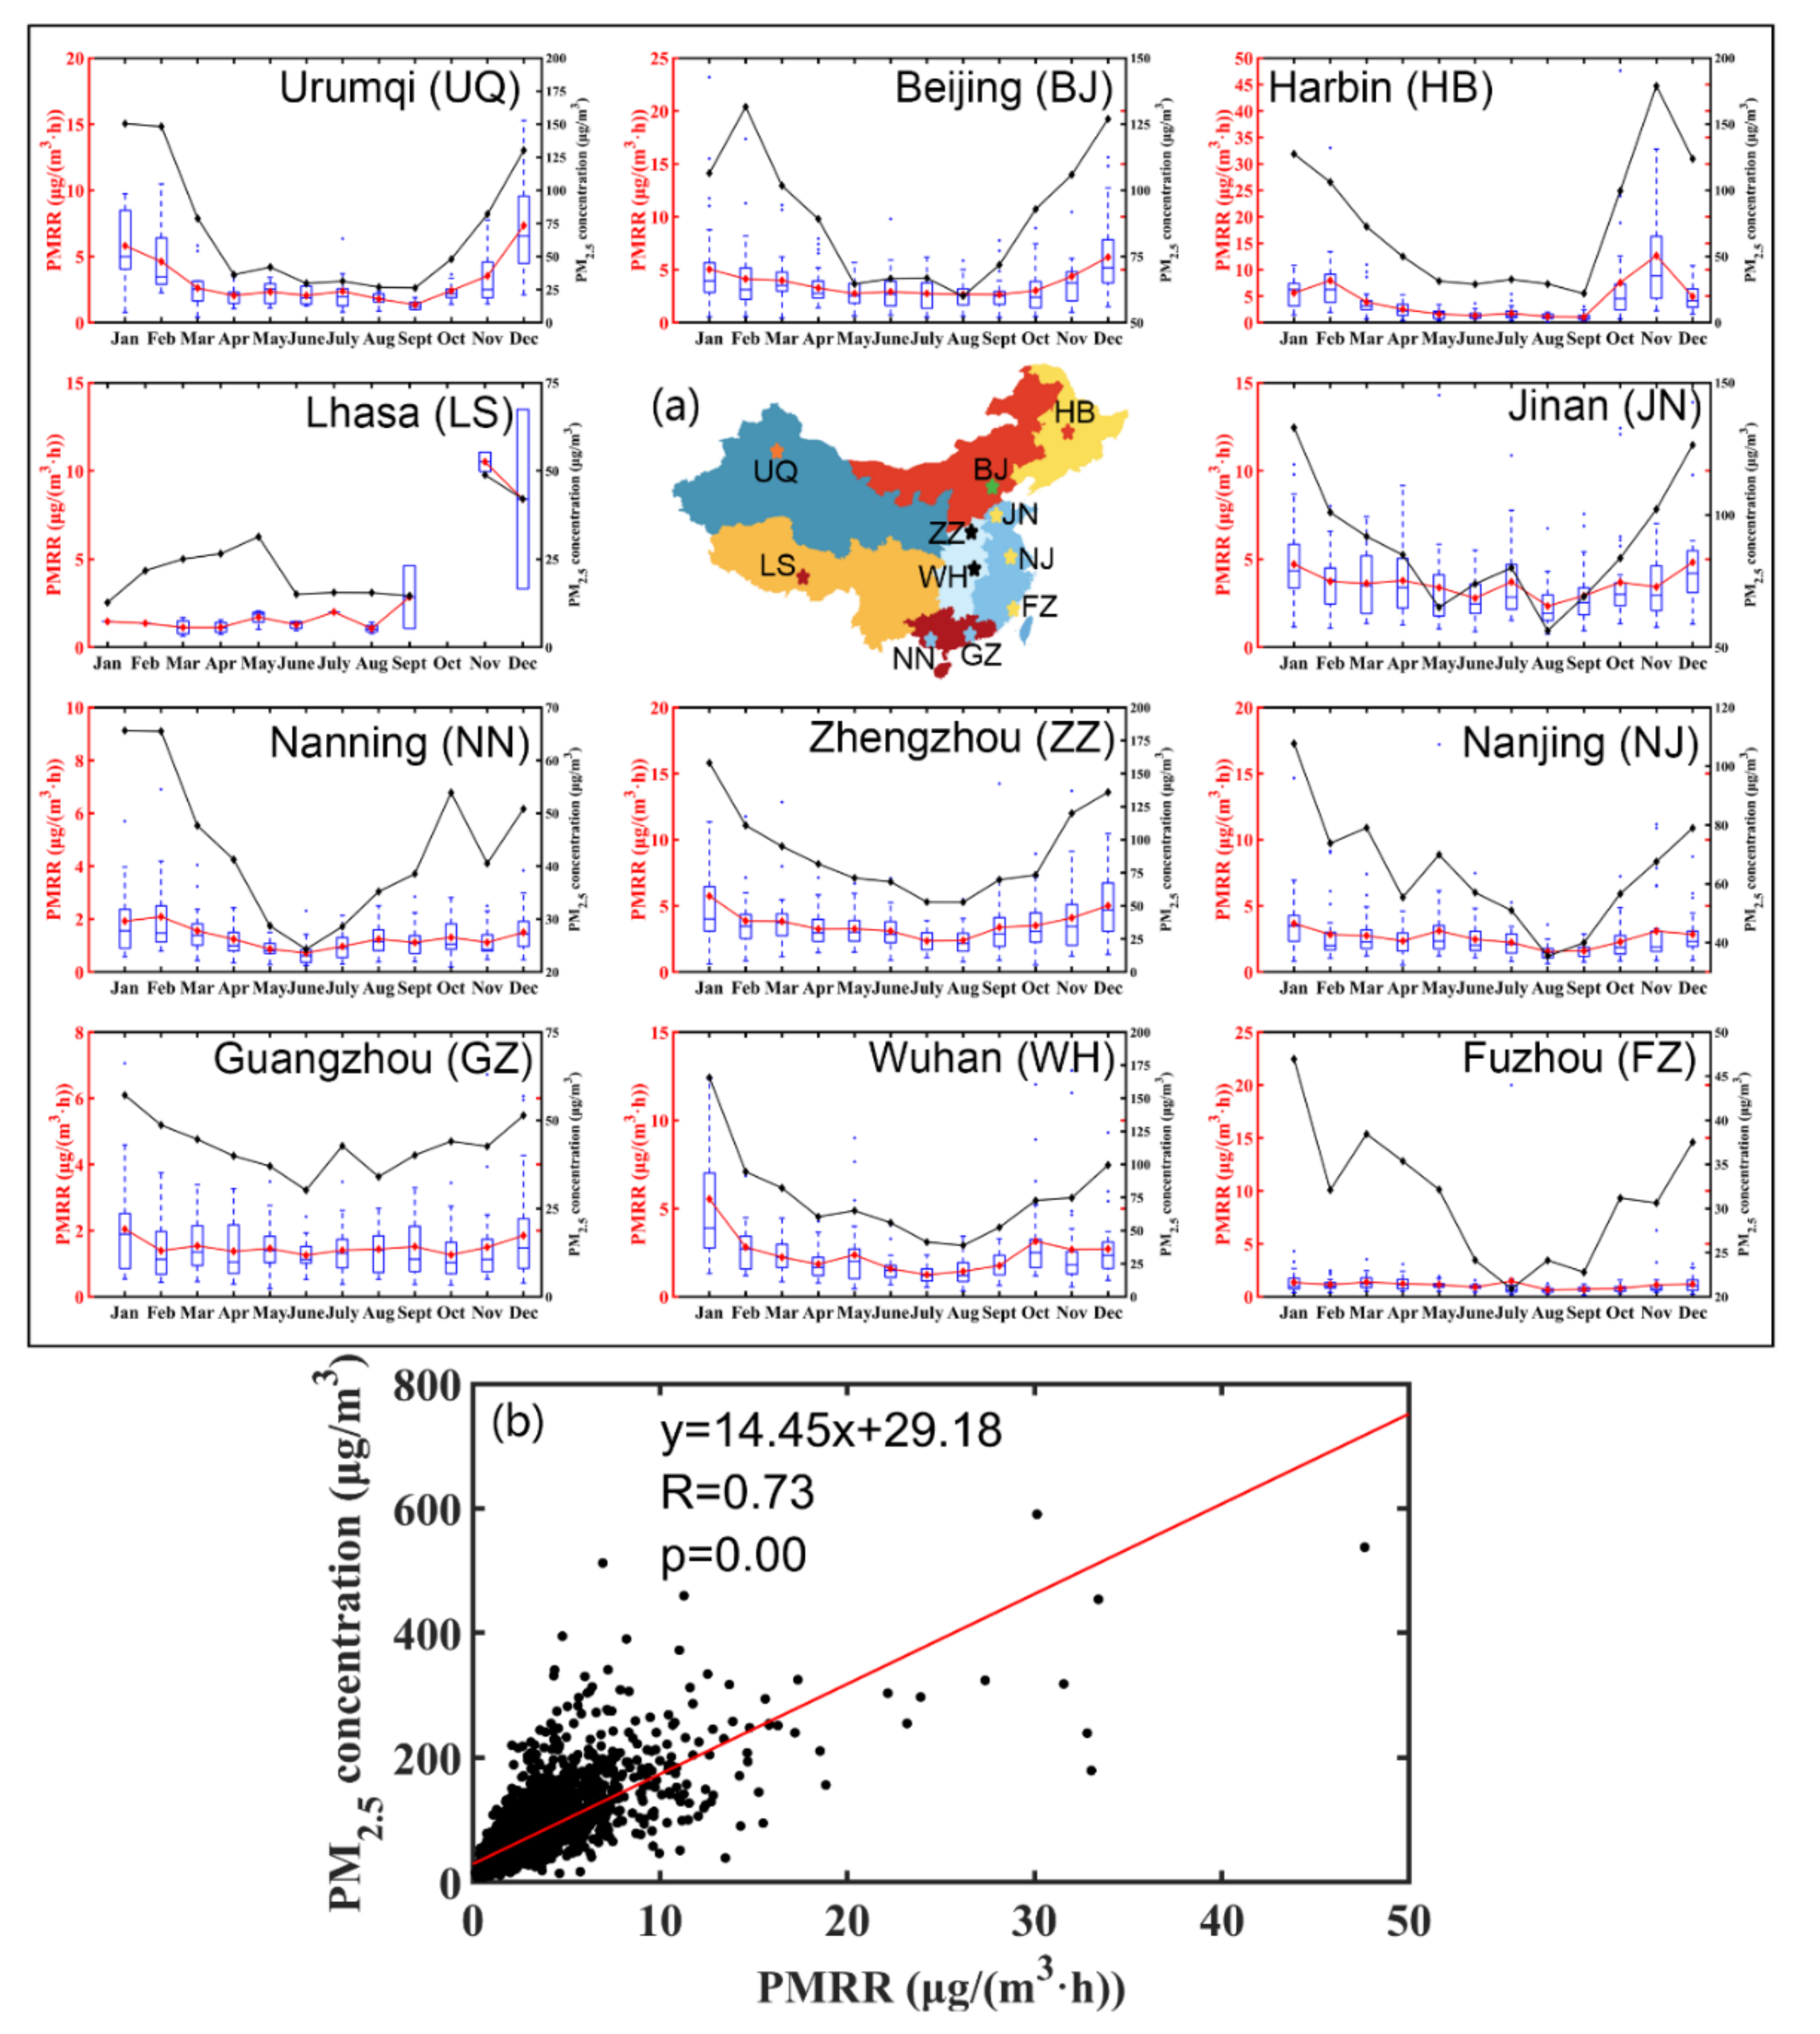
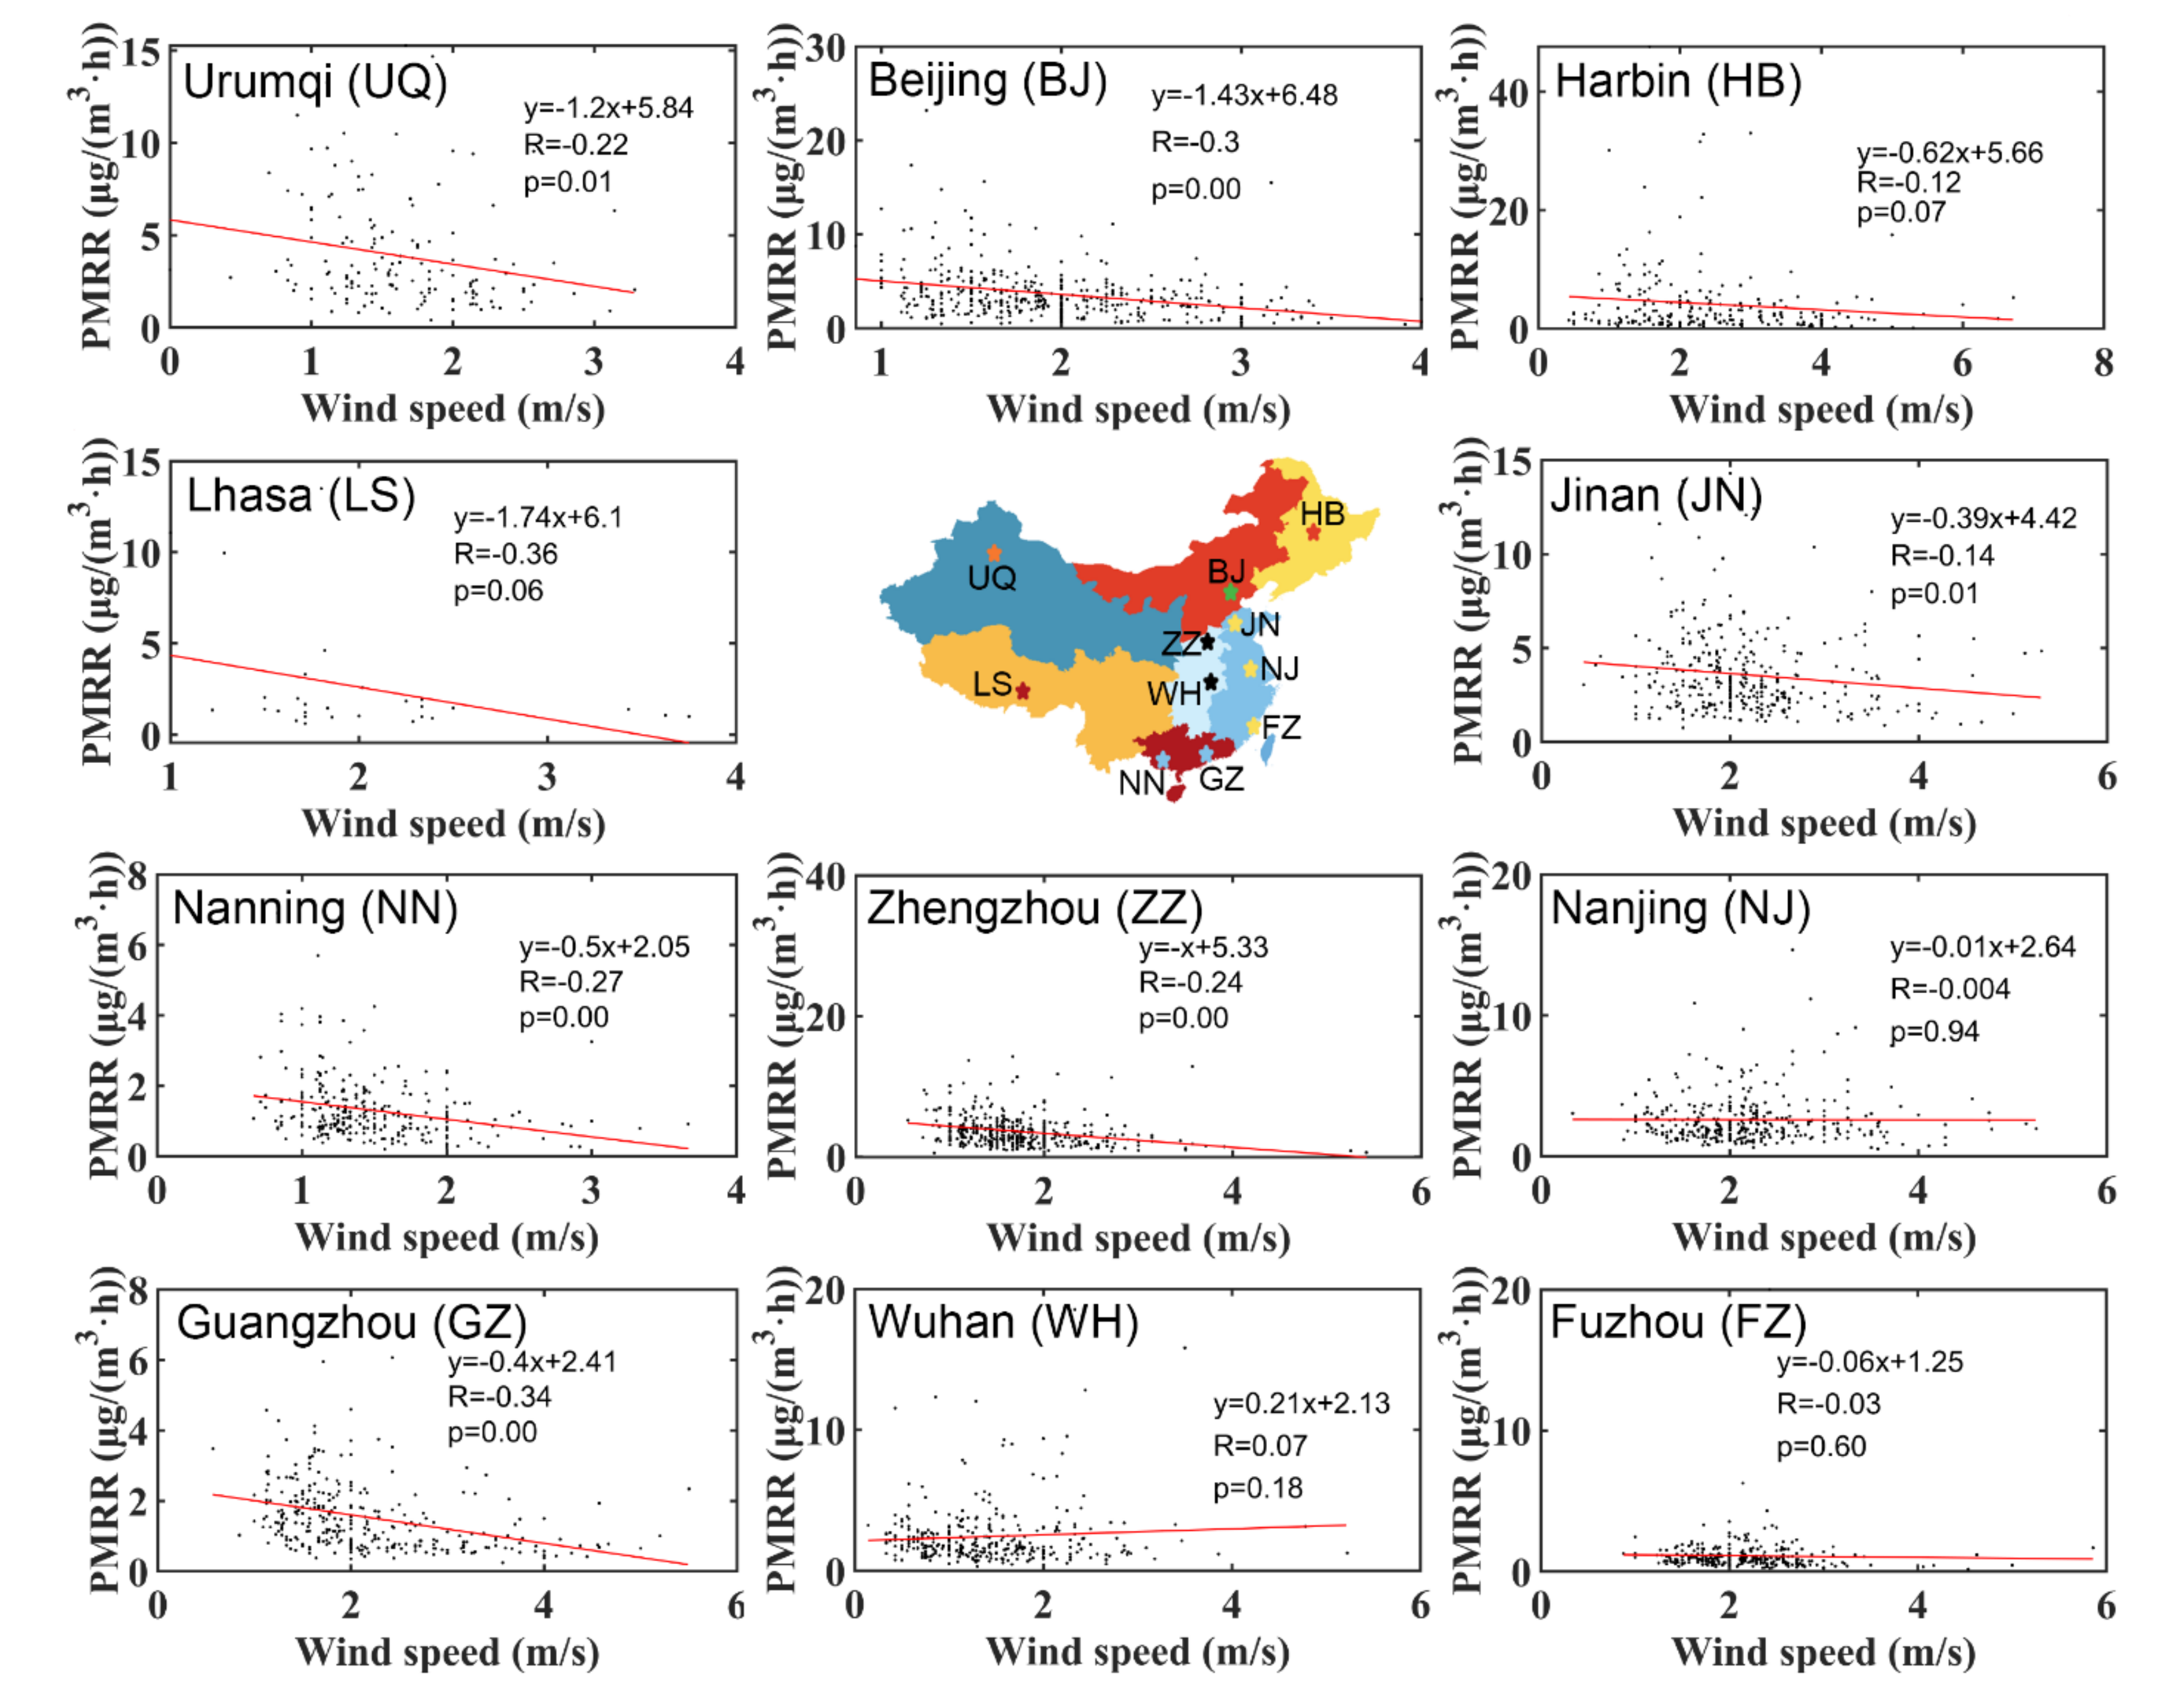
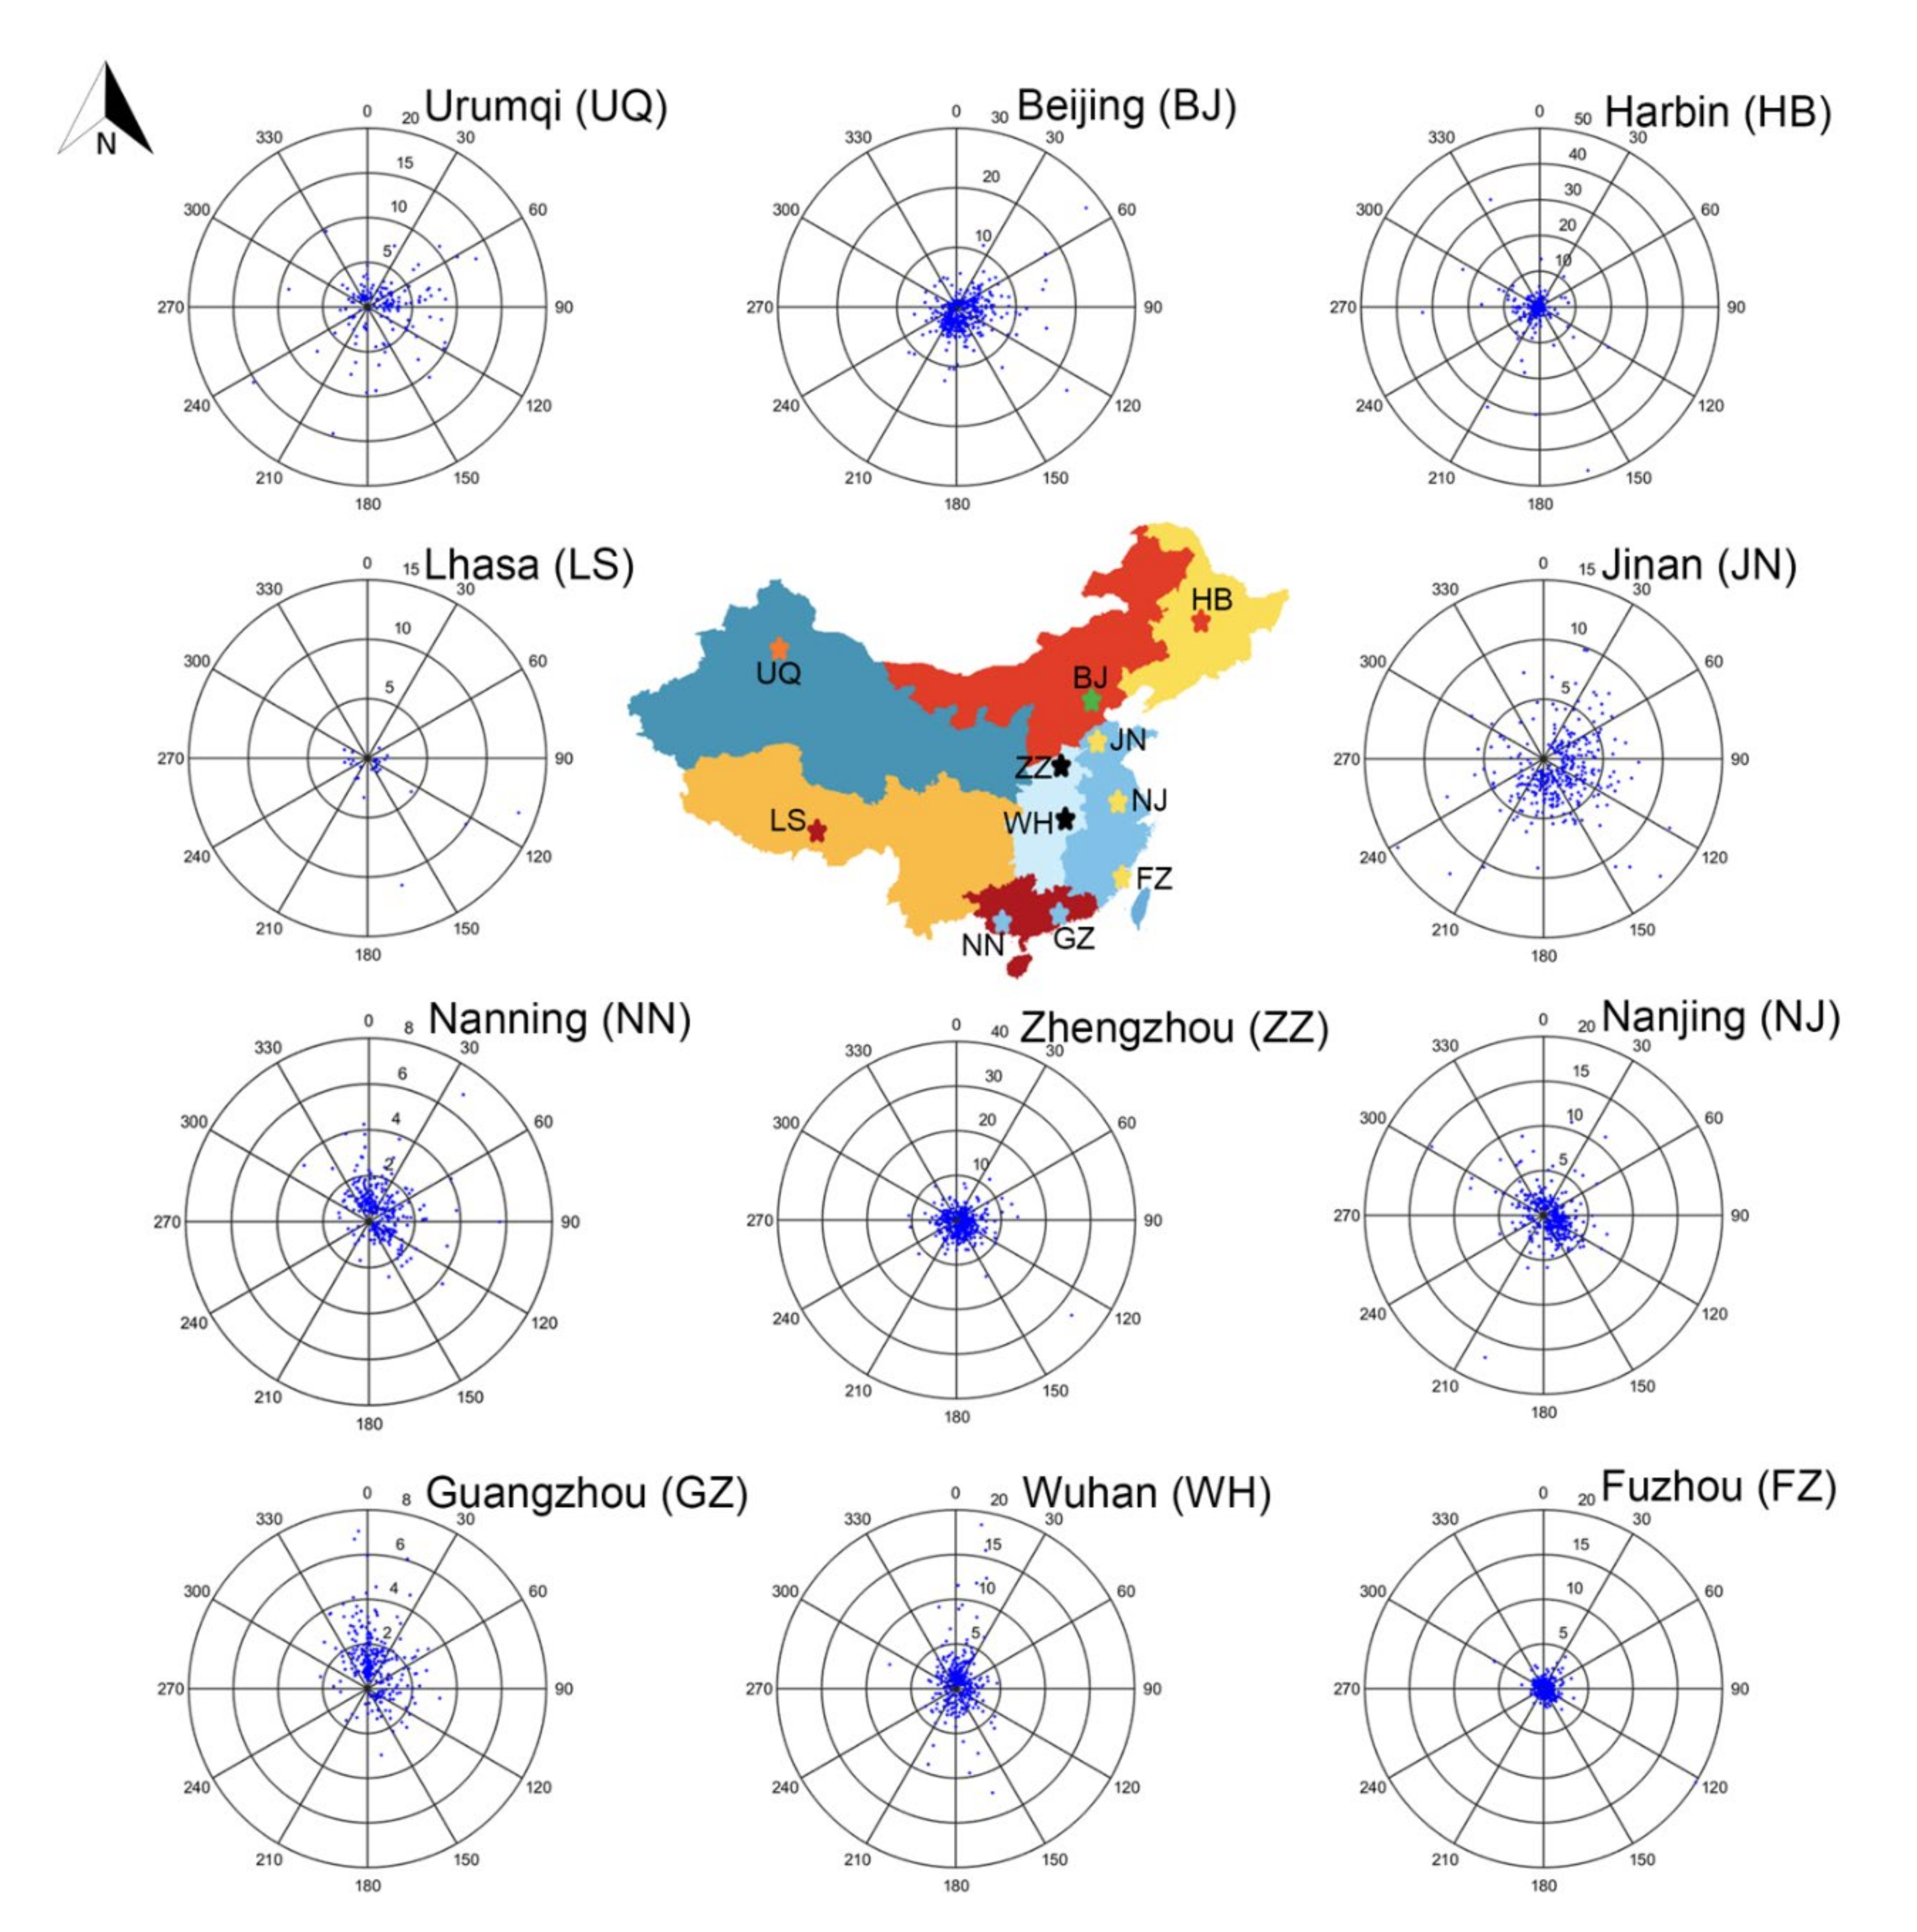
3.3. PM2.5 Pollution Processes in the 11 Typical Cities
4. Conclusions and Summary
Author Contributions
Funding
Data Availability Statement
Acknowledgments
Conflicts of Interest
References
- Guan, W.J.; Zheng, X.Y.; Chung, K.F.; Zhong, N.S. Impact of air pollution on the burden of chronic respiratory diseases in China: Time for urgent action. Lancet 2016, 388, 1939–1951. [Google Scholar] [CrossRef]
- Song, C.; Wu, L.; Xie, Y.; He, J.; Chen, X.; Wang, T.; Lin, Y.; Jin, T.; Wang, A.; Liu, Y. Air pollution in China: Status and spatiotemporal variations. Environ. Pollut. 2017, 227, 334–347. [Google Scholar] [CrossRef]
- Van der A, R.J.; Mijling, B.; Ding, J.; Koukouli, M.E.; Liu, F.; Li, Q.; Mao, H.; Theys, N. Cleaning up the air: Effectiveness of air quality policy for SO2 and NOx emissions in China. Atmos. Chem. Phys. 2017, 17, 1775–1789. [Google Scholar] [CrossRef]
- Wu, Y.; Zhang, S.; Hao, J.; Liu, H.; Wu, X.; Hu, J.; Walsh, M.P.; Wallington, T.J.; Zhang, K.M.; Stevanovic, S. On-road vehicle emissions and their control in China: A review and outlook. Sci. Total Environ. 2017, 574, 332–349. [Google Scholar] [CrossRef]
- He, J.; Gong, S.; Yu, Y.; Yu, L.; Wu, L.; Mao, H.; Song, C.; Zhao, S.; Liu, H.; Li, X. Air pollution characteristics and their relation to meteorological conditions during 2014–2015 in major Chinese cities. Environ. Pollut. 2017, 223, 484–496. [Google Scholar] [CrossRef]
- Wang, Y.Q.; Zhang, X.Y.; Sun, J.Y.; Zhang, X.C.; Che, H.Z.; Li, Y. Spatial and temporal variations of the concentrations of PM10, PM2.5 and PM1 in China. Atmos. Chem. Phys. 2015, 15, 13585–13598. [Google Scholar] [CrossRef]
- Yang, X.; Jiang, L.; Zhao, W.; Xiong, Q.; Zhao, W.; Yan, X. Comparison of Ground-Based PM2.5 and PM10 Concentrations in China, India, and the U.S. Int. J. Environ. Res. Public Health 2018, 15, 1382. [Google Scholar] [CrossRef] [PubMed]
- Zheng, M.; Salmon, L.; Schauer, J.; Zeng, L.; Kiang, C.; Zhang, Y.; Cass, G. Seasonal trends in PM2.5 source contributions in Beijing, China. Atmos. Environ. 2005, 39, 3967–3976. [Google Scholar] [CrossRef]
- Wu, G.; Hu, W.; Teng, E.; Wi, F. PM2.5 and PM10 pollution level in the four cities in China. China Environ. 1999, 19, 133–137. [Google Scholar]
- Chu, P.C.; Chen, Y.; Lu, S.; Li, Z.; Lu, Y. Particulate air pollution in Lanzhou China. Environ. Int. 2008, 34, 698–713. [Google Scholar] [CrossRef] [PubMed]
- Zhao, P.S.; Dong, F.; He, D.; Zhao, X.J.; Zhang, X.L.; Zhang, W.Z.; Yao, Q.; Liu, H.Y. Characteristics of concentrations and chemical compositions for PM2.5 in the region of Beijing, Tianjin, and Hebei, China. Atmos. Chem. Phys. 2013, 13, 4631–4644. [Google Scholar] [CrossRef]
- Aaron, V.D.; Randall, V.M.; Michael, B.; Ralph, K.; Robert, L.; Carolyn, V.; Paul, J.V. Global estimates of ambient fine particulate matter concentrations from satellite-based aerosol optical depth: Development and application. Environ. Health Perspect. 2010, 118, 847–855. [Google Scholar]
- Han, Y.; Wu, Y.; Wang, T.; Zhuang, B.; Li, S.; Zhao, K. Impacts of elevated-aerosol-layer and aerosol type on the correlation of AOD and particulate matter with ground-based and satellite measurements in Nanjing, southeast China. Sci. Total Environ. 2015, 532, 195–207. [Google Scholar] [CrossRef] [PubMed]
- Li, S.; Joseph, E.; Min, Q. Remote sensing of ground-level PM2.5 combining AOD and backscattering profile. Remote Sens. Environ. 2016, 183, 120–128. [Google Scholar] [CrossRef]
- Ma, Z.; Hu, X.; Huang, L.; Bi, J.; Liu, Y. Estimating ground-level PM2.5 in China using satellite remote sensing. Environ. Sci. Technol. 2014, 48, 7436. [Google Scholar] [CrossRef]
- Ma, Z.; Hu, X.; Sayer, A.M.; Levy, R.; Zhang, Q.; Xue, Y.; Tong, S.; Bi, J.; Huang, L.; Liu, Y. Satellite-Based Spatiotemporal Trends in PM2.5 Concentrations: China, 2004–2013. Environ. Health Perspect. 2016, 124, 184–192. [Google Scholar] [CrossRef]
- Xin, J.; Gong, C.; Liu, Z.; Cong, Z.; Gao, W.; Song, T.; Pan, Y.; Sun, Y.; Ji, D.; Wang, L. The observation-based relationships between PM2.5 and AOD over China. J. Geophys. Res. Atmos. 2018, 121, 10–701. [Google Scholar]
- Hoff, R.M.; Christopher, S.A. Remote sensing of particulate pollution from space: Have we reached the promised land? J. Air Waste Manag. Assoc. 2009, 59, 642–644. [Google Scholar] [CrossRef]
- Ma, X.; Wang, J.; Yu, F.; Jia, H.; Hu, Y. Can MODIS AOD be employed to derive PM2.5 in Beijing-Tianjin-Hebei over China? Atmos. Res. 2016, 181, 250–256. [Google Scholar] [CrossRef]
- Wang, H.; Sun, F.; Liu, W. Spatial and temporal patterns as well as major influencing factors of global and diffuse Horizontal Irradiance over China: 1960–2014. Sol. Energy 2018, 159, 601–615. [Google Scholar] [CrossRef]
- Hu, J.; Wang, Y.; Ying, Q.; Zhang, H. Spatial and temporal variability of PM2.5 and PM10 over the North China Plain and the Yangtze River Delta, China. Atmos. Environ. 2014, 95, 598–609. [Google Scholar] [CrossRef]
- Xie, Y.; Zhao, B.; Zhang, L.; Luo, R. Spatiotemporal variations of PM2.5 and PM10 concentrations between 31 Chinese cities and their relationships with SO2, NO2, CO and O3. Particuology 2015, 20, 141–149. [Google Scholar] [CrossRef]
- Zhang, Y.; Cao, F. Fine particulate matter (PM2.5) in China at a city level. Sci. Rep. 2015, 5, 14884. [Google Scholar] [CrossRef] [PubMed]
- Zhao, S.; Yu, Y.; Yin, D.; He, J.; Liu, N.; Qu, J.; Xiao, J. Annual and diurnal variations of gaseous and particulate pollutants in 31 provincial capital cities based on in situ air quality monitoring data from China National Environmental Monitoring Center. Environ. Int. 2016, 86, 92–106. [Google Scholar] [CrossRef] [PubMed]
- Lv, B.; Cai, J.; Xu, B.; Bai, Y. Understanding the Rising Phase of the PM2.5 Concentration Evolution in Large China Cities. Sci. Rep. 2017, 7, 46456. [Google Scholar] [CrossRef] [PubMed]
- Albuquerque, P.; Gomes, J.; Bordado, J. Assessment of exposure to airborne ultrafine particles in the urban environment of Lisbon, Portugal. J. Air Waste Manag. Assoc. 2012, 62, 373–380. [Google Scholar] [CrossRef] [PubMed]
- Ruppecht, E.; Meyer, M.; Patashnick, H. The tapered element oscillating microbalance as a tool for measuring ambient particulate concentrations in real time. J. Aerosol Sci. 1992, 23, 635–638. [Google Scholar] [CrossRef]
- Macias, E.S.; Husar, R.B. Atmospheric particulate mass measurement with beta attenuation mass monitor. Environ. Sci. Technol. 1976, 10, 904–907. [Google Scholar] [CrossRef]
- Cressman, G.P. An Operational Objective Analysis System. Mon. Weather Rev. 1959, 87, 367–374. [Google Scholar] [CrossRef]
- Carmen Casas, M.; Herrero, M.; Ninyerola, M.; Pons, X.; Rodríguez, R.; Rius, A.; Redaño, A. Analysis and objective mapping of extreme daily rainfall in Catalonia. Int. J. Climatol. 2007, 27, 399–409. [Google Scholar] [CrossRef]
- Syrakov, D.; Georgieva, E.; Prodanova, M.; Hristova, E.; Gospodinov, I.; Slavov, K.; Veleva, B. Application of WRF-CMAQ Model System for Analysis of Sulfur and Nitrogen Deposition over Bulgaria; Springer: Cham, Switzerland, 2018; pp. 474–482. [Google Scholar]
- Xu, Q.; Qiu, C.J.; Yu, J.X. Adjoint-Method Retrievals of Low-Altitude Wind Fields from Single-Doppler Wind Data. J. Atmos. Ocean. Technol. 1994, 11, 579–585. [Google Scholar] [CrossRef]
- Ray, P.S. Mesoscale Meteorology and Forecasting; American Meteorological Society: Boston, MA, USA, 1986. [Google Scholar]
- Li, H.; Zhang, Q.; Zhang, Q.; Chen, C.; Wang, L.; Wei, Z.; Zhou, S.; Parworth, C.; Zheng, B.; Canonaco, F.; et al. Wintertime aerosol chemistry and haze evolution in an extremely polluted city of the North China Plain: Significant contribution from coal and biomass combustion. Atmos. Chem. Phys. 2017, 17, 4751–4768. [Google Scholar] [CrossRef]
- Guo, S.; Hu, M.; Zamora, M.L.; Peng, J.; Shang, D.; Zheng, J.; Du, Z.; Wu, Z.; Shao, M.; Zeng, L. Elucidating severe urban haze formation in China. Proc. Natl. Acad. Sci. USA 2014, 111, 17373. [Google Scholar] [CrossRef] [PubMed]
- Huang, R.-J.; Zhang, Y.; Bozzetti, C.; Ho, K.-F.; Cao, J.-J.; Han, Y.; Daellenbach, K.R.; Slowik, J.G.; Platt, S.M.; Canonaco, F.; et al. High secondary aerosol contribution to particulate pollution during haze events in China. Nature 2014, 514, 218. [Google Scholar] [CrossRef]
- Sun, B.; Wang, H. A Trend towards a Stable Warm and Windless State of the Surface Weather Conditions in Northern and Northeastern China during 1961–2014. Adv. Atmos. Sci. 2017, 34, 713–726. [Google Scholar] [CrossRef]
- Wang, H.; Shi, G.Y.; Zhang, X.Y.; Gong, S.L.; Tan, S.C.; Chen, B.; Che, H.Z.; Li, T. Mesoscale modelling study of the interactions between aerosols and PBL meteorology during a haze episode in China Jing-Jin-Ji and its near surrounding region—Part 2: Aerosols’ radiative feedback effects. Atmos. Chem. Phys. 2015, 15, 3277–3287. [Google Scholar] [CrossRef]
- Zhang, Z.; Zhang, X.; Zhang, Y.; Wang, Y.; Zhou, H.; Shen, X.; Che, H.; Sun, J.; Lu, Z. Characteristics of chemical composition and role of meteorological factors during heavy aerosol pollution episodes in northern Beijing area in autumn and winter of 2015. Tellus B Chem. Phys. Meteorol. 2017, 69, 1347484. [Google Scholar] [CrossRef]
- Chen, D.; Liu, X.; Lang, J.; Zhou, Y.; Wei, L.; Wang, X.; Guo, X. Estimating the contribution of regional transport to PM 2.5 air pollution in a rural area on the North China Plain. Sci. Total Environ. 2017, 583, 280–291. [Google Scholar] [CrossRef]
- Su, X.; Cao, J.; Li, Z. Regional transport of anthropogenic pollution and dust aerosols in spring to Tianjin—A coastal megacity in China. Sci. Total Environ. 2017, 584, 381–392. [Google Scholar] [CrossRef]
- Xu, W.; Han, T.; Du, W.; Wang, Q.; Chen, C.; Zhao, J.; Zhang, Y.; Li, J.; Fu, P.; Wang, Z. Effects of aqueous-phase and photochemical processing on secondary organic aerosol formation and evolution in Beijing, China. Environ. Sci. Technol. 2017, 51, 762. [Google Scholar] [CrossRef]
- Xu, L.; Batterman, S.; Chen, F.; Li, J.; Zhong, X.; Feng, Y.; Rao, Q.; Chen, F. Spatiotemporal characteristics of PM2.5 and PM10 at urban and corresponding background sites in 23 cities in China. Sci. Total Environ. 2017, 599–600, 2074–2084. [Google Scholar] [CrossRef] [PubMed]
- Luo, H.; Han, Y.; Lu, C.; Yang, J.; Wu, Y. Characteristics of Surface Solar Radiation under Different Air Pollution Conditions over Nanjing, China: Observation and Simulation. Adv. Atmos. Sci. 2019, 36, 1047–1059. [Google Scholar] [CrossRef]
- Li, X.; Song, H.; Zhai, S.; Lu, S.; Kong, Y.; Xia, H.; Zhao, H. Particulate matter pollution in Chinese cities: Areal-temporal variations and their relationships with meteorological conditions (2015–2017). Environ. Pollut. 2019, 246, 11–18. [Google Scholar] [CrossRef] [PubMed]
- Pui, D.Y.H.; Chen, S.C.; Zuo, Z. PM2.5 in China: Measurements, sources, visibility and health effects, and mitigation. Particuology 2014, 13, 1–26. [Google Scholar] [CrossRef]
- Han, Y.; Wu, Y.; Wang, T.; Xie, C.; Zhao, K.; Zhuang, B.; Li, S. Characterizing a persistent Asian dust transport event: Optical properties and impact on air quality through the ground-based and satellite measurements over Nanjing, China. Atmos. Environ. 2015, 115, 304–316. [Google Scholar] [CrossRef]
- Zhuang, Y.; Li, R.; Yang, H.; Chen, D.; Chen, Z.; Gao, B.; He, B. Understanding Temporal and Spatial Distribution of Crop Residue Burning in China from 2003 to 2017 Using MODIS Data. Remote Sens. 2018, 10, 390. [Google Scholar] [CrossRef]
- Zhang, Z.; Jian, G.; Engling, G.; Tao, J.; Chai, F.; Zhang, L.; Zhang, R.; Sang, X.; Chan, C.Y.; Lin, Z. Characteristics and applications of size-segregated biomass burning tracers in China’s Pearl River Delta region. Atmos. Environ. 2015, 102, 290–301. [Google Scholar] [CrossRef]
- Qu, Y.; Han, Y.; Wu, Y.; Gao, P.; Wang, T. Study of PBLH and its correlation with particulate matter from one-year observation over Nanjing, Southeast China. Remote Sens. 2017, 9, 668. [Google Scholar] [CrossRef]
- Mike, P.; Otmar, S.; Joachim, H.; Wolfram, B.; Jüurgen, M.; Ralf, Z.H.; Erich, W.; Annette, P.; Josef, C. Seasonal and diurnal variation of PM2.5 apparent particle density in urban air in Augsburg, Germany. Environ. Sci. Technol. 2008, 42, 5087–5093. [Google Scholar]
- Zhang, R.; Wang, G.; Guo, S.; Zamora, M.L.; Ying, Q.; Lin, Y.; Wang, W.; Hu, M.; Wang, Y. Formation of urban fine particulate matter. Chem. Rev. 2015, 115, 3803–3855. [Google Scholar] [CrossRef]
- Wang, L.; Li, W.; Sun, Y.; Tao, M.; Xin, J.; Song, T.; Li, X.; Zhang, N.; Ying, K.; Wang, Y. PM2.5 Characteristics and Regional Transport Contribution in Five Cities in Southern North China Plain, During 2013–2015. Atmosphere 2018, 9, 157. [Google Scholar] [CrossRef]
- Wang, F.; Chen, D.S.; Cheng, S.Y.; Li, J.B.; Li, M.J.; Ren, Z.H. Identification of regional atmospheric PM transport pathways using HYSPLIT, MM5-CMAQ and synoptic pressure pattern analysis. Environ. Model. Softw. 2010, 25, 927–934. [Google Scholar] [CrossRef]
- Wu, Y.; Han, Y.; Voulgarakis, A.; Wang, T.; Li, M.; Wang, Y.; Xie, M.; Zhuang, B.; Li, S. An agricultural biomass burning episode in eastern China: Transport, optical properties and impacts on regional air quality: An agricultural biomass burning episode. J. Geophys. Res. Atmos. 2017, 122, 2304–2324. [Google Scholar] [CrossRef]
- Zheng, G.J.; Duan, F.K.; Su, H.; Ma, Y.L.; Cheng, Y.; Zheng, B.; Zhang, Q.; Huang, T.; Kimoto, T.; Chang, D.; et al. Exploring the severe winter haze in Beijing: The impact of synoptic weather, regional transport and heterogeneous reactions. Atmos. Chem. Phys. 2015, 15, 2969–2983. [Google Scholar] [CrossRef]
- Li, C.; Han, X.; Kang, S.; Yan, F.; Chen, P.; Hu, Z.; Yang, J.; Ciren, D.; Gao, S.; Sillanpää, M. Heavy near-surface PM2.5 pollution in Lhasa, China during a relatively static winter period. Chemosphere 2019, 214, 314–318. [Google Scholar] [CrossRef]
- Jia, M.W.; Zhao, T.L.; Zhang, X.Z.; Xiang-Hua, W.U.; Tang, L.L.; Wang, L.M.; Chen, Y.S. Seasonal variations in major air pollutants in Nanjing and their meteorological correlation analyses. China Environ. Sci. 2016, 36, 2567–2577. [Google Scholar]
- Cheng, F.; Zha, Y.; Zhang, J.; Junliang, H.; Yan, S. A Study on Distance Transport of PM2.5 to Xianlin in Nanjing, China and its Source Areas. Aerosol Air Qual. Res. 2017, 17, 1672–1683. [Google Scholar] [CrossRef]
- Cui, H.; Chen, W.; Dai, W.; Liu, H.; Wang, X.; He, K. Source apportionment of PM2.5 in Guangzhou combining observation data analysis and chemical transport model simulation. Atmos. Environ. 2015, 116, 262–271. [Google Scholar] [CrossRef]
- Gong, J.; Hu, Y.; Liu, M.; Bu, R.; Chang, Y.; Li, C.; Wu, W. Characterization of Air Pollution Index and Its Affecting Factors in Industrial Urban Areas in Northeastern China. Pol. J. Environ. Stud. 2015, 24, 1579–1592. [Google Scholar] [CrossRef]
- Liu, B.; Na, S.; Dai, Q.; Mei, R.; Sui, B.; Bi, X.; Feng, Y. Chemical composition and source apportionment of ambient PM2.5 during the non-heating period in Taian, China. Atmos. Res. 2016, 170, 23–33. [Google Scholar] [CrossRef]
- Xiong, Y.; Zhou, J.; Schauer, J.J.; Yu, W.; Hu, Y. Seasonal and spatial differences in source contributions to PM2.5 in Wuhan, China. Sci. Total Environ. 2017, 577, 155–165. [Google Scholar] [CrossRef] [PubMed]
- Xu, T.; Chen, H.; Lu, X.; Gross, D.S.; Yang, X.; Mo, Z.; Chen, Z.; Liu, H.; Mao, J.; Liang, G. Single-Particle Characterizations of Ambient Aerosols during a Wintertime Pollution Episode in Nanning: Local Emissions vs. Regional Transport. Aerosol Air Qual. Res. 2017, 17, 49–58. [Google Scholar] [CrossRef]
- Zhang, F.; Chen, J.; Qiu, T.; Yin, L.; Chen, X.; Yu, J. Pollution Characteristics of PM2.5 during a Typical Haze Episode in Xiamen, China. Atmos. Clim. Sci. 2013, 3, 427–439. [Google Scholar] [CrossRef]


| Geographical Subarea | Provinces and Municipalities | Typical City (Cities) |
|---|---|---|
| Northeast China (NE) | Liaoning, Jilin, and Heilongjiang | Harbin |
| North China (NC) | Beijing, Tianjin, Hebei, Shanxi, and Inner Mongolia | Beijing |
| East China (EC) | Jiangsu, Zhejiang, Shanghai, Anhui, Fujian, Shandong, and Jiangxi | Jinan, Nanjing, and Fuzhou |
| Central China (CC) | Hunan, Hubei, and Henan | Wuhan and Zhengzhou |
| South China (SC) | Guangxi, Hainan, and Guangdong | Nanning and Guangzhou |
| Southwest China (SW) | Sichuan, Yunnan, Guizhou, Chongqing, and Tibet | Lhasa |
| Northwest China (NW) | Gansu, Qinghai, Ningxia, Shaanxi, and Xinjiang | Urumqi |
| City | Three-Year Average Wind Speed (m/s) | Average Wind Speed During PM2.5 Pollution Processes (m/s) | Change Rate of Wind Speed |
|---|---|---|---|
| Urumqi | 2.01 | 1.63 | −18.91% |
| Wuhan | 1.69 | 1.4 | −17.06% |
| Nanjing | 2.62 | 2.21 | −15.65% |
| Zhengzhou | 1.98 | 1.71 | −13.64% |
| Harbin | 2.71 | 2.41 | −11.07% |
| Beijing | 2.17 | 1.95 | −10.14% |
| Nanning | 1.65 | 1.47 | −10.91% |
| Jinan | 2.4 | 2.16 | −10% |
| Guangzhou | 2.31 | 2.15 | −6.93% |
| Fuzhou | 2.29 | 2.15 | −6.11% |
| Lhasa | 1.96 | 2.02 | 3.06% |
Publisher’s Note: MDPI stays neutral with regard to jurisdictional claims in published maps and institutional affiliations. |
© 2020 by the authors. Licensee MDPI, Basel, Switzerland. This article is an open access article distributed under the terms and conditions of the Creative Commons Attribution (CC BY) license (http://creativecommons.org/licenses/by/4.0/).
Share and Cite
Luo, H.; Han, Y.; Cheng, X.; Lu, C.; Wu, Y. Spatiotemporal Variations in Particulate Matter and Air Quality over China: National, Regional and Urban Scales. Atmosphere 2021, 12, 43. https://doi.org/10.3390/atmos12010043
Luo H, Han Y, Cheng X, Lu C, Wu Y. Spatiotemporal Variations in Particulate Matter and Air Quality over China: National, Regional and Urban Scales. Atmosphere. 2021; 12(1):43. https://doi.org/10.3390/atmos12010043
Chicago/Turabian StyleLuo, Hao, Yong Han, Xinghong Cheng, Chunsong Lu, and Yonghua Wu. 2021. "Spatiotemporal Variations in Particulate Matter and Air Quality over China: National, Regional and Urban Scales" Atmosphere 12, no. 1: 43. https://doi.org/10.3390/atmos12010043
APA StyleLuo, H., Han, Y., Cheng, X., Lu, C., & Wu, Y. (2021). Spatiotemporal Variations in Particulate Matter and Air Quality over China: National, Regional and Urban Scales. Atmosphere, 12(1), 43. https://doi.org/10.3390/atmos12010043