Algorithmic Sangfroid? The Decline of Sensitivity of Crude Oil Prices to News on Potentially Disruptive Terror Attacks and Political Unrest


Abstract
1. Introduction
2. Literature Review
3. Research Design
4. Empirical Findings
5. Discussion of Empirical Findings
6. Conclusions
Supplementary Materials
Author Contributions
Funding
Data Availability Statement
Conflicts of Interest
References
- Mehl, A. Large global volatility shocks, equity markets and globalisation 1885–2011. In European Central Bank; Working Paper Series; European Central Bank: Frankfurt, Germany, 2013; p. 1548. [Google Scholar]
- Kolias, C.; Papadamou, S.; Stagiannis, A. Terrorism and capital markets: The effects of the Madrid and London bomb attacks. Int. Rev. Econ. Financ. 2011, 20, 532–541. [Google Scholar] [CrossRef]
- Orbaneja, J.; Iyer, S.; Simkins, B. Terrorism and oil markets: A cross-sectional evaluation. Financ. Res. Lett. 2018, 24, 42–48. [Google Scholar] [CrossRef]
- Tavor, T. The impact of terrorist attacks on the capital market in the last decade. Int. J. Bus. Soc. Sci. 2011, 2, 70–80. [Google Scholar]
- Kilian, L. Not All Oil Price Shocks Are Alike: Disentangling Demand and Supply Shocks in the Crude Oil Market. Am. Econ. Rev. 2009, 99, 1053–1069. [Google Scholar] [CrossRef]
- Cohen, G.; Joutz, F.; Loungani, P. Measuring Energy Security: Trends in the Diversification of Oil and Natural Gas Supplies. In IMF Working Paper; International Monetary Fund: Washington, DC, USA, 2011; ISBN/ISSN 9781455217878/1018-5941. [Google Scholar]
- Alquist, R.; Kilian, L. What Do We Learn from the Price of Crude Oil Futures? J. Appl. Econom. 2010, 25, 539–573. [Google Scholar] [CrossRef]
- Kilian, L. Exogenous Oil Supply Shocks: How Big Are They and How Much Do They Matter for the U.S. Economy? Rev. Econ. Stat. 2008, 90, 216–240. [Google Scholar] [CrossRef]
- Looney, R. Oil Prices and the Iraq War: Market Interpretation of Military Developments. J. Energy Dev. 2003, 29, 25–41. [Google Scholar]
- Arin, K.; Ciferri, D.; Spagnolo, N. The price of terror: The effects of terrorism on stock market returns and volatility. Econ. Lett. 2008, 101, 164–167. [Google Scholar] [CrossRef]
- Chesney, M.; Reshetar, G.; Karaman, M. The impact of terrorism on financial markets: An empirical study. J. Bank. Financ. 2011, 35, 253–267. [Google Scholar] [CrossRef]
- Blomberg, B.; Hess, G.; Jackson, H. Terrorism and thr Returns to Oil. Econ. Politics 2009, 21, 409–432. [Google Scholar] [CrossRef]
- Chen, A.; Siembs, T. The effects of terrorism on global capital markets. Eur. J. Political Econ. 2004, 20, 349–366. [Google Scholar] [CrossRef]
- Eldor, R.; Melnick, R. Financial markets and terrorism. Eur. J. Political Econ. 2004, 20, 367–386. [Google Scholar] [CrossRef]
- Hobbs, J.; Schaupp, L.; Gingrich, J. Terrorism, militarism, and stock returns. J. Financ. Crime 2016, 23, 70–86. [Google Scholar] [CrossRef]
- Shiller, R. From efficient markets theory to behavioral finance. J. Econ. Perspect. 2003, 17, 83–104. [Google Scholar] [CrossRef]
- Mnasri, A.; Nechi, S. Impact of terrorist attacks on stock market volatility in emerging markets. Emerg. Mark. Rev. 2016, 28, 184–202. [Google Scholar] [CrossRef]
- Essaddam, N.; Karagianis, J. Terrorism, country attributes, and the volatility of stock returns. Res. Int. Bus. Financ. 2014, 31, 87–100. [Google Scholar] [CrossRef]
- Brounen, D.; Derwall, J. The impact of terrorist attacks on international stock markets. Eur. Financ. Manag. 2010, 16, 585–598. [Google Scholar] [CrossRef]
- Tavor, T.; Teitler-Regev, S. The impact of disasters and terrorism on the stock market. J. Disaster Risk Stud. 2019, 11, 534. [Google Scholar] [CrossRef]
- Drakos, K. The determinants of terrorist shocks’ cross-market transmission. J. Risk Financ. 2010, 11, 147–163. [Google Scholar] [CrossRef]
- Arif, I.; Suleman, T. Terrorism and Stock Market Linkages: An Empirical Study from a Front-line State. Glob. Bus. Rev. 2017, 18, 365–378. [Google Scholar] [CrossRef]
- Aslam, F.; Kang, H. How different terrorist attacks affect stock markets. Def. Peace Econ. 2013, 26, 634–648. [Google Scholar] [CrossRef]
- Prix, J.; Loistl, O.; Huetl, M. Algorithmic Trading Patterns in Xetra Orders. Eur. J. Financ. 2007, 13, 717–739. [Google Scholar] [CrossRef]
- Domowitz, I.; Yegerman, H. The Cost of Algorithmic Trading: A First Look at Comparative Performance. J. Trading 2006, 1, 33–42. [Google Scholar] [CrossRef]
- Gsell, M. Assessing the Impact of Algorithmic Trading on Markets: A Simulation Approach. In CFS Working Paper No 2008/49; Center for Financial Studies: Frankfurt, Germany, 2008; Available online: https://www.ifk-cfs.de/fileadmin/downloads/publications/wp/08_49.pdf (accessed on 23 December 2020).
- Caivano, V. The impact of high-frequency trading on volatility. Evidence from the Italian market. Quad. Di Finanza 2015, 80, 7–34. [Google Scholar] [CrossRef][Green Version]
- Chaboud, A.; Chiquoine, B.; Hjalmarsson, E.; Vega, C. Rise of the Machines: Algorithmic Trading in the Foreign Exchange Market. J. Financ. 2014, 69, 2045–2084. [Google Scholar] [CrossRef]
- Zheng, B.; Moulines, E.; Abergel, F. Price Jump Prediction in a Limit Order Book. J. Math. Financ. 2013, 3, 242–255. [Google Scholar] [CrossRef][Green Version]
- Karagozoglu, A. Direct market access in exchange-traded derivatives: Effects of algorithmic trading on liquidity in futures markets. Rev. Futures Mark. 2011, 19, 95–142. [Google Scholar]
- Kowalewski, O.; Spiewanowski, P. Stock market response to potash mine disasters. J. Commod. Mark. 2020, 20, 100124. [Google Scholar] [CrossRef]
- Capelle-Blancard, G.; Laguna, M. How does the stock market respond to chemical disasters? J. Environ. Econ. Manag. 2010, 59, 192–205. [Google Scholar] [CrossRef]
- Shelor, R.; Anderson, D.; Cross, M. Gaining from loss: Property-liability insurer stock values in the aftermath of the 1989 California earthquake. J. Risk Insur. 1992, 59, 476–488. [Google Scholar] [CrossRef]
- National Consortium for the Study of Terrorism and Responses to Terrorism (START), University of Maryland. The Global Terrorism Database (GTD) [Data file]. 2016. Available online: https://www.start.umd.edu/gtd (accessed on 1 October 2016).
- Renz, B.; Smith, H. Russia and Hybrid Warfare—Going beyond the Label; University of Helsinki: Helsinki, Finland, 2016; Available online: https://www.stratcomcoe.org/bettina-renz-and-hanna-smith-russia-and-hybrid-warfare-going-beyond-label (accessed on 23 December 2020).
- Lujala, P.; Rod, J.; Thieme, N. Fighting over Oil: Introducing a New Dataset. Confl. Manag. Peace Sci. 2007, 24, 239–256. [Google Scholar] [CrossRef]
- Yin, X.; Peng, J.; Tang, T. Improving the forecasting accuracy of crude oil prices. Sustainability 2018, 10, 454. [Google Scholar] [CrossRef]
- Hyndman, R.; Athanasopoulos, G. Forecasting: Principles and Practice; Otexts: Melbourne, Australia, 2013. [Google Scholar]
- Bassil, C.; Hamadi, H.; Bteich, M. Terrorism in OPEC countries and oil prices. Int. J. Emerg. Mark. 2018, 13, 1732–1750. [Google Scholar] [CrossRef]
- Amatov, A.; Dorfman, J. The effect on commodity prices of extraordinary monetary policy. J. Agricutural Appl. Econ. 2017, 49, 83–96. [Google Scholar] [CrossRef]
- Schmidt, T. Financialization of Commodities and the Monetary Transmission Mechanism. Int. J. Political Econ. 2017, 46, 128–149. [Google Scholar] [CrossRef]
- Kiselakova, D.; Filip, P.; Onuferova, E.; Valentiny, T. The Impact of Monetary Policies on the Sustainable Economic and Financial Development in the Euro Area Countries. Sustainability 2020, 12, 9367. [Google Scholar] [CrossRef]
- Beveridge, S.; Nelson, C. A new approach to decomposition of economic time series into permanent and transitory components with particular attention to measurement of the ‘business cycle’. J. Monet. Econ. 1981, 7, 151–174. [Google Scholar] [CrossRef]
- Chen, H.; Liao, H.; Tang, B.; Wei, Y. Impacts of OPEC’s political risk on the international crude oil prices: An empirical analysis based on the SVAR models. Energy Econ. 2016, 57, 42–49. [Google Scholar] [CrossRef]


| Variable Name | Definition of the Variable |
|---|---|
| PRICE.CH | Daily percentage change in oil price |
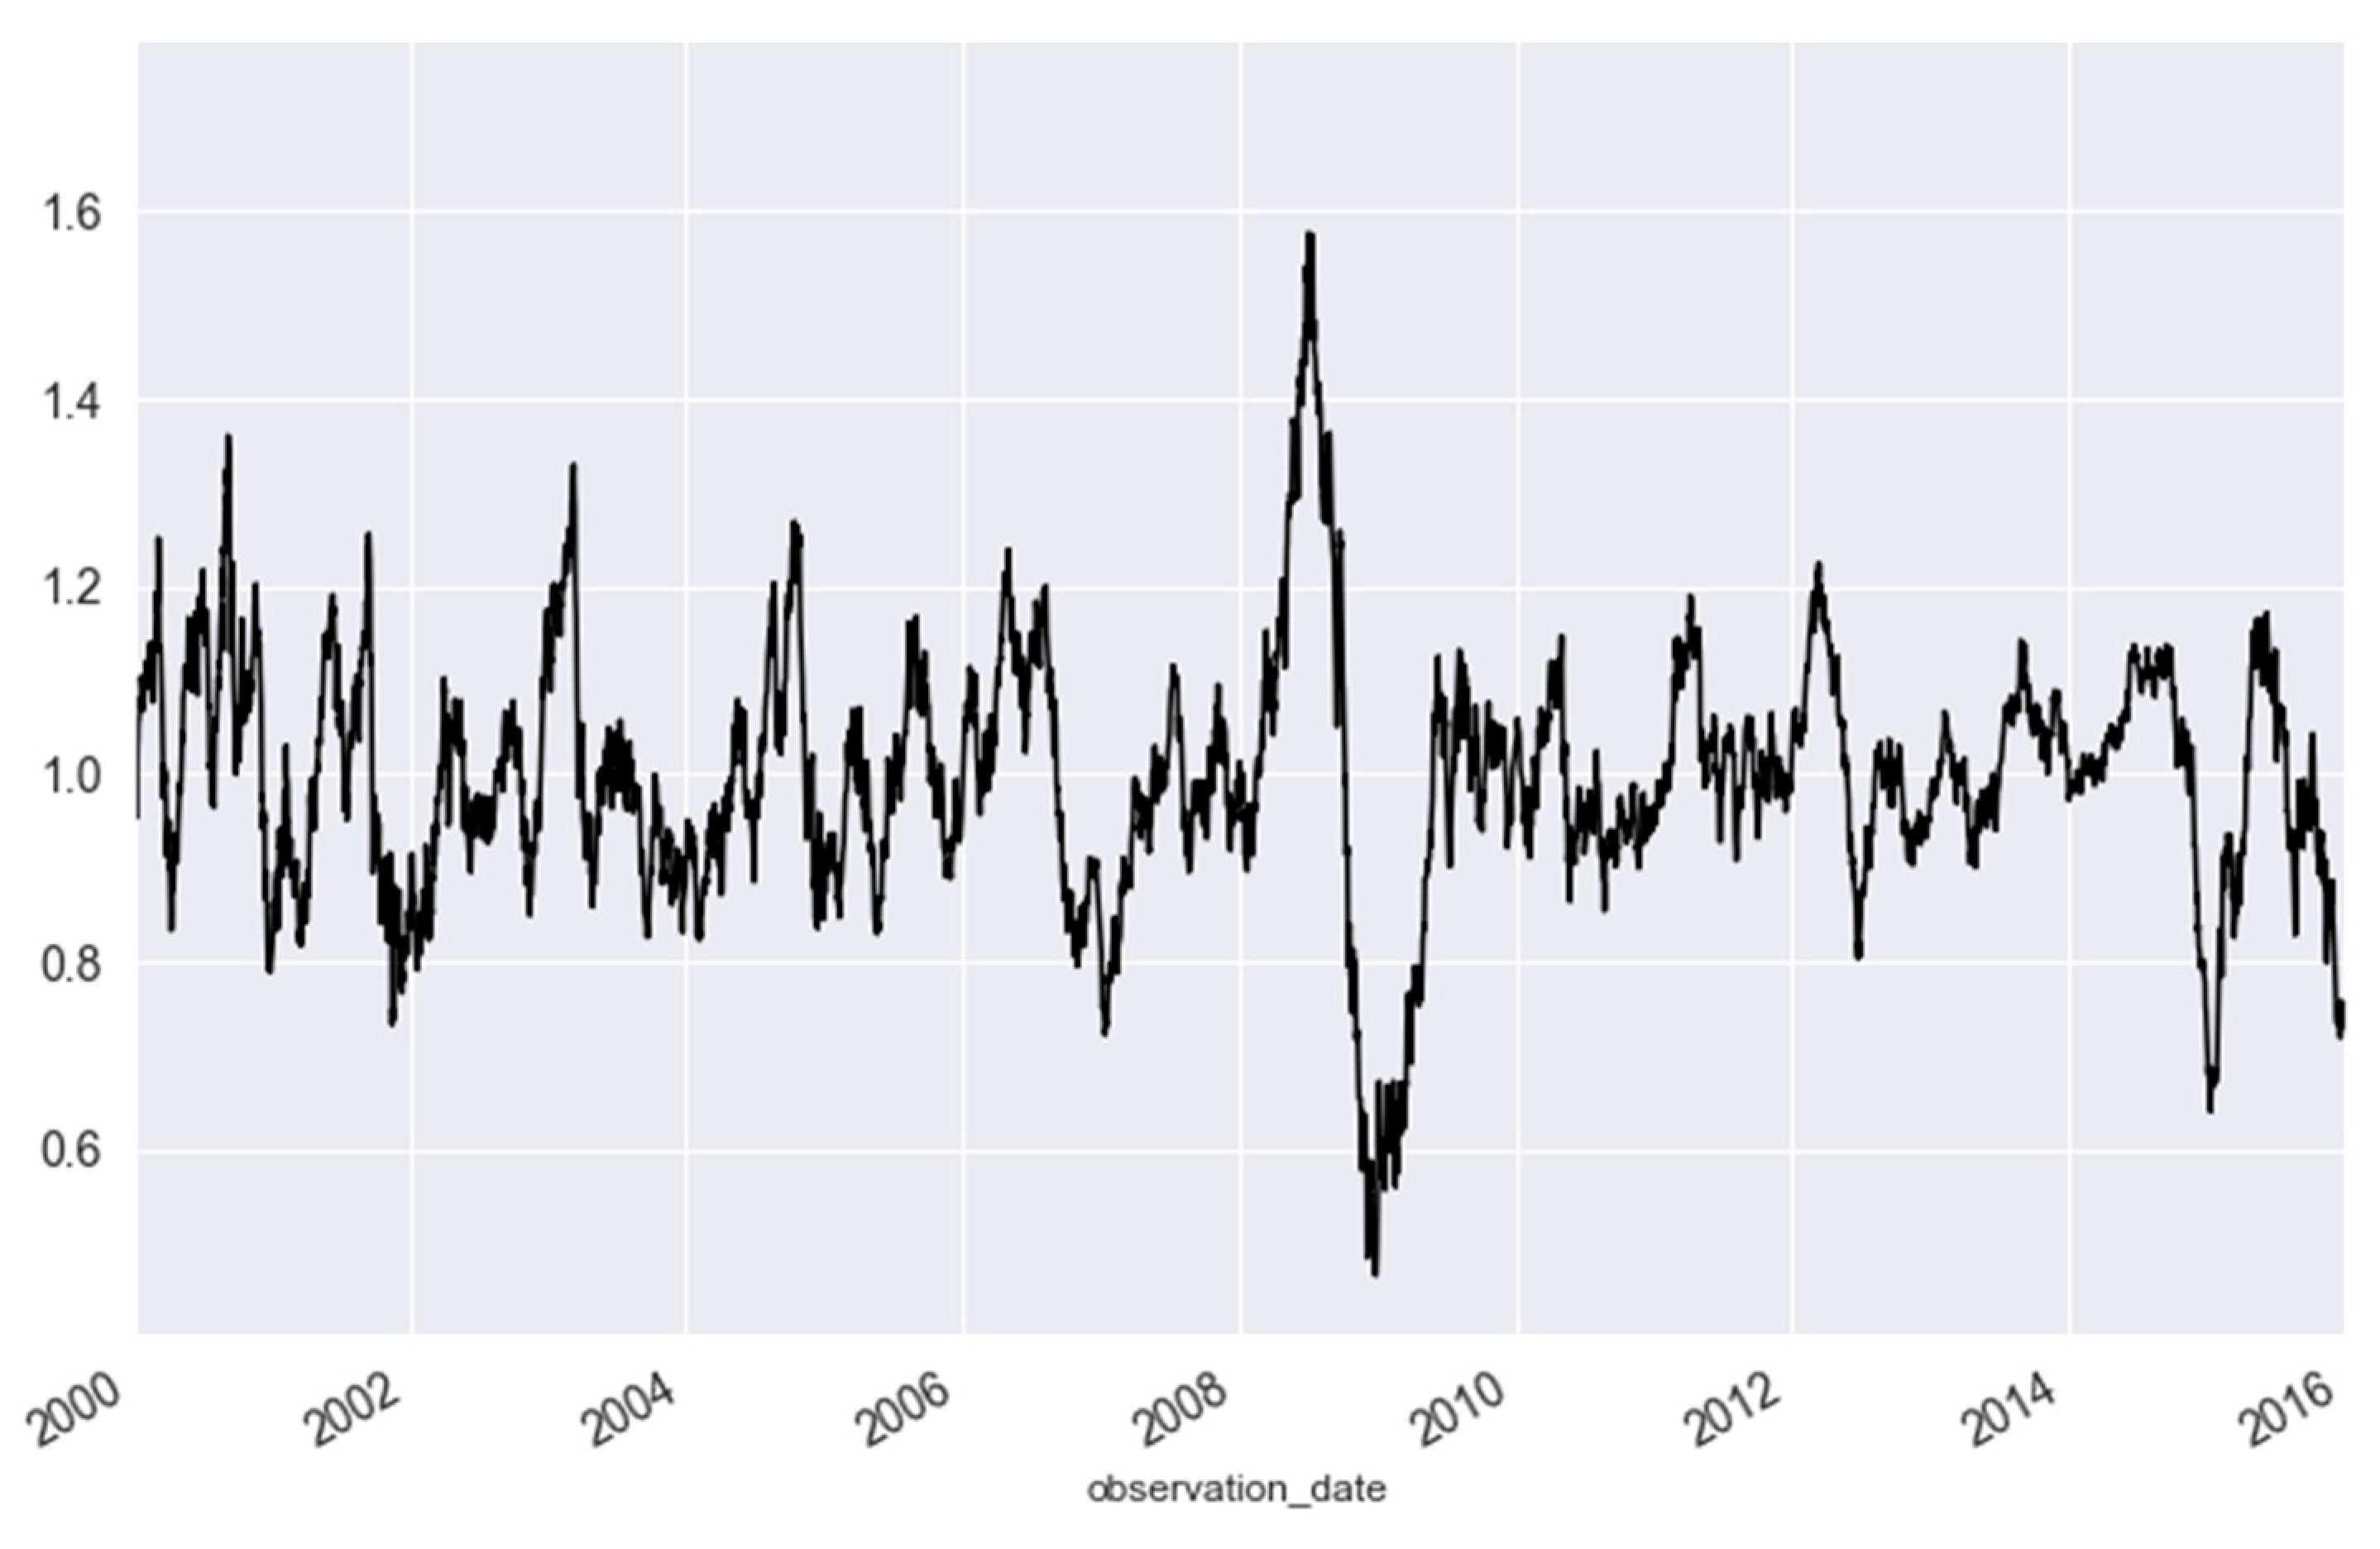
| RESID.PRICE.VOL | Residual daily oil price fluctuations compared to previous-day closing price after filtering out the trend (using Hodrick–Prescott filter) and seasonality components (observation span = 365 days) |
| LOG.RET | Daily logarithmic change in oil prices |
| 3d.ST.DEV | 3-day rolling standards deviation of logarithmic return |
| 30d.ST.DEV | 30-day rolling standards deviation of logarithmic return |
| 180d.ST.DEV | 180-day rolling standards deviation of logarithmic return |
| 365d.ST.DEV | 365-day rolling standards deviation of logarithmic return |
| 3d.RES.PR.VOL | 3-day rolling standard deviation of residual oil price fluctuations |
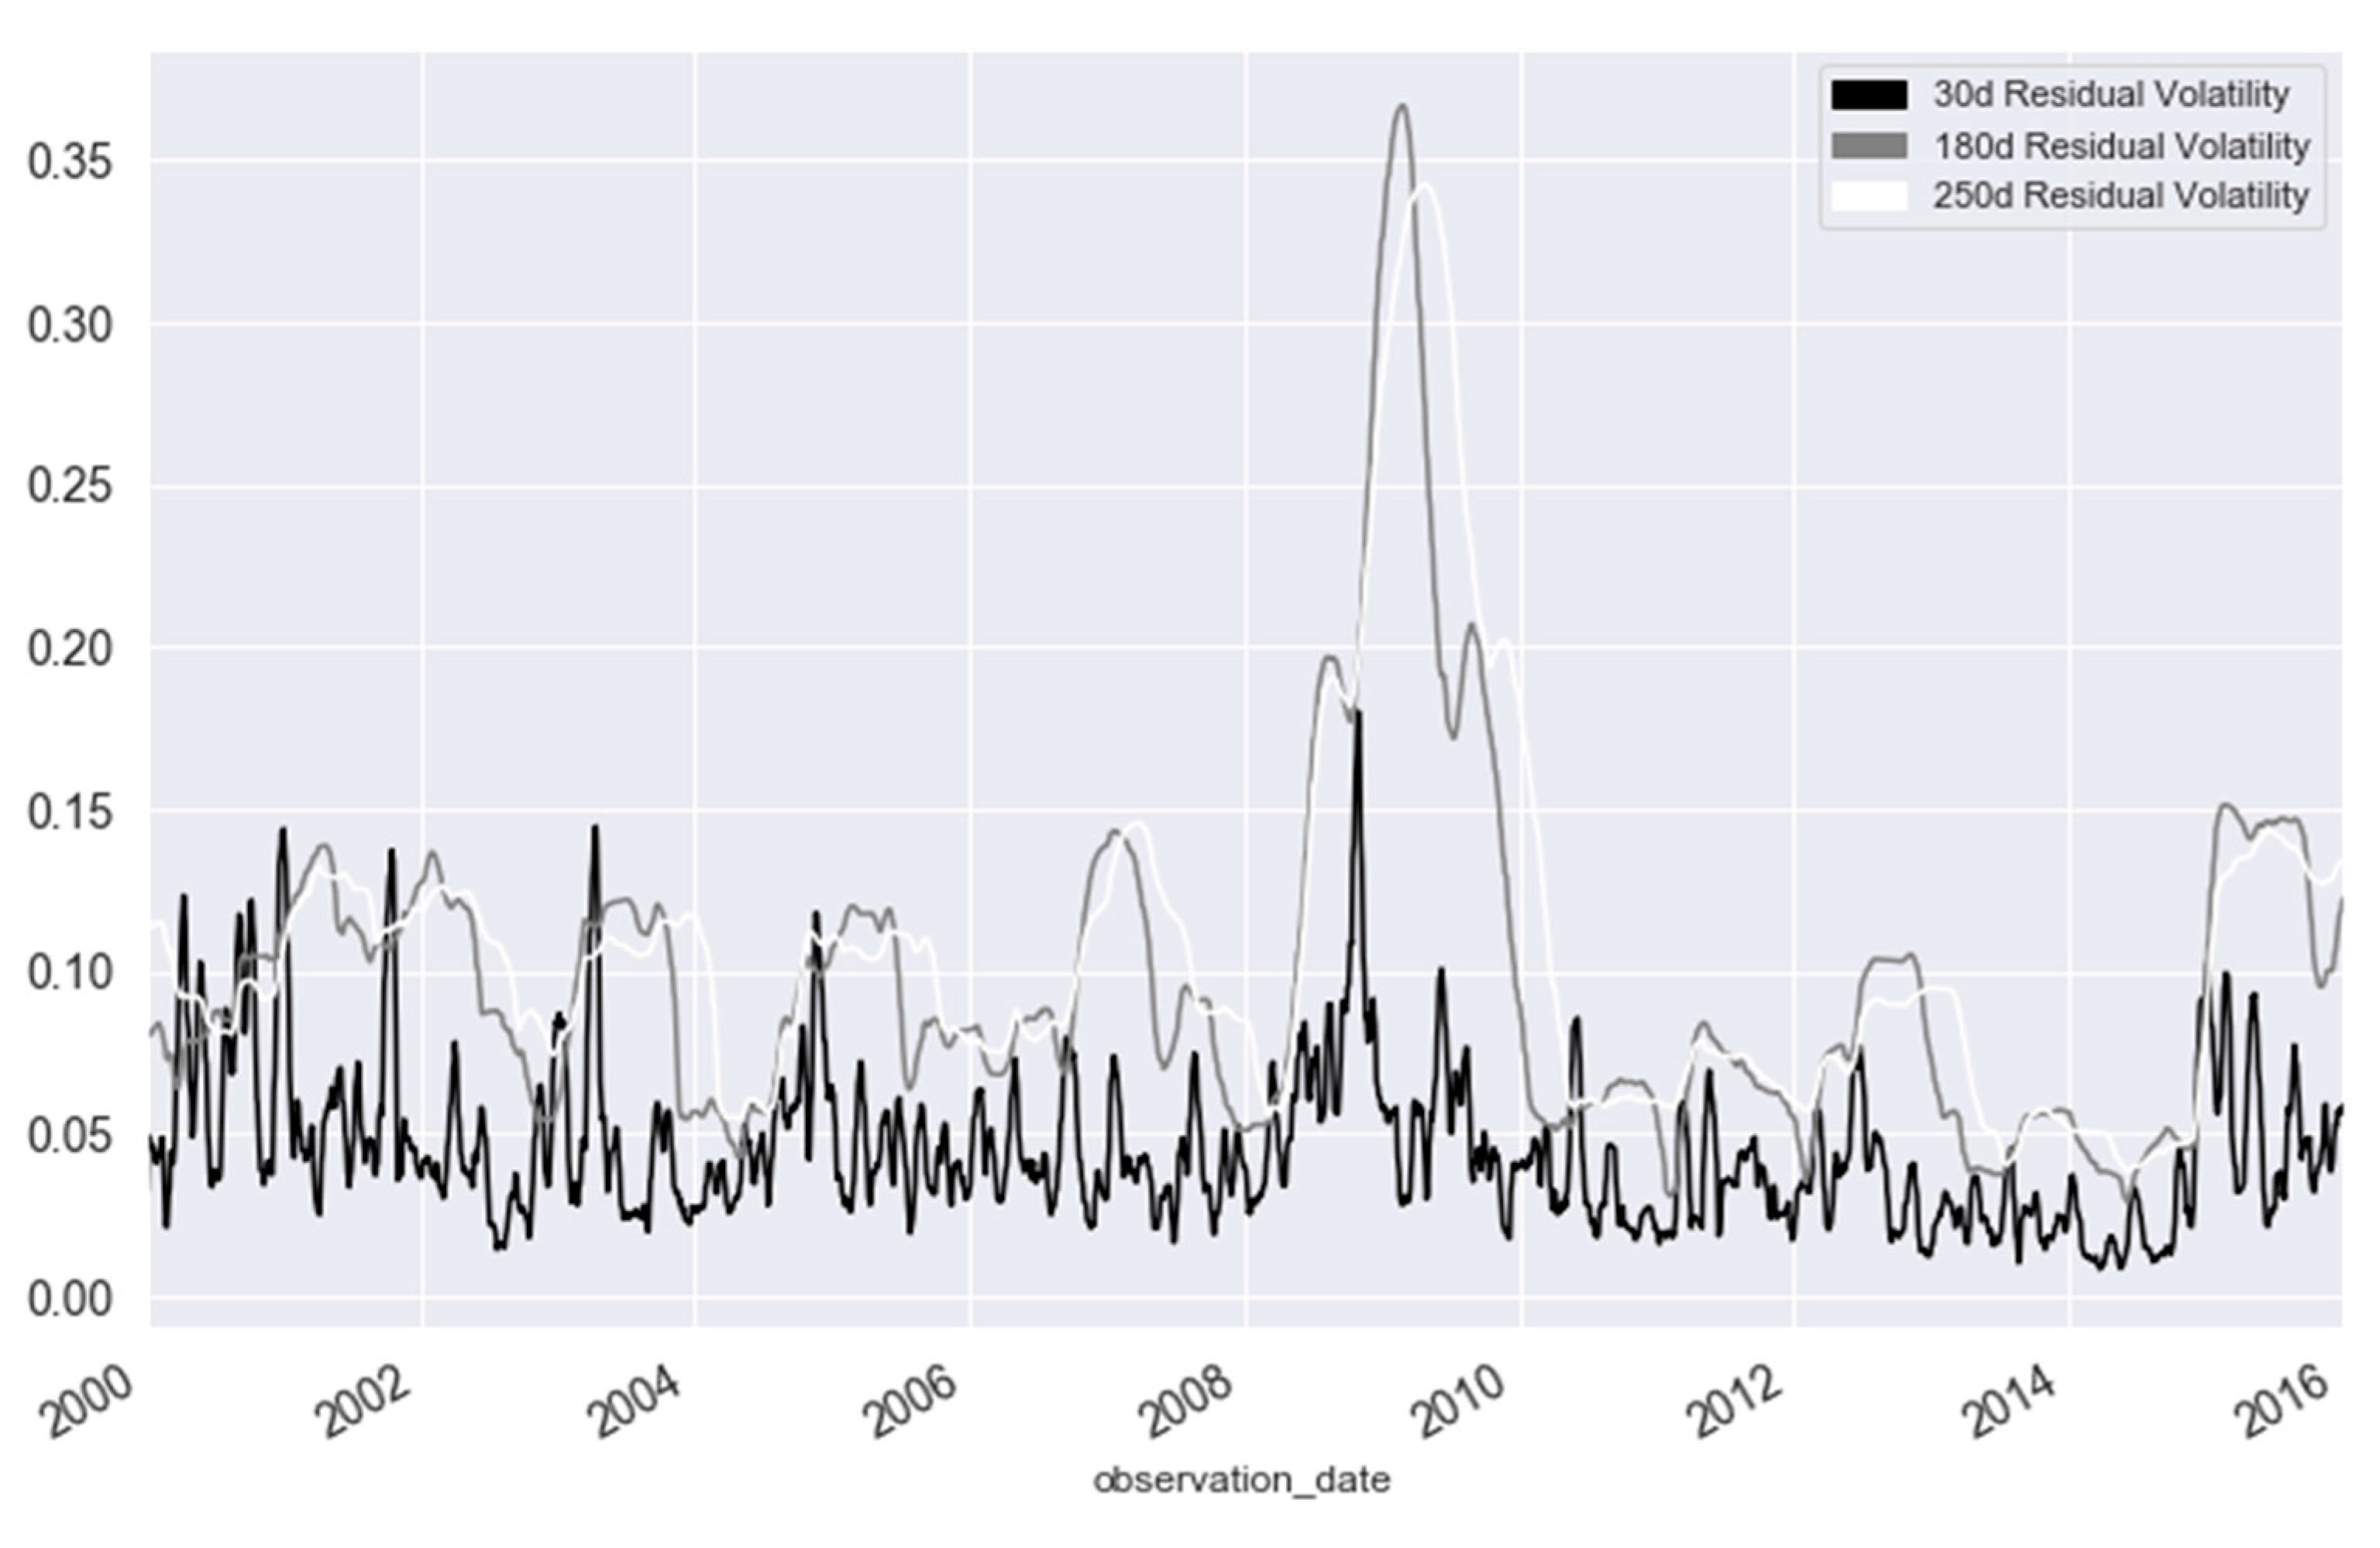
| 30d.RES.PR.VOL | 30-day rolling standard deviation of residual oil price fluctuations |
| 180d.RES.PR.VOL | 180-day rolling standard deviation of residual oil price fluctuations |
| 365d.RES.PR.VOL | 365-day rolling standard deviation of residual oil price fluctuations |
| DIST.DEP | Distance from the location of terrorist attack to the nearest major exploited oil/natural gas deposit |
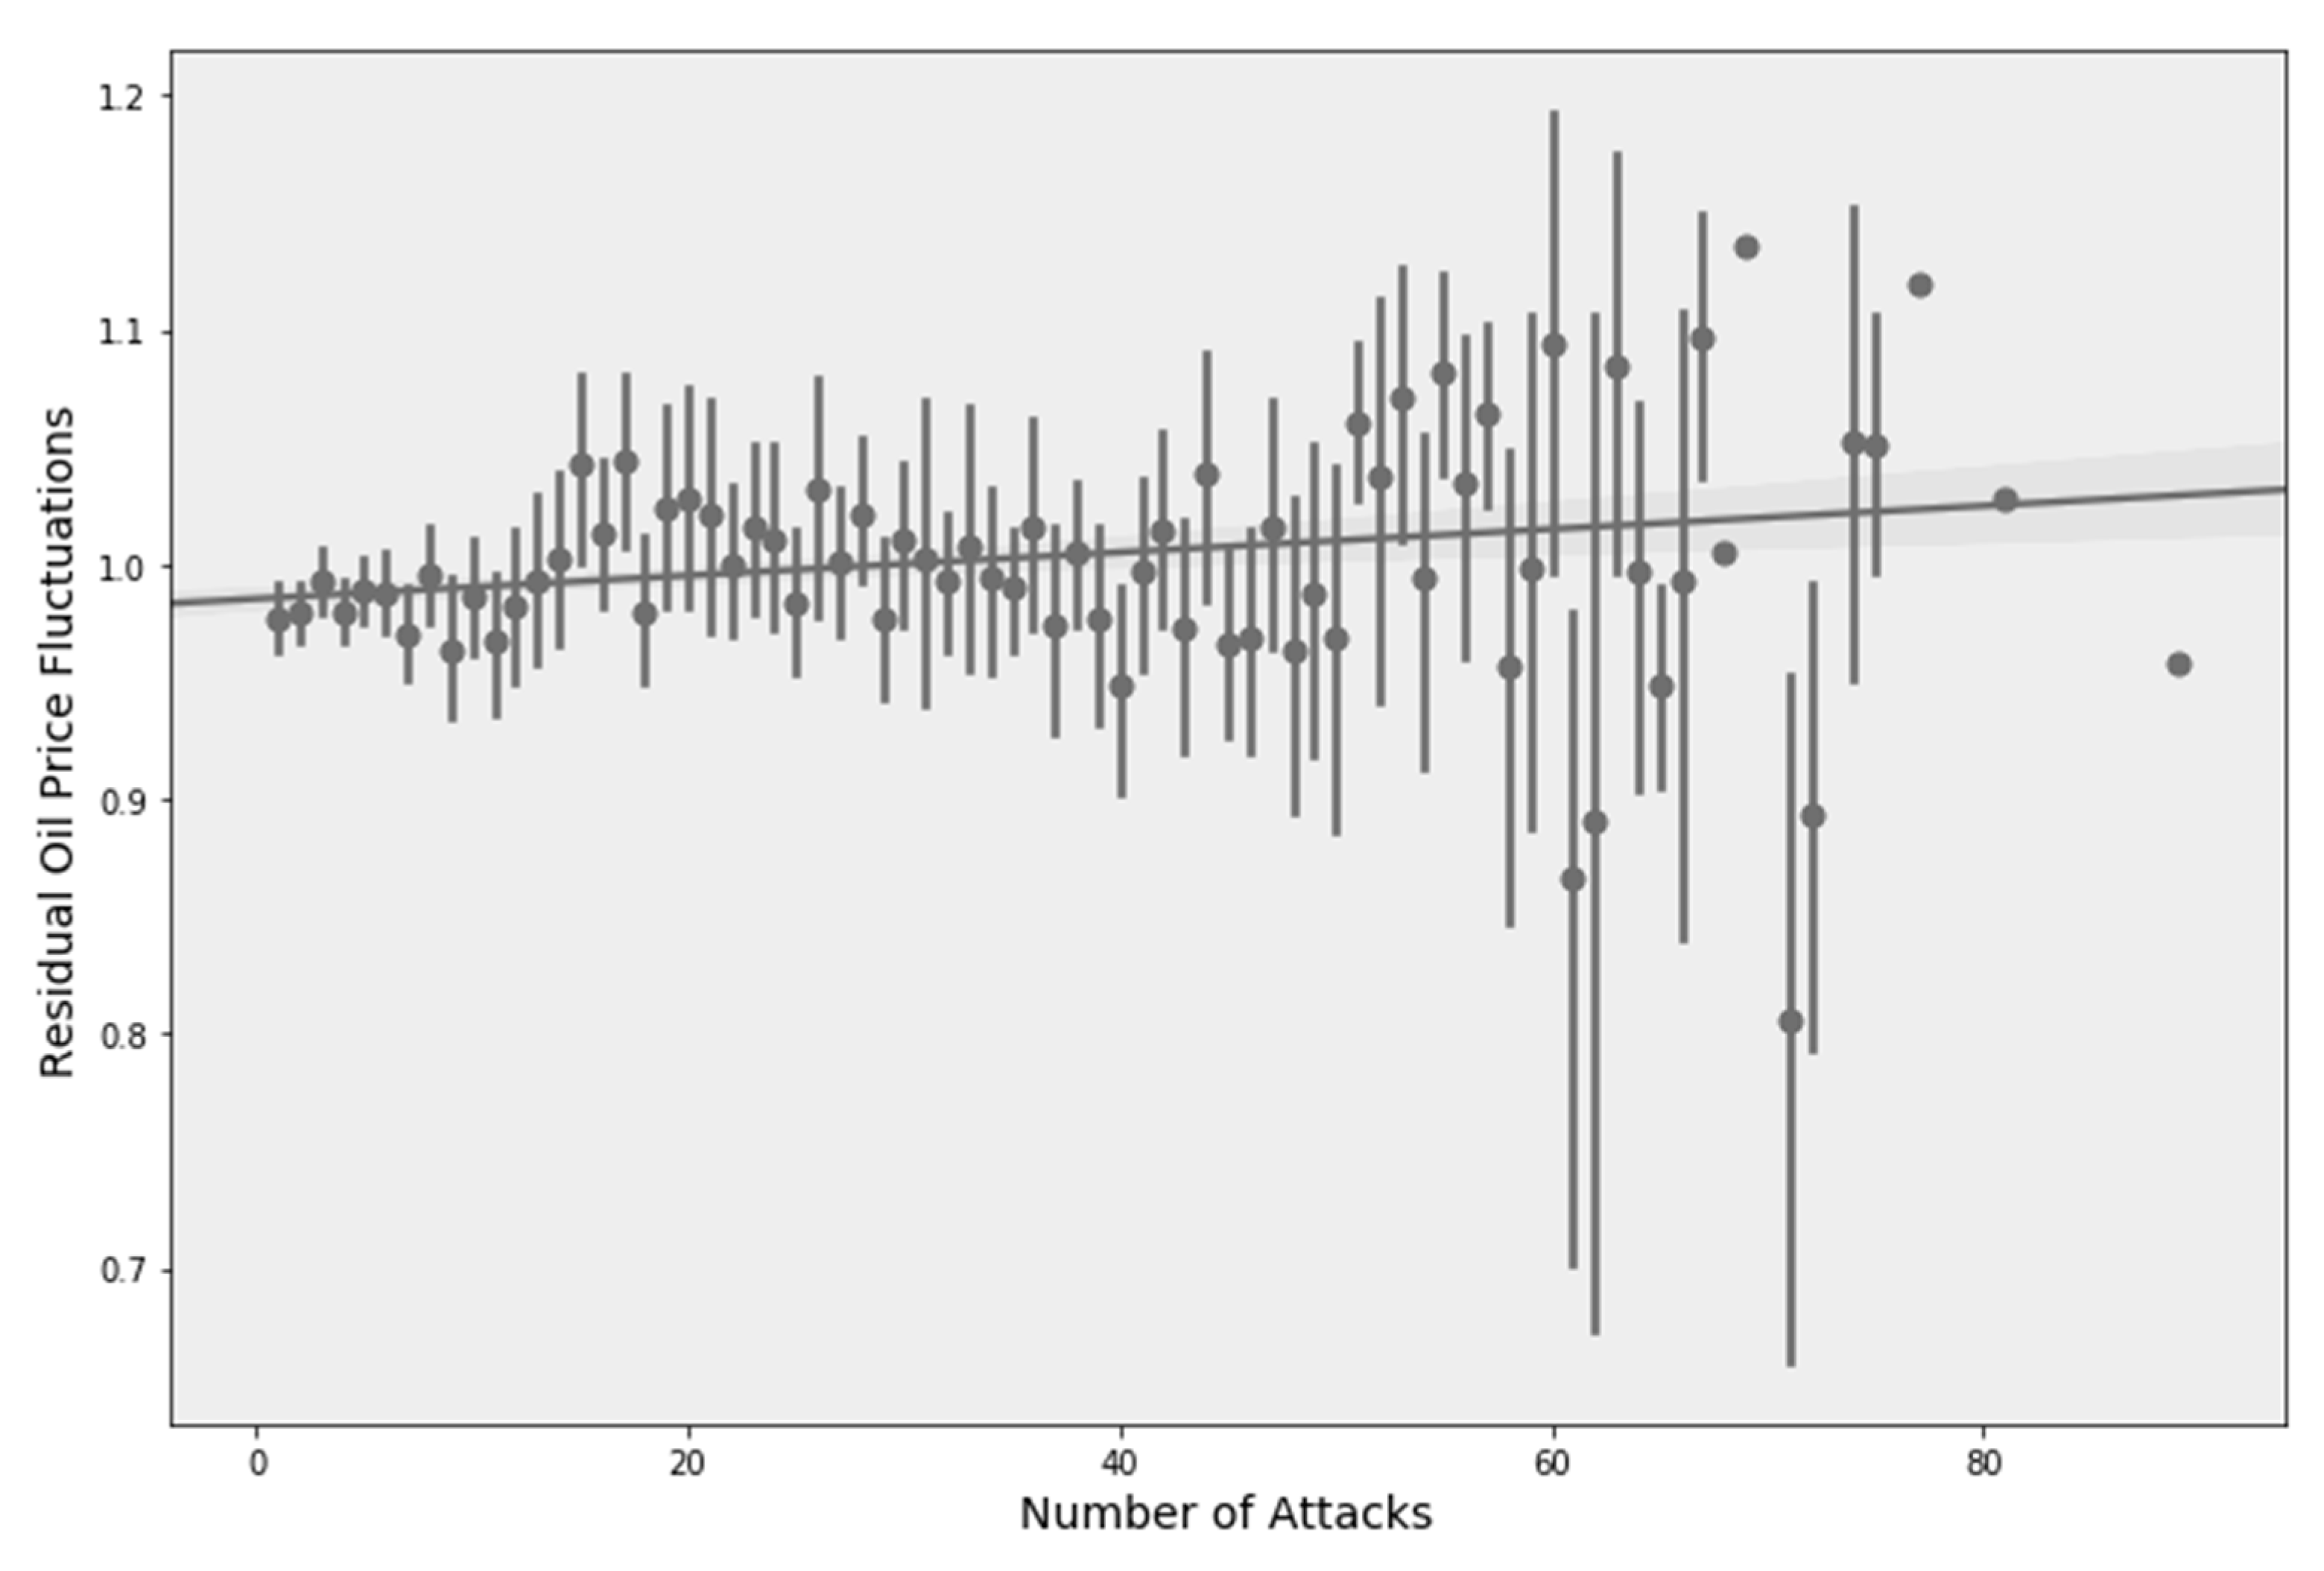
| N.ATTACK | Number of terrorist attacks which took place during a given day |
| DIST.10 | Number of terrorist attacks which took place during a given day within a radius of 10 km from a major exploited oil/natural gas extraction site |
| DIST.50 | Number of terrorist attacks which took place during a given day within a radius of 50 km from a major exploited oil/natural gas extraction site |
| DIST.150 | Number of terrorist attacks which took place during a given day within a radius of 150 km from a major exploited oil/natural gas extraction site |
| DIST.200 | Number of terrorist attacks which took place during a given day within a radius of 200 km from a major exploited oil/natural gas extraction site |
| DIST.300 | Number of terrorist attacks which took place during a given day within a radius of 300 km from a major exploited oil/natural gas extraction site |
| INFR | Number of attacks on oil/natural gas infrastructure during a given day (infrastructure includes storage facilities, pipelines, refineries, wells, rigs) |
| OIL.GAS | Number of attacks on oil/natural gas extraction facilities |
| CASUALT | Number of terrorist attacks which resulted in casualties (regardless of the number thereof) |
| PROP.DAM | Number of terrorist attacks which resulted in infrastructure damage (explosions, arsons etc.) |
| MAJ.DAM | Number of terrorist attacks during a given date which resulted in major material losses (>1 million USD) |
| OPEC | Number of terrorist attacks which happened during a given day on the territory of OPEC countries |
| OPEC.INFR | Number of terrorist attacks on oil/gas infrastructure which happened during a given day on the territory of OPEC countries |
| OPEC.OIL.GAS | Number of terrorist attacks on oil/gas extraction sites which happened during a given day on the territory of OPEC countries |
| OPEC.MAJ.DAM | Number of terrorist attacks resulting in infrastructural damage of >1 million USD which happened during a given day on the territory of OPEC countries |
| OPEC.PROP.DAM | Number of terrorist attacks resulting in infrastructural damage which happened during a given day on the territory of OPEC countries |
| OPEC.CASUALT | Number of terrorist attacks resulting in casualties which happened during a given day on the territory of OPEC countries |
| OPEC.DIST.10 | Number of terrorist attacks which occurred during a given date within a radius of 10 m from an exploited oil/natural gas deposit in OPEC countries |
| OPE.CDIS.50 | Number of terrorist attacks which occurred during a given date within a radius of 50 m from an exploited oil/natural gas deposit in OPEC countries |
| OPEC.DIST..150 | Number of terrorist attacks which occurred during a given date within a radius of 150 m from an exploited oil/natural gas deposit in OPEC countries |
| OPEC.DIST.200 | Number of terrorist attacks which occurred during a given date within a radius of 200 m from an exploited oil/natural gas deposit in OPEC countries |
| OPEC.DIST.300 | Number of terrorist attacks which occurred during a given date within a radius of 300 m from an exploited oil/natural gas deposit in OPEC countries |
| REBEL | Number of attacks during a given date, which happened due to actions of organized rebellious factions |
| STATE | Number of attacks during a given date, which happened due to actions of state controlled armed factions |
| FACTIONS | Number of attacks during a given date, which happened due to conflicts between factions/religious groups/militias |
| POL.UNR | Number of attacks during a given date, which were engendered by political/social unrest |
| POL.UNR.OIL.GAS | Number of attacks on oil/gas facilities during a given date, which were engendered by political/social unrest |
| POL.UNR.INFR | Number of attacks on infrastructure objects (pipelines, storage, refining) during a given date, which were engendered by political/social unrest |
| POL.UNR.OPEC | Number of attacks in OPEC countries during a given date, which were engendered by political/social unrest |
| Variable Name | Mean | Sd | Min | Max |
|---|---|---|---|---|
| OILPRICECH | 0.0004 | 0.0221 | −0.1804 | 0.1988 |
| RESID.PRICE.VOL | 0.9932 | 0.1319 | 0.4802 | 1.5768 |
| LOG.RET | 0.0001 | 0.0221 | −0.1989 | 0.1813 |
| 3d.ST.DEV | 0.8934 | 0.7161 | 0.0000 | 6.5512 |
| 30d.ST.DEV | 2.8493 | 1.7727 | 0.4189 | 15.1966 |
| 180d.ST.DEV | 7.2640 | 6.1562 | 1.4857 | 37.1002 |
| 365d.ST.DEV | 10.3393 | 7.9298 | 2.4774 | 32.8651 |
| 3d.RES.PR.VOL | 0.0137 | 0.0098 | 0.0002 | 0.1210 |
| 30d.RES.PR.VOL | 0.0432 | 0.0219 | 0.0108 | 0.1584 |
| 180d.RES.PR.VOL | 0.0987 | 0.0559 | 0.0308 | 0.3599 |
| 365d.RES.PR.VOL | 0.1151 | 0.0551 | 0.0358 | 0.2921 |
| DIST.DEP | 3981.0911 | 4136.0743 | 0.0000 | 27,972.8904 |
| N.ATTACK | 15.9784 | 15.0213 | 1.0000 | 89.0000 |
| DIST.10 | 0.0728 | 0.3057 | 0.0000 | 4.0000 |
| DIST.50 | 2.1163 | 2.9706 | 0.0000 | 29.0000 |
| DIST.150 | 7.3453 | 7.7747 | 0.0000 | 53.0000 |
| DIST.200 | 9.1378 | 9.2916 | 0.0000 | 57.0000 |
| DIST.300 | 11.6167 | 11.2939 | 0.0000 | 63.0000 |
| INFR | 0.7494 | 1.4495 | 0.0000 | 19.0000 |
| OIL.GAS | 0.2784 | 0.6113 | 0.0000 | 7.0000 |
| CASUALT | 8.1149 | 7.7973 | 0.0000 | 48.0000 |
| PROP.DAM | 6.3523 | 6.4128 | 0.0000 | 76.0000 |
| MAJ.DAM | 0.0963 | 0.5450 | 0.0000 | 23.0000 |
| OPEC | 4.5886 | 5.6282 | 0.0000 | 45.0000 |
| OPEC.INFR | 0.0680 | 0.5902 | 0.0000 | 24.0000 |
| OPEC.OIL.GAS | 0.0817 | 0.3135 | 0.0000 | 3.0000 |
| OPEC.MAJ.DAM | 0.0259 | 0.2499 | 0.0000 | 11.0000 |
| OPEC.PROP.DAM | 1.7899 | 2.7198 | 0.0000 | 36.0000 |
| OPEC.CASUALT | 15.8843 | 41.0115 | 0.0000 | 1511.0000 |
| OPEC.DIST.10 | 0.0521 | 0.2684 | 0.0000 | 4.0000 |
| OPEC.DIST.50 | 1.4036 | 2.2638 | 0.0000 | 26.0000 |
| OPEC.DIST.150 | 3.9158 | 4.9411 | 0.0000 | 43.0000 |
| OPEC.DIST.200 | 4.0513 | 5.1036 | 0.0000 | 43.0000 |
| OPEC.DIST.300 | 4.1718 | 5.2304 | 0.0000 | 43.0000 |
| REBEL | 1.8608 | 3.0865 | 0.0000 | 25.0000 |
| STATE | 0.0386 | 0.2775 | 0.0000 | 5.0000 |
| FACTIONS | 0.0933 | 0.3657 | 0.0000 | 7.0000 |
| POL.UNR | 1.9927 | 3.2233 | 0.0000 | 26.0000 |
| POL.UNR.OIL.GAS | 0.0008 | 0.0284 | 0.0000 | 1.0000 |
| POL.UNR.INFR | 0.0051 | 0.0714 | 0.0000 | 1.0000 |
| POL.UNR.OPEC | 0.4683 | 0.9939 | 0.0000 | 8.0000 |
| N | 3707 |
| Period of Observation | 2001–2015 | 2001–2005 | 2004–2008 | 2007–2011 | 2010–2014 | 2013–2015 |
|---|---|---|---|---|---|---|
| Explained Variable | RESID.PRICE.VOL | RESID.PRICE.VOL | RESID.PRICE.VOL | RESID.PRICE.VOL | RESID.PRICE.VOL | RESID.PRICE.VOL |
| Number of terror attacks within the vicinity of major oil deposits | ||||||
| N.ATTACK | 0.0005 *** | 0.0041 *** | 0.0054 *** | 0.0034 *** | 0.0010 *** | 0.0002 |
| (3.43) | (4.76) | (8.11) | (4.63) | (6.44) | (0.53) | |
| DIST.10 | 0.0099 | −0.0037 | 0.0380 | 0.0112 | 0.0076 | 0.0063 |
| (1.39) | (−0.13) | (1.69) | (0.54) | (1.37) | (0.77) | |
| DIST.50 | 0.0027 *** | 0.0085* | 0.0101 *** | 0.0083 ** | 0.0028 *** | 0.0021 |
| (3.66) | (2.43) | (4.04) | (3.28) | (4.47) | (1.87) | |
| DIST.150 | 0.0008 ** | 0.0057 *** | 0.0064 *** | 0.0041 *** | 0.0014 *** | −0.0001 |
| (2.79) | (3.66) | (5.57) | (3.44) | (5.40) | (−0.24) | |
| DIST.200 | 0.0007 ** | 0.0049 *** | 0.0066 *** | 0.0038 *** | 0.0014 *** | 0.0000 |
| (3.01) | (4.01) | (6.55) | (3.64) | (6.06) | (0.06) | |
| DIST.300 | 0.0005 ** | 0.0042 *** | 0.0063 *** | 0.0033 *** | 0.0011 *** | −0.0003 |
| (2.73) | (4.26) | (7.36) | (3.63) | (5.62) | (−0.62) | |
| Attacks on oil extraction/transportation/storage infrastructure | ||||||
| INFR | 0.0029 | 0.0119 ** | 0.0272 *** | 0.0069 * | 0.0041 ** | −0.0038 |
| (1.95) | (2.75) | (6.06) | (1.98) | (3.06) | (−1.76) | |
| OIL.GAS | 0.0098 ** | 0.0191 * | 0.0300 ** | 0.0101 | 0.0075 * | 0.0069 |
| (2.78) | (2.14) | (3.00) | (1.11) | (2.49) | (1.44) | |
| Casualties/infrastructural damage as a result of attacks | ||||||
| CASUALT | 0.0010 *** | 0.0047 ** | 0.0059 *** | 0.0041 ** | 0.0015 *** | 0.0013 * |
| (3.45) | (3.22) | (4.69) | (3.05) | (5.44) | (2.18) | |
| PROP.DAM | 0.0017 *** | 0.0053 *** | 0.0114 *** | 0.0050 *** | 0.0023 *** | 0.0019 ** |
| (5.01) | (3.76) | (7.40) | (3.84) | (7.08) | (3.23) | |
| MAJ.DAM | 0.0114 ** | 0.0076 | 0.0095 | 0.0113 | 0.0006 | 0.0345 |
| (2.86) | (1.04) | (1.80) | (1.89) | (0.03) | (0.90) | |
| Attacks on infrastructure in OPEC countries | ||||||
| OPEC | 0.0013 *** | 0.0039 | 0.0070 *** | 0.0043 ** | 0.0015 *** | 0.0008 |
| (3.47) | (1.77) | (4.60) | (2.89) | (4.37) | (1.22) | |
| OPEC.INFR | −0.0064 | −0.0092 | −0.0068 | −0.0533 | 0.0262 *** | −0.0064 |
| (−1.75) | (−0.30) | (−0.17) | (−1.79) | (5.04) | (−1.95) | |
| OPEC.OIL.GAS | 0.0134 | 0.0259 | 0.0237 | 0.0110 | 0.0102 | 0.0119 |
| (1.94) | (1.64) | (1.72) | (0.76) | (1.45) | (1.11) | |
| OPEC.MAJ.DAM | 0.0037 | −0.0015 | 0.0010 | 0.0023 | 0.0188 | 0.1801 |
| (0.43) | (−0.08) | (0.09) | (0.18) | (0.45) | (1.58) | |
| OPEC.PROP.DAM | 0.0040 *** | 0.0011 | 0.0126 *** | 0.0064 * | 0.0035 *** | 0.0041 *** |
| (5.03) | (0.27) | (3.60) | (2.51) | (5.35) | (4.01) | |
| OPEC.CASUALT | 0.0001 | −0.0001 | −0.0002 | −0.0000 | 0.0002 *** | 0.0001 * |
| (1.81) | (−0.41) | (−1.18) | (−0.22) | (4.55) | (2.05) | |
| Attacks within the vicinity of major oil/gas deposits in OPEC countries | ||||||
| OPEC.DIST.10 | 0.0087 | −0.0185 | 0.0435 | 0.0266 | 0.0059 | −0.0010 |
| (1.08) | (−0.26) | (1.62) | (1.04) | (0.97) | (−0.11) | |
| OPEC.DIST.50 | 0.0027 ** | 0.0070 | 0.0134 *** | 0.0097 ** | 0.0017 * | 0.0008 |
| (2.84) | (1.25) | (3.84) | (2.92) | (2.10) | (0.59) | |
| OPEC.DIST.150 | 0.0015 *** | 0.0037 | 0.0067 *** | 0.0040 * | 0.0011** | 0.0009 |
| (3.33) | (1.58) | (4.32) | (2.58) | (2.97) | (1.29) | |
| OPEC.DIST.200 | 0.0014 ** | 0.0041 | 0.0067 *** | 0.0040 ** | 0.0013 *** | 0.0007 |
| (3.22) | (1.76) | (4.36) | (2.61) | (3.48) | (1.07) | |
| OPEC.DIST.300 | 0.0013 ** | 0.0037 | 0.0068 *** | 0.0040 ** | 0.0013 *** | 0.0005 |
| (3.10) | (1.62) | (4.46) | (2.65) | (3.66) | (0.83) | |
| Political instability/upheavals involving major political factions | ||||||
| REBEL | 0.0021 ** | −0.0019 | 0.0194 *** | 0.0261 *** | 0.0038 *** | 0.0034 ** |
| (2.98) | (−0.48) | (3.73) | (4.24) | (6.33) | (2.93) | |
| STATE | −0.0036 | 0.0000 | 0.3319 * | 0.0207 | 0.0198 ** | −0.0073 |
| (−0.46) | (.) | (2.08) | (0.29) | (2.66) | (−1.03) | |
| FACTIONS | 0.0059 | 0.0112 | 0.0468 ** | 0.0246 | 0.0186 ** | −0.0106 |
| (0.99) | (0.36) | (2.68) | (1.94) | (2.98) | (−1.50) | |
| POL.UNR | 0.0020 ** | −0.0017 | 0.0217 *** | 0.0262 *** | 0.0040 *** | 0.0027 * |
| (2.93) | (−0.43) | (4.39) | (4.72) | (6.74) | (2.41) | |
| POL.UNR.OIL.GAS | 0.1977 ** | 0.0000 | 0.3319 * | 0.2068 | 0.0977 | 0.1785 |
| (2.60) | (.) | (2.08) | (1.70) | (1.67) | (1.56) | |
| POL.UNR.INFR | 0.0435 | 0.0046 | 0.3842 *** | 0.1524 | −0.0296 | 0.0523 |
| (1.43) | (0.08) | (3.41) | (1.53) | (−0.94) | (1.20) | |
| POL.UNR.OPEC | 0.0045 * | −0.0011 | 0.0257 ** | 0.0397 *** | 0.0024 | 0.0009 |
| (2.07) | (−0.17) | (3.10) | (3.62) | (1.32) | (0.31) | |
| N | 3707 | 1200 | 1229 | 1247 | 1254 | 760 |
| Period of Observation | 2001–2015 | 2001–2005 | 2004–2008 | 2007–2011 | 2010–2014 | 2013–2015 |
|---|---|---|---|---|---|---|
| Explained Variable | 3d.ST.DEV | 3d.ST.DEV | 3d.ST.DEV | 3d.ST.DEV | 3d.ST.DEV | 3d.ST.DEV |
| Number of terror attacks within the vicinity of major oil deposits | ||||||
| N.ATTACK | 0.0034 *** | 0.0040 | 0.0306 *** | 0.0071 | −0.0095 *** | −0.0006 |
| (4.40) | (1.24) | (9.11) | (1.83) | (−7.58) | (−0.34) | |
| DIST.10 | 0.0222 | 0.0128 | 0.3497 ** | 0.0650 | −0.1426 ** | −0.0316 |
| (0.58) | (0.12) | (3.10) | (0.60) | (−3.09) | (−0.80) | |
| DIST.50 | 0.0117 ** | 0.0414 ** | 0.0639 *** | 0.0242 | −0.0254 *** | −0.0103 |
| (2.96) | (3.20) | (5.11) | (1.83) | (−4.87) | (−1.92) | |
| DIST.150 | 0.0058 *** | 0.0126 * | 0.0428 *** | 0.0096 | −0.0144 *** | −0.0019 |
| (3.86) | (2.18) | (7.41) | (1.53) | (−6.53) | (−0.75) | |
| DIST.200 | 0.0049 *** | 0.0020 | 0.0413 *** | 0.0098 | −0.0130 *** | −0.0018 |
| (3.91) | (0.45) | (8.21) | (1.79) | (−6.89) | (−0.81) | |
| DIST.300 | 0.0043 *** | 0.0009 | 0.0377 *** | 0.0103 * | −0.0114 *** | −0.0011 |
| (4.17) | (0.24) | (8.89) | (2.16) | (−7.07) | (−0.53) | |
| Attacks on oil extraction/transportation/storage infrastructure | ||||||
| INFR | 0.0370 *** | −0.0094 | 0.1065 *** | 0.0370* | −0.0204 | 0.0119 |
| (4.57) | (−0.59) | (4.68) | (2.04) | (−1.85) | (1.13) | |
| OIL.GAS | 0.0476 * | 0.0712 * | 0.1077 * | 0.0294 | −0.0968 *** | −0.0105 |
| (2.48) | (2.17) | (2.13) | (0.62) | (−3.86) | (−0.45) | |
| Casualties/infrastructural damage as a result of attacks | ||||||
| CASUALT | 0.0055 *** | 0.0115 * | 0.0367 *** | 0.0059 | −0.0154 *** | −0.0009 |
| (3.62) | (2.12) | (5.83) | (0.83) | (−6.61) | (−0.32) | |
| PROP.DAM | 0.0074 *** | −0.0004 | 0.0578 *** | 0.0042 | −0.0178 *** | −0.0030 |
| (4.05) | (−0.07) | (7.41) | (0.62) | (−6.59) | (−1.04) | |
| MAJ.DAM | 0.0102 | 0.0238 | 0.0182 | 0.0049 | −0.0790 | −0.1628 |
| (0.47) | (0.89) | (0.69) | (0.16) | (−0.53) | (−0.87) | |
| Attacks on infrastructure in OPEC countries | ||||||
| OPEC | 0.0084 *** | 0.0576 *** | 0.0356 *** | 0.0024 | −0.0134 *** | −0.0018 |
| (4.03) | (7.23) | (4.67) | (0.30) | (−4.78) | (−0.59) | |
| OPEC.INFR | −0.0174 | 0.0245 | −0.0481 | −0.0421 | −0.1187 ** | −0.0071 |
| (−0.87) | (0.22) | (−0.24) | (−0.27) | (−2.72) | (−0.44) | |
| OPEC.OIL.GAS | 0.0912 * | 0.1445 * | 0.0103 | 0.0416 | −0.0645 | 0.0289 |
| (2.43) | (2.49) | (0.15) | (0.55) | (−1.10) | (0.55) | |
| OPEC.MAJ.DAM | 0.0251 | 0.2644 *** | −0.0142 | −0.0465 | −0.3289 | −0.3246 |
| (0.53) | (3.89) | (−0.26) | (−0.71) | (−0.95) | (−0.58) | |
| OPEC.PROP.DAM | 0.0119 ** | 0.0661 *** | 0.0462 ** | −0.0135 | −0.0213 *** | −0.0091 |
| (2.75) | (4.37) | (2.60) | (−1.02) | (−3.90) | (−1.80) | |
| OPEC.CASUALT | 0.0001 | 0.0015 | −0.0006 | −0.0012 | −0.0007 * | 0.0002 |
| (0.33) | (1.88) | (−0.73) | (−1.33) | (−2.20) | (0.83) | |
| Attacks within the vicinity of major oil/gas deposits in OPEC countries | ||||||
| OPEC.DIST.10 | 0.0013 | 0.3800 | 0.2914 * | −0.0276 | −0.1481 ** | −0.0393 |
| (0.03) | (1.43) | (2.15) | (−0.21) | (−2.94) | (−0.91) | |
| OPEC.DIST.50 | 0.0198 *** | 0.1382 *** | 0.0762 *** | 0.0145 | −0.0216 ** | −0.0075 |
| (3.82) | (6.80) | (4.35) | (0.84) | (−3.29) | (−1.13) | |
| OPEC.DIST.150 | 0.0116 *** | 0.0660 *** | 0.0363 *** | 0.0039 | −0.0124 *** | −0.0017 |
| (4.88) | (7.77) | (4.68) | (0.49) | (−3.98) | (−0.52) | |
| OPEC.DIST.200 | 0.0105 *** | 0.0631 *** | 0.0367 *** | 0.0040 | −0.0129 *** | −0.0018 |
| (4.58) | (7.52) | (4.75) | (0.51) | (−4.29) | (−0.56) | |
| OPEC.DIST.300 | 0.0096 *** | 0.0608 *** | 0.0361 *** | 0.0038 | −0.0132 *** | −0.0024 |
| (4.29) | (7.41) | (4.70) | (0.48) | (−4.47) | (−0.76) | |
| Political instability/upheavals involving major political factions | ||||||
| REBEL | −0.0049 | 0.0461 ** | 0.0428 | 0.0336 | −0.0333 *** | −0.0112 * |
| (−1.29) | (3.14) | (1.63) | (1.04) | (−6.70) | (−2.00) | |
| STATE | −0.0483 | 0.0000 | 2.9358 *** | 0.3124 | −0.1263 * | −0.0226 |
| (−1.14) | (.) | (3.66) | (0.85) | (−2.04) | (−0.65) | |
| FACTIONS | 0.1481 *** | 0.3332 ** | 0.5187 *** | 0.1043 | −0.0453 | 0.0391 |
| (4.62) | (2.93) | (5.97) | (1.58) | (−0.87) | (1.14) | |
| POL.UNR | −0.0030 | 0.0507 *** | 0.0836 *** | 0.0497 | −0.0335 *** | −0.0100 |
| (−0.82) | (3.49) | (3.35) | (1.71) | (−6.85) | (−1.84) | |
| POL.UNR.OIL.GAS | 0.8923 * | 0.0000 | 2.9358 *** | 1.3050 * | −0.2774 | −0.5582 |
| (2.16) | (.) | (3.66) | (2.06) | (−0.57) | (−1.00) | |
| POL.UNR.INFR | 0.2209 | −0.2565 | 2.6959 *** | 1.6533 ** | 0.1749 | −0.2982 |
| (1.34) | (−1.18) | (4.77) | (3.21) | (0.67) | (−1.41) | |
| POL.UNR.OPEC | −0.0082 | 0.1084 *** | 0.0396 | 0.0595 | −0.0744 *** | −0.0197 |
| (−0.69) | (4.74) | (0.95) | (1.04) | (−5.03) | (−1.46) | |
| N | 3707 | 1200 | 1229 | 1247 | 1254 | 760 |
| Period of Observation | 2001–2015 | 2001–2005 | 2004–2008 | 2007–2011 | 2010–2014 | 2013–2015 |
|---|---|---|---|---|---|---|
| Explained Variable | 3d.RES.PR.VOL | 3d.RES.PR.VOL | 3d.RES.PR.VOL | 3d.RES.PR.VOL | 3d.RES.PR.VOL | 3d.RES.PR.VOL |
| Number of terror attacks within the vicinity of major oil deposits | ||||||
| N.ATTACK | −0.0001 *** | 0.0000 | 0.0002 *** | 0.0001 | −0.0001 *** | 0.0000 |
| (−9.59) | (0.15) | (3.60) | (1.59) | (−7.55) | (0.44) | |
| DIST.10 | −0.0018 *** | 0.0001 | 0.0026 | 0.0007 | −0.0014 ** | −0.0009 |
| (−3.42) | (0.04) | (1.92) | (0.53) | (−3.08) | (−1.61) | |
| DIST.50 | −0.0004 *** | 0.0004 | 0.0004 ** | 0.0002 | −0.0003 *** | −0.0001 |
| (−7.12) | (1.02) | (2.60) | (1.60) | (−4.96) | (−1.69) | |
| DIST.150 | −0.0002 *** | 0.0000 | 0.0002 ** | 0.0001 | −0.0001 *** | −0.0000 |
| (−8.83) | (0.27) | (3.19) | (1.03) | (−6.41) | (−0.62) | |
| DIST.200 | −0.0002 *** | 0.0000 | 0.0002 *** | 0.0001 | −0.0001 *** | −0.0000 |
| (−9.17) | (0.15) | (3.51) | (1.29) | (−6.65) | (−0.90) | |
| DIST.300 | −0.0001 *** | 0.0000 | 0.0002 *** | 0.0001 | −0.0001 *** | −0.0000 |
| (−9.18) | (0.07) | (3.79) | (1.84) | (−6.98) | (−0.31) | |
| Attacks on oil extraction/transportation/storage infrastructure | ||||||
| INFR | −0.0002 * | 0.0002 | 0.0006 * | 0.0006 ** | −0.0002 * | 0.0001 |
| (−1.97) | (0.41) | (2.12) | (3.06) | (−2.08) | (0.57) | |
| OIL.GAS | −0.0010 *** | 0.0004 | 0.0010 | 0.0004 | −0.0009 *** | −0.0002 |
| (−3.94) | (0.41) | (1.59) | (0.66) | (−3.46) | (−0.61) | |
| Casualties/infrastructural damage as a result of attacks | ||||||
| CASUALT | −0.0002 *** | −0.0002 | 0.0001 | 0.0000 | −0.0002 *** | 0.0000 |
| (−9.56) | (−1.34) | (1.58) | (0.44) | (−6.89) | (1.06) | |
| PROP.DAM | −0.0002 *** | 0.0001 | 0.0003 ** | 0.0000 | −0.0002 *** | −0.0001 ** |
| (−9.75) | (0.55) | (3.28) | (0.16) | (−6.23) | (−2.66) | |
| MAJ.DAM | 0.0008 * | 0.0013 | 0.0002 | 0.0002 | 0.0001 | −0.0030 |
| (2.57) | (1.73) | (0.50) | (0.65) | (0.05) | (−1.09) | |
| Attacks on infrastructure in OPEC countries | ||||||
| OPEC | −0.0002 *** | −0.0001 | 0.0002 | −0.0000 | −0.0001 *** | −0.0000 |
| (−8.19) | (−0.63) | (1.88) | (−0.16) | (−4.29) | (−0.53) | |
| OPEC.INFR | −0.0004 | 0.0009 | −0.0017 | 0.0004 | −0.0010 * | 0.0001 |
| (−1.43) | (0.29) | (−0.72) | (0.22) | (−2.23) | (0.47) | |
| OPEC.OIL.GAS | −0.0001 | 0.0001 | −0.0003 | 0.0006 | −0.0007 | 0.0007 |
| (−0.28) | (0.05) | (−0.35) | (0.73) | (−1.16) | (0.89) | |
| OPEC.MAJ.DAM | 0.0007 | 0.0042 * | −0.0000 | −0.0003 | −0.0015 | −0.0081 |
| (1.11) | (2.21) | (−0.04) | (−0.36) | (−0.45) | (−0.97) | |
| OPEC.PROP.DAM | −0.0005 *** | −0.0001 | 0.0001 | −0.0003 * | −0.0002 ** | −0.0002 ** |
| (−8.59) | (−0.20) | (0.66) | (−2.15) | (−3.25) | (−2.94) | |
| OPEC.CASUALT | −0.0000 *** | −0.0000 | −0.0000 | −0.0000 | −0.0000 | 0.0000 |
| (−3.64) | (−1.75) | (−1.11) | (−0.22) | (−1.75) | (0.60) | |
| Attacks within the vicinity of major oil/gas deposits in OPEC countries | ||||||
| OPEC.DIST.10 | −0.0022 *** | 0.0056 | 0.0020 | −0.0003 | −0.0014 ** | −0.0012 |
| (−3.73) | (0.75) | (1.19) | (−0.21) | (−2.82) | (−1.93) | |
| OPEC.DIST.50 | −0.0005 *** | 0.0003 | 0.0005 * | 0.0001 | −0.0002 ** | −0.0002 |
| (−6.93) | (0.48) | (2.15) | (0.49) | (−3.19) | (−1.72) | |
| OPEC.DIST.150 | −0.0002 *** | −0.0002 | 0.0002 | 0.0000 | −0.0001 *** | −0.0001 |
| (−7.30) | (−0.68) | (1.90) | (0.24) | (−3.51) | (−1.11) | |
| OPEC.DIST.200 | −0.0002 *** | −0.0002 | 0.0002 | 0.0000 | −0.0001 *** | −0.0000 |
| (−7.38) | (−0.70) | (1.91) | (0.25) | (−3.71) | (−0.90) | |
| OPEC.DIST.300 | −0.0002 *** | −0.0002 | 0.0002 | 0.0000 | −0.0001 *** | −0.0000 |
| (−7.53) | (−0.72) | (1.90) | (0.23) | (−3.88) | (−0.94) | |
| Political instability/upheavals involving major political factions | ||||||
| REBEL | −0.0005 *** | 0.0002 | 0.0001 | −0.0003 | −0.0003 *** | −0.0001 |
| (−10.23) | (0.42) | (0.17) | (−0.77) | (−7.04) | (−1.38) | |
| STATE | −0.0013 * | 0.0000 | 0.0255 ** | 0.0017 | −0.0008 | 0.0002 |
| (−2.23) | (.) | (2.62) | (0.40) | (−1.30) | (0.39) | |
| FACTIONS | 0.0004 | 0.0066 * | 0.0042 *** | 0.0006 | −0.0005 | 0.0014 ** |
| (0.95) | (2.07) | (3.96) | (0.82) | (−1.00) | (2.77) | |
| POL.UNR | −0.0005 *** | 0.0003 | 0.0004 | −0.0001 | −0.0003 *** | −0.0001 |
| (−9.87) | (0.68) | (1.36) | (−0.31) | (−7.14) | (−0.83) | |
| POL.UNR.OIL.GAS | 0.0044 | 0.0000 | 0.0255 ** | 0.0094 | −0.0033 | −0.0045 |
| (0.77) | (.) | (2.62) | (1.30) | (−0.67) | (−0.54) | |
| POL.UNR.INFR | 0.0006 | −0.0033 | 0.0189 ** | 0.0139 * | 0.0021 | −0.0005 |
| (0.27) | (−0.54) | (2.75) | (2.35) | (0.79) | (−0.15) | |
| POL.UNR.OPEC | −0.0011 *** | −0.0002 | 0.0008 | 0.0005 | −0.0008 *** | −0.0003 |
| (−6.70) | (−0.27) | (1.59) | (0.70) | (−5.15) | (−1.40) | |
| N | 3707 | 1200 | 1229 | 1247 | 1254 | 760 |
Publisher’s Note: MDPI stays neutral with regard to jurisdictional claims in published maps and institutional affiliations. |
© 2020 by the authors. Licensee MDPI, Basel, Switzerland. This article is an open access article distributed under the terms and conditions of the Creative Commons Attribution (CC BY) license (http://creativecommons.org/licenses/by/4.0/).
Share and Cite
Mielcarz, P.; Osiichuk, D.; Cymerski, J. Algorithmic Sangfroid? The Decline of Sensitivity of Crude Oil Prices to News on Potentially Disruptive Terror Attacks and Political Unrest. Sustainability 2021, 13, 52. https://doi.org/10.3390/su13010052
Mielcarz P, Osiichuk D, Cymerski J. Algorithmic Sangfroid? The Decline of Sensitivity of Crude Oil Prices to News on Potentially Disruptive Terror Attacks and Political Unrest. Sustainability. 2021; 13(1):52. https://doi.org/10.3390/su13010052
Chicago/Turabian StyleMielcarz, Paweł, Dmytro Osiichuk, and Jarosław Cymerski. 2021. "Algorithmic Sangfroid? The Decline of Sensitivity of Crude Oil Prices to News on Potentially Disruptive Terror Attacks and Political Unrest" Sustainability 13, no. 1: 52. https://doi.org/10.3390/su13010052
APA StyleMielcarz, P., Osiichuk, D., & Cymerski, J. (2021). Algorithmic Sangfroid? The Decline of Sensitivity of Crude Oil Prices to News on Potentially Disruptive Terror Attacks and Political Unrest. Sustainability, 13(1), 52. https://doi.org/10.3390/su13010052