1. Introduction
Myelin, which is present in the central nervous system, comprises an insulating sheath around the axons and promotes the efficient transmission of nerve impulses along the axon [
1]. Demyelination is a condition in which myelin is lost along with the relative preservation of axons. It is caused by diseases that induce the death of oligodendrocytes, the cells that make and maintain the myelin sheath [
2]. Multiple sclerosis (MS), a representative inflammatory demyelinating disease of the central nervous system, interferes with saltatory nerve conduction, leading to axonal degeneration and neurological dysfunction [
3,
4]. Remyelination is the opposite concept describing the restoration of the myelin sheath of demyelinated axons, saltatory conduction, and functional deficits [
2]. As such, the evaluation and study of demyelination and remyelination may be a major factor in determining the outcome of myelin degeneration with substantial axonal and neuronal cell loss in diseases such as MS. It has become increasingly apparent in recent years that in vivo pathophysiological changes in glutamate occur during demyelination and remyelination in the brain’s white matter [
5,
6,
7]. Therefore, the observation and evaluation of changes in glutamate levels, a potential essential biomarker, are important for estimating brain metabolism during myelination.
Chemical exchange saturation transfer (CEST) magnetic resonance imaging (MRI) has been introduced as a new contrast enhancement technique that enables the indirect detection of molecules with exchangeable endogenous protons and exchange-related properties [
8]. In particular, among the endogenous agents, the phenomenon of solute-to-water proton exchange based on glutamate protons resonating at a well-known specific offset frequency from that of water has been widely applied in brain diseases, including tumors, ischemia, and psychiatric disorders [
9,
10,
11,
12,
13]. Glutamate-weighted CEST (GluCEST) is usually applied using a high-field strength MRI system (≥7 Tesla) due to the fast exchange rate of glutamate [
13,
14]. Moreover, since a high B
0 field increases the signal-to-noise ratio, which can be utilized for higher resolution, applying GluCEST imaging in clinical and pre-clinical systems above 7 T provides appropriate signal sensitivity.
This study investigated the in vivo changes in glutamate levels in the cerebral white matter using GluCEST imaging on a 7 T MRI system, on the premise that changes in glutamate may serve as a significant bio-imaging marker in the processes of demyelination and remyelination. Demyelination was modeled by applying a dietary cuprizone method (demyelination induced by the oral administration of the cuprizone copper chelator) to rats to induce demyelination in certain white matter tracts by toxins injurious to oligodendrocytes [
15]. Thus, the simple cuprizone administration approach generally leads to demyelination of the white matter without any other specific modeling methods. Remyelination occurred through the interruption of the supply of cuprizone to remove toxins from the diet and by the simultaneous provision of normal feed.
2. Results
Figure 1 shows the magnetization transfer ratio asymmetry (MTR
asym) spectra (a) and quantified GluCEST signals at 3.0 ppm (b) in each group. The MTR
asym spectra showed distinct differences between the CTRL and CPZ
DM groups, and after remyelination, no specific differences were observed between the CTRL and CPZ
RM groups. Overall, this indicated that the MTR
asym spectrum of the CPZ
DM group had a higher value than that of the CTRL and CPZ
RM groups as a function of frequency offset. Moreover, as the frequency offset increased (approximately ≥2.5 ppm), the MTR
asym spectra of all groups were negative, which was considered to be the effect of upfield nuclear Overhauser enhancement (NOE) (−2 to −5 ppm) [
16,
17]. The quantified GluCEST signals differed significantly between the CPZ
DM and CTRL groups (−7.25 ± 1.42% vs. −2.84 ± 1.30%), respectively (
p = 0.001) (
Figure 1b). However, after remyelination, the increased glutamate signals decreased in the CPZ
RM group (−6.52 ± 1.95%;
p = 0.007) to levels that were not significantly different from those in the CTRL group (
p = 0.734).
Figure 2 shows the mapping results of GluCEST signals in representative rats, with a focus on the CC region and overlaid on the unsaturated CEST image in each group. The GluCEST signals in the CC region changed hyperintensities as demyelination progressed, compared to the normal control. Moreover, the GluCEST image contrast decreased again in the CPZ
RM group compared to that in the CPZ
DM group, which did not differ significantly from that in the CTRL group, as shown in
Figure 1b.
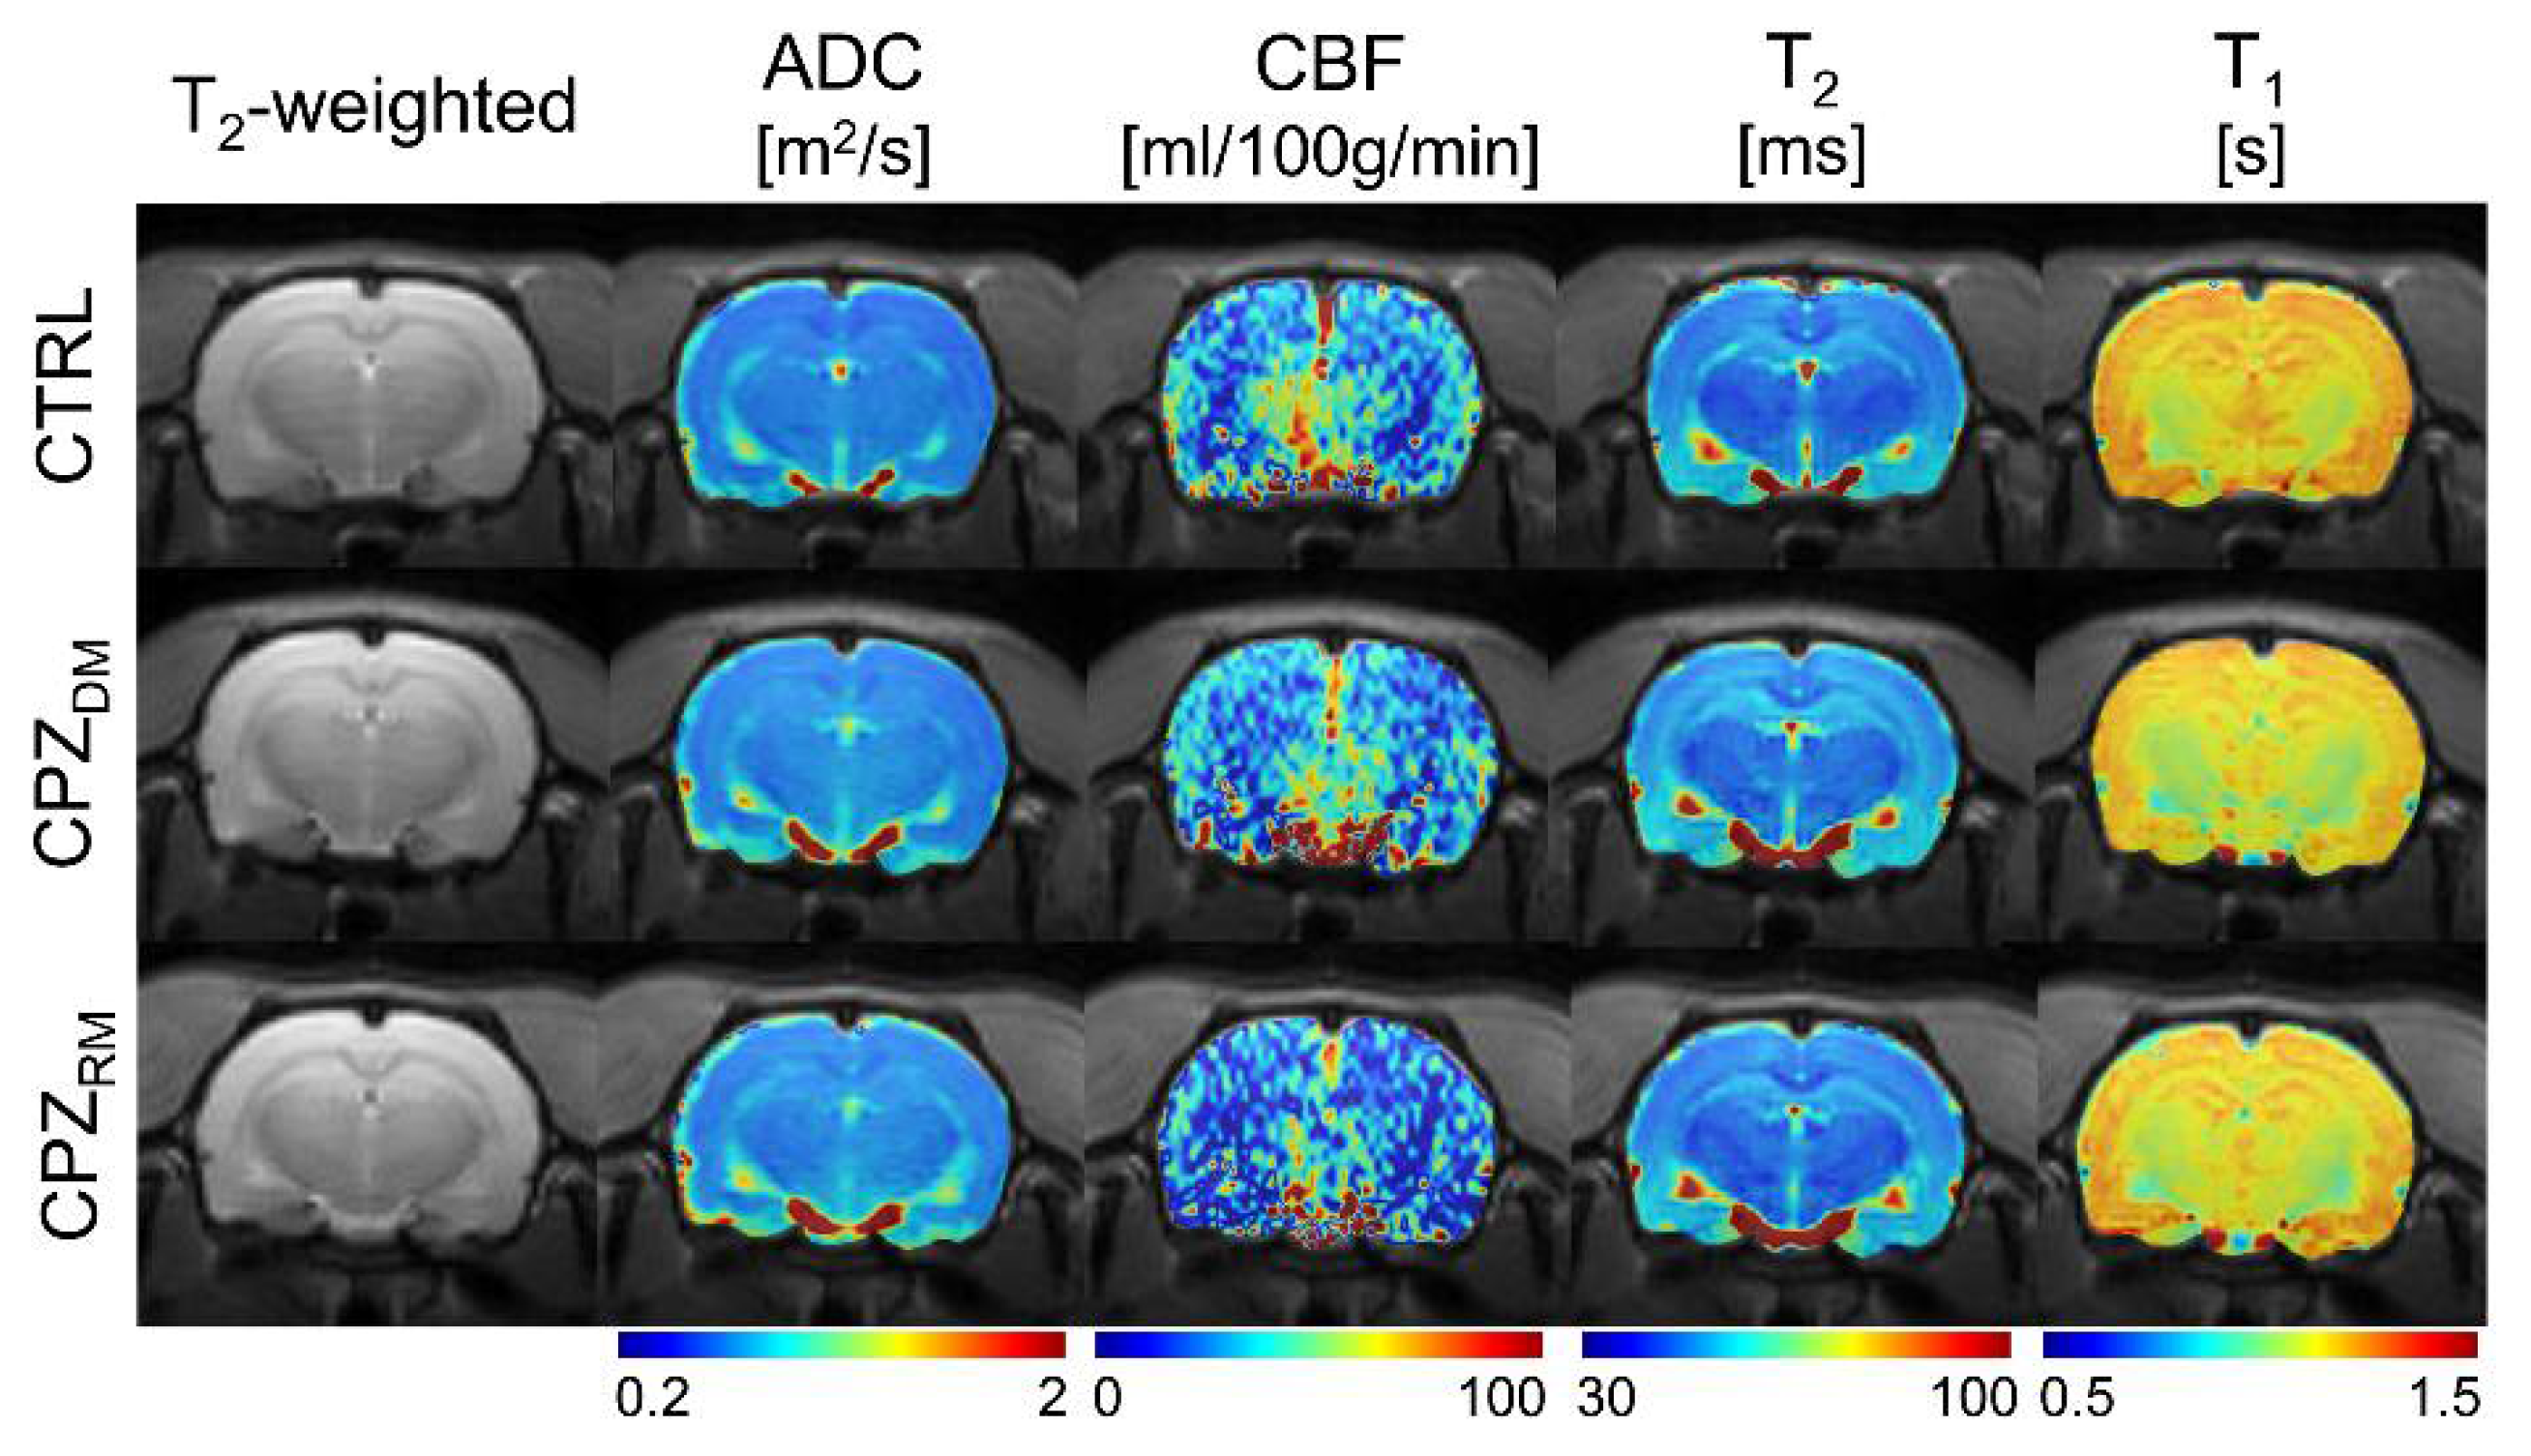
Figure 3 shows the reconstructed multi-parametric MR images of a representative rat in each group. The averaged multi-parametric values (ADC, CBF, T
2, and T
1) are shown in
Table 1. As seen in the T
2-weighted images, there were no specific signal differences in the CC area, suggesting a normal-appearing brain region even after demyelination. There were also no statistical differences among the groups (all
p ≥ 0.505 in ADC,
p ≥ 0.370 in CBF,
p ≥ 0.390 in T
2, and
p ≥ 0.241 in T
1).
Figure 4 shows the histological validation in the CTRL, CPZ
DM, and CPZ
RM groups. Representative Black-Gold II staining and TEM images show changes in the myelinated axons in the CC during the demyelination and remyelination phases. Seven weeks after cuprizone intoxication, the CC in the CPZ
DM group showed a markedly lower myelin density compared to those in the CTRL and CPZ
RM groups (
Figure 4b). In addition, the CPZ
DM group showed demyelinated axons that were surrounded by thinner myelin sheaths than in CTRL and CPZ
RM (
Figure 4c). After cuprizone withdrawal, we found that the substantially lower myelin content in the CPZ
DM group was reversed after 5 weeks of normal diet exposure. The CPZ
RM group showed axons wrapped with a new myelin sheath, resulting in similar axon and myelin morphologies compared to those in the CTRL group.
3. Discussion
In this study, we applied the GluCEST imaging technique, which provides high sensitivity to assess changes in glutamate levels in vivo, in a cuprizone-administered rat model to detect glutamate signal changes during demyelination and remyelination in the CC. Cuprizone may induce microscopic demyelination in normal-appearing brain tissue without the formation of macroscopic focal lesions, leading to stimulation of the ionotropic glutamate receptor, an excitatory toxic process in demyelination. Ultimately, this process may increase glutamate levels and lead to oligodendrocytic cell death [
18]. Our results clearly showed in vivo glutamate changes in the demyelinated and remyelinated lesions, demonstrating increased GluCEST contrast, calculated as ((|GluCEST
CTRL − GluCEST
DM|)/GluCEST
CTRL × 100) in the CPZ
DM group compared to those in the CTRL group (~60.8% increase). Notably, after the remyelination process, the GluCEST signal decreased again (~129.6% contrast decrease) to a level similar to that of the normal control (~10.1% difference in contrast between CTRL and CPZ
DM).
As previously reported, glutamate concentrations are often increased in the early stages of demyelination in the brain white matter regions [
6,
19]. We also observed this phenomenon and hypothesized that the increased levels of glutamate in vivo are linked to glutamate excitotoxicity induced by inflammation [
20]. Active inflammatory infiltrates were observed, in which a large amount of glutamate was produced and released by activated macrophages, microglial cells, and leukocytes [
21]. In addition, it is worth noting that the glutamate signal exhibited by GluCEST imaging analysis, although the CC was a demyelinated region by cuprizone administration, showed no significant signal changes in multiparametric MR images in the present study. However, pathological changes in myelin sheaths during demyelination and remyelination were evident in the results of electron microscopy and myelin staining in this study. This phenomenon, which demonstrates normal-appearing white matter despite cuprizone-induced demyelination, is explained by the difficulty in observing the apparent lesion because it has not developed to the point where inflammatory molecules and tissue edema exist in the early stages of demyelination. Moreover, this phenomenon is often observed in human patients with MS. The pathological process by which glutamate levels increase in normal-appearing white matter regions occurs through the loss of receptor expression by oligodendrocytes in the lesion vicinity, which reduces glutamate uptake by more than 75% and results in ineffective glutamate removal [
22]. Remyelination is also expressed as a result of an improvement in neuroaxonal integrity through the accumulation of oligodendrocyte progenitor cells (OPCs) in the CC and attenuates microglial activity and the beneficial role of reactive astrocytes [
2]. We observed no significant differences in glutamate levels between the CTRL and CPZ
RM groups, similar to the results of a previous study.
Regarding the GluCEST signals quantified in the present study, we attempted to minimize the factors that affect GluCEST signal formation. Since B
0 and B
1 field inhomogeneities may affect signal drift by overall z-spectrum shift and inaccurate signal quantification, we applied WASSR and relative B
1 map calculation to correct for field inhomogeneity in the GluCEST data, respectively. We also found no significant effect on the GluCEST signal through our evaluation of factors that can affect CEST signal formation, especially T
1 and T
2 values, while observing signal changes between the three groups (CTRL, CPZ
DM, and CPZ
RM) by multi-parametric MRI. In addition, we used a relatively high B
1 saturation power and a short saturation time to observe glutamate-containing amine protons with medium/fast exchange rates in the 7 T system. Nevertheless, the negative GluCEST signal obtained from our results was likely due to the semi-solid MT effect, NOE, and immobile lipid signals combined in the MTR
asym spectrum [
16,
17]. This phenomenon was also revealed in the results of GluCEST imaging in human patients with MS at 7 T [
14]. To obtain glutamate signals with less contamination by other effects, a further GluCEST signal quantification approach based on the signal fitting method should be applied beyond the current MTR
asym-based quantification method [
23,
24,
25].
Although our method showed the feasibility of a novel molecular MRI technique that can support the diagnosis and prognosis of demyelination and remyelination-related diseases where clinical symptoms are not conclusive, this study has several limitations and future research directions. First, to extend the anatomical coverage of GluCEST imaging for detecting signals in the demyelinated and remyelinated regions, multi-slice or three-dimensional GluCEST imaging should be applied. Further studies dealing with multiple brain regions, including different white matter regions, may provide information on the role of in vivo glutamate in myelin-related diseases as well as support current results. Second, contrary to our findings, other studies have indicated that glutamate levels might be reduced in demyelinated lesions, which can be attributed to mitochondrial dysfunction due to cuprizone administration [
26]. In addition, a previous study showed that chronic exposure to cuprizone increased glutamate-aspartate transporter (GLAST) expression in the CC, suggesting that long-lasting changes in GLAST expression may be effective in coping with glutamate toxicity [
27]. As such, there are various results and interpretations of changes in glutamate levels in in vivo studies of demyelination caused by cuprizone administration. Future studies using the chronic expression of demyelination and treatments for the remyelination process with various imaging, quantification, and biological analyses are needed to gain insight into the properties of in vivo glutamate changes. Moreover, this study was performed with a limited sample size, although our results showed that the change in glutamate level was significant between demyelinated and remyelinated lesions. Conducting further studies, with a larger number of subjects that model demyelination and remyelination-related diseases, would, we believe, provide results with more reliability. Finally, we need to confirm that the change in in vivo glutamate can occur before demyelination occurs, considering that the cuprizone-administered model is a toxic animal model in which demyelination is a secondary pathological change. Although we observed the GluCEST signal and pathological results for demyelination after seven weeks of cuprizone administration, evaluating the correlation between changes in GluCEST signals and histopathological samples periodically over a short period would be a meaningful study extending the current results.
4. Materials and Methods
4.1. Animal Models
All animal care and experiments were conducted with the approval of the Animal Care and Use Committee of Asan Medical Center of the University of Ulsan Medical School (approval date: 10-12-2018; permit code: 2018-13-271). Starting at four weeks of age, 18 male Sprague–Dawley rats were obtained from Orient Bio, Inc. (Seongnam, Kyunggi-do, Korea) and divided into the cuprizone-administered (
n = 12) and normal control (CTRL,
n = 6) groups. All twelve treatment rats were fed a milled diet containing 0.2% cuprizone (bis[cyclohexanone]oxaldihydrazone; Sigma–Aldrich, St. Louis, MO, USA),
ad libitum, for seven weeks to induce demyelination [
15,
20,
28]. Among the twelve rats, two died during cuprizone administration, so the demyelination and remyelination groups consisted of five rats each. After seven weeks, the demyelination model was considered complete, and five rats were randomly selected and sacrificed for histopathology (demyelination group, CPZ
DM,
n = 5). The remaining five rats were transferred to a normal chow diet for the recovery phase for an additional five weeks (remyelination group, CPZ
RM,
n = 5). The CTRL rats were fed a normal chow diet only.
4.2. MRI Data Acquisition
All MRI data acquisitions were conducted on a 7 T horizontal-bore PharmaScan 70/16 scanner (Bruker BioSpin, Ettlingen, Germany) with a 400 mT/m self-shielding gradient system. During imaging, the rat was maintained under anesthesia using 2.0% isoflurane delivered in a mixture of 75% air and 25% oxygen. Respiration and temperature were monitored using a small animal respiratory-gating system (SA Instruments Inc., Stony Brook, NY, USA) and a warm-water circulating flat-bed maintained at 37.0 ± 0.5 °C, respectively.
Region-of-interest (ROI)-based localized high-order shimming covering the whole brain area was applied before image scanning to achieve a homogeneous magnetic field in the MRI system. Multi-slice T
2-weighted images were acquired using a turbo-rapid acquisition with relaxation enhancement (RARE) sequence with repetition time (TR) = 4 s, echo time (TE) = 33 ms, matrix size = 96 × 96, field of view (FOV) = 30 × 30 mm
2, slice thickness = 1.5 mm, and RARE factor = 8. A single slice in which the hippocampus was well observed was then selected as the reference slice for GluCEST imaging. Single-slice GluCEST data were obtained using a fat-suppressed, turbo-RARE pulse sequence (TR = 4.2 s, TE = 36.4 ms, matrix size = 96 × 96, FOV = 30 × 30 mm
2, slice thickness = 1.5 mm, RARE factor = 16) with 25 frequency offsets (−6 to +6 ppm at intervals of 0.5 ppm and unsaturated (S
0) image). Images were acquired using a continuous-wave radiofrequency (RF) saturation pulse (power = 3.6 μT, and time = 1 s) [
12,
13]. A water saturation shift referencing (WASSR) dataset [
29] with 29 frequency offsets was acquired from −0.8 to 0.8 ppm (0.05 ppm increments) using 0.3 μT RF saturation power for B
0 correction. A B
1 map using a double flip-angle (30° and 60°) was also acquired for B
1 correction [
13].
Additionally, based on the same GluCEST image slice, we also acquired multi-parametric MRI data as follows: (i) apparent diffusion coefficient (ADC) maps were acquired using a single-shot spin-echo echo planar imaging sequence with seven b-values (0, 166.7, 333.3, 500, 666.7, 833.3, and 1000 s/mm2), TR = 3 s, TE = 18.7 ms, and NA = 3; (ii) cerebral blood flow (CBF) maps were obtained using a flow-sensitive alternating inversion recovery (arterial spin labeling with variable inversion times (TIs)) (16 TIs: TI1 = 35 ms, TI2 to TI15 = 100 to 1400 ms (100 ms increment), and TI16 = 1600 ms, TR = 10,212.2–11,777.2 ms, TE = 36.36 ms, and NA = 1); (iii) T1 relaxation maps were obtained using RARE with a variable repetition time sequence with six TRs (0.6, 0.9, 1.5, 2.5, 4.0, and 7.0 s), TE = 12.2 ms, RARE factor = 4, NA = 1; and (iv) T2 relaxation maps were obtained using a multi-spin multi-echo sequence with 15 TEs (10 to 150 ms with 10 ms increments), TR = 3 s, and NA = 1.
4.3. MRI Data Analysis
Before GluCEST imaging analysis, B
0 and B
1 corrections were applied using the WASSR method and relative B
1 values were calculated on the B
1 map. Using B
0- and B
1-corrected CEST data, the GluCEST contrast was computed by subtracting the normalized magnetization signal at 3.0 ppm from the magnetization at the corresponding reference frequency symmetrically upfield from water; GluCEST (%) = 100 × [S
sat(−3.0 ppm) − S
sat(+3.0 ppm)]/S
sat(−3.0 ppm) [
13]. An ROI for the calculation of the GluCEST values was manually drawn in the corpus callosum (CC) region. We also applied the same ROI in each rat for multi-parametric MR data analysis. The T
1 and T
2 relaxation maps were reconstructed using the following equations: I(t) = I
0·[1 − C·exp(−TR/T
1)] and I(t) = I
0·exp(−TE/T
2), respectively. The ADC map was fitted using the following equation: I = I
0·exp(−b·ADC). The CBF map was reconstructed from images with and without labeling. Statistical differences in the calculated MR signals, including GluCEST and multiparametric MRIs among the three groups (CTRL, CPZ
DM, and CPZ
RM), were analyzed by one-way analysis of variance (ANOVA), followed by Tukey’s post hoc tests. The level of significance was set at
p < 0.05. All MRI data analyses were performed using MATLAB R2019b (The MathWorks, Natick, MA, USA) and statistical analysis was performed using PASW Statistics for Windows, version 18.0 (SPSS Inc., Chicago, IL, USA).
4.4. Transmission Electron Microscopy (TEM)
In a subset of rats, demyelination and remyelination of the CC were observed at the ultrastructural level by transmission electron microscopy (TEM). Rats were anesthetized and fixed by cardiac perfusion using 4.0% paraformaldehyde (PFA). The harvested brain samples encompassing the midline of the CC were placed in a cold fixative solution with 2.5% glutaraldehyde in phosphate-buffered saline (PBS, 0.1 M, pH = 7.4) at 4 °C for 4 h. The brains were then dissected into small pieces following the midline sections and oriented such that cross-sections of axons within the CC were obtained. After rinsing with PBS, the specimens were postfixed in 1% osmium tetroxide solution for 1 h. The samples were then rinsed again using PBS. The tissues were dehydrated in a series of ascending ethanol solutions and infiltrated with propylene oxide. Then, pure Epon resin was used for embedding and the samples were incubated at 60 °C for 72 h. Semi-thin sections (thickness = 1 μm) were stained with toluidine blue to identify the target orientation and location of the sections under a microscope. Ultrathin serial sections were prepared from the center of the embedded blocks containing the axons in the CC area using an ultramicrotome (thickness = 60 nm). The sections were then placed on copper slot grids and stained with 2% uranyl acetate and lead citrate. All sections were examined under a Hitachi H-7600 TEM at 80 kV.
4.5. Myelin Staining
To visualize the myelin distribution in the CC, the whole brain was sectioned from the bregma −4 mm in the coronal plane at 20 μm thickness and then rehydrated in distilled Milli-Q water for 2 min. The slide sections were incubated in a 0.3% solution of Black-Gold II (AG105, Millipore Corp, Billerica, MA, USA), dissolved in 0.9% saline, and heated to 60 °C for 12 min. All slides were then washed twice with Milli-Q water. All transferred slides were fixed in a 1% sodium thiosulfate solution for 3 min and then dehydrated using a series of graduated ethanol solutions, cleared in xylene for 2 min, and cover-slipped with mounting media. All sections were examined under a Zeiss Axio Observer.Z1 bright field microscope.

 ,
, 


