Article

Comparison of Surface Solar Irradiance from Ground Observations and Satellite Data (1990–2016) over a Complex Orography Region (Piedmont—Northwest Italy)

1
Department of Environmental Science and Policy, Università degli Studi di Milano, 20133 Milano, Italy
2
Institute of Atmospheric Sciences and Climate, ISAC-CNR, via Gobetti 101, 40129 Bologna, Italy
3
Satellite-Based Climate Monitoring, Deutscher Wetterdienst, 63067 Offenbach, Germany
*
Author to whom correspondence should be addressed.
Remote Sens. 2020, 12(23), 3882; https://doi.org/10.3390/rs12233882
Submission received: 26 October 2020 / Revised: 19 November 2020 / Accepted: 24 November 2020 / Published: 26 November 2020
(This article belongs to the Special Issue Recent Advances in Cryospheric Sciences)

Abstract

:
Climate Monitoring Satellite Application Facility (CM SAF) surface solar irradiance (SSI) products were compared with ground-based observations over the Piedmont region (north-western Italy) for the period 1990–2016. These products were SARAH-2.1 (Surface Solar Radiation DataSet—Heliosat version 2.1) and CLARA-A2 (Cloud, Albedo and Surface Radiation dataset version A2). The aim was to contribute to the discussion on the representativeness of satellite SSI data including a focus on high-elevation areas. The comparison between SSI averages shows that for low OCI (orographic complexity index) stations, satellite series have higher values than corresponding ground-based observations, whereas for high OCI stations, SSI values for satellite records are mainly lower than for ground stations. The comparison between SSI anomalies highlights that satellite records have an excellent performance in capturing SSI day-to-day variability of ground-based low OCI stations. In contrast, for high OCI stations, the agreement is much lower, due to the higher uncertainty in both satellite and ground-based records. Finally, if the temporal trends are considered, average low-elevation ground-based SSI observations show a positive trend, whereas satellite records do not highlight significant trends. Focusing on high-elevation stations, the observed trends for ground-based and satellite records are more similar with the only exception of summer. This divergence seems to be due to the relevant role of atmospheric aerosols on SSI trends.

1. Introduction

Surface solar irradiance (SSI) is the fraction of solar radiation that reaches the Earth’s surface [1]. This variable has a central role in the surface energy balance, driving a large number of physical and chemical processes in the atmosphere [2,3]. It plays an essential role in a wide range of sectors, including agriculture, energy production, tourism, and even health care [4,5,6,7]. SSI, and in particular the proportion between direct and diffuse solar irradiance, also influences global plant productivity and the land carbon sink [8]. Moreover, because solar radiation is a key component of the surface-energy balance, it provides about 75% of the melt energy on most glaciers [9], affecting river runoff and thus freshwater resources fundamental for the human communities. It is therefore very important to improve the datasets and the methods that allow investigating the spatial distribution and the temporal evolution of this variable.
Available studies document a decrease in SSI, referred to as “global dimming”, of about 3–9 Wm−2 from the 1950s to the 1980s and a subsequent increase, referred to as “brightening period”, of about 1–4 Wm−2 from the beginning of the 1980s [10,11]. This pattern is highlighted both by studies focusing on specific regions [12,13,14,15,16,17] as well as by studies focusing on worldwide datasets [18]. However, a continuous decreasing trend in SSI even after the 2000s has been documented by some studies focusing on countries with developing economies [19].
SSI variations are mostly driven by changes in atmospheric transparency due to variations in cloudiness and/or changes in aerosol concentrations. The relative contribution of clouds and aerosols to SSI variations is however not yet clear, especially when comparing studies regarding different areas and covering different periods. A better understanding of the factors influencing SSI variations is often hampered by the low availability of long-term high-quality station records for both SSI [20,21] and aerosols/clouds especially over oceans, remote or sparsely populated areas, and mountainous regions, where installing and maintaining meteorological stations is more difficult. This problem also reflects a high uncertainty when SSI and its driving factors are estimated in climate models [22].
SSI data from meteorological stations can be integrated with data from satellite remote sensing: on a monthly time-scale, the uncertainty of these data may be in the range of the uncertainty of ground-based observations [23]. Although satellite data have only been available since the 1980s, they have a higher coverage compared to ground-based measurements, especially over remote areas where very often no station data are available. Widely used satellite data for Europe are the gridded SSI fields SARAH-2.1 [24]—an extension in time of SARAH-2 [25]—and CLARA-A2 [26], which are available among climate products from the EUMETSAT Satellite Application Facility on Climate Monitoring (CM SAF—https://www.cmsaf.eu). The validation of these products is extensively discussed both in CM SAF validation reports [24,26] and in scientific papers [27,28]. It highlights an excellent quality of the satellite data showing that they effectively capture SSI spatial and year-to-year variability of corresponding ground stations, although CLARA-A2 records suffer from missing data before 1992 that cause increasing data uncertainty. Moreover, CM SAF SSI products give evidence of a good decadal stability.
An extensive validation of SARAH-JRC (SARAH version used by the European Commission Joint Research Centre for photovoltaic energy calculations) and CLARA-A2 datasets over Europe has also been performed by Urraca et al. [29] for the period from 2005 to 2015.
At EUMETSAT CM SAF, the production of long-term datasets is pursued. The ultimate aim is to make the resulting datasets suitable for the analysis of climate variability, and potentially for the detection of climate trends. It is therefore very important to investigate whether SARAH-2.1 and CLARA-A2 records correctly capture decadal time scale variations such as the slow increase that many ground stations showed in the brightening period. This issue has therefore been investigated extensively by Pfeifroth et al. [28] for Europe: they found a general good agreement even though some areas turn out to be more problematic. Specifically, for northern and southern Europe, trends shown by station data are not completely reproduced by satellite data, especially in summer in southern Europe. For this area, the authors suggested that the underestimation of the trend shown by satellite data could be due to aerosols being considered as constant (monthly climatology) while in the period under analysis they showed a significant reduction. The disagreement between SSI trends captured by SARAH-2 and CLARA-A2 and corresponding trends from ground-based observations in southern Europe has been further investigated by Montero-Martin et al. [30], focusing on 12 stations over the Iberian Peninsula and considering the period 1985–2015. They reported that the two satellite datasets substantially underestimated the trends found for the considered 12 in situ stations in the brightening period. Specifically, although the ground-based SSI data highlighted significant trends at most stations (slopes between −0.5 and 6.5 Wm−2decade−1), the corresponding SARAH-2 and CLARA-A2 data did not show any significant trend: the slopes of the satellite records turned out to be in the intervals between 0.2 and 2.8 Wm2decade−1 and −0.4 and 3.8 Wm2decade−1 for SARAH-2 and CLARA-A2, respectively. The relevant role of aerosols in the comparison between satellite and ground-based SSI records has also been highlighted by Wang et al. [31] for China. They reported a rather large bias for both SARAH-E (data from Meteosat East satellites) and CLARA-A2 records that largely decreased if the comparison between satellite and ground-based records was performed for rural stations only.
Within this context, the present work aims to provide a new contribution to the comparison between SSI data from ground-based observations and CM SAF SARAH-2.1 and CLARA-A2 products. It focuses both on low- and high-elevation sites where satellite datasets can be fundamental because of the low availability of station data. Specifically, the work focuses on an area in north-western Italy which is covered by a very dense network of SSI stations covering the 1990–2016 period that has been subjected to a detailed homogenisation by Manara et al. [32]. Besides its excellent data availability, this area is also interesting because it includes stations with considerably different levels of aerosol concentrations, ranging from the highly polluted Po Plain to the unpolluted Alpine high-elevation sites. Moreover, in this area the emission of pollutants has strongly decreased over the last decades, causing a significant trend in all variables connected to atmospheric transparency with the only exception of high-level stations that fall outside the atmospheric layer directly influenced by ground-level pollutant emissions [14,15,32,33,34]).
The paper is organised in five sections. After the Introduction, Section 2 presents the databases used and the methods adopted for the analyses. Then, Section 3 presents the main results, Section 4 discusses the results presented in Section 3, and finally some conclusive remarks are given in Section 5.

2. Data and Methods

2.1. Ground-Based Observations

In this work we used a subset of 57 records extracted from the dataset of 1990–2016 ground-based SSI observations presented by Manara et al. [32]. The considered stations were in the area 6.6°–9.0° E, 44.1°–46.2° N and they had elevations between 77 m and 4560 m. All the stations were included in the meteorological network of the Piedmont environmental agency (Arpa Piemonte—http://www.arpa.piemonte.it/) (Figure 1 and Table 1).
The data were recorded with first-class radiometers usually checked for calibration one or two times per year by means of a reference instrument (see Manara et al. [32] for full details). After preliminary quality checks, the station records were subjected by Manara et al. [32] to a gap-filling procedure in order to estimate daily missing values. This procedure aimed to avoid bias in the monthly averages due to gaps in the daily series. Specifically, each daily missing value was estimated by means of the most correlated reference series using a relationship based on the assumption of the constancy of the ratio between the test series (the series to be filled) and the reference series. Moreover, the reference series should belong to the same climatic area of the test series and the data that are missing in the test series should be available.
The monthly station records were then subjected by Manara et al. [32] to a homogenisation procedure in order to identify and eliminate non-climatic signals. In particular, the Craddock test was applied, comparing the test series with a reference series to identify possible breaks. In order to be sure that the break was ascribable to the test series and not to the reference series, the Craddock test [35,36] was applied to more than one reference series. Then, the adjustment factors to apply to the test series were calculated using only those reference series that proved to be homogeneous in a sufficiently long period centred on the break. It should be noted that the adjustment factors are usually applied to the part of the series before the break (the old one), considering the part after the break as homogeneous (the more recent one) in order to simplify the updating of the series when new data are available. This approach assures the homogeneity in terms of temporal evolution but not in terms of normal values. The monthly correcting factors were also transferred to the daily series in order to make them homogeneous as well. Finally, we subjected the monthly records to a procedure aiming at completing the records over the entire investigated period [32] using a methodology similar to that adopted for the daily series. The data filling procedure enabled the completion of all the records over the period 2001–2016, whereas some gaps remained for the period 1990–2000 (about 0.4% of the data considering only the series selected for this paper) because for some mountain stations adequate reference series were not always available within the gap filling procedure.
Station metadata give evidence that some station locations do not fulfil World Meteorological Organization requirements because they are affected by shading in the first hours after sunrise or before sunset. This problem induces significant bias in some station records; it mainly affects some urban stations and some stations in mountain areas. Another issue that has to be considered when station records are compared to satellite data is the homogenisation procedure: in fact, as explained above, this procedure is generally applied to station data with the only goal of removing breaks and it does not take into account that if a biased period is considered as the reference period, then it will increase the bias of a record. In case of a break, homogenisation methods can in fact either adjust the data before the break or those after the break (independently from which of them are correct) and the resulting records, although different in terms of absolute values, are equivalent for the assessment of temporal trends. Therefore, when focusing on the comparison between stations and satellite records, station metadata (including information on the applied adjustments) should be considered in order to correctly interpret the obtained results.

2.2. SARAH Dataset

SARAH, the Surface Solar Radiation DataSet—Heliosat, is a satellite-based database of several variables linked to surface solar radiation. SARAH first edition (SARAH-1.0) was issued by EUMETSAT CM SAF in 2015 and it covered the period 1983–2013, whereas SARAH-2.0 (1983–2015) was issued in 2017. SARAH-2.1 was then issued in 2019, updating SARAH-2.0 to 2017. The surface solar radiation records are obtained after the combination of the following two steps [37]: (i) the observations obtained from the visible channels of the Meteosat Visible Infra-Red Imager (MVIRI) and the Spinning Enhanced Visible and Infrared Imager (SEVIRI) instruments on board EUMETSAT’s geostationary Meteosat satellites are processed using a climate version of the Heliosat algorithm to obtain the effective cloud albedo [38]. Specifically, the Heliosat algorithm uses the reflectance or radiance measurements to determine the effective cloud albedo comparing the satellite measurement and the corresponding observation under clear-sky conditions. A brighter pixel suggests that a higher fraction or thicker clouds are present. This algorithm can present some problems, for example over bright surfaces such as snow; (ii) clear sky radiation is then calculated by means of the clear sky part of the SPECMAGIC method (SPECtral Mesoscale Atmospheric Global Irradiance Code—http://gnu-magic.sourceforge.net/) [39]. This method is based on an LUT (lookup table) approach where discrete pre-computed results of a radiative transfer model are stored in order to reduce runtime computation. Then, the value for a given atmospheric state can be extracted for each satellite pixel and time and combined with the extra-terrestrial incoming solar flux density. The main processes considered are Rayleigh scattering, scattering and absorption by aerosols (aerosol monthly climatology at 1° × 1° resolution), the absorption by water vapor (reanalysis monthly values at 0.75° × 0.75° resolution, topographically corrected to 0.15° resolution), ozone, and the reflection by the Earth’s surface.
SARAH-2.1 data cover the region between ±65° longitude and ±65° latitude. SSI records can be downloaded from CM SAF web site as monthly and daily means, and as 30 min data on a regular latitude/longitude grid with a spatial resolution of 0.05° × 0.05° degrees. As stated in the validation report [40], the comparison with the Baseline Surface Radiation Network (BSRN) data of the monthly means shows a mean bias of 2 Wm−2, a mean absolute error of 5.1 Wm−2, and a correlation of the monthly anomalies of 0.93. For the daily means, the mean bias is comparable to the value derived for the monthly means while the mean absolute error is 11.8 Wm−2.
In this study, we used only the SARAH-2.1 grid points closest to the 57 station sites (Figure 1). They are 54 grid points, because 3 grid points were associated to more than one station site. For each SARAH-2.1 grid point, we also considered all the grid points of the 30 arc-second resolution GTOPO30 digital elevation model [41] falling within the SARAH-2.1 grid box and we calculated the average and the standard deviation of their elevations. The grid point standard deviation was then used as an index representing the orographic complexity (OCI) associated with the considered SARAH-2.1 grid point, and finally the SARAH-2.1 grid point OCIs were used, together with corresponding CLARA-A2 grid point indexes (see next section), to sort the stations in Table 1.
SARAH-2.1 records have a very low fraction of missing data in the investigated period (about 0.2% for daily data). However, we also subjected these records to the same data-filling procedure applied to ground-based observations aiming at obtaining monthly records which are not biased by missing values. This procedure enabled the completion of all the records over the considered period.

2.3. CLARA Datset

CLARA, the Cloud, Albedo and Surface radiation dataset from AVHRR data, is another satellite-based database of several variables linked to surface solar radiation. CLARA first edition (CLARA-A1) was issued by EUMETSAT CM SAF in 2012 and it covered the period 1982–2009, whereas CLARA-A2 (1982-2015) was issued in 2017 [26]. The CLARA-A2 dataset, an improved and extended version of CLARA-A1, is based on data from the advanced very high resolution radiometer (AVHRR) on board the polar orbiting NOAA satellites, as well as on board the MetOp polar orbiters operated by EUMETSAT since 2006. To estimate the SSI from the AVHRR measurements, the cloud mask based on the NWC SAF polar platform system (PPS) cloud processing software [42] is used to distinguish clear and cloudy pixels. For clear-sky pixels, the SSI is derived using auxiliary parameters (e.g., water vapor, surface albedo) with the MAGIC (mesoscale atmospheric global irradiance code) clear-sky radiative transfer model [43]. Under cloudy situations, broadband solar fluxes are estimated using the visible reflectance as measured by the AVHRR instrument. A look-up table (also depending on auxiliary data) is used to relate these reflected solar fluxes to the atmospheric transmissivity, which is transferred to SSI using the extra-terrestrial solar flux. The daily mean SSI is derived from the instantaneous satellite information using the method from Diekmann et al. [44], which considers the diurnal solar cycle for the averaging calculations. For the spatial averaging from the resolution of the satellite pixel (approx. 0.05°) to the 0.25° grid, a minimum of 20 valid daily means are required. The monthly means are only calculated if more than 20 valid daily means are available. More detailed information can be found in Karlsson et al. [45] and references therein.
CLARA-A2 data are available globally with a spatial resolution of 0.25° × 0.25° and at daily and monthly temporal resolutions. They cover the period 1982–2018, even if the initial period has a rather large number of missing data because only one satellite was available until the early 1990s. As stated in the validation report, CLARA-A2 shows a bias of −1.6 Wm−2 at monthly resolution when compared against the BSRN data, a mean absolute error of 8.8 Wm−2, and a correlation of the anomalies of 0.87. Similarly, at daily resolution CLARA-A2 shows a bias of −1.7 Wm−2, a mean absolute error of 18.6 Wm−2 and a correlation of the anomalies of 0.9. As for SARAH-2.1, for CLARA-A2 we used only the grid points that were closest to the 57 station sites (Table 1). They were 34 grid points, because 15 grid points were associated to more than one station site. Moreover, for CLARA-A2 too, we used the GTOPO30 digital elevation model to obtain, for each considered grid point, the average elevation and the OCI using the same procedure adopted for SARAH-2.1 (see Table 1). When sorting the station sites for orographic complexity, we used the highest value between the CLARA-A2 and SARAH-2.1 indexes. It was usually the OCI from CLARA-A2, because of the lower resolution of the CLARA-A2 grid.
CLARA-A2 records had a greater fraction of missing data than SARAH-2.1 (about 5.4% for daily data) and this fraction was particularly relevant before 2001. We subjected the records to the data-filling procedure, already used in Section 2.1 and Section 2.2, aiming at obtaining monthly records which were not biased by missing values. This procedure enabled the completion of all the records over the period 2001–2016, whereas a relevant fraction of gaps remained for the period 1990–2000 (12.4% of the data) because adequate reference series were not available within the gap filling procedure.

2.4. Other Datasets

As well as the ground-based stations and satellite SSI datasets, we also used Atmospheric Optical depth data from the Modern-Era Retrospective Analysis for Research and Applications, Version 2 (MERRA-2—https://gmao.gsfc.nasa.gov/reanalysis/MERRA-2/data_access/ [46]) to investigate the evolution of atmospheric transmissivity over the considered period. This atmospheric reanalysis, produced by NASA’s Global Modelling and Assimilation Office (GMAO), has a horizontal resolution of 0.5° × 0.625°. Moreover, we used 500 m-resolution climatologies of length of ground snow coverage per year calculated from MODIS satellite data using the methodology described by Gafurov and Bardossy [47]. These values have been used to calculate corresponding climatologies for SARAH-2.1 and CLARA-A2 grid cells. Specifically, for each SARAH-2.1 and CLARA-A2 grid cell, the corresponding length of snow coverage is calculated as the average of all MODIS grid cells falling within the selected SARAH-2.1 and CLARA-A2 grid.

2.5. Error Indexes and Trend Analysis

The comparison of SSI values from the different data records is performed by first analysing the average differences over the period 2001–2016 between ground-based and satellite observations, and of the two satellite datasets (Section 3.1). Specifically, the comparison was performed focusing on the entire dataset when the two satellite datasets were compared and on a subset of 32 station sites (last column of Table 1) when ground-based and satellite records were considered. In both cases, the records were clustered in two groups according to their OCI (stations with OCI lower than or equal to 153 m and stations with OCI higher than 153 m).
We selected a subset of series to compare ground-based and satellite observations (both SARAH-2.1 and CLARA-A2) because a significant fraction of the ground-based records, even though homogenous in terms of temporal trend, may have had biased SSI values in terms of normal values (see Section 2.1). Indeed, we eliminated the records falling in at least one of the following three categories:
  • records with metadata giving evidence of shading;
  • records for which the 2001–2016 SSI normal values changed by more than 5% because of the homogenisation procedure;
  • records with seasonal average SSI below the following thresholds: 60 Wm−2 for winter, 180 Wm−2 for spring, 240 Wm−2 for summer, 100 Wm−2 for autumn, and 150 Wm−2 for the year. These thresholds were considered because metadata were not complete for all stations and it was therefore necessary to add a further condition to identify the records which may have been affected by shading problems not documented by the metadata.
Twenty-five records were excluded by these criteria, while 32 records were evaluated as unbiased in terms of normal values. For these 32 records, we also checked the effect of shading from the orography falling within a distance of 10 km by means of a 30 m-resolution Digital Elevation Model (DEM), resampled to 90 m to increase computation speed [48]. Specifically, for each station site we considered the days falling in the middle of each month and we first divided the period between sunrise and sunset into 48 parts. Then, for each of them we verified whether direct radiation could reach the station and finally we used this result within a clear-sky model, based both on Lambert–Beer’s law and on a simple estimation of diffuse radiation (see Manara et al. [33] for full details on this model), to estimate by how much shading can reduce SSI. The results highlighted that, even with a clear sky (i.e., the condition more critical for shading issues), in no one of the station sites did topographic shading reduce SSI by more than 3%. However, any shading effect can affect only climatological values and not the year-to-year variability nor long term trend.
All SSI records were then transformed into daily, monthly, seasonal, and annual anomaly records (additive anomalies) with respect to the corresponding normals (daily, monthly, seasonal, annual) of the period 2001–2016 and these anomaly records were used to investigate the agreement of the variability between SSI from ground-based and satellite observations (Section 3.2). The agreement was investigated focusing on mean absolute differences as well as on common variances, considering different temporal resolutions (from the day to the year) and clustering the entire dataset (57 stations) and the selected subset of records (32 stations) according to the station OCI. The mean absolute differences, usually indicated as station-site satellite mean absolute errors, give evidence of the accuracy of the satellite records, whereas the common variances show how much of the variability of the ground-based records is captured by the satellites.
The aim of Section 3.1 and Section 3.2 is to analyse: (i) the bias between the different data sources considering that both type of measures can be affected by errors; and (ii) to analyse the agreement of the anomaly records at different temporal resolutions, investigating in the first case whether a systematic difference exists between the different datasets, and in the latter how much of the variability explained by the ground-based observations can be reproduced by satellite observations.
Finally, the SSI data records from the different data sources are compared for trends (Section 3.3). Specifically, monthly, seasonal and annual anomaly records representative of low-elevation station sites (elevation lower than or equal to 600 m—39 station sites) and high-elevation station sites (station elevation higher than 600 m—18 station sites) are calculated by simply averaging the corresponding monthly, seasonal and annual anomaly records. The trends are then evaluated with the Theil–Sen [49,50] method and the corresponding significances are evaluated by means of the Mann–Kendall non-parametric test [51]. Specifically, the Theil–Sen estimator considers the median of the slopes of all lines passing through each pair of points. With respect to the simple linear regression, it is less sensitive to outliers. The Mann–Kendall non-parametric test is used to determine whether a time series has an upward or downward trend, and being a non-parametric test it can be used for all distributions. For trends, we focused on station site elevations rather than on OCI because we aimed at highlighting whether the agreement of the temporal behaviour shown by the two types of observations depends on the considered altitude characterised by different cloudiness conditions and aerosol concentrations.

3. Results

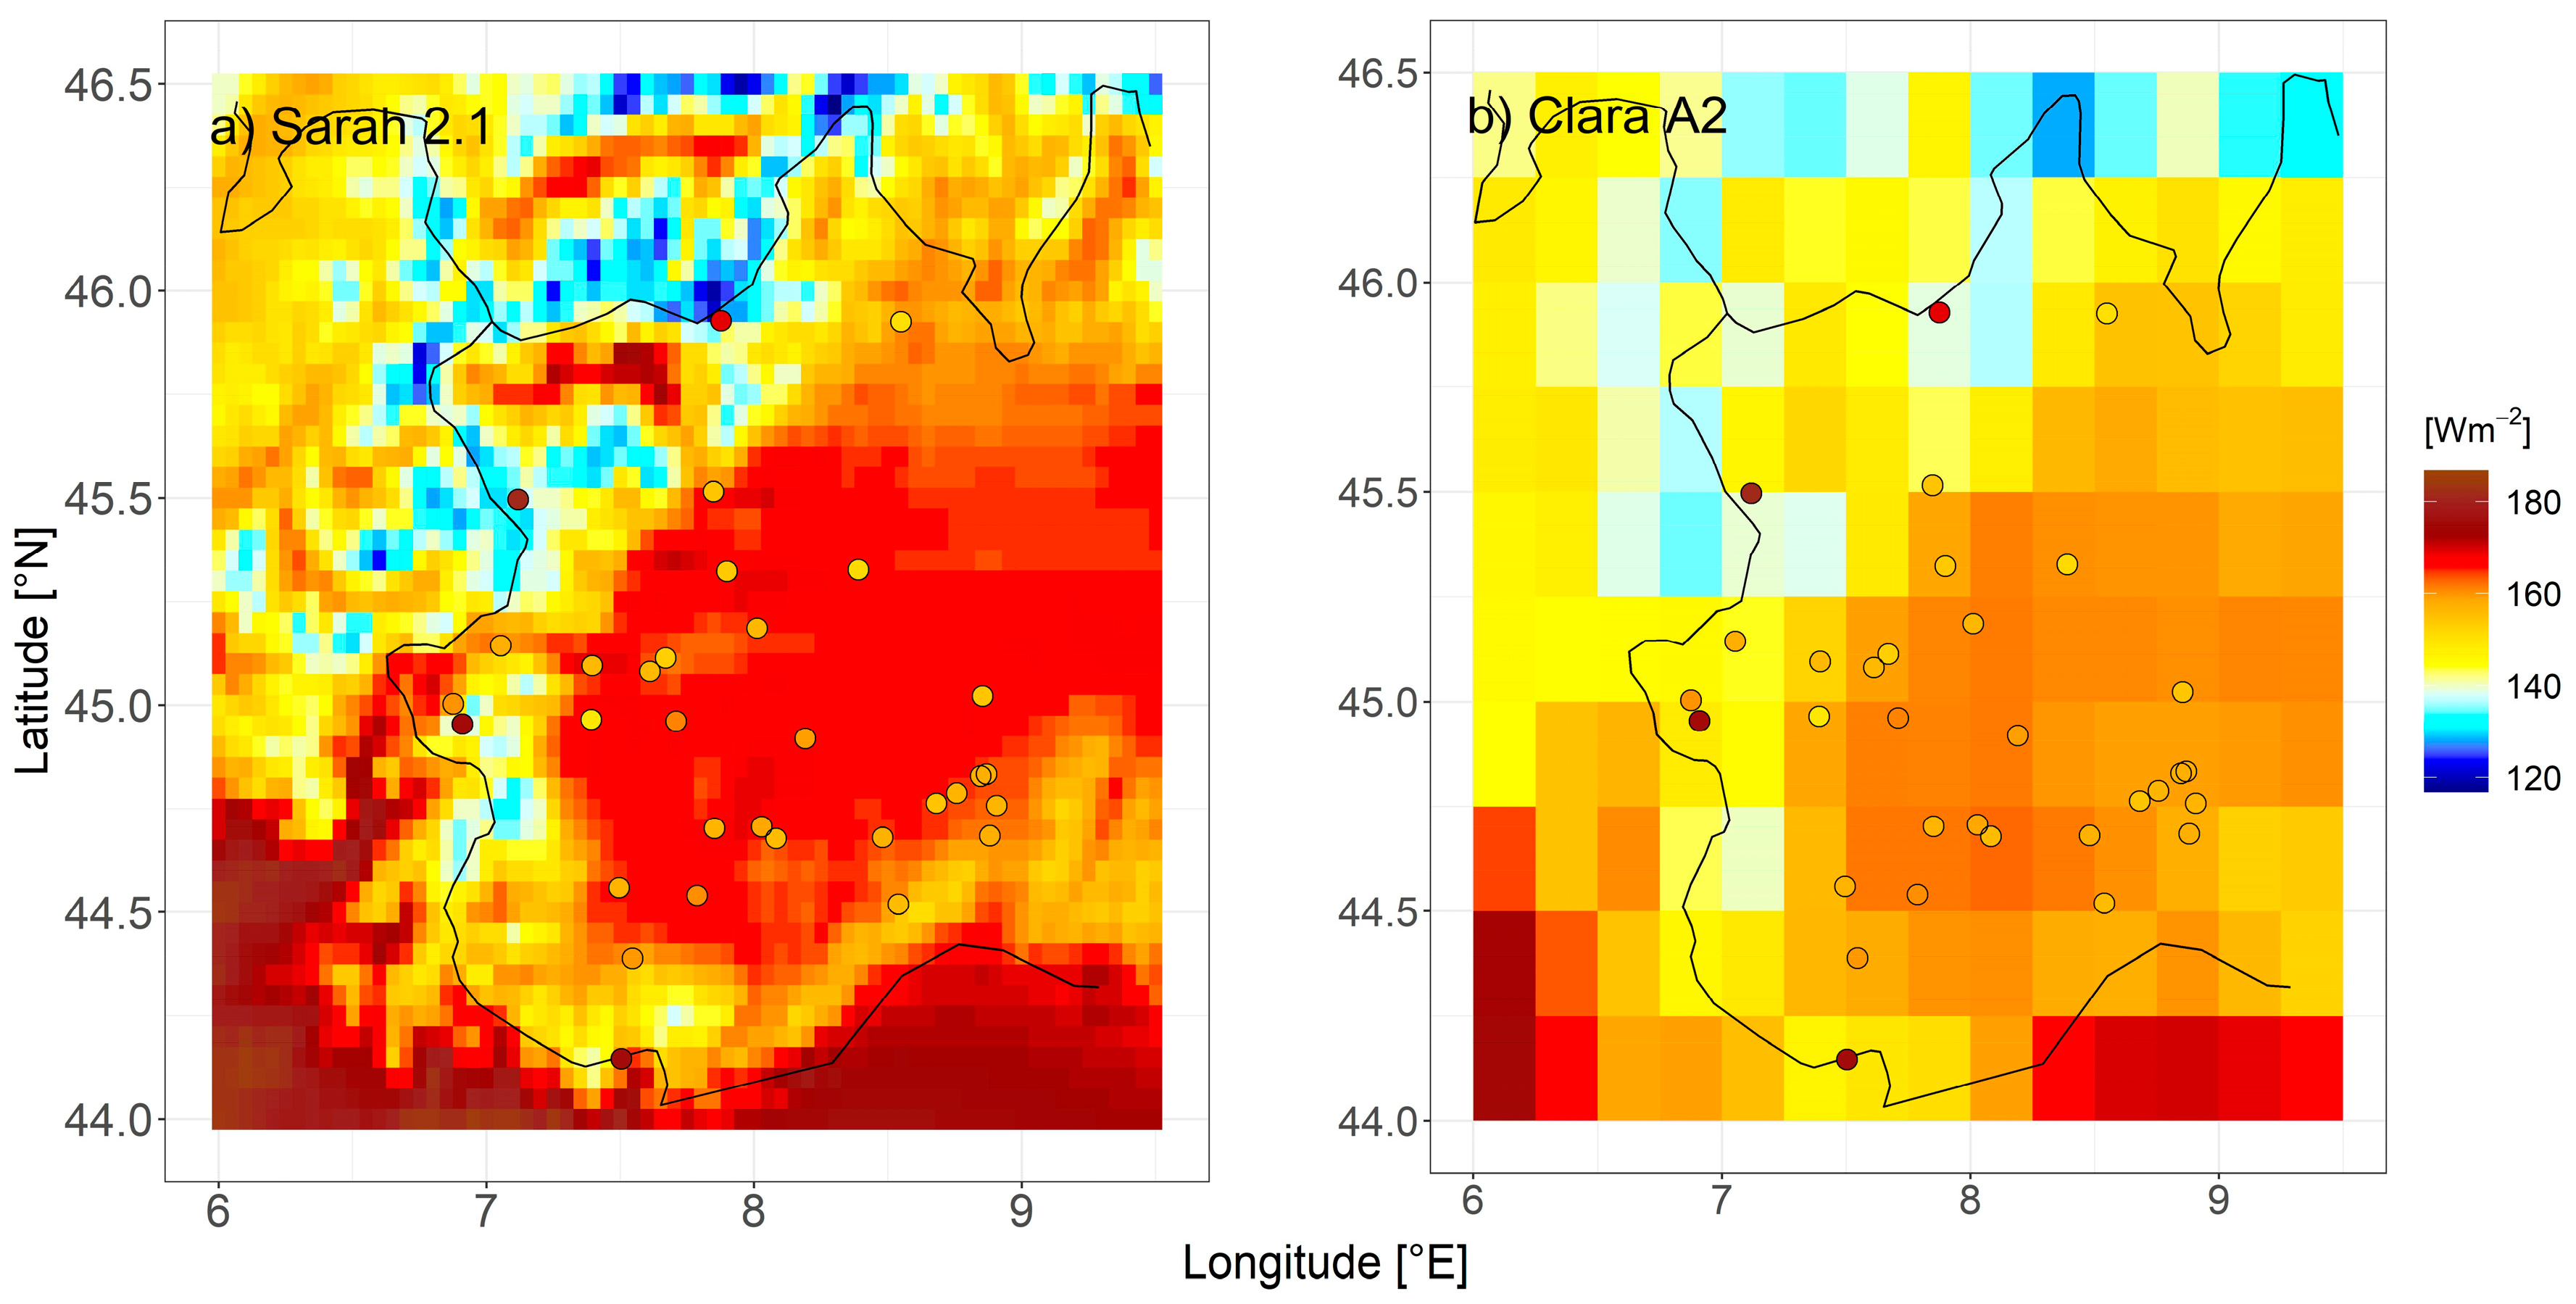
3.1. Comparison of Average SSI Values from Different Data Records

SARAH-2.1 data gave evidence of higher yearly average SSI values over the 57 considered sites than CLARA-A2 ones, with an average difference of 6.7 Wm−2 over the period 2001–2016 (Table 2). The seasons with the highest differences between SARAH-2.1 and CLARA-A2 average SSI values were spring and summer (8.6 and 8.3 Wm−2, respectively), whereas in winter the difference reduced to 3.9 Wm−2 (Table 2). Focusing only on the 30 station sites with low orographic complexity (maximum OCI = 153 m), the average difference between SARAH-2.1 and CLARA-A2 SSI values was very stable along the year and all seasonal averages fell within the interval 5.0–5.4 Wm−2 (Table 2). These station sites also provided evidence of a rather low spatial variability of the differences between SARAH-2.1 and CLARA-A2 SSI values. Considering the yearly averages of these differences, we obtained a standard deviation of 1.4 Wm−2, whereas considering the seasonal averages the standard deviations ranged from 1.0 Wm−2 in winter to 2.9 Wm−2 in summer (Table 2). In contrast, focusing on the remaining 27 station sites (171 m ≤ OCI ≤ 702 m), the differences between SARAH-2.1 and CLARA-A2 SSI values exhibited a much less coherent pattern both in terms of seasonality and in terms of spatial distribution. In this case, the seasonal average station site differences ranged from 2.6 Wm−2 in winter to about 12 Wm−2 in spring and in summer, whereas the standard deviations of the station site average differences ranged from 6.6 Wm−2 in autumn to 14.0 Wm−2 in summer, with a rather high value on the yearly scale as well (10.5 Wm−2Table 2).
The results of the comparison between satellite records and ground-based records using the subset of 32 records evaluated as unbiased in terms of normal values (see last column of Table 1 and Section 2.5) are shown in Figure 2 and Figure 3. They show that for station sites with low OCI (OCI ≤ 153 m), the differences between SSI values recorded by ground stations and corresponding satellite values were rather stable: SARAH-2.1 SSI annual averages were 6.9 ± 2.4 Wm−2 higher than corresponding values from ground stations, whereas for CLARA-A2 this value decreased to 1.7 ± 2.3 Wm−2. The average differences between SSI values recorded by satellite values and corresponding ground stations were lowest in winter (5.1 ± 2.6 and 0.2 ± 2.5 Wm−2 for SARAH-2.1 and CLARA-A2, respectively) and highest in autumn (9.1 ± 1.9 and 3.7 ± 1.4 Wm−2 for SARAH-2.1 and CLARA-A2, respectively). For station sites with high OCI, the situation was completely different and Figure 2 and Figure 3 give evidence of a complex pattern; most station sites had higher SSI values for ground-based observations and a few others had higher values for satellite data. The strongest satellite underestimations concerned the highest station sites of Capanna Margherita (4560 m a.s.l.) and Gran Vaudala (3272 m a.s.l.), which presented for ground-based observations values of 171 and 184 Wm-2, respectively, compared to 128 (139) Wm−2 and 135 (138) Wm−2 of SARAH-2.1 (CLARA-A2), for the two sites respectively. The average annual SSI over the five highest station sites exhibited the same behaviour, with values of 145, 143 and 174 Wm−2 for SARAH-2.1, CLARA-A2 and the ground stations, respectively.
Figure 4 provides a quick overview of the differences between the spatial patterns of yearly average SSI values from the three discussed data sources. As for Figure 2 and Figure 3, also in this case, for ground-based observations we focused only on the selected subset of 32 stations.

3.2. Common Variances and Mean Absolute Differences between SSI Records from Different Data Sources

Table 3 shows the common variances between ground-based anomaly records (considering all investigated sites) and satellite records, averaged over low and high OCI station sites and considering different temporal resolutions, from the day to the year. Moreover, it shows the corresponding mean absolute differences.

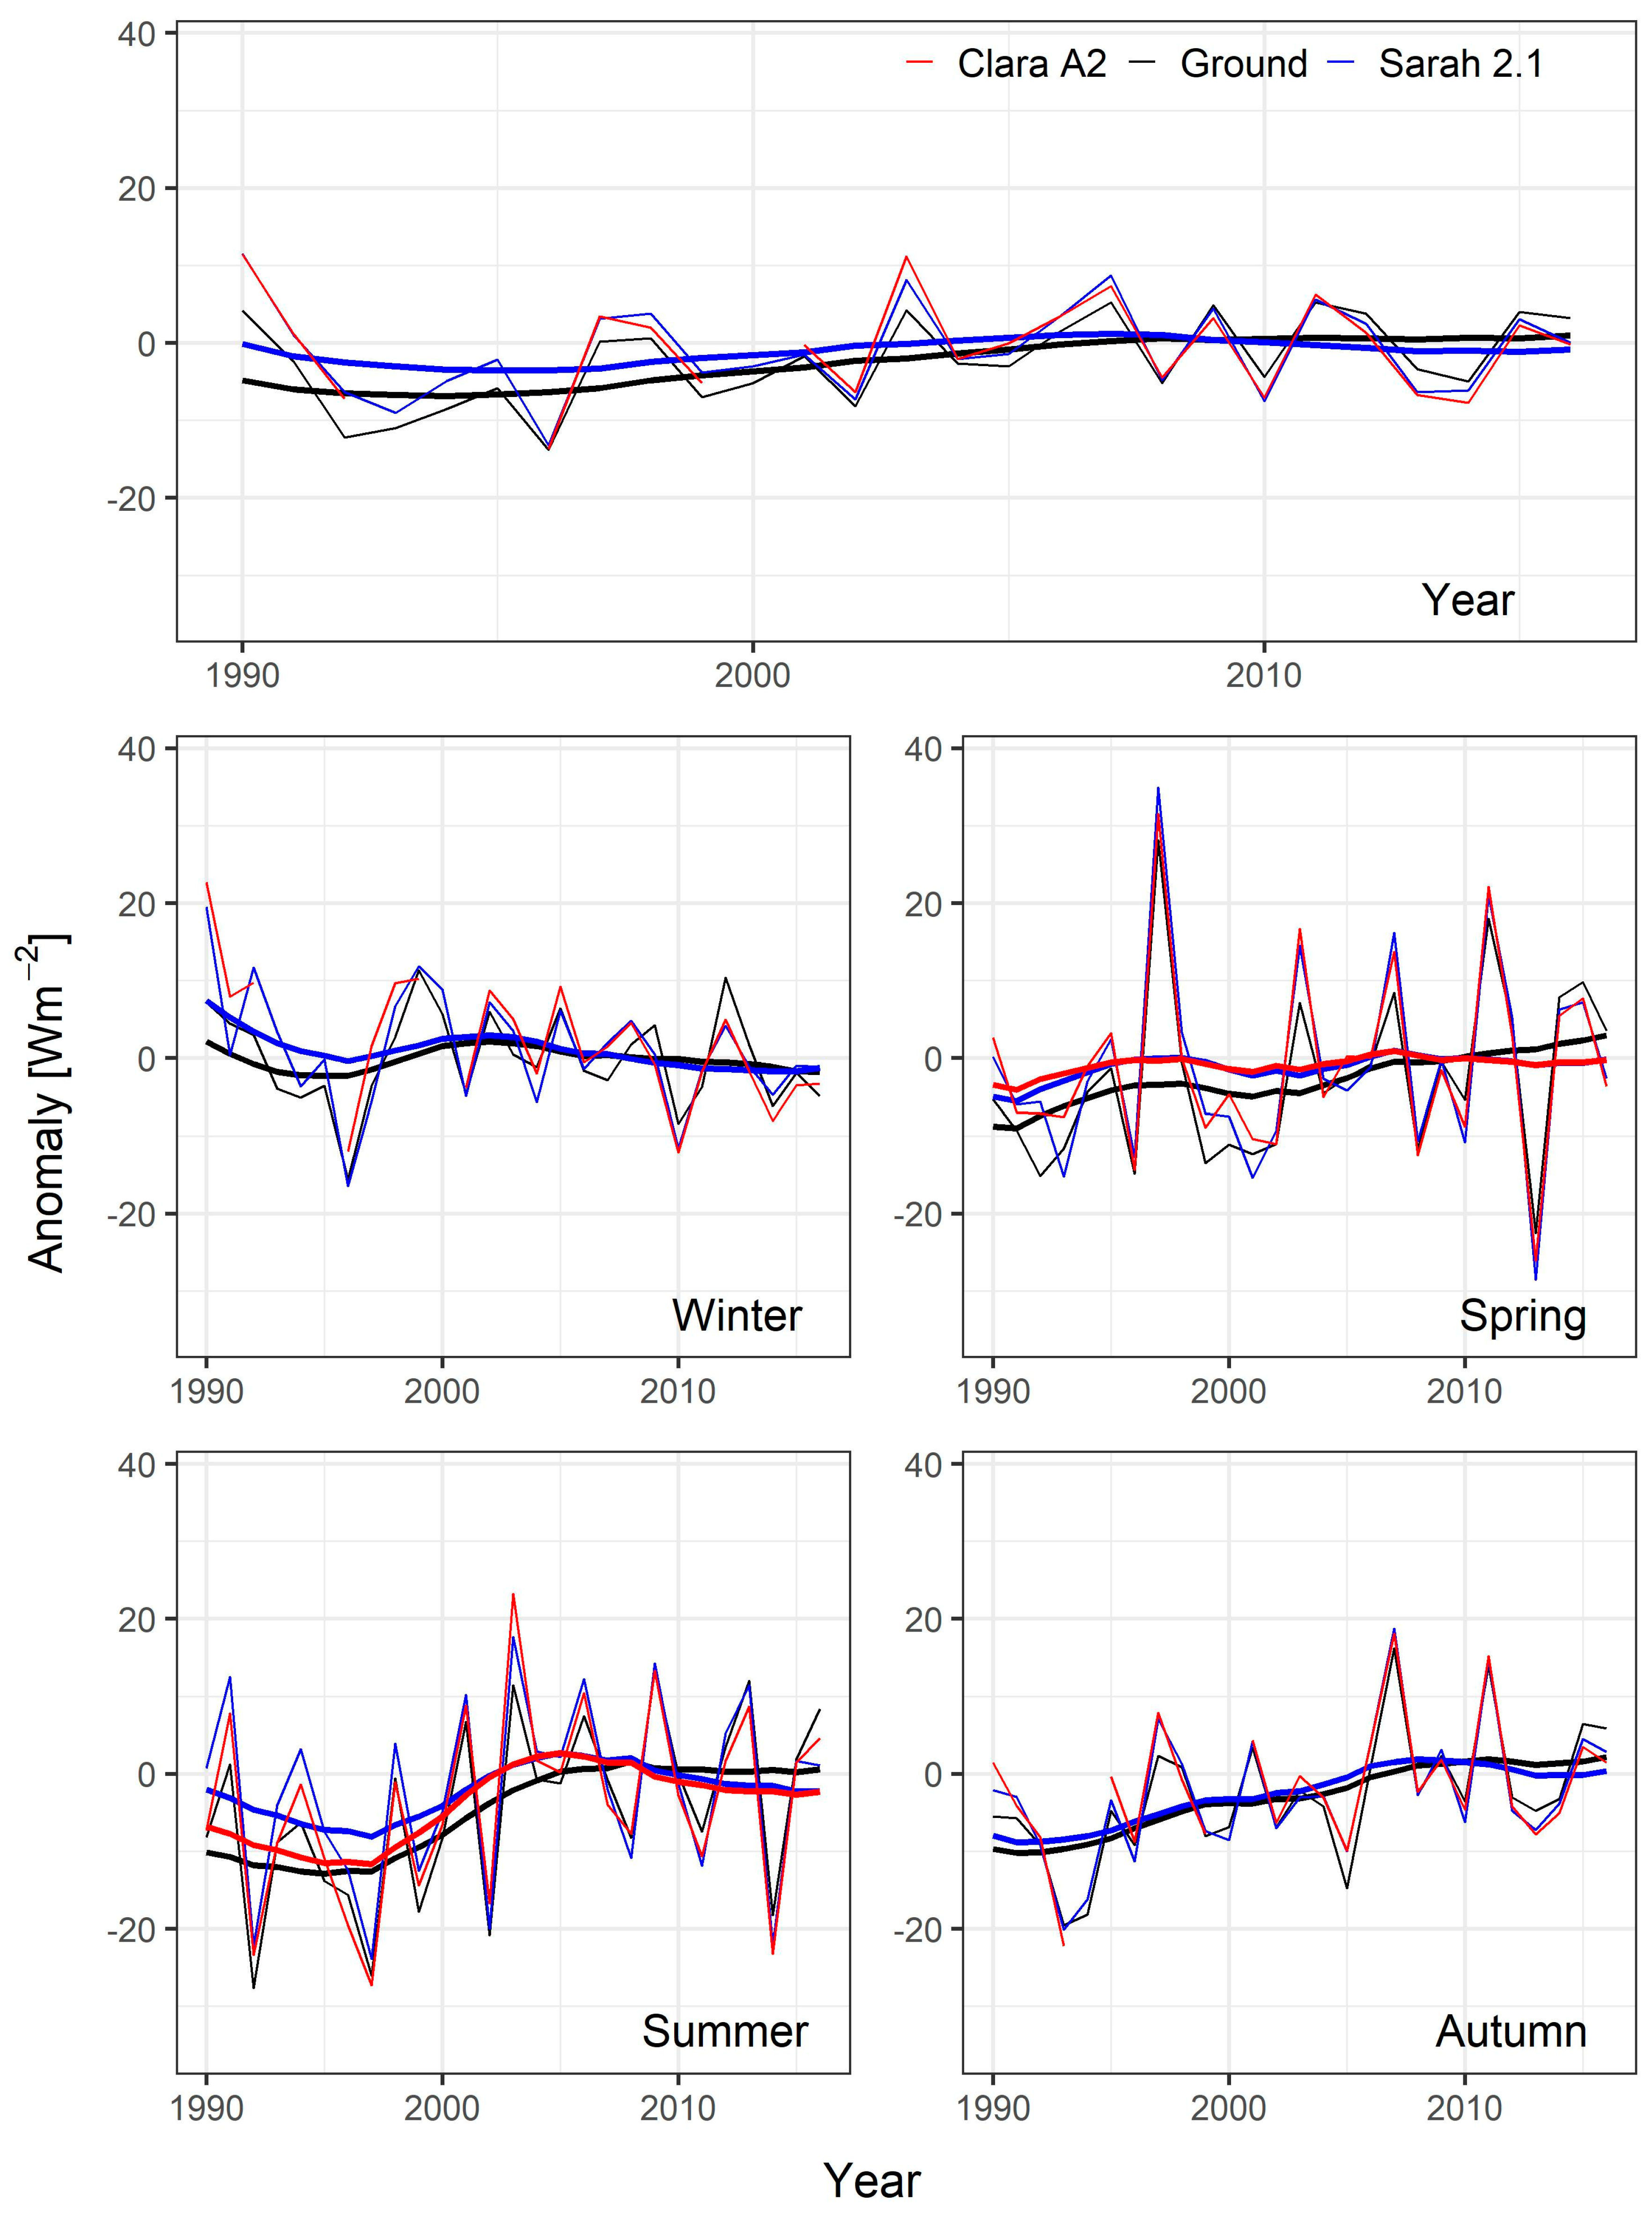
3.2.1. Low OCI Station Sites

Considering the station sites characterised by low OCI, both for daily and monthly resolution, the mean absolute differences between SARAH-2.1 and ground-based records, with values of 11.8 Wm−2 and 5.0 Wm−2 (considering all data), respectively, were very close to SARAH-2.1 mean absolute errors obtained by the comparison with the BSRN dataset [40]. At monthly resolution, CLARA-A2 records showed mean absolute differences from ground-based records (5.2 Wm−2 considering all months), comparable to those obtained between SARAH-2.1 and ground-based records, whereas at daily resolution the mean absolute differences were larger (15.2 Wm−2 considering all days), even though the daily mean difference obtained considering all days turned out to be lower than CLARA-A2 mean absolute errors obtained by the comparison with the BSRN dataset (18.6 Wm−2) [52]. Similarly, the common variances between monthly satellite and ground-based records (84% and 83% for SARAH-2.1 and CLARA-A2, respectively, considering all months—95% confidence interval (CI95) ranging from 80% to 87% for SARAH-2.1 and from 80% to 86% for CLARA-A2) were rather similar to those presented in SARAH-2.1 and CLARA-A2 validation reports. The difference between SARAH-2.1 and CLARA-A2 performances, when compared with ground-based records, was, however, lower than that reported by the comparison with the BSRN dataset. Moving from monthly to daily resolution, the common variances increased (92.1% (CI95: 91.7–92.4%) and 87.5% (CI95: 86.9–88.0%) for SARAH-2.1 and CLARA-A2 considering all days), giving evidence of an excellent performance of the daily satellite records, especially of SARAH-2.1, in capturing SSI variability measured by ground stations. On the contrary, moving from monthly to seasonal resolution, common variances decreased with seasonal records showing common variances equal to 79% (CI95: 71–85%) and 79% (CI95: 70–85%) when all seasons were considered for SARAH-2.1 and CLARA-A2, respectively. The common variances further reduced to 73% (CI95: 50–86%) and 69% (CI95: 39–86%) for SARAH-2.1 and CLARA-A2, respectively, when annual resolution was considered.
If the analysis was limited to the 18 low OCI station sites selected from the subset of 32 stations we identified in Section 2.4 (data not shown in Table 3), the agreement between satellite and ground-based records slightly increased and monthly (daily) mean absolute differences reduced to 4.9 Wm−2 (11.2 Wm−2) for SARAH-2.1 and to 5.1 Wm−2 (14.6 Wm−2) for CLARA-A2. In this case, common variances also slightly increased. The improvement in the agreement between satellite and ground-based records was, however, very low, highlighting that the full set of station sites seems to be adequate to study the coherence of SSI anomaly records, even if it is not completely appropriate to investigate the agreement between their average SSI values as discussed in Section 2.5.
Considering the annual cycle of the common variances between ground-based and satellite records and focusing both on daily and monthly resolution, a clear minimum was evident in winter, the season in which air pollution has a major role. Focusing on seasonal records, in winter there was also a rather low common variance between ground-based and satellite SSI anomalies, with values of 64% (CI95: 38–82%) and 60% (CI95: 28–82%), for SARAH-2.1 and CLARA-A2, respectively. Winter therefore turned out to be the most problematic season in terms of the agreement between ground-based and satellite SSI records.

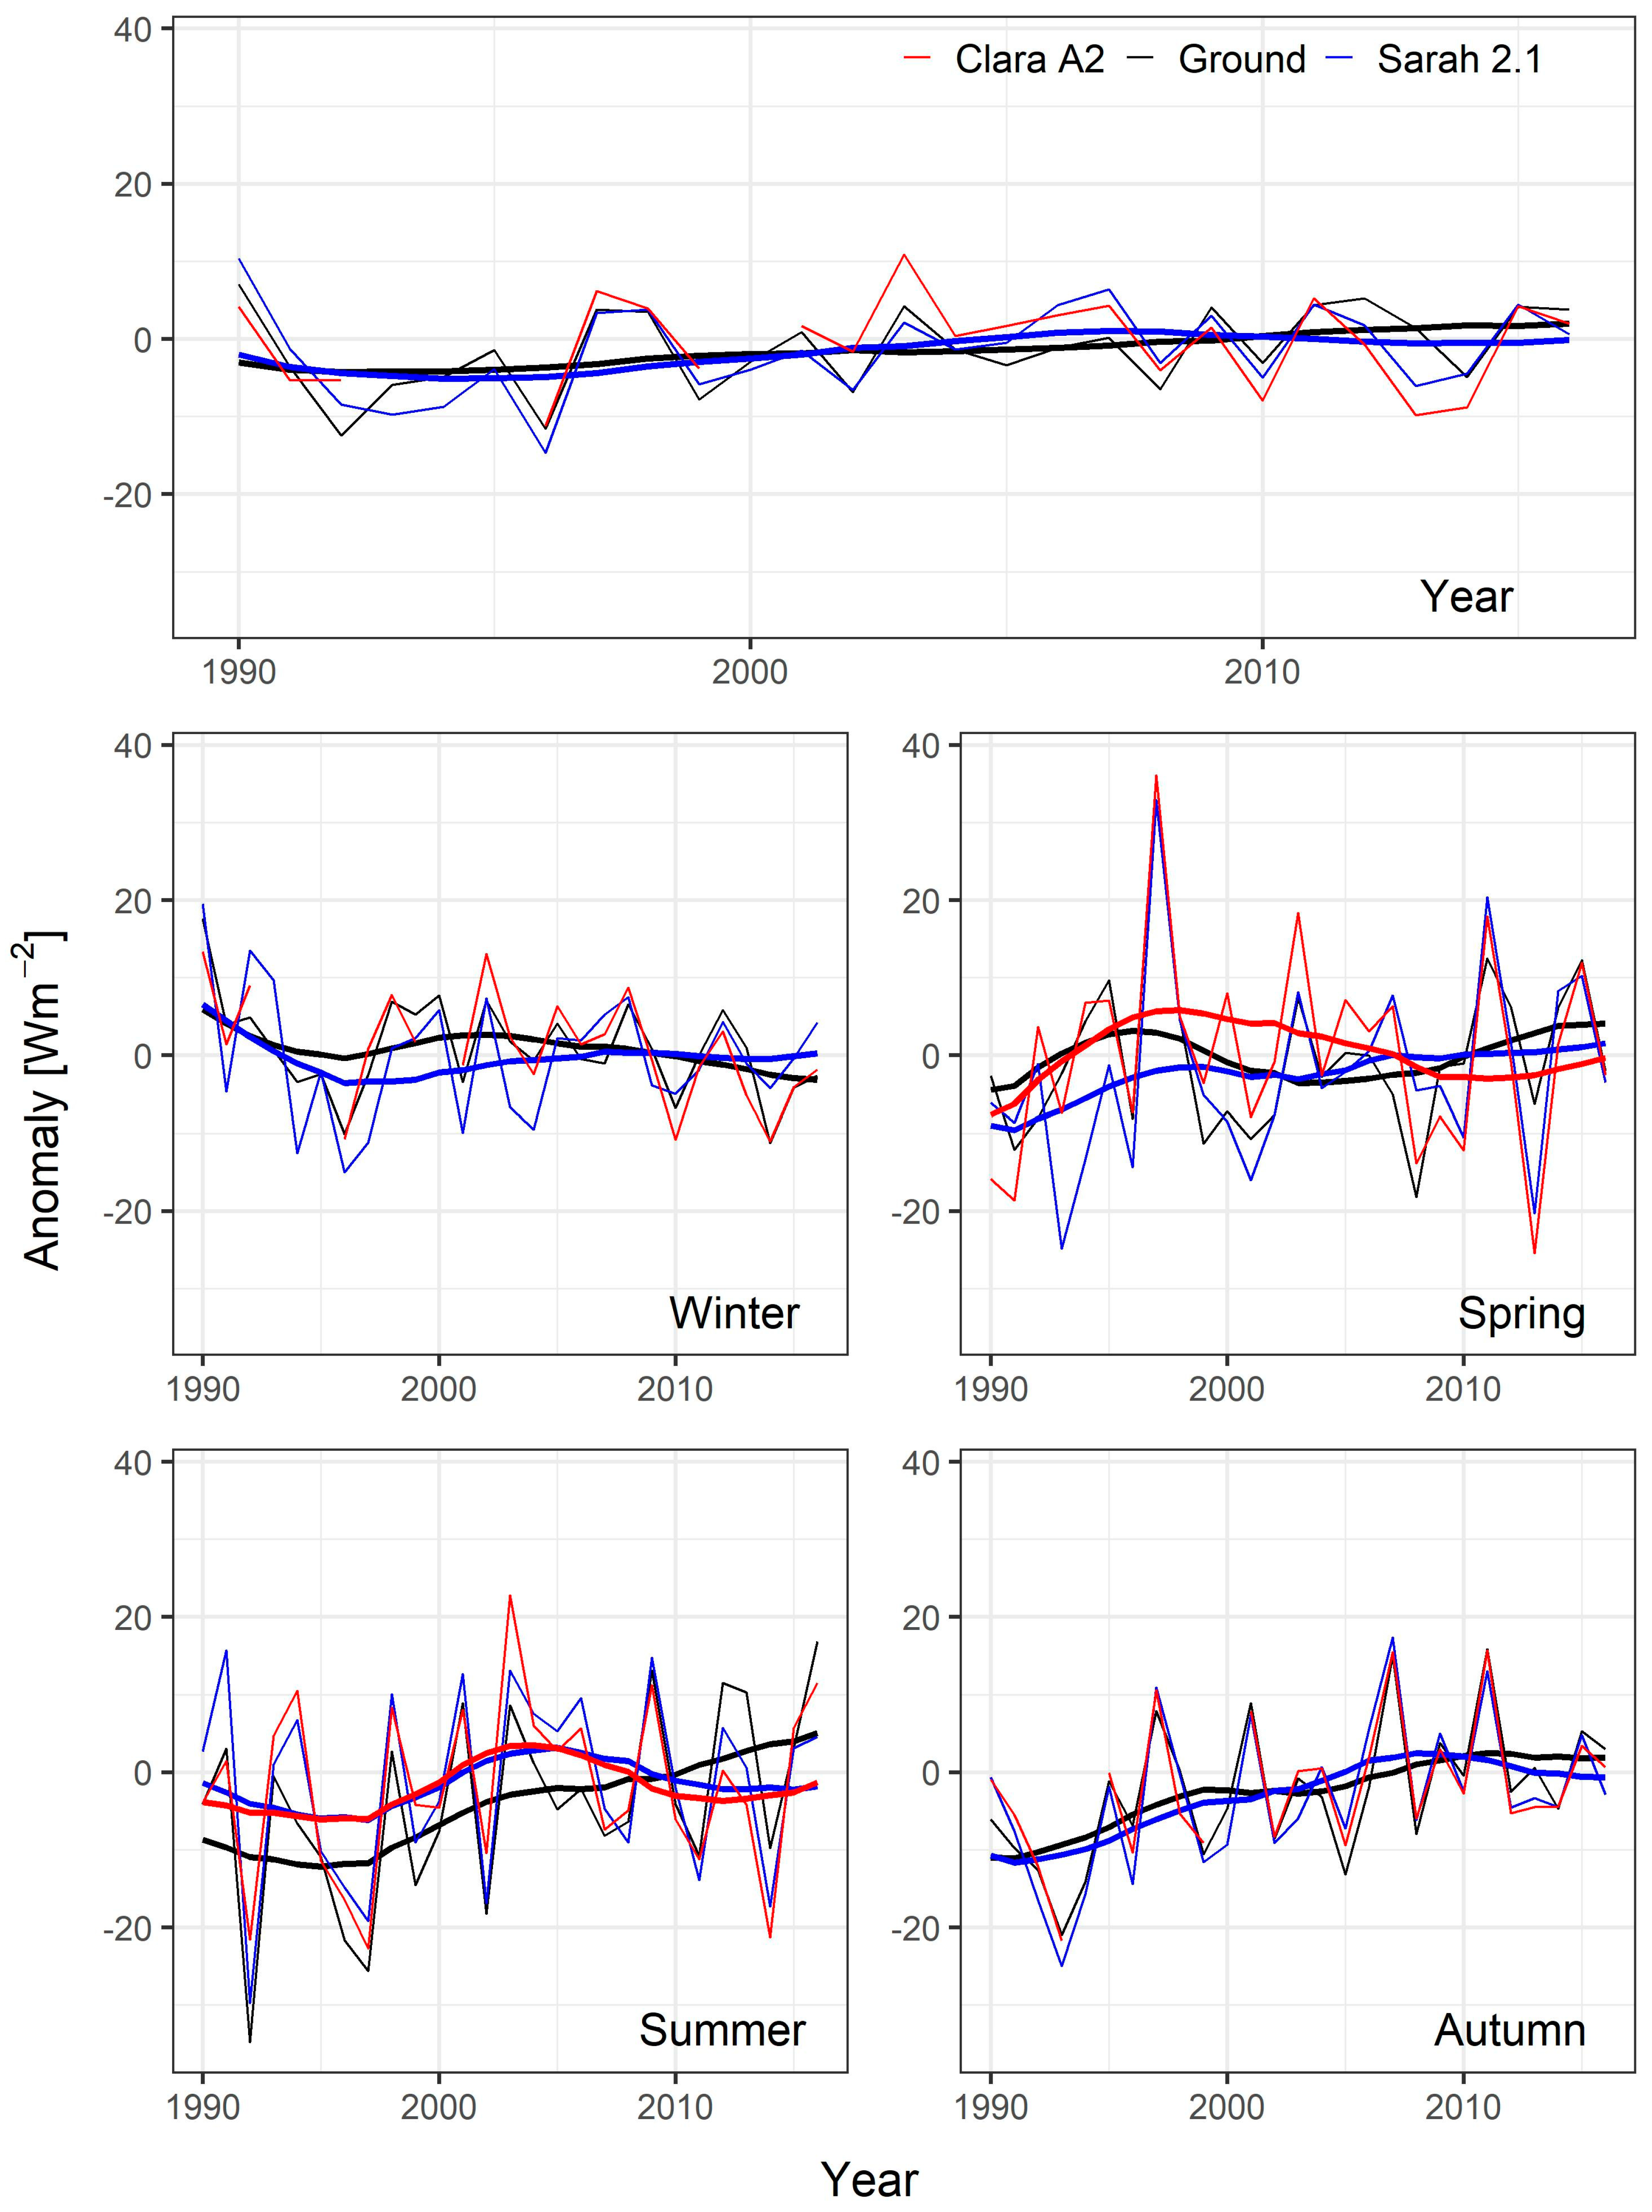
3.2.2. High OCI Station Sites

Considering the station sites characterised by high OCI, the common variance between satellite SSI anomalies and ground-based ones was much lower than that obtained for stations with low OCI, as expected due to the higher uncertainty both in satellite and ground-based records. In this case, the common variance between satellite and ground-based SSI anomalies was generally higher for CLARA-A2 than for SARAH-2.1. This behaviour was particularly evident in winter, where SARAH-2.1 and ground-based records exhibited common variances lower than 50% at all temporal resolutions. The better agreement of CLARA-A2 SSI anomaly records with corresponding ground-based records for high OCI station sites was also evident from lower mean absolute differences than those observed for SARAH-2.1.
As already observed for the station sites with low OCI, the common variances also became higher for those with high OCI when the temporal resolution of the data increased. Specifically, considering all data, the common variance was maximum for daily anomaly records (73% (CI95: 72–74%) and 76% (CI95% 75–77%) for SARAH-2.1 and CLARA-A2, respectively), and minimum (51% (CI95% 27–73%) and 44% (CI95: 18–71%) for SARAH-2.1 and CLARA-A2, respectively) for annual anomaly records.
For high OCI station sites, the improvement in the agreement between satellite and ground-based records obtained when the analysis was limited to the sites we identified in Section 2.5 was higher than for low OCI station sites (data not shown in Table 3), especially in winter.

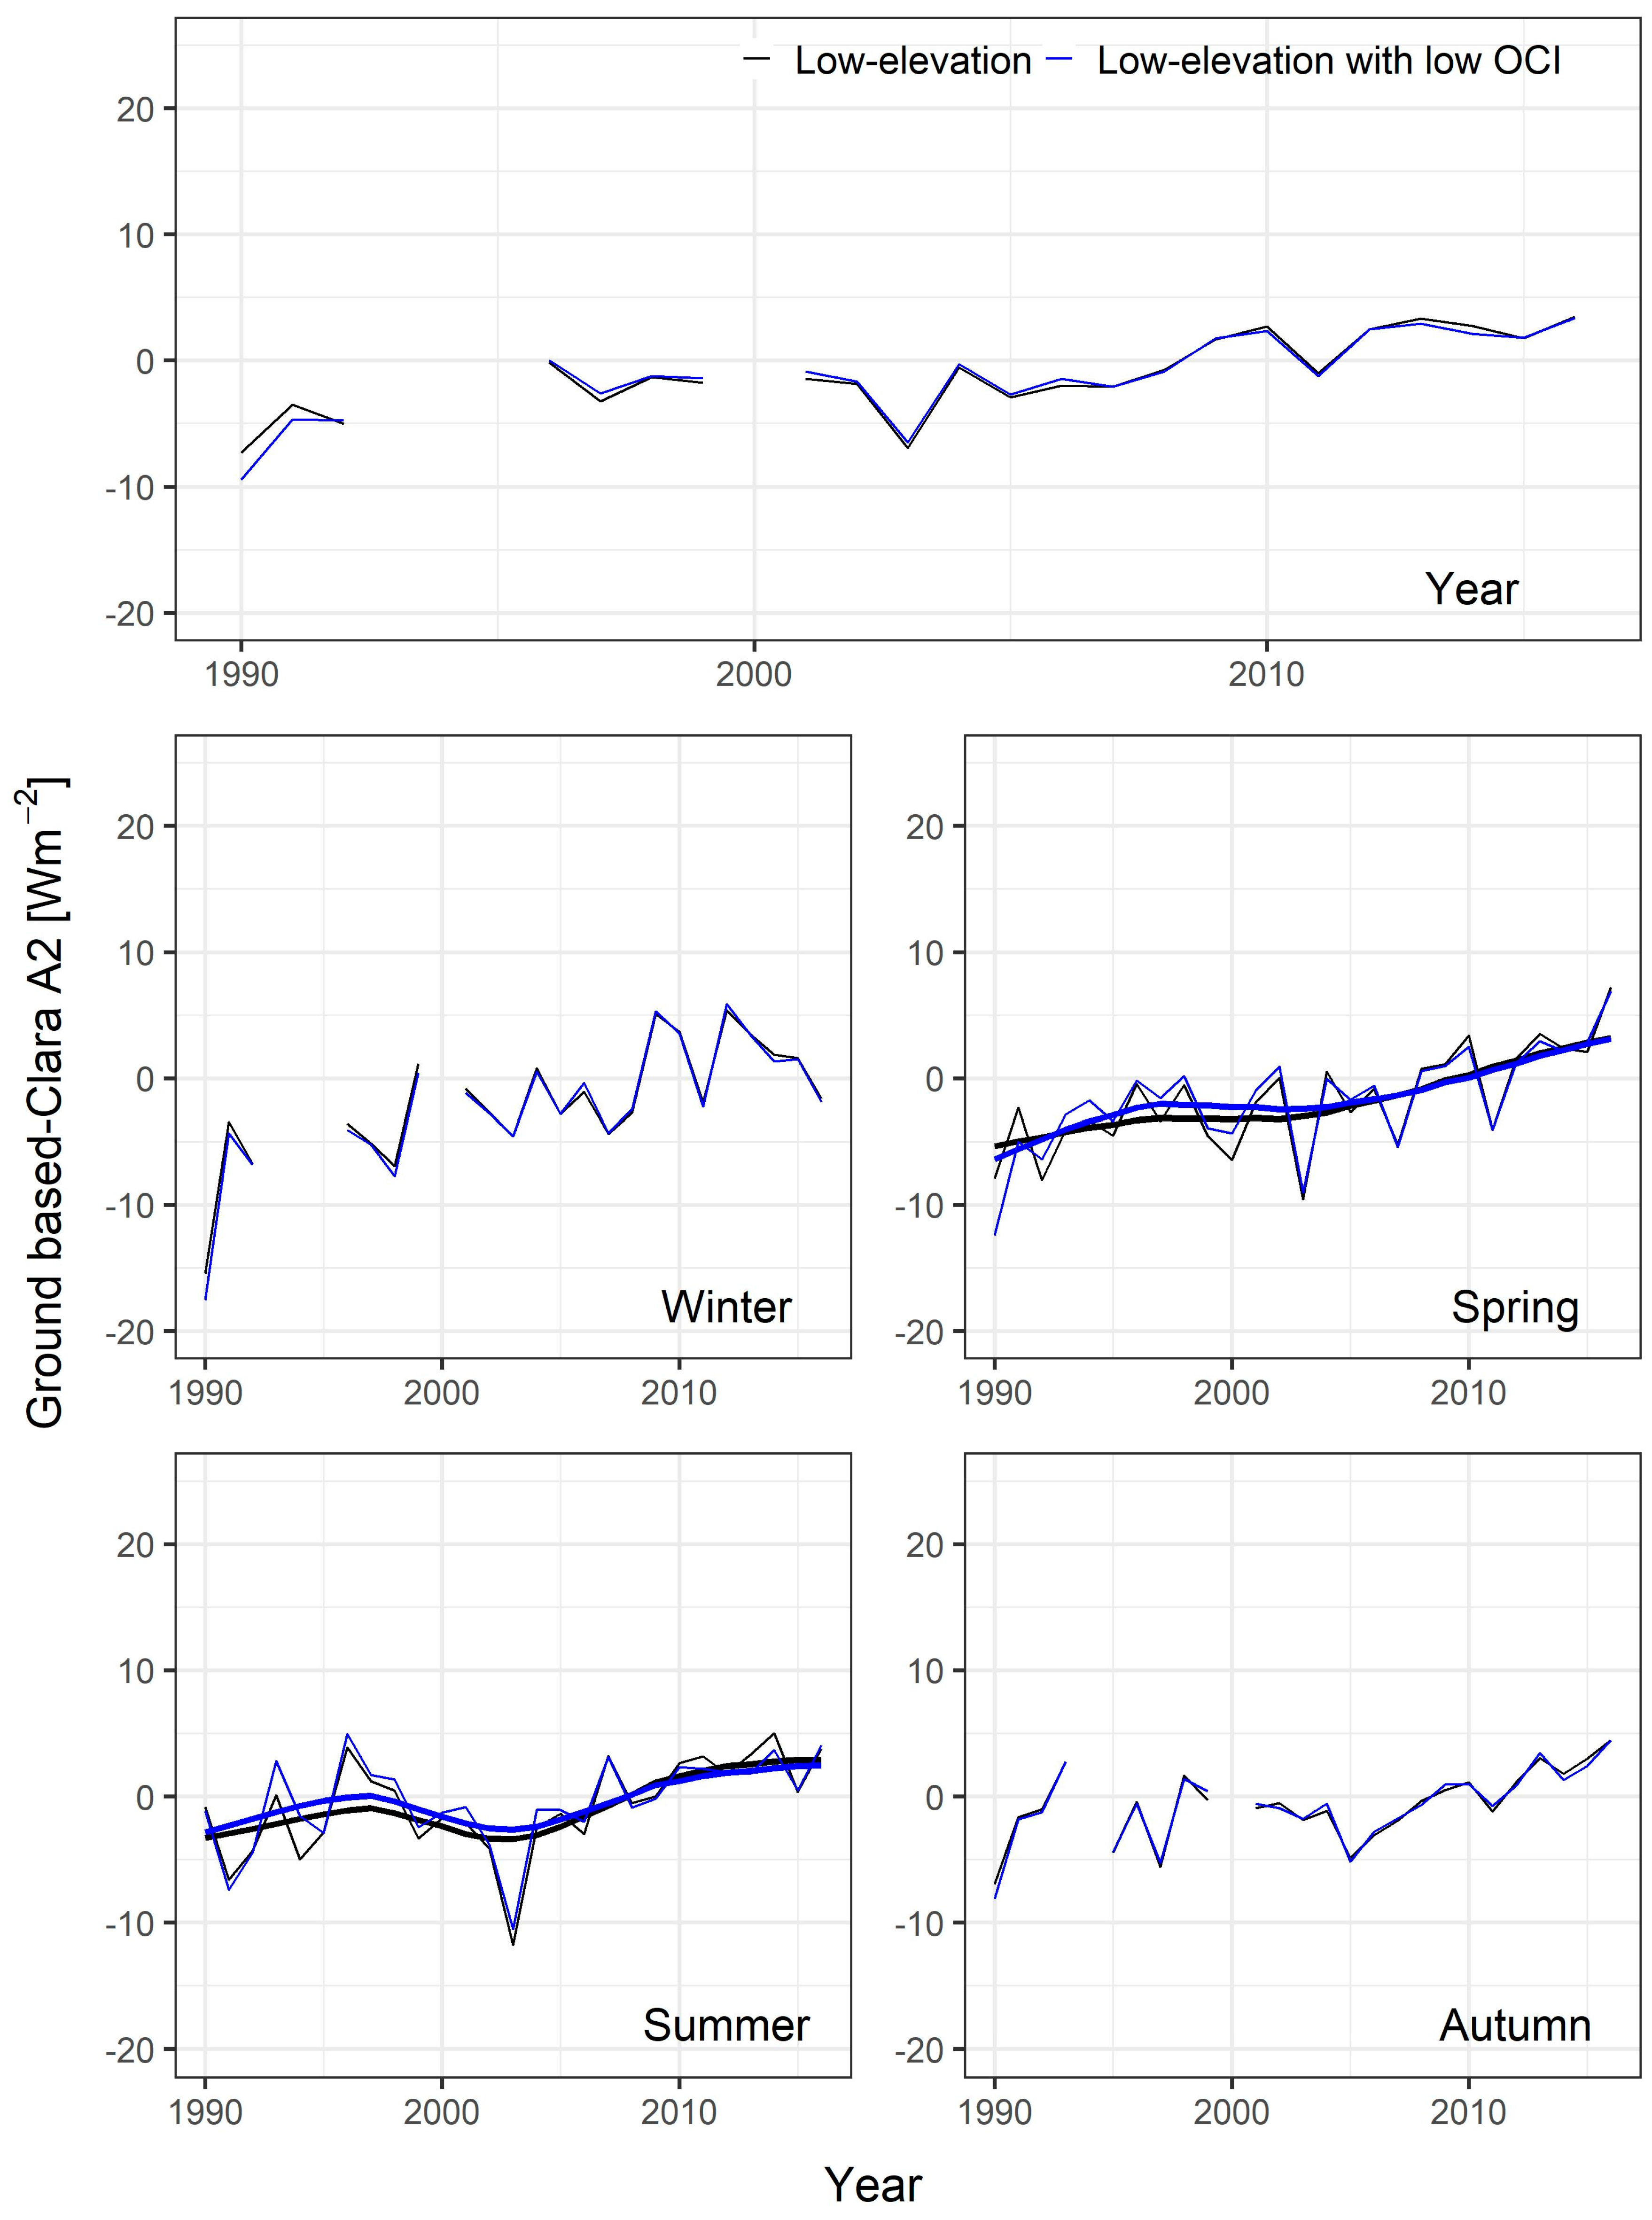
3.3. Trends of SSI Records from Different Data Sources

At low-elevation station sites, the average SSI record from ground-based observations showed a clear positive trend in the period 1990–2016 (Figure 5 and Table 4). This trend was evident (p-value ≤ 0.05) in spring (5.7 Wm2decade−1), summer (6.4 Wm2decade−1) and autumn (4.1 Wm2decade−1), as well as when considering monthly and yearly data (4.0 Wm2decade−1 and 3.8 Wm2decade−1, respectively), whereas in winter, the sign of the trend was negative, but the trend was not significant. Conversely, the average SSI records from satellite observations (both SARAH-2.1 and CLARA-A2—Figure 5 and Table 4) did not highlight significant positive trends (p-value ≤ 0.05). Considering a lower threshold for trend significance (p-value ≤ 0.1), there was evidence of a positive trend only for the average autumn low-elevation SARAH-2.1 record (3.4 Wm−2decade−1), whereas for the seasonal CLARA-A2 records there was no evidence of significant positive trends, with a significant negative trend in winter (−5.5 Wm−2decade−1).
These results generally did not change when the average SSI records were calculated focusing only on the 29 station sites that, besides being at low-elevation, also had a low OCI (Table 4). The only relevant difference concerned the positive trend of the summer CLARA-A2 record that became significant (p-value ≤ 0.05). Moreover, in this case the trend of the SARAH-2.1 monthly record became positive when a p-value ≤ 0.1 was considered as the significance threshold.
The average SSI record from ground-based observations generally had a positive trend also focusing on high-elevation station sites (Figure 6 and Table 4), even though the trend was significant only in summer (6.3 Wm2decade−1) and autumn (5.0 Wm2decade−1) and the increase observed for the annual record (3.1 Wm2decade−1) was lower than at low-elevation station sites. For high-elevation station sites, in autumn there was also a positive trend for the average satellite records (both SARAH-2.1 and CLARA-A2) and the SARAH-2.1 record also had a positive trend in spring (p-value ≤ 0.1). As for low-elevation sites, the CLARA-A2 record gave evidence of a significant negative trend in winter (−4.5 Wm2decade−1).
The different behaviour of ground-based and satellite low-elevation SSI anomaly records is highlighted even more clearly by focusing on the differences between them (Figure 7, Figure 8, Figure 9 and Figure 10 and Table 5).
For low-elevation station sites (Figure 7 and Figure 8), the records of these differences gave evidence of a clear increase in all seasons as well as for the monthly and yearly data. Specifically, the trend of the differences between ground-based and CLARA-A2 anomalies exhibited a p-value ≤ 0.01 in all cases, whereas when the differences between ground-based and SARAH-2.1 anomalies were considered, trend significance was lower in autumn and the trend was not significant in winter. Interestingly, in this case, focusing only on the 29 station sites that, besides being at low-elevation, also have a low OCI, gave slightly more significant trends for the SARAH-2.1 average records, with an autumn p-value ≤ 0.01 and winter p-value very close to the 0.05 threshold. Considering the differences between the ground-based and the satellite yearly anomaly records, the trend was slightly lower than 3 Wm2decade−1 for SARAH-2.1 and slightly higher than 3 Wm2decade−1 for CLARA-A2. These slopes caused a variation of the differences between ground-based and satellite SSI of about 7 Wm−2 for SARAH-2.1 and about 8 Wm−2 for CLARA-A2, that correspond to about 5% of the yearly average SSI over the investigated area.
Focusing on high-elevation station-sites (Figures not shown), the differences between the trends of ground-based and satellite average SSI anomaly records were generally lower than for low-elevation station-sites (Table 5). In this case, the season with the strongest differences in the trends was summer. In this season, the trends of the differences between ground-based and satellite anomaly records exhibited p-values ≤ 0.01.

4. Discussion

The analysis of the differences between the different datasets showed that on one side, the comparison between the two satellite datasets (Section 3.1) over the period 2001–2016 gives evidence of higher yearly SSI averages for SARAH-2.1 than for CLARA-A2. This problem is less evident for station sites with low OCI (orographic complexity index—Section 2.2, Section 2.3 and Section 2.5) while it is more evident for those with high OCI. The latter station sites also give evidence of a much less coherent pattern both in terms of seasonality and in terms of spatial distribution. On the other hand, starting from a subset of ground-based observations considered un-biased in terms of normal values (Section 2.5), the comparison between satellite records and corresponding ground-based records showed that for the low OCI station sites, the satellite series have higher annual SSI averages than ground-based series. In contrast, for the high OCI station sites the same comparison showed a complex pattern, with most station sites having lower SSI values in the satellite records and a few others having lower values for ground-based observations. The most important factor decreasing SSI for satellite records seems to be snow coverage. Underestimation of satellite SSI is, in fact, particularly pronounced for the sites with highest elevation (e.g., for Capanna Margherita and Gran Vaudala stations the average lengths of ground snow coverage per year calculated using the nearest grid-point from MODIS satellite data are 365 and 311 days, respectively) and in winter and spring (in this season, for example, SSI averages over the five highest station sites are 159, 160 and 215 Wm−2 for SARAH-2.1, CLARA-A2 and ground stations, respectively) when surface albedo is maximum. On the contrary, the underestimation is less evident in autumn and summer when albedo decreases because snow coverage is lower. The effect of ground snow coverage on SARAH-2.1 and CLARA-A2 SSI is also evident (Figure 9) when satellite yearly average SSI (averages over the 2001–2016 period—Figure 4) is plotted versus the corresponding average length of snow coverage (see Section 2.4). The problem of snow coverage is that it is not always correctly distinguished from clouds, resulting in an enhanced cloud optical depth and subsequently in an underestimation of satellite SSI records, in particular under clear-sky conditions [28,53]. At the same time, high surface albedo from surrounding slopes can probably bias ground observations too because of reflected radiation increasing the measured values. The combination of these two effects therefore causes very high differences between SSI ground-based observations and corresponding satellite values for some station sites. Ground-based observations can however also have significantly lower SSI than satellite ones for other reasons, e.g., because of shading issues.
Despite potentially relevant problems, areas with complex orography ground-based observations show a more consistent behaviour than satellite ones. This is evident from the station-site average yearly (Figure 4) and seasonal (Figures not shown) values over the considered period. More evidence of this can be obtained by plotting the yearly cycles of the ratios between SSI averages over high-elevation station sites and low-elevation station sites with low OCI: we calculated these ratios for the three datasets over the 2001–2016 period focusing on the sites corresponding to the subset of 32 stations considered un-biased in terms of normal values (Figure 10). For ground-based observations, as expected, these ratios showed higher values in winter when SSI at low-elevation is often reduced by low atmospheric transparency in the boundary layer, whereas in summer low- and high-elevation values are much more similar as expected, because high-elevation sites, beside higher clear-sky radiation, also have higher cloudiness due to frequent convective clouds. On the contrary, for SARAH-2.1 data these ratios show a rather different yearly cycle with respect to ground-based observations with up to 25% lower winter SSI values for high-elevation sites with respect to low-elevation ones. For CLARA-A2 data, some differences are evident too with a less pronounced yearly cycle than for ground-based observations and with a minimum falling in spring.
It will be interesting in the future, when the data become available, to compare the Piedmont ground-based series with SARAH-3 data records, the new version of SARAH-dataset that will also include a scheme to better identify and consider snow coverage.
In addition, the spatial representativity of the station measurements also needs to be considered when comparing local measurements with gridded datasets, which always represent a larger area (25 km2 and 625 km2 in the case of SARAH-2.1 and CLARA-A2, respectively) especially when areas with complex orography are considered [54]. However, the spatial resolution of the considered grid should be considered together with the temporal resolution of the data. In fact, for temporal resolution higher than the day, if the spatial resolution is of a few kilometres (e.g., 5 × 5 km) the representativeness error can be considered smaller. Differently, the representativeness error cannot be neglected when lower temporal or spatial scales are considered, even if the site is located at the centre of the grid [55].
Beside snow coverage, shading might also be a relevant factor explaining the differences in SSI values recorded by ground stations and corresponding satellite values, even though the effect seems to be rather limited for the 32 station sites (Section 2.5) for which we considered the SSI records as unbiased. This is evident for station site Borgofranco d’Ivrea, which has almost the same SSI when winter ground-based and SARAH-2.1 data are compared, whereas in summer SSI from SARAH-2.1 data is more than 20 Wm−2 higher. This station is in fact located in a valley surrounded by mountains both on the eastern and western sides, reducing the hours of sunshine during the day. Shading is indeed very difficult to eliminate in areas with complex orography and station sites which have good exposure may suffer from it at least in parts of the year. We have indeed checked the effect of shading from surrounding orography (see Section 2.5), however the effect of surrounding mountains can go beyond the shading they cause directly and may include shadings due to clouds that in Piedmont are more frequent over mountains than over surrounding plain areas.
The comparison of the ground-based and satellite anomaly records (Section 3.2) showed that for the low OCI stations the common variances between monthly satellite and ground-based records are about 84% and 83% for SARAH-2.1 and CLARA-A2, respectively. Moving from monthly to daily resolution, the common variances increase to 92.1% and 87.5% for SARAH-2.1 and CLARA-A2, respectively, giving evidence of an excellent performance of the daily satellite records in capturing SSI variability measured by ground-based stations. The better performance of the daily records with respect to the monthly ones could be due to the fact that the variability of daily anomalies is mainly due to meteorological factors, where the role of cloudiness is predominant and thus well captured by satellites, while the variability of monthly (and seasonal and yearly) records depends on other factors (e.g., aerosol concentrations) that are less accurately considered within the procedure used to retrieve SSI satellite data. However, the better performance of the daily records in terms of common variances depends also on the higher variability of the daily records with respect to the monthly, seasonal, and annual ones.
Considering the station sites characterised by high OCI, the common variance between satellite SSI anomalies and ground-based ones turned out to be much lower, as expected, due to the higher uncertainty both in satellite and ground-based records. Interestingly, the common variance between satellite SSI anomalies and ground-based ones turned out to be generally higher for CLARA-A2 than for SARAH-2.1 especially during winter.
Finally, trend analysis (Section 3.3) showed that the average SSI records from ground-based observations, at low-elevation station sites, gives evidence of a clear positive trend in the 1990–2016 period, whereas the average SSI records from satellite observations (both SARAH-2.1 and CLARA-A2) do not highlight significant positive trends. The average SSI record from ground-based observations generally has a positive trend also focusing on high-elevation station sites, even though the trend is significant only in summer and autumn and the increase observed for the annual record is lower than at low-elevation station sites. For high-elevation station sites, the differences in the trends of ground-based and satellite observations are less evident than for low-elevation station sites.
The different behaviour of ground-based and satellite observations supports the hypothesis of Manara et al. [32] on the relevant role of atmospheric aerosols on SSI trends over the investigated area. Satellite records are in fact derived by an approach that considers constant aerosol levels (see Section 2.2 and Section 2.3) and therefore they do not take into account the significant reduction in aerosols in the period 1990–2016 [32]. A detailed quantification of this reduction by means of ground-based measures is not easy, because aerosol concentration data are available only for the last two decades. Moreover, the spatial coverage of aerosol measurements is highly inhomogeneous and very limited in high-elevation areas. Thus, we consider atmospheric optical depth (AOD) data in this discussion. Specifically, we consider all MERRA-2 grid cells (see Section 2.4) falling over the area considered in this study and we focus on the trend of the record obtained calculating the average yearly AODs for low- and high-elevation grid cells and considering the difference between these AODs. This record gives evidence of a significant negative trend (−0.006 ± 0.002 per decade—p-value ≤ 0.05) in the period 1990–2016 highlighting that the effect of the reduction in air pollutant emissions, which occurred over this period in Italy, affected atmospheric transparency more strongly at low- than at high-elevations. This effect is extensively discussed for the entire Italian territory by Manara et al. [34] in a study focusing on atmospheric visibility records.
It is therefore not surprising that satellite records do not give evidence of the same brightening signal of ground-based observations. Interestingly, the differences in the trends of SSI records from ground-based and satellite observations are more evident at low-elevation, whereas high elevation sites show a similar behaviour to low-elevation sites only in summer: in this season the boundary layer is highest and air pollution concerns a much deeper layer than in the other seasons [56,57,58].
The results obtained in this study are in agreement with those reported in literature even if they are not always easy to compare considering the different observed area, the different period covered, and sometimes the different version of satellite datasets. Specifically, Pfeifroth et al. [28] reported higher average values (bias equal to 2.7 Wm−2) for SARAH-2 than for ground-based stations as in this study, although they report lower average values for CLARA-A2 (bias equal to −0.4 Wm−2). However, it should be considered that they were calculated over the 1983–2015 period and for all of Europe. The reported trends are in agreement with stronger positive values for station data than for satellite data (both for SARAH-2.1 and CLARA-A2) in the southern part of Europe, especially during summer. Focusing only on Spain, Montero-Martin et al. [30] reported lower common variances (69% and 64% for SARAH-2.1 and CLARA-A2, respectively) than those reported in this study, even though it was always higher than 50% for both satellites, while for SSI trends they again reported lower positive trends for satellite data than for ground-based data especially in summer. Similar results are also reported by Alexandri et al. [59] for Greece, where they found an overestimation of about 7.1 Wm-2 for SARAH with respect to ground-based series.

5. Conclusions

The analyses presented in this paper aimed at comparing SSI CM SAF SARAH-2.1 and CLARA-A2 products with a dataset published detailing surface solar radiation from ground-based stations over the Piedmont region (north-western part of Italy) for the period 1990–2016 [32]. The goal was to provide a new contribution to the discussion on the representativeness of these satellite data, also including a focus on high elevation areas where satellite data are a key resource because the availability of station data is generally rather low.
The analyses focused onto: (i) the comparison of the average surface solar irradiance of the records from the different data sources; (ii) the comparison of the corresponding anomaly records that was evaluated both in terms of common variances and mean absolute differences; and (iii) the comparison of the trends of the records from the different data sources.
In spite of some open issues, CM-SAF SARAH-2.1 and CLARA-A2 surface solar irradiance products turned out to give evidence of an excellent ability in capturing SSI signals shown by ground-based stations. The three main results highlighted by the comparison between ground-based and satellite records turned out to be: (i) a tendency of satellite data—especially of SARAH-2.1—to be higher than corresponding ground-based observations for low-elevation areas; (ii) a tendency of satellite data to be lower than corresponding ground-based observations for high-elevation areas mainly because of snow coverage not always correctly distinguished from clouds; and iii) the inability of satellite observations to correctly capture the brightening signal highlighted by ground-based observations. This last result, already reported by several papers focusing on other southern areas of Europe, is probably caused by relevant changes in atmospheric aerosol levels that SARAH-2.1 and CLARA-A2 surface solar irradiance records are not able to capture because they are based on constant aerosol climatologies. Other factors, also related to station data issues, cannot, however, completely be ruled out in explaining the different trends of ground-based and satellite observations. Problems in station data, especially in areas with complex orography, can naturally also not be ruled out in explaining the other differences between ground-based and satellite records highlighted by our analyses. The analyses presented in this study have in fact highlighted that the comparison of surface solar irradiance records from different data sources is a complex issue that has to be performed, critically evaluating the strengths and the weaknesses of each of them in relation to the objectives of the analysis. For example, a study has shown that short- and long-wave satellite data can be successfully used on a glacier surface to estimate summer glacier melting if they are not available from on-glacier surface measurements [60], even if satellite data at high-elevations present some limitations.

Author Contributions

Conceptualization, V.M. and M.M.; data curation, V.M. and M.M.; formal analysis, V.M. and M.M.; investigation, V.M., E.S. and M.M.; methodology, V.M. and M.M.; writing—original draft, V.M., E.S., M.B., G.A.D., D.F., U.P., A.S., J.T. and M.M.; writing—review and editing, V.M., E.S., M.B., G.A.D., D.F., U.P., A.S., J.T. and M.M. All authors have read and agreed to the published version of the manuscript.

Funding

This work has been supported by Ager—Agroalimentare E Ricerca (Grant 2017-1176) within the project—IPCC-MOUPA (Interdisciplinary project for assessing current and expected Climate Change impacts on MOUntain PAstures).

Conflicts of Interest

The authors declare no conflict of interest.

References

  1. Iqbal:, M. An Introduction to Solar Radiation; Academic Press: Cambridge, MA, USA, 1983; ISBN 9780323151818. [Google Scholar]
  2. Hartmann, D.L.; Ramanathan, V.; Berroir, A.; Hunt, G.E. Earth Radiation Budget Data and Climate Research. Rev. Geophys. 1986, 24, 439–468. [Google Scholar] [CrossRef]
  3. Wild, M.; Folini, D.; Schär, C.; Loeb, N.; Dutton, E.G.; König-Langlo, G. The global energy balance from a surface perspective. Clim. Dyn. 2013, 40, 3107–3134. [Google Scholar] [CrossRef] [Green Version]
  4. Stanhill, G.; Cohen, S. Global dimming: A review of the evidence for a widespread and significant reduction in global radiation with discussion of its probable causes and possible agricultural consequences. Agric. For. Meteorol. 2001, 107, 255–278. [Google Scholar] [CrossRef]
  5. Vyssoki, B.; Kapusta, N.D.; Praschak-Rieder, N.; Dorffner, G.; Willeit, M. Direct effect of sunshine on suicide. JAMA Psychiatry 2014, 71, 1231–1237. [Google Scholar] [CrossRef] [PubMed] [Green Version]
  6. Wild, M.; Ohmura, A.; Gilgen, H.; Rosenfeld, D. On the consistency of trends in radiation and temperature records and implications for the global hydrological cycle. Geophys. Res. Lett. 2004, 31. [Google Scholar] [CrossRef]
  7. Wild, M.; Folini, D.; Henschel, F.; Fischer, N.; Müller, B. Projections of long-term changes in solar radiation based on CMIP5 climate models and their influence on energy yields of photovoltaic systems. Sol. Energy 2015, 116, 12–24. [Google Scholar] [CrossRef] [Green Version]
  8. Mercado, L.M.; Bellouin, N.; Sitch, S.; Boucher, O.; Huntingford, C.; Wild, M.; Cox, P.M. Impact of changes in diffuse radiation on the global land carbon sink. Nature 2009, 458, 1014–1017. [Google Scholar] [CrossRef] [Green Version]
  9. Oerlemans, J. A 1 year record of global radiation and albedo in the ablation zone of Morteratschgletscher, Switzerland. J. Glaciol. 1998, 44, 231–238. [Google Scholar] [CrossRef] [Green Version]
  10. Wild, M. Global dimming and brightening: A review. J. Geophys. Res. 2009, 114, D00D16. [Google Scholar] [CrossRef] [Green Version]
  11. Wild, M. Decadal changes in radiative fluxes at land and ocean surfaces and their relevance for global warming. Wiley Interdiscip. Rev. Clim. Chang. 2016, 7, 91–107. [Google Scholar] [CrossRef]
  12. Liang, F.; Xia, X.A. Long-term trends in solar radiation and the associated climatic factors over China for 1961-2000. Ann. Geophys. 2005, 23, 2425–2432. [Google Scholar] [CrossRef] [Green Version]
  13. Long, C.N.; Dutton, E.G.; Augustine, J.A.; Wiscombe, W.; Wild, M.; McFarlane, S.A.; Flynn, C.J. Significant decadal brightening of downwelling shortwave in the continental United States. J. Geophys. Res. 2009, 114, D00D06. [Google Scholar] [CrossRef]
  14. Manara, V.; Beltrano, M.C.; Brunetti, M.; Maugeri, M.; Sanchez-Lorenzo, A.; Simolo, C.; Sorrenti, S. Sunshine duration variability and trends in Italy from homogenized instrumental time series (1936–2013). J. Geophys. Res. Atmos. 2015, 120, 3622–3641. [Google Scholar] [CrossRef]
  15. Manara, V.; Brunetti, M.; Celozzi, A.; Maugeri, M.; Sanchez-Lorenzo, A.; Wild, M. Detection of dimming/brightening in Italy from homogenized all-sky and clear-sky surface solar radiation records and underlying causes (1959–2013). Atmos. Chem. Phys. 2016, 16, 11145–11161. [Google Scholar] [CrossRef] [Green Version]
  16. Sanchez-Lorenzo, A.; Wild, M.; Brunetti, M.; Guijarro, J.A.; Hakuba, M.Z.; Calbó, J.; Mystakidis, S.; Bartok, B. Reassessment and update of long-term trends in downward surface shortwave radiation over Europe (1939–2012). J. Geophys. Res. Atmos. 2015, 120, 9555–9569. [Google Scholar] [CrossRef] [Green Version]
  17. Wang, Y.; Wild, M. A new look at solar dimming and brightening in China. Geophys. Res. Lett. 2016, 43, 11777–11785. [Google Scholar] [CrossRef]
  18. Wang, K.C.; Dickinson, R.E.; Wild, M.; Liang, S. Atmospheric impacts on climatic variability of surface incident solar radiation. Atmos. Chem. Phys. 2012, 12, 9581–9592. [Google Scholar] [CrossRef] [Green Version]
  19. Soni, V.K.; Pandithurai, G.; Pai, D.S. Evaluation of long-term changes of solar radiation in India. Int. J. Climatol. 2012, 32, 540–551. [Google Scholar] [CrossRef]
  20. Driemel, A.; Augustine, J.; Behrens, K.; Colle, S.; Cox, C.; Cuevas-Agulló, E.; Denn, F.M.; Duprat, T.; Fukuda, M.; Grobe, H.; et al. Baseline Surface Radiation Network (BSRN): Structure and data description (1992–2017). Earth Syst. Sci. Data 2018, 10, 1491–1501. [Google Scholar] [CrossRef] [Green Version]
  21. Wild, M.; Ohmura, A.; Schär, C.; Müller, G.; Folini, D.; Schwarz, M.; Zyta Hakuba, M.; Sanchez-Lorenzo, A. The Global Energy Balance Archive (GEBA) version 2017: A database for worldwide measured surface energy fluxes. Earth Syst. Sci. Data 2017, 9, 601–613. [Google Scholar] [CrossRef] [Green Version]
  22. Storelvmo, T.; Heede, U.K.; Leirvik, T.; Phillips, P.C.B.; Arndt, P.; Wild, M. Lethargic Response to Aerosol Emissions in Current Climate Models. Geophys. Res. Lett. 2018, 45, 9814–9823. [Google Scholar] [CrossRef]
  23. Huang, G.; Li, Z.; Li, X.; Liang, S.; Yang, K.; Wang, D.; Zhang, Y. Estimating surface solar irradiance from satellites: Past, present, and future perspectives. Remote Sens. Environ. 2019, 233, 111371. [Google Scholar] [CrossRef]
  24. Pfeifroth, U.; Kothe, S.; Trentmann, J.; Hollmann, R.; Fuchs, P.; Kaiser, J.; Werscheck, M. Surface Radiation Data Set—Heliosat (SARAH)—Edition 2.1, Satellite Application Facility on Climate Monitoring. CM-SAF 2019. [Google Scholar] [CrossRef]
  25. Pfeifroth, U.; Kothe, S.; Müller, R.; Trentmann, J.; Hollmann, R.; Fuchs, P.; Werscheck, M. Surface Radiation Data Set—Heliosat (SARAH)—Edition 2, Satellite Application Facility on Climate Monitoring. CM-SAF 2017. [Google Scholar] [CrossRef]
  26. Karlsson, K.G.; Anttila, K.; Trentmann, J.; Stengel, M.; Meirink, J.F.; Devasthale, A.; Hanschmann, T.; Kothe, S.; Jääskeläinen, E.; Sedlar, J.; et al. CLARA-A2: CM SAF cLoud, Albedo and surface RAdiation dataset from AVHRR data—Edition 2, Satellite Application Facility on Climate Monitoring. CM-SAF 2017. [Google Scholar] [CrossRef]
  27. Karlsson, K.G.; Anttila, K.; Trentmann, J.; Stengel, M.; Fokke Meirink, J.; Devasthale, A.; Hanschmann, T.; Kothe, S.; Jaäskelaïnen, E.; Sedlar, J.; et al. CLARA-A2: The second edition of the CM SAF cloud and radiation data record from 34 years of global AVHRR data. Atmos. Chem. Phys. 2017, 17, 5809–5828. [Google Scholar] [CrossRef] [Green Version]
  28. Pfeifroth, U.; Sanchez-Lorenzo, A.; Manara, V.; Trentmann, J.; Hollmann, R. Trends and Variability of Surface Solar Radiation in Europe Based On Surface- and Satellite-Based Data Records. J. Geophys. Res. Atmos. 2018, 123, 1735–1754. [Google Scholar] [CrossRef]
  29. Urraca, R.; Gracia-amillo, A.M.; Koubli, E.; Huld, T.; Trentmann, J.; Riihelä, A.; Lindfors, A.V.; Palmer, D.; Gottschalg, R.; Antonanzas-torres, F. Remote Sensing of Environment Extensive validation of CM SAF surface radiation products over Europe. Remote Sens. Environ. 2017, 199, 171–186. [Google Scholar] [CrossRef] [Green Version]
  30. Montero-Martín, J.; Antón, M.; Vaquero-martínez, J.; Sanchez-lorenzo, A. Comparison of long-term solar radiation trends from CM SAF satellite products with ground-based data at the Iberian Peninsula for the period 1985–2015. Atmos. Res. 2020, 236, 104839. [Google Scholar] [CrossRef]
  31. Wang, Y.; Trentmann, J.; Yuan, W.; Wild, M. Validation of CM SAF CLARA-A2 and SARAH-E surface solar radiation datasets over China. Remote Sens. 2018, 10, 1977. [Google Scholar] [CrossRef] [Green Version]
  32. Manara, V.; Bassi, M.; Brunetti, M.; Cagnazzi, B.; Maugeri, M. 1990–2016 surface solar radiation variability and trend over the Piedmont region (northwest Italy). Theor. Appl. Climatol. 2019, 136, 849–862. [Google Scholar] [CrossRef]
  33. Manara, V.; Brunetti, M.; Maugeri, M.; Sanchez-Lorenzo, A.; Wild, M. Sunshine duration and global radiation trends in Italy (1959–2013): To what extent do they agree? J. Geophys. Res. 2017, 122, 4312–4331. [Google Scholar] [CrossRef]
  34. Manara, V.; Brunetti, M.; Gilardoni, S.; Landi, T.C.; Maugeri, M. 1951–2017 changes in the frequency of days with visibility higher than 10 km and 20 km in Italy. Atmos. Environ. 2019, 214, 116861. [Google Scholar] [CrossRef]
  35. Craddock, J.M. Methods of comparing annual rainfall records for climatic purposes. Weather 1979, 34, 332–346. [Google Scholar] [CrossRef]
  36. Manara, V.; Brunetti, M.; Maugeri, M.; Sanchez-Lorenzo, A.; Wild, M. Homogenization of a surface solar radiation dataset over Italy. In Proceedings of the Radiation processes in the atmosphere And Ocean (IRS 2016)—AIP Conference Proceeding, Auckland, New Zealand, 12–22 April 2016; AIP Publishing: Melville, NY, USA, 2017; Volume 1810, pp. 090004-1–090004-4. [Google Scholar]
  37. Trentmann, J.; Pfeifroth, U.; Hollmann, R.; Werscheck, M. Algorithm Theoretical Baseline Document ICDR SEVIRI Radiation Based on SARAH-2 Methods. EUMETSAT Satellite Application Facility on Climate Monitoring. 2018. Available online: https://www.cmsaf.eu/SharedDocs/Literatur/document/2018/saf_cm_dwd_icdr_sev_rad_atbd_1_3_pdf.pdf?__blob=publicationFile (accessed on 26 November 2020).
  38. Posselt, R.; Mueller, R.W.; Stöckli, R.; Trentmann, J. Remote sensing of solar surface radiation for climate monitoring - the CM-SAF retrieval in international comparison. Remote Sens. Environ. 2012, 118, 186–198. [Google Scholar] [CrossRef]
  39. Mueller, R.; Behrendt, T.; Hammer, A.; Kemper, A. A new algorithm for the satellite-based retrieval of solar surface irradiance in spectral bands. Remote Sens. 2012, 4, 622–647. [Google Scholar] [CrossRef] [Green Version]
  40. Pfeifroth, U.; Trentmann, J.; Kothe, S.; Hollmann, R.; Werscheck, M. Validation Report: Meteosat Solar Surface Radiation and Effective Cloud Albedo Climate Data Record SARAH-2.1 climate data records. EUMETSAT Satell. Appl. Facil. Clim. Monit. 2019. SAF/CM/DWD. [Google Scholar] [CrossRef]
  41. USGS GTOPO 30 Digital Elevation Model. Available online: https://www.usgs.gov/centers/eros/science/usgs-eros-archive-digital-elevation-global-30-arc-second-elevation-gtopo30?qt-science_center_objects=0#qt-science_center_objects (accessed on 26 November 2020).
  42. Dybbroe, A.; Karlsson, K.-G.; Thoss, A. NWCSAF AVHRR cloud detection and analysis using dynamic thresholds and radiative transfer modeling. Part I: Algorithm description. J. Appl. Meteorol. 2005, 44, 39–53. [Google Scholar] [CrossRef]
  43. Mueller, R.W.; Matsoukas, C.; Gratzki, A.; Behr, H.D.; Hollmann, R. The CM-SAF operational scheme for the satellite based retrieval of solar surface irradiance—A LUT based eigenvector hybrid approach. Remote Sens. Environ. 2009, 113, 1012–1024. [Google Scholar] [CrossRef]
  44. Diekmann, F.J.; Happ, S.; Koln, M.R.; Benesch, W.; Czeplak, G.; Kasten, F. An operational estimate of global irradiance at ground level from METEOSAT data: Results from 1985 to 1987. Meteorol. Rdsch. 1988, 41, 65–79. [Google Scholar]
  45. Karlsson, K.G.; Riihelä, A.; Müller, R.; Meirink, J.F.; Sedlar, J.; Stengel, M.; Lockhoff, M.; Trentmann, J.; Kaspar, F.; Hollmann, R.; et al. CLARA-A1: A cloud, albedo, and radiation dataset from 28 yr of global AVHRR data. Atmos. Chem. Phys. 2013, 13, 5351–5367. [Google Scholar] [CrossRef] [Green Version]
  46. Gelaro, R.; McCarty, W.; Suárez, M.J.; Todling, R.; Molod, A.; Takacs, L.; Randles, C.A.; Darmenov, A.; Bosilovich, M.G.; Reichle, R.; et al. The Modern-Era Retrospective Analysis for Research and Applications, Version 2 (MERRA-2). J. Clim. 2017, 30, 5419–5454. [Google Scholar] [CrossRef] [PubMed]
  47. Gafurov, A.; Bárdossy, A. Cloud removal methodology from MODIS snow cover product. Hydrol. Earth Syst. Sci. 2009, 13, 1361–1373. [Google Scholar] [CrossRef] [Green Version]
  48. Tadono, T.; Ishida, H.; Oda, F.; Naito, S.; Minakawa, K.; Iwamoto, H. Precise Global DEM Generation by ALOS PRISM. ISPRS Ann. Photogramm. Remote Sens. Spat. Inf. Sci. 2014, II–4, 71–76. [Google Scholar] [CrossRef] [Green Version]
  49. Sen, P.K. Estimates of the Regression Coefficient Based on Kendall’s Tau. J. Am. Stat. Assoc. 1968, 63, 1379–1389. [Google Scholar] [CrossRef]
  50. Theil, H. A rank-invariant method of linear and polynomical regression analysis. In Advanced Studies in Theoretical and Applied Econometrics; Part I; Springer: Berlin/Heidelberg, Germany, 1950; pp. 386–392. [Google Scholar]
  51. Sneyers, R. On the use of statistical analysis for the objective determination of climate change. Meteorol. Zeitschrift 1992, 1, 247–256. [Google Scholar] [CrossRef]
  52. Trentmann, J.; Kothe, S.; Hollmann, R.; Werscheck, M. Validation Report CM SAF Cloud, Albedo, Radiation data record, AVHRR-based, Edition 2 (CLARA-A2). EUMETSAT Satellite Application Facility on Climate Monitoring. 2016. Available online: https://www.cmsaf.eu/SharedDocs/Literatur/document/2016/saf_cm_fmi_val_gac_sal_2_1_pdf.html (accessed on 26 November 2020).
  53. Haiden, T.; Trentmann, J. Verification of cloudiness and radiation forecasts in the greater Alpine region. Meteorol. Zeitschrift 2016, 25, 3–15. [Google Scholar] [CrossRef]
  54. Hakuba, M.Z.; Folini, D.; Sanchez-Lorenzo, A.; Wild, M. Spatial representativeness of ground-based solar radiation measurements. J. Geophys. Res. Atmos. 2013, 118, 8585–8597. [Google Scholar] [CrossRef] [Green Version]
  55. Huang, G.; Li, X.; Huang, C.; Liu, S.; Ma, Y.; Chen, H. Representativeness errors of point-scale ground-based solar radiation measurements in the validation of remote sensing products. Remote Sens. Environ. 2016, 181, 198–206. [Google Scholar] [CrossRef]
  56. Carbone, C.; Decesari, S.; Mircea, M.; Giulianelli, L.; Finessi, E.; Rinaldi, M.; Fuzzi, S.; Marinoni, A.; Duchi, R.; Perrino, C.; et al. Size-resolved aerosol chemical composition over the Italian Peninsula during typical summer and winter conditions. Atmos. Environ. 2010, 44, 5269–5278. [Google Scholar] [CrossRef]
  57. Baltensperger, U.; Gäggeler, H.W.; Jost, D.T.; Emmenegger, M.; Nägeli, W. Continuous background aerosol monitoring with the epiphaniometer. Atmos. Environ. Part A Gen. Top. 1991, 25, 629–634. [Google Scholar] [CrossRef]
  58. Lugauer, M.; Baltensperger, U.; Furger, M.; Gäggeler, H.W.; Jost, D.T.; Schwikowski, M.; Wanner, H. Aerosol transport to the high Alpine sites Jungfraujoch (3454 m asl) and Colle Gnifetti (4452 m asl). Tellus Ser. B Chem. Phys. Meteorol. 1998, 50, 76–92. [Google Scholar] [CrossRef]
  59. Alexandri, G.; Georgoulias, A.K.; Meleti, C.; Balis, D.; Kourtidis, K.A.; Sanchez-Lorenzo, A.; Trentmann, J.; Zanis, P. A high resolution satellite view of surface solar radiation over the climatically sensitive region of Eastern Mediterranean. Atmos. Res. 2017, 188, 107–121. [Google Scholar] [CrossRef]
  60. Senese, A.; Manara, V.; Maugeri, M.; Diolaiuti, G.A. Comparing Measured Incoming Shortwave and Longwave Radiation on a Glacier Surface with Estimated Records from Satellite and Off - Glacier Observations: A Case Study for the Forni Glacier, Italy. Remote Sens. 2020, 12, 3719. [Google Scholar] [CrossRef]
Figure 1. The two panels show the station sites (red triangles), together with (a) SARAH-2.1 and (b) CLARA-A2 grid points (blue circles). The filled circles identify the grid points considered for the analyses. The orography of the region is represented too.
Remotesensing 12 03882 g001
Figure 2. Boxplots of the differences between SARAH-2.1 annual and seasonal values and the corresponding station values for the selected subset of records (see last column of Table 1) over the period 2001–2016. The black line separates low and high OCI stations.
Remotesensing 12 03882 g002
Figure 3. Boxplots of the differences between CLARA-A2 annual and seasonal values and the corresponding station values for the selected subset of records (see last column of Table 1) over the period 2001–2016. The black line separates low and high OCI stations.
Remotesensing 12 03882 g003
Figure 4. Spatial distribution of (a) SARAH 2.1 and (b) CLARA A2 annual averages (Wm−2) over the period 2001–2016. The respective averages for the selected subset of ground-based records (see last column of Table 1) are shown too.
Remotesensing 12 03882 g004
Figure 5. Average annual and seasonal series (thin lines) representative of low-elevation station sites for ground-based (black line), SARAH-2.1 (blue line) and CLARA-A2 (red line) datasets. In the case of records without gaps, the series were plotted together with an 11-year window, 3-year standard deviation Gaussian low-pass filter (thick lines). The series are expressed as additive anomalies from the period 2001–2016.
Remotesensing 12 03882 g005
Figure 6. Average annual and seasonal series (thin lines) representative of high-elevation station sites for ground-based (black line), SARAH-2.1 (blue line) and CLARA-A2 (red line) datasets. In the case of records without gaps, the series were plotted together with an 11-year window, 3-year standard deviation Gaussian low-pass filter (thick lines). The series are expressed as additive anomalies from the period 2001–2016.
Remotesensing 12 03882 g006
Figure 7. Average annual and seasonal series (thin lines) of the differences between ground-based and SARAH-2.1 low-elevation SSI anomaly records. The averages were calculated for both low-elevation station sites and low-elevation station sites with a low OCI. In the case of records without gaps, the series were plotted together with an 11-year window, 3-year standard deviation Gaussian low-pass filter (thick lines).
Remotesensing 12 03882 g007
Figure 8. Average annual and seasonal series (thin lines) of the differences between ground-based and CLARA-A2 low-elevation SSI anomaly records. The averages were calculated for both low-elevation station sites and low-elevation station sites with a low OCI. In the case of records without gaps, the series were plotted together with an 11-year window, 3-year standard deviation Gaussian low-pass filter (thick lines).
Remotesensing 12 03882 g008
Figure 9. (a) SARAH-2.1 and (b) CLARA-A2 annual average over the 2001–2016 period with respect the corresponding MODIS length of snow coverage. The results refer to the same area shown in Figure 4.
Remotesensing 12 03882 g009
Figure 10. Ratio between SSI averages calculated over high-elevation station sites and low-elevation station sites with a low OCI. The ratios are calculated for (a) ground-based, (b) SARAH-2.1 and (c) CLARA-A2 records over the 2001–2016 period, and starting from the 32 station sites with ground-based records considered un-biased in terms of normal values (see Section 2.5).
Remotesensing 12 03882 g010
Table 1. Coordinates and elevation of the 57 station sites ordered according to the maximum between SARAH-2.1 and CLARA-A2 orographic complexity indexes (OCI). The table also shows the associated orographic complexity index and the yearly average surface solar irradiance (SSI) in the period 2001–2016 from the ground-based, the SARAH-2.1, and CLARA-A2 records. In the last column, it is reported if a station’s record is considered in Figure 2 and Figure 3.
Station NameLongitude (E°)Latitude (N°)Altitude (m)OCI (m)SSI Ground Stations (Wm−2)SSI SARAH-2.1 (Wm−2)SSI CLARA-A2 (Wm−2)Stations Considered in Figure 2 and Figure 3
Isola San Antonio8.85545.0227710157.0168.0161.01
Bauducchi7.71044.96122611164.5168.2162.12
Carmagnola7.68844.88723211159.8168.1162.1
Casale Monferrato8.50545.13311817170.8167.0161.4
Vercelli8.39145.32613217154.8166.6161.13
Alessandria Lobbi8.70544.9388832154.0167.8159.8
Basaluzzo8.68244.76312832157.6165.4159.84
Asti8.19244.91917534162.4168.1162.45
Caselle7.65245.19230060148.7166.6160.0
Torino Consolata7.67945.07729060139.0162.7160.0
Torino Alenia7.61245.08132060159.1164.4160.06
Torino B. Pastore7.67445.08024060127.7163.9160.0
Torino R. Romoli7.67145.11327060156.0163.9160.07
Verolengo8.01245.18616362159.5166.1162.38
Montechiaro d’Asti8.10245.00820062162.1167.5162.3
Fossano7.78844.54040373163.3167.9162.69
Bra7.85344.70228573159.3168.5162.610
Torino Vallere7.67545.01823976133.4167.5160.0
Castellar Ponzano8.84844.828146100160.4165.6159.811
Novi Ligure8.75844.787162100159.7166.0159.812
Sardigliano8.90844.757320100159.6163.7159.813
Spineto Scrivia8.87044.833187100160.8165.6159.814
Candia7.90045.322226103156.9167.7159.415
Mombaldone B.8.33644.570187116130.9166.6162.3
Acqui Terme8.48144.680215116160.1165.7162.416
Torino G. Reali7.69045.072239130144.0164.7160.0
Bergalli8.18344.408385146159.6164.1161.0
Mombarcaro8.08644.469896146152.5165.9161.0
Alba Tanaro8.02944.706172153161.5167.6163.317
Treiso8.08344.678376153158.5166.7163.318
Ponzone B. Berton8.54044.519773171158.3155.0160.819
Arquata Scrivia8.88244.684325182160.5162.2158.320
Pallanza8.55045.925202202153.6161.5155.621
Cumiana7.39244.965327225151.7168.2159.422
Cuneo C. Com.7.54744.388550302162.5160.4158.823
Costigliole Saluzzo7.49744.559440361159.6168.3156.624
Sestriere Banchetta6.91144.9542480394177.8141.2148.925
Colle Bercia6.78444.9222200394174.9144.4148.9
Rocca dell’Abisso7.50344.1432753403177.6159.4150.026
Avigliana7.39645.095340436159.1170.1153.027
Gran Vaudala7.11945.4963272454183.6135.0137.928
Belmonte7.63845.372687465151.6170.6149.3
Prerichard6.71845.0761353473164.7166.0145.7
Camini Frejus6.69045.1181740473133.4166.0145.7
Diga del Chiotas7.33544.1622020506150.5143.4147.4
Pian delle Baracche7.13444.5502135538155.4157.0140.7
Domodossola8.30346.104252549144.7154.3144.2
Lago Pilone6.87745.0032280576162.6149.0146.629
Le Selle6.91845.0551980576166.4159.6146.6
Gad6.84145.0441065576190.0164.8146.6
Andrate Pinalba7.89345.5621580636142.2160.9143.8
Borgofranco d’Ivrea7.84945.515337636157.3168.2143.730
Lago Paione8.19146.1772269675134.9148.9137.4
Cap. Margherita7.87745.9274560679170.6128.2139.331
Passo del Moro7.97845.9982820679177.4132.1139.3
Borgone7.24545.118400702154.5161.7144.7
Pietrastretta7.05545.143520702160.8161.6144.732
Table 2. Average values and standard deviations of the differences between SARAH-2.1 and CLARA-A2 annual and seasonal SSI means (2001–2016). The table shows these values for all investigated sites, for the 30 sites with low OCI and for the 27 sites with high OCI.
YearWinterSpringSummerAutumn
All stations6.7 ± 7.43.9 ± 8.38.6 ± 9.88.3 ± 10.45.8 ± 4.6
Low OCI stations5.2 ± 1.45.1 ± 1.05.3 ± 2.75.0 ± 2.95.4 ± 1.5
High OCI stations8.3 ± 10.52.6 ± 12.012.3 ± 13.112.0 ± 14.06.2 ± 6.6
Table 3. The table shows the common variances and the mean absolute differences (MAD) between satellite and ground station datasets using the 57 investigated sites. Both common variances and mean absolute differences are calculated separately for low and high OCI station sites for different periods and considering daily, monthly, seasonal, and annual anomaly records. The anomalies are calculated with respect to the period 2001–2016.
Anomaly
Temporal Resolution
Period Considered Low OCI Station SitesHigh OCI Station Sites
Common VarianceMAD (Wm−2)Common VarianceMAD (Wm−2)
SARAH-2.1—Ground StationsCLARA-A2—Ground StationsSARAH-2.1—Ground StationsCLARA-A2—Ground StationsSARAH-2.1—Ground StationsCLARA-A2—Ground StationsSARAH-2.1—Ground StationsCLARA-A2—Ground Stations
DailyD-J-F0.840.849.5610.440.480.6819.7614.38
M-A-M0.950.9113.4517.330.730.7730.3328.47
J-J-A0.900.8414.7319.710.780.7527.0929.78
S-O-N0.930.889.4912.830.770.7918.2617.89
All data0.920.8711.8315.230.730.7623.8522.81
MonthlyD-J-F0.680.694.864.730.380.658.685.07
M-A-M0.890.875.585.870.620.6510.9710.13
J-J-A0.820.826.036.000.660.6410.469.93
S-O-N0.890.863.504.050.730.766.885.80
All data0.840.834.995.200.610.669.247.86
SeasonalWinter0.640.603.814.090.390.616.603.93
Spring0.820.824.614.150.530.557.647.42
Summer0.800.834.734.120.600.577.877.64
Autumn0.890.772.442.930.720.734.403.57
All data0.790.793.903.840.540.576.605.81
AnnualAll data0.730.692.882.970.510.444.134.02
Table 4. Trends expressed as variations per decade (Wm2decade−1) over the period 1990–2016 provided together with an estimation of their standard deviations (half widths of 68% confidence intervals). They are calculated considering low-elevation station sites, low-elevation station sites with a low OCI and high-elevation station sites. Values shown in italics are 0.05 < p-value ≤ 0.1 and those in bold have a p-value ≤ 0.05. For non-significant trends, only the sign of the slope is given. Trends were estimated with the Theil–Sen method while the trend significances were evaluated with the Mann–Kendall non-parametric test.
Considered SitesDataMonthWinterSpringSummerAutumnYear
Low-elevation station sitesGround-based4.0 ± 0.9-5.7 ± 2.46.4 ± 2.84.1 ± 1.93.8 ± 1.3
Sarah-2.1+-++3.4 ± 2.3+
Clara-A2+−5.5 ± 2.0+++-
Low-elevation station sites with low OCIGround-based4.0 ± 1.0-5.5 ± 2.76.1 ± 2.84.6 ± 1.93.6 ± 1.5
Sarah-2.12.2 ± 1.2-++3.9 ± 2.3+
Clara-A2+−5.9 ± 1.9+5.5 ± 2.6+-
High-elevation station sitesGround-based2.9 ± 1.0-+6.3 ± 2.95.0 ± 1.63.1 ± 1.4
Sarah-2.1++4.5 ± 2.9+5.3 ± 1.5+
Clara-A2+−4.5 ± 1.7++3.3 ± 1.5-
Table 5. As Table 4, but trends were calculated considering the difference between ground-based and satellite anomaly records.
Considered SitesDataMonthWinterSpringSummerAutumnYear
Low-elevation station sitesGround based-Sarah 2.12.5 ± 0.3+3.1 ± 1.04.7 ± 0.71.5 ± 0.62.6 ± 0.4
Low-elevation station sites with low OCI2.6 ± 0.32.2 ± 1.33.4 ± 0.94.7+0.61.4 ± 0.52.8 ± 0.4
High-elevation station sites+--5.7 ± 1.6++
Low-elevation station sitesGround based-Clara A23.0 ± 0.33.6 ± 1.13.3 ± 0.72.5 ± 0.82.1 ± 0.83.1 ± 0.4
Low-elevation station sites with low OCI2.8 ± 0.33.7 ± 1.33.3 ± 0.72.0 ± 0.92.2 ± 0.73.0 ± 0.5
High-elevation station sites2.4 ± 0.5++4.9 ± 1.91.5 ± 0.8+
Publisher’s Note: MDPI stays neutral with regard to jurisdictional claims in published maps and institutional affiliations.

