Article

The Geomechanical and Fault Activation Modeling during CO2 Injection into Deep Minjur Reservoir, Eastern Saudi Arabia

1
Department of Mechanical Engineering, King Fahd University of Petroleum and Minerals, Dhahran 31261, Saudi Arabia
2
Department of Geosciences, King Fahd University of Petroleum and Minerals, Dhahran 31261, Saudi Arabia
3
Department of Electrical Engineering, King Fahd University of Petroleum and Minerals, Dhahran 31261, Saudi Arabia
*
Author to whom correspondence should be addressed.
Sustainability 2020, 12(23), 9800; https://doi.org/10.3390/su12239800
Submission received: 4 October 2020 / Revised: 12 November 2020 / Accepted: 12 November 2020 / Published: 24 November 2020
(This article belongs to the Special Issue Co-optimisation of CO2 Storage and Hydrocarbon Recovery)

Abstract

:
The release of large quantities of CO2 into the atmosphere is one of the major causes of global warming. The most viable method to control the level of CO2 in the atmosphere is to capture and permanently sequestrate the excess amount of CO2 in subsurface geological reservoirs. The injection of CO2 gives rise to pore pressure buildup. It is crucial to monitor the rising pore pressure in order to prevent the potential failure of the reservoir and the subsequent leakage of the stored CO2 into the overburden layers, and then back to the atmosphere. In this paper, the Minjur sandstone reservoir in eastern Saudi Arabia was considered for establishing a coupled geomechanical model and performing the corresponding stability analysis. During the geomechanical modeling process, the fault passing through the Minjur and Marrat layers was also considered. The injection-induced pore-pressure and ground uplift profiles were calculated for the case of absence of a fault across the reservoir, as well as the case with a fault. The stability analysis was performed using the Mohr–Coulomb failure criterion. In the current study, the excessive increase in pore pressure, in the absence of geological faults, moved the reservoir closer to the failure envelope, but in the presence of geological faults, the reservoir reached to the failure envelope and the faults were activated. The developed geomechanical model provided estimates for the safe injection parameters of CO2 based on the magnitudes of the reservoir pore pressure and stresses in the reservoir.

1. Introduction

The continued dependence on fossil fuels has excessively increased the quantity of CO2 in the atmosphere. The current level of the CO2 concentration in the atmosphere is 410 ppm, which is expected to increase to 600–1550 ppm until 2030 [1,2,3]. The Carbon Dioxide Capture and Sequestration (CCS) process is primarily concerned with capturing CO2 that is released by power plants and refineries as part of the flue gases, and then storing it in deep geological reservoirs. Different underground geological formations like saline aquifers, depleted oil and gas reservoirs, and deep coal seams present potential sites for CO2 sequestration [4,5,6].
The injection of CO2 over a long time period into sedimentary reservoirs can affect the reservoirs in various ways. The CO2 injection will increase the reservoir pore pressure and will result in the volumetric expansion of the reservoir. CO2 injection at high pressure is known to either initiate some new fractures or reactivate the previously existing fractures within the reservoir. Once the faults are reactivated, CO2 will be leaked to the overburden layers and possibly to the outside atmosphere. There is a possibility that the leaked CO2 will mix with the potable water layers and will affect the quality of the drinking water [7,8].
Opening of the already existing faults will not only cause CO2 leakage but also can cause the geological layers to slip at the activated fault [9]. The slipping of the geological layers can cause the local seismic events. Injection of CO2 into geological layers having pre-existing faults should be avoided. In the case of injecting CO2 into a geological reservoir having faults, it should be ensured that CO2 injection does not open the already existing faults [10,11,12,13,14,15].
In order to maximize the storing capacity and to prevent leakage, CO2 should be injected to sedimentary reservoirs with higher depths and highly impermeable caprock [16,17,18]. Most current CO2 sequestration projects inject CO2 into sedimentary reservoirs with depths less than 2000 m [8,19,20,21]. Injecting CO2 into sedimentary reservoirs at a depth less than 2000 m will result in excessive ground vertical displacement, and the stored CO2 can be leaked into the near surface potable water layers. In order to prevent the sequestrated CO2 from leaking into the layer of potable water, the injection should be carried out into deep sedimentary reservoirs [14,22,23]. Several reported investigations have addressed the sequestration of CO2 in geological formations and have discussed the various associated challenges [24,25,26,27,28,29,30].
The important application of CO2 sequestration in geological formations has been the focus of several researchers who reviewed the latest developments of this technology. In this context, Jia et al. [31] addressed the Enhanced Oil Recovery (EOR) technique in shale reservoirs, the proper injection scheme, and the modeling of gas injection. Ajayi et el. [32] shed light on monitoring the injected CO2 into suitable geological formations and possible measures to ensure CO2 containment and alleviate any possible leak to the atmosphere. The important issues of possible alterations induced by injection of CO2 at high pressures due to chemical and geomechanical interactions within carbonate reservoirs have been highlighted by Siqueira et al. [33]. Cao et al. [34] addressed latest developments regarding the safety and economic impact of CO2 storage, including risk assessment and improved safety.
This paper presents a procedure for monitoring CO2 injection into the Minjur reservoir using a numerical modeling scheme that includes the pore-pressure and ground vertical displacement. The modeling scheme has been utilized to evaluate the reservoir’s stability. The deeper the injection depth, the less ground uplift. This is the reason why the deep Minjur reservoir was selected in the current study in order to attain lower values of ground uplift during injection. During the geomechanical modeling process, the fault passing through the Minjur and Marrat layers was also considered. This study is an attempt to find safe CO2 injection parameters and CO2 injection feasibility for the Minjur reservoir in the presence of geological faults. The devised modeling scheme utilized COMSOL multiphysics and CMG-GEM softwares for studying the geomechanical behavior of the reservoir, while its stability was assessed using the failure criterion as depicted by Mohr–Coulomb diagram models.

2. Governing Equations

The numerical modeling performed in the current study was based on the CO2 flow and reservoir deformation equations. The governing equations are presented in the following sections.

2.1. CO2 Flow Equations

For modeling the flow of CO2, Darcy’s equation and the mass conservation principle were invoked in the current study [25,30,35].
t ( ρ f ϕ ) + . ( ρ f q ) = Q m ,
q = k μ ( p f + ρ f g D ) ,
where ρ f   density of CO2 (kg/m3), q   Darcy’s velocity vector (m/sec2), p f   pore pressure (Pa), Q m     source (kg/m3), ϕ   porosity of the matrix, D     vertical depth (m), and k   permeability (mDarcy).
Based on Equation (1), the increase in the mass of CO2 during the injection process will increase the magnitude of pore pressure. Based on Equation (2), the CO2 flow depends on the reservoir’s permeability, the viscosity of the CO2, and the pressure difference between the reservoir and the injected CO2.

2.2. Deformation Equations

The reservoir will experience volumetric expansion due to the interaction of the injected CO2 with the reservoir structure that eventually leads to ground vertical displacement. During the numerical modeling, the coupling between the flow equations and the reservoir deformations was considered. For modeling deformation of the reservoir, the stress–strain constitutive relation, the strain–displacement, and the stress equilibrium equations were invoked in the modeling procedure [25,30,35].
. σ =   F v = ρ avg g ,
σ σ 0 = C : ( ε ε 0 ϵ inel ) α p f I ,
ε =   1 2 ( ( u ) T + u ) ,
where σ   stress tensor (N/m2), F v     force vector (N/m3), ε     strain tensor, C   elastic coefficient, and u   displacement (m).
Equations (3)–(5) will be solved for the calculation of the displacement components along the x, y, and z axes. The displacement in the z-direction will correspond to the ground vertical displacement.

2.3. Fault Permeability Equations

The geological faults present in the deep geological layers are highly sensitive to changes in effective stresses on the fault plan. If the CO2 injection reservoir contains a geological fault, the injection of CO2 tends to levitate the pore pressure at the vicinity of the fault, while decreasing the effective stresses acting on the fault. The decrease of effective stresses below its critical value will cause the fault to open and eventually permit CO2 to infiltrate the overburden layers. The variation in the fault permeability due to changes in effective stresses was calculated using the Barton–Bandis Model [36].
k f = kccf   ( e e o ) 4 ,
where
e =   e o V j ,
V j =   σ n k n i +   σ n / V m ,
V m =   e o [ 1 ( k r c f k c c f ) 1 / 4 ] ,
where k f   fracture permeability (mDarcy), k fc   fracture closure permeability (mDarcy), e o   fracture opening before CO2 injection, V m   minimum fracture opening, e   current value of fracture opening,   V j   ratio of effective normal fracture stress to fracture stiffness, k ni   initial normal fracture stiffness (kPa), and k fr   initial fracture permeability (mDarcy).

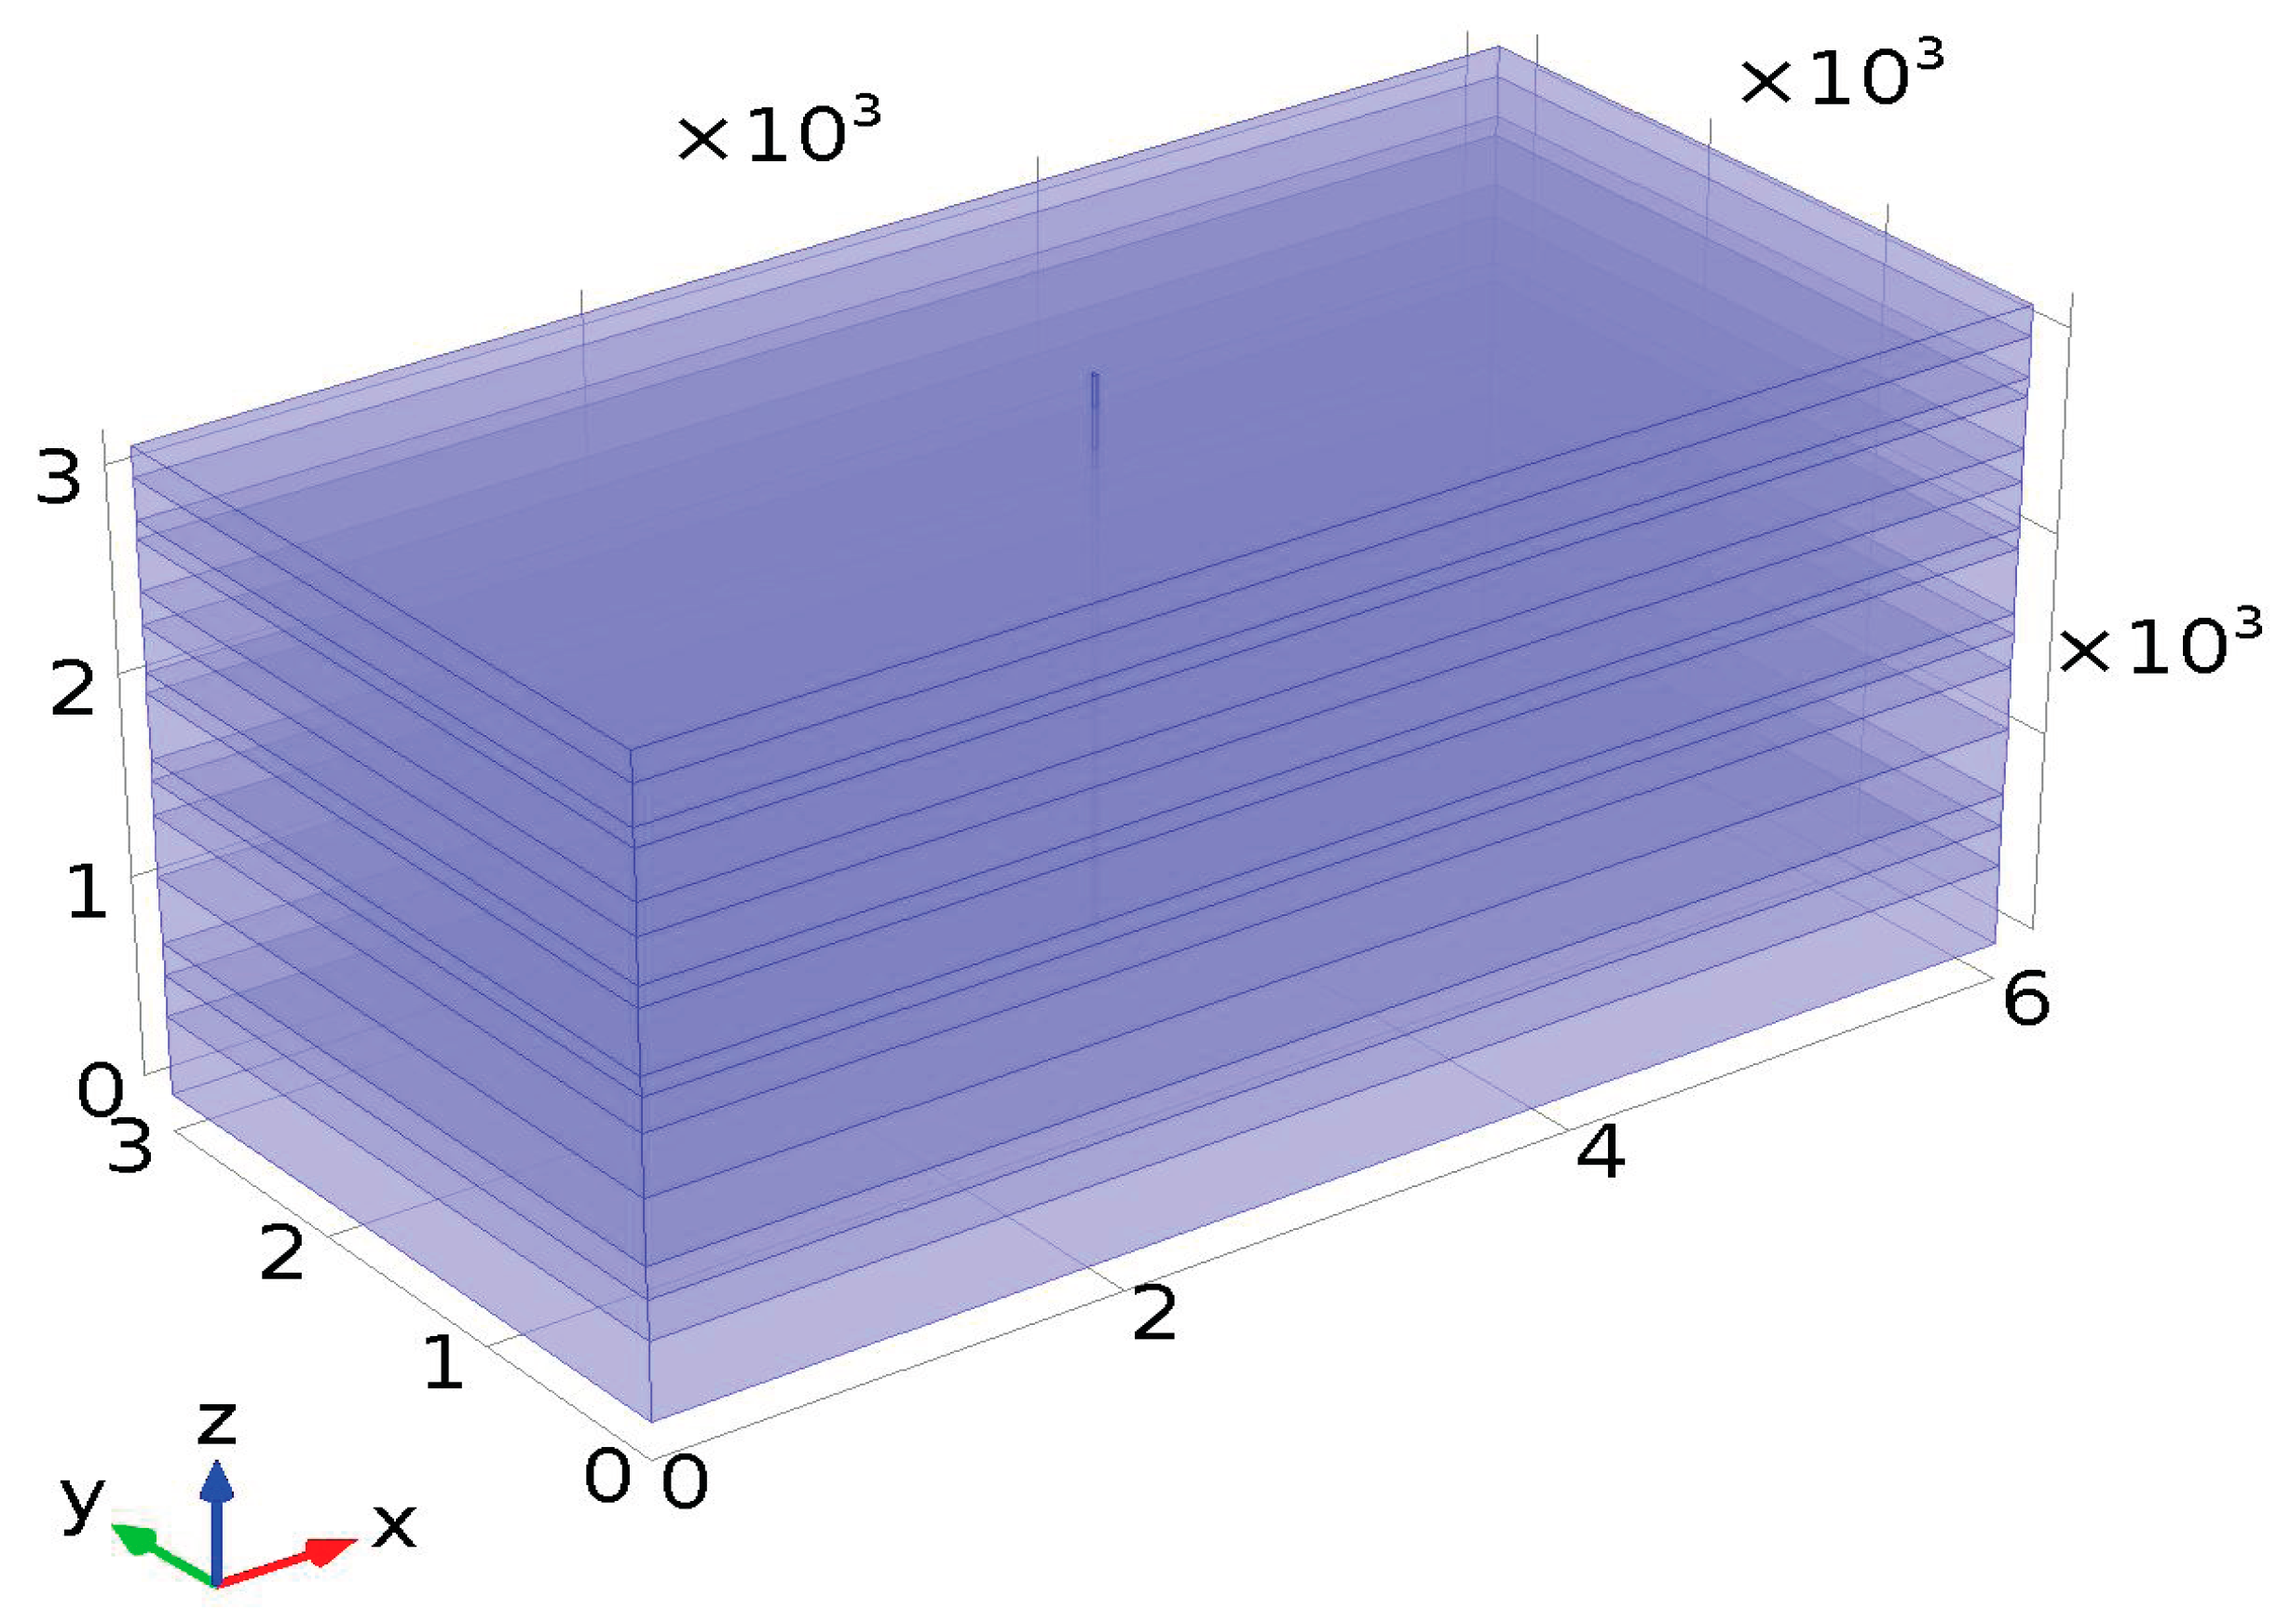
3. Numerical Modeling Scheme in COMSOL and CMG-GEM

As shown in Figure 1, the Minjur sandstone reservoir is located at comparably more depth and overlain by the highly impermeable Marrat caprock. Other than the Marrat caprock, the Minjur reservoir is further overlain by the Hith Anhydrite and Shuaiba impermeable caprocks that will block the leakage of the stored CO2 into the potable water Um Er Radhuma layer [37].
In order to perform the numerical modeling of the geomechanical behavior of the reservoir, both CMG-GEM (Computer Modeling Group Ltd.-Geomechanical Modeling Software, Calgary, AB, Canada) and COMSOL (cross-platform finite element solver and multiphysics simulation software, Burlington, MA, USA) were utilized. In the current study, the geomechanical modeling in CMG-GEM and COMSOL multiphysics software was performed separately. The modeling in CMG-GEM was mainly performed to simulate the fault opening during CO2 injection. CMG-GEM was also used to simulate the leakage of the stored CO2 into the overburden layers after the opening of the fault. The change in the pressure of the overburden layers and the change in the magnitude and pattern of the ground uplift after fault activation were also modeled using CMG-GEM. The strength of the Barton–Bandis model in the CMG-GEM is that it can be applied to specific grid blocks in the caprock in order to represent the fracture. The change in the effective stresses within the fracture in the caprock because of injection and the resulting leakage of the stored carbon dioxide can easily be modeled using the Bardon–Bandis model in CMG-GEM. The ensuing ground uplift caused by the leaked carbon dioxide can also be easily modeled using CMG-GEM [38,39,40]. COMSOL allows conventional physics-based user interfaces and coupled systems of partial differential equations. In the current study, during the modeling in the COMSOL multiphysics software, the caprock was considered without a fault. The resulted change in magnitudes of the reservoir pore pressure and ground uplift were calculated during the carbon dioxide injection to the reservoir.
GEM is an efficient, multidimensional, equation-of-state (EOS) simulator that allows the use of the custom script files for performing multiphysics operations. In the geomechanics module of the GEM software, the iterative coupling method was used in order to perform the coupled flow and the reservoir deformation analyses. Due to the iterative coupling method, the flow variable, e.g., pressure, is first calculated in the parent CMG flow simulator and then sent to the GEM module to calculate the deformation variables, such as displacements, stresses, and strains. In the coupled geomechanical modeling by CMG-GEM, the matrix porosity was calculated by using the displacement values in each time step. At each grid point, the calculated new values of the porosity were used by the flow simulator for the next time step [38,39,40,41,42,43].
Figure 1 shows the geological model used as a basis for the simulation models constructed in COMSOL and CMG-GEM. The Barton–Bandis model in CMG-GEM was utilized to monitor the fault opening during CO2 injection. Figure 2 and Figure 3 show the models constructed in COMSOL multiphysics and CMG-GEM, respectively. These simulation models depict the Minjur reservoir along with the various overburden layers and basement. The various input parameters of the CO2 flow and reservoir deformations are given in Table 1 [37,44,45,46].
In this reservoir modeling, the initial values for the displacement and pore pressure were taken as zero and 26.5 MPa, respectively. Due to confinement of the reservoir by various geological layers from all sides, the reservoir deformation was constrained from all directions except the vertical direction which will account for the resulting ground uplift. In order to keep the injection pressure higher than the reservoir base pressure and lower than the Lithostatic pressure of the reservoir, CO2 was injected at a pressure range of 48 to 56 MPa. The initial maximum horizontal stress on the Minjur reservoir was 76.6 MPa, the initial minimum horizontal stress on the Minjur reservoir was 67.5 MPa, and the initial vertical stress on the Minjur reservoir was 61.2 MPa [47,48,49,50].

4. Results and Discussion

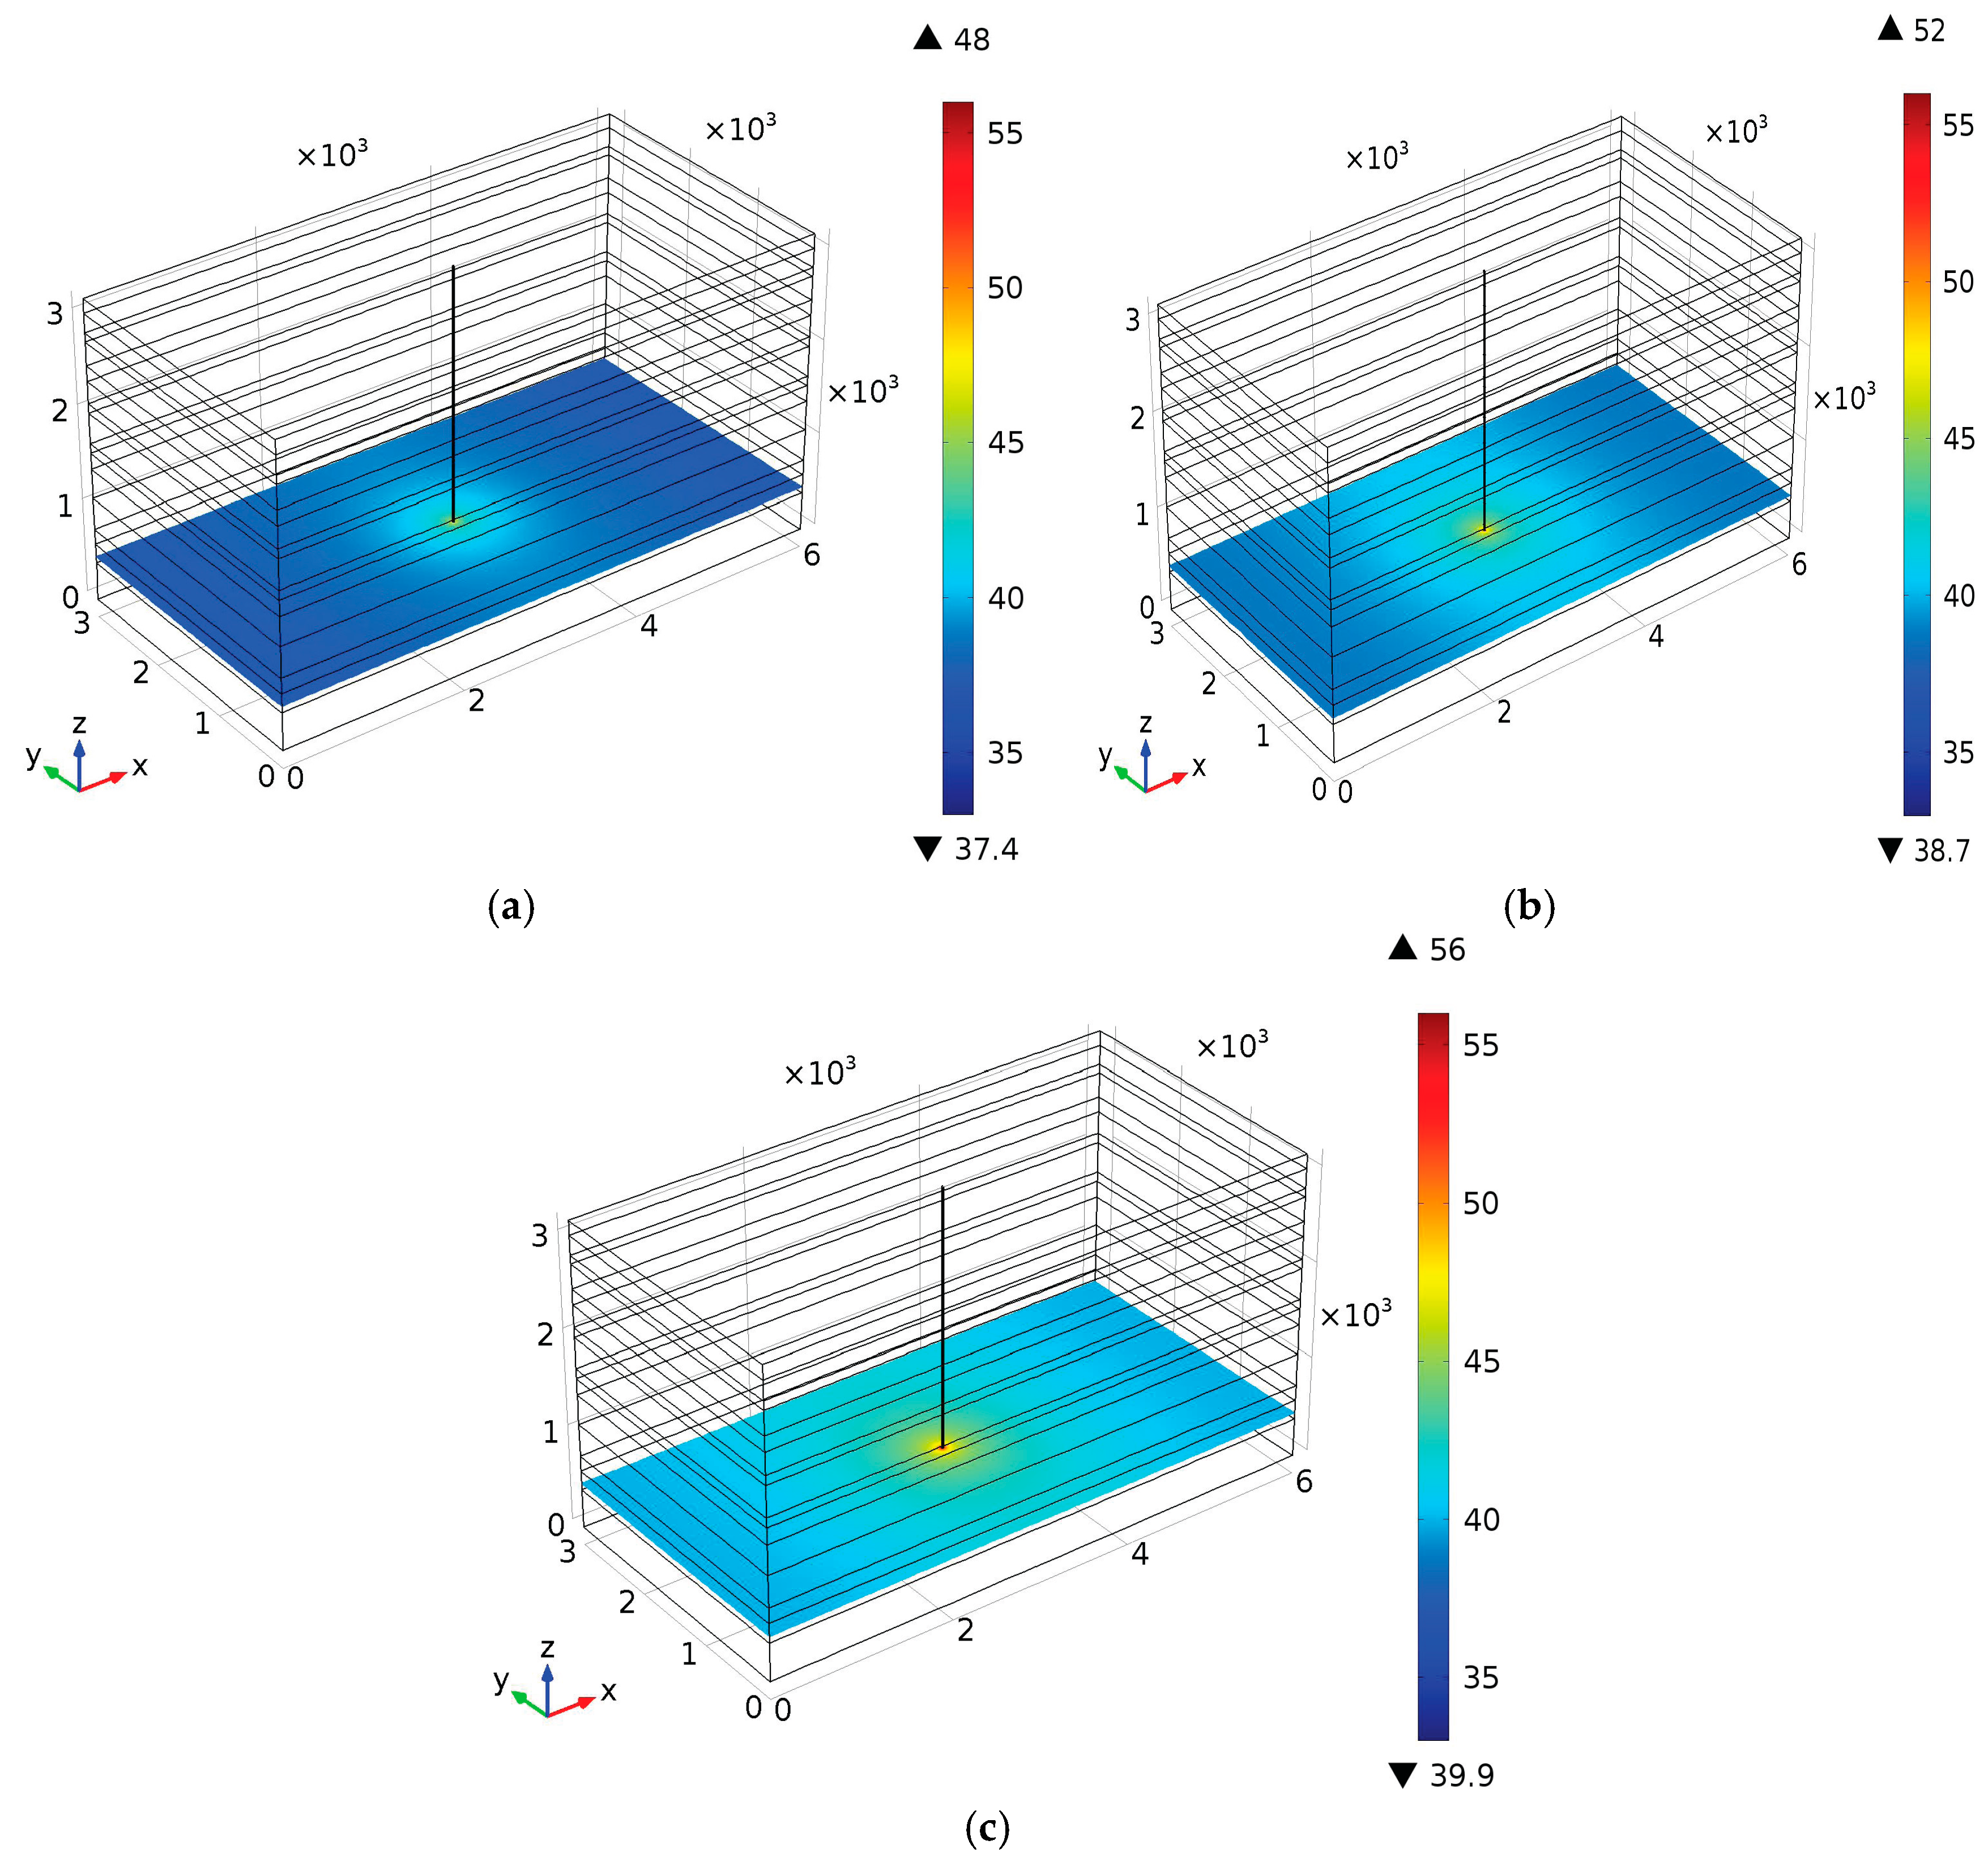
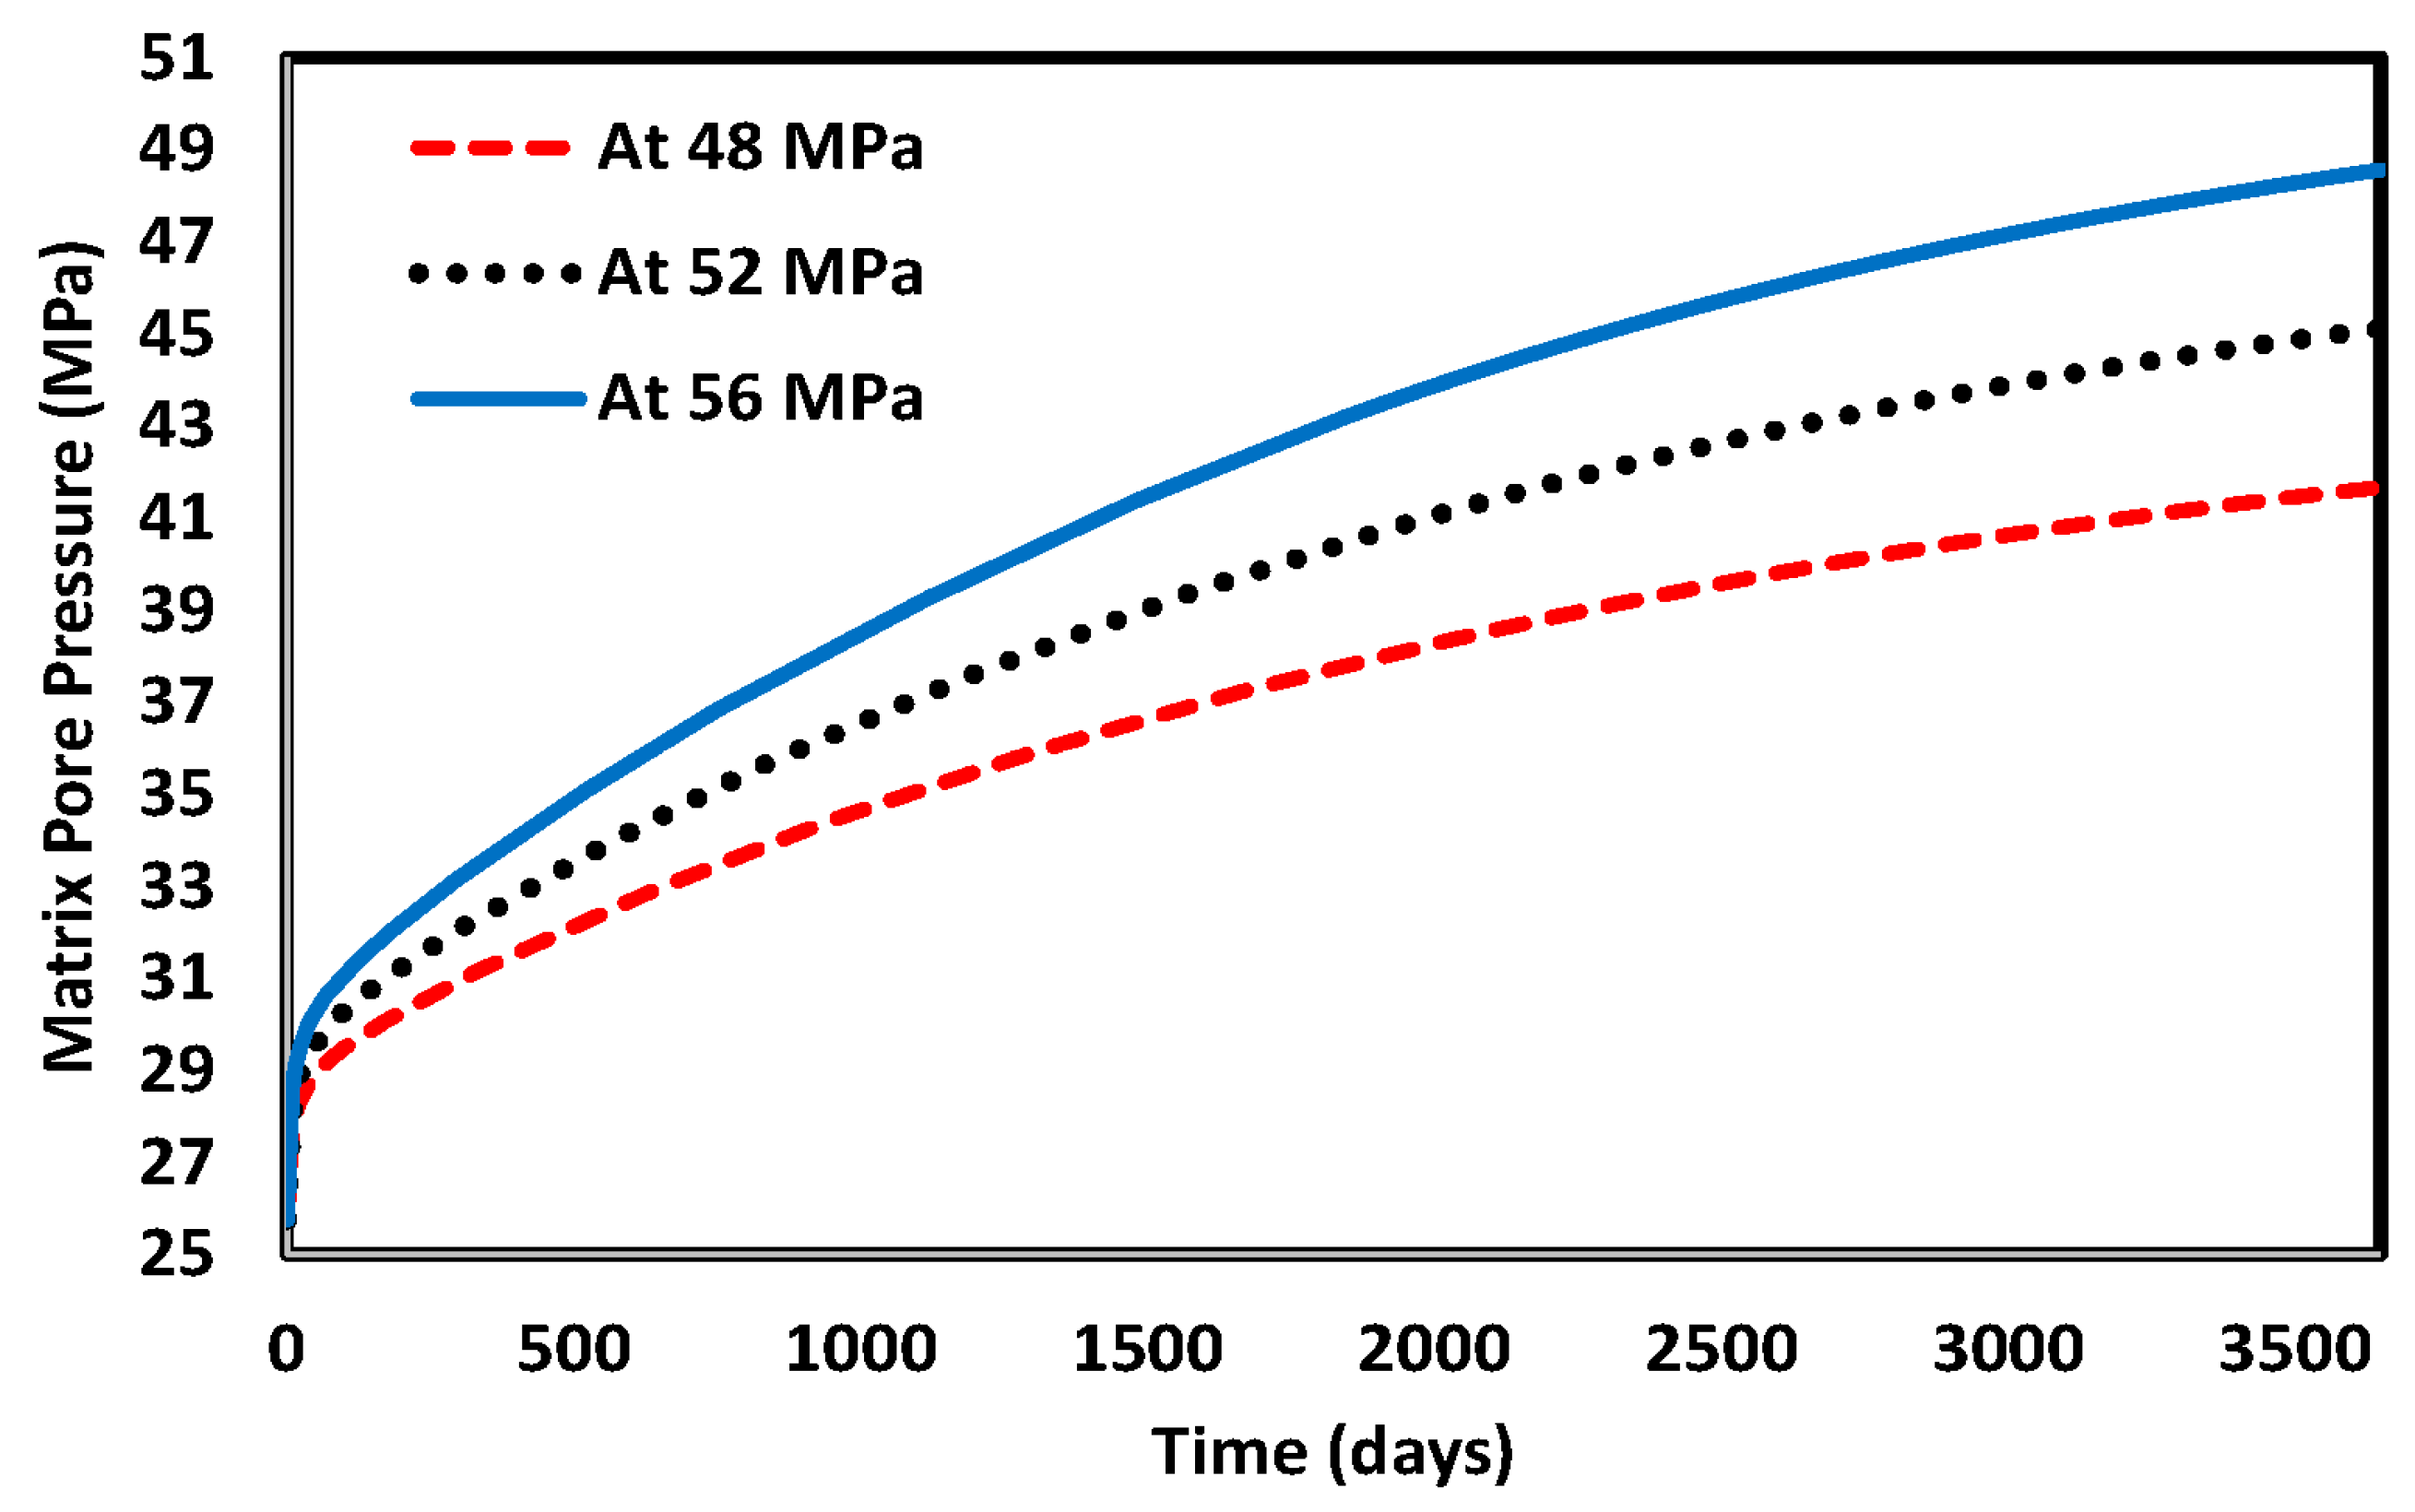
4.1. Reservoir Pore Pressure

The injection depth in this reservoir simulation was 2600 m and the injection pressure ranged from 48 to 56 MPa. The injection pressure of CO2 was higher than the reservoir’s initial pressure in order to facilitate the spread of CO2 within the reservoir. Pressurized CO2 will eventually increase the reservoir’s pore pressure. Figure 4 shows the pore pressure at various injection periods. As depicted in Figure 4, the pore pressure built up as CO2 injection continued. As displayed in Figure 5, the rate of pore pressure increased with the increase of injection pressure. Although the increase of injection pressure tended to increase the spread of the injected CO2 over the reservoir, the increased spread took place at the cost of creating higher levels of pore pressure. Figure 6 shows the monotonic increase of pore pressure during the injection of CO2. Because of the large pressure difference between the injected CO2 and the reservoir initial pressure, the pore pressure increased rapidly during the initial injection stage, as displayed in Figure 6.

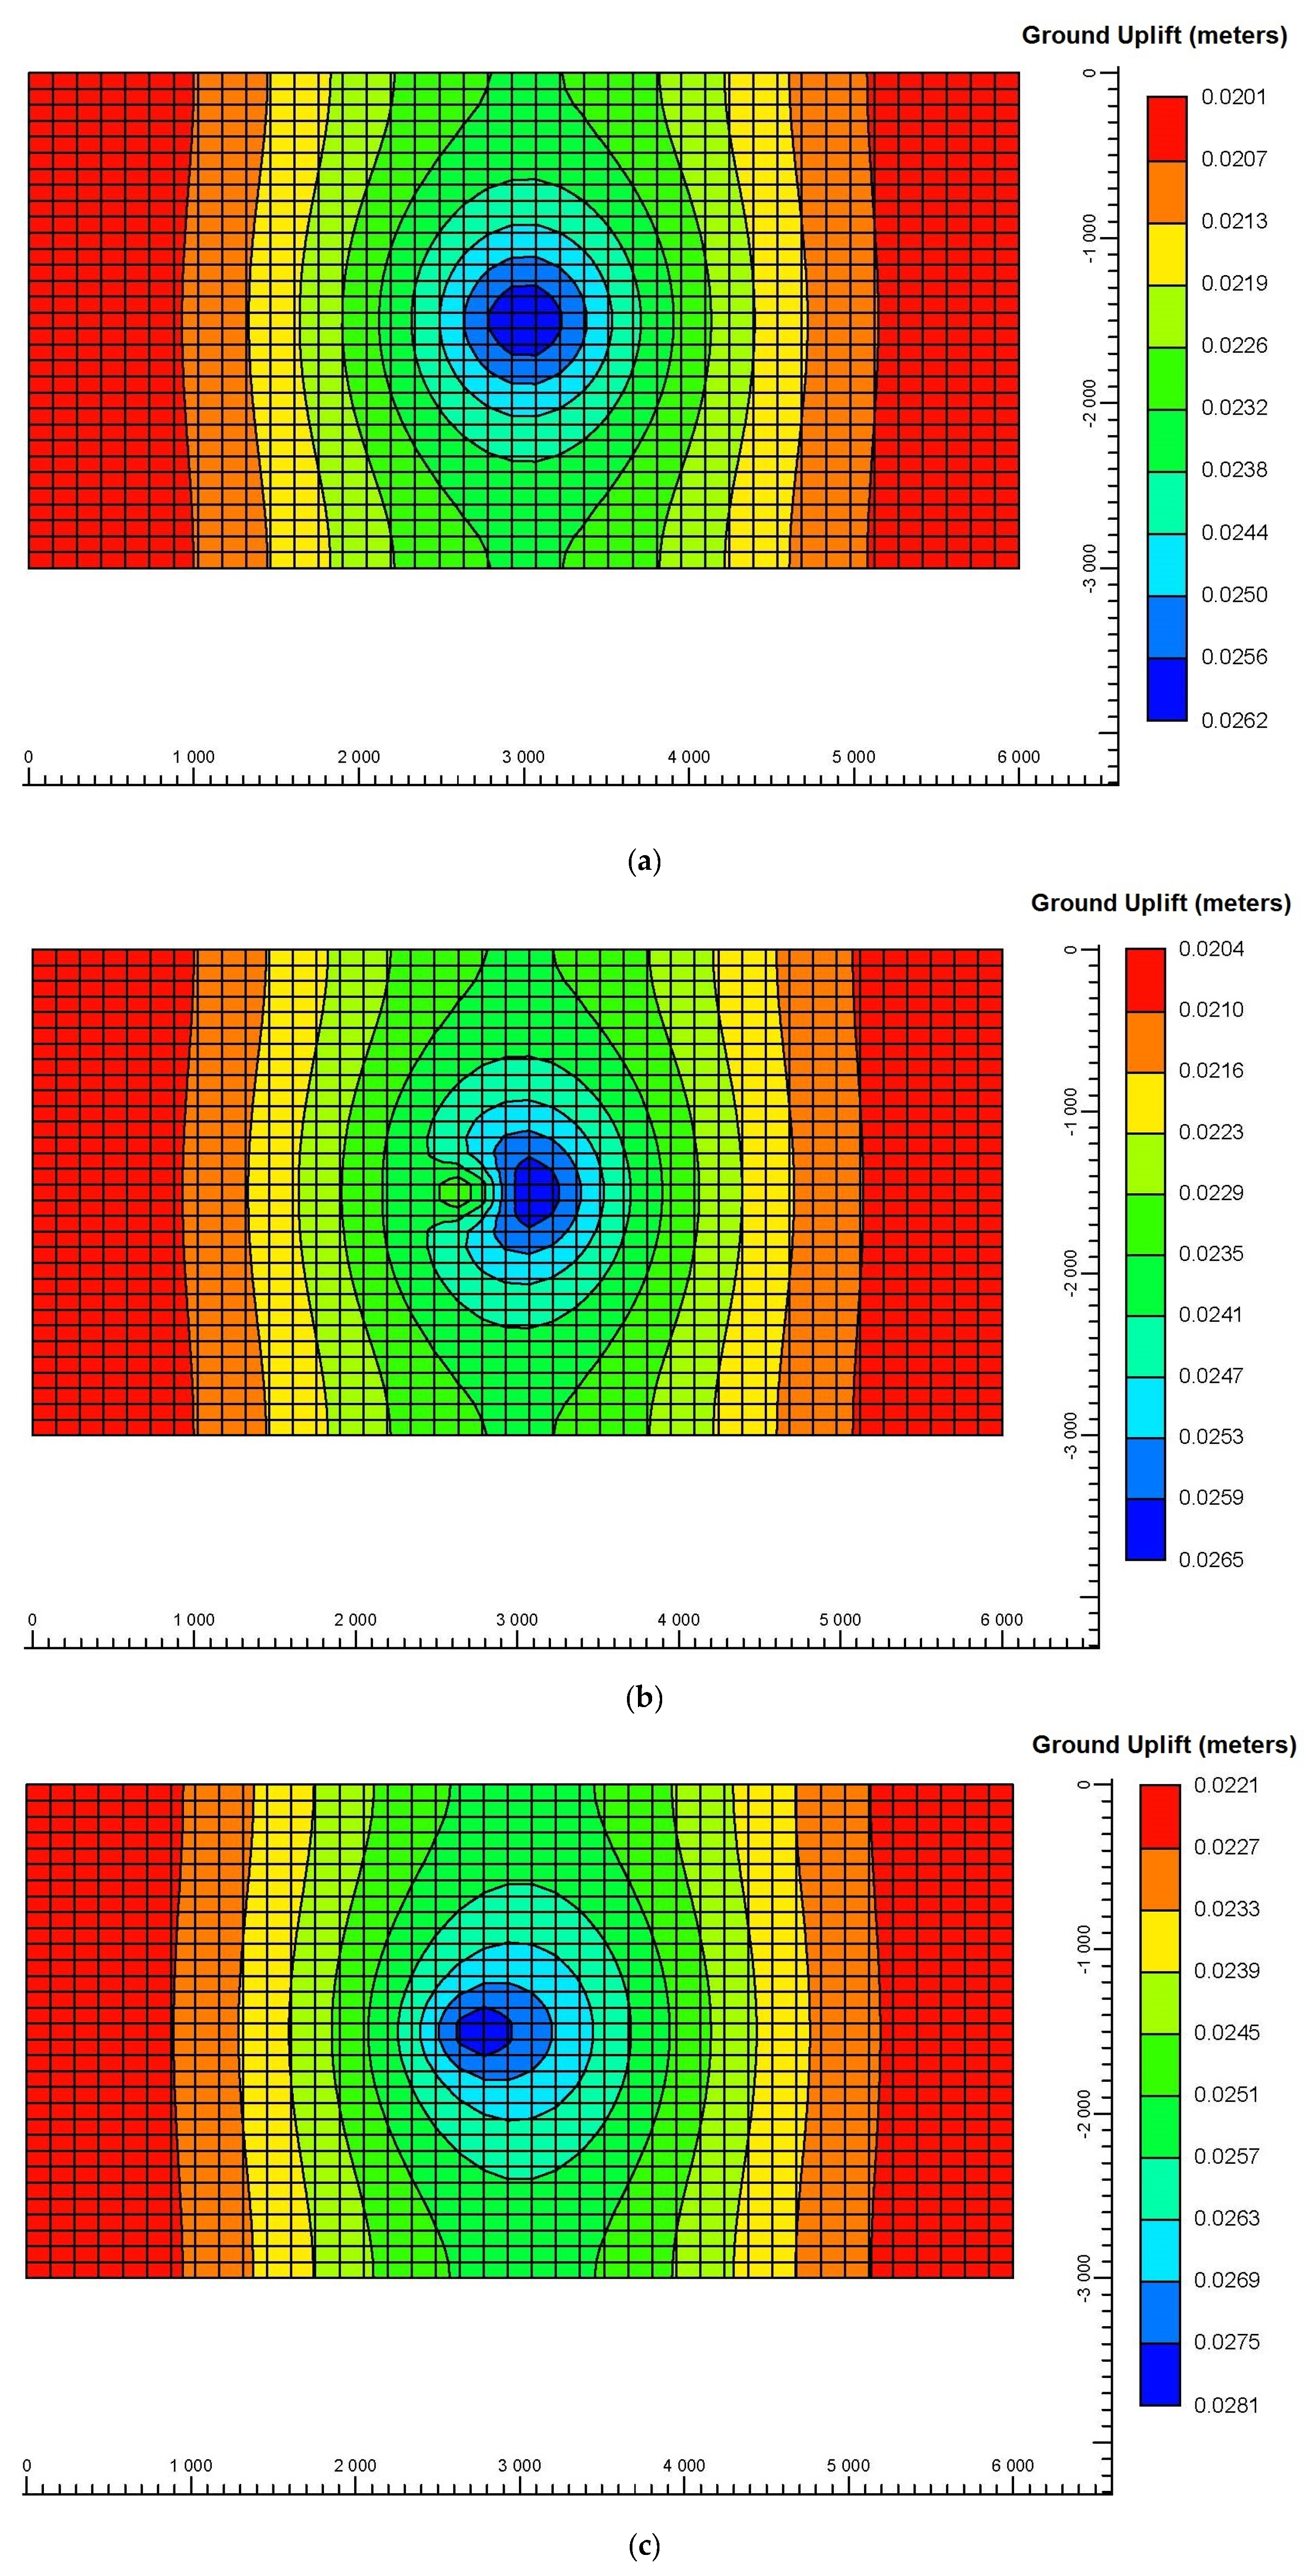
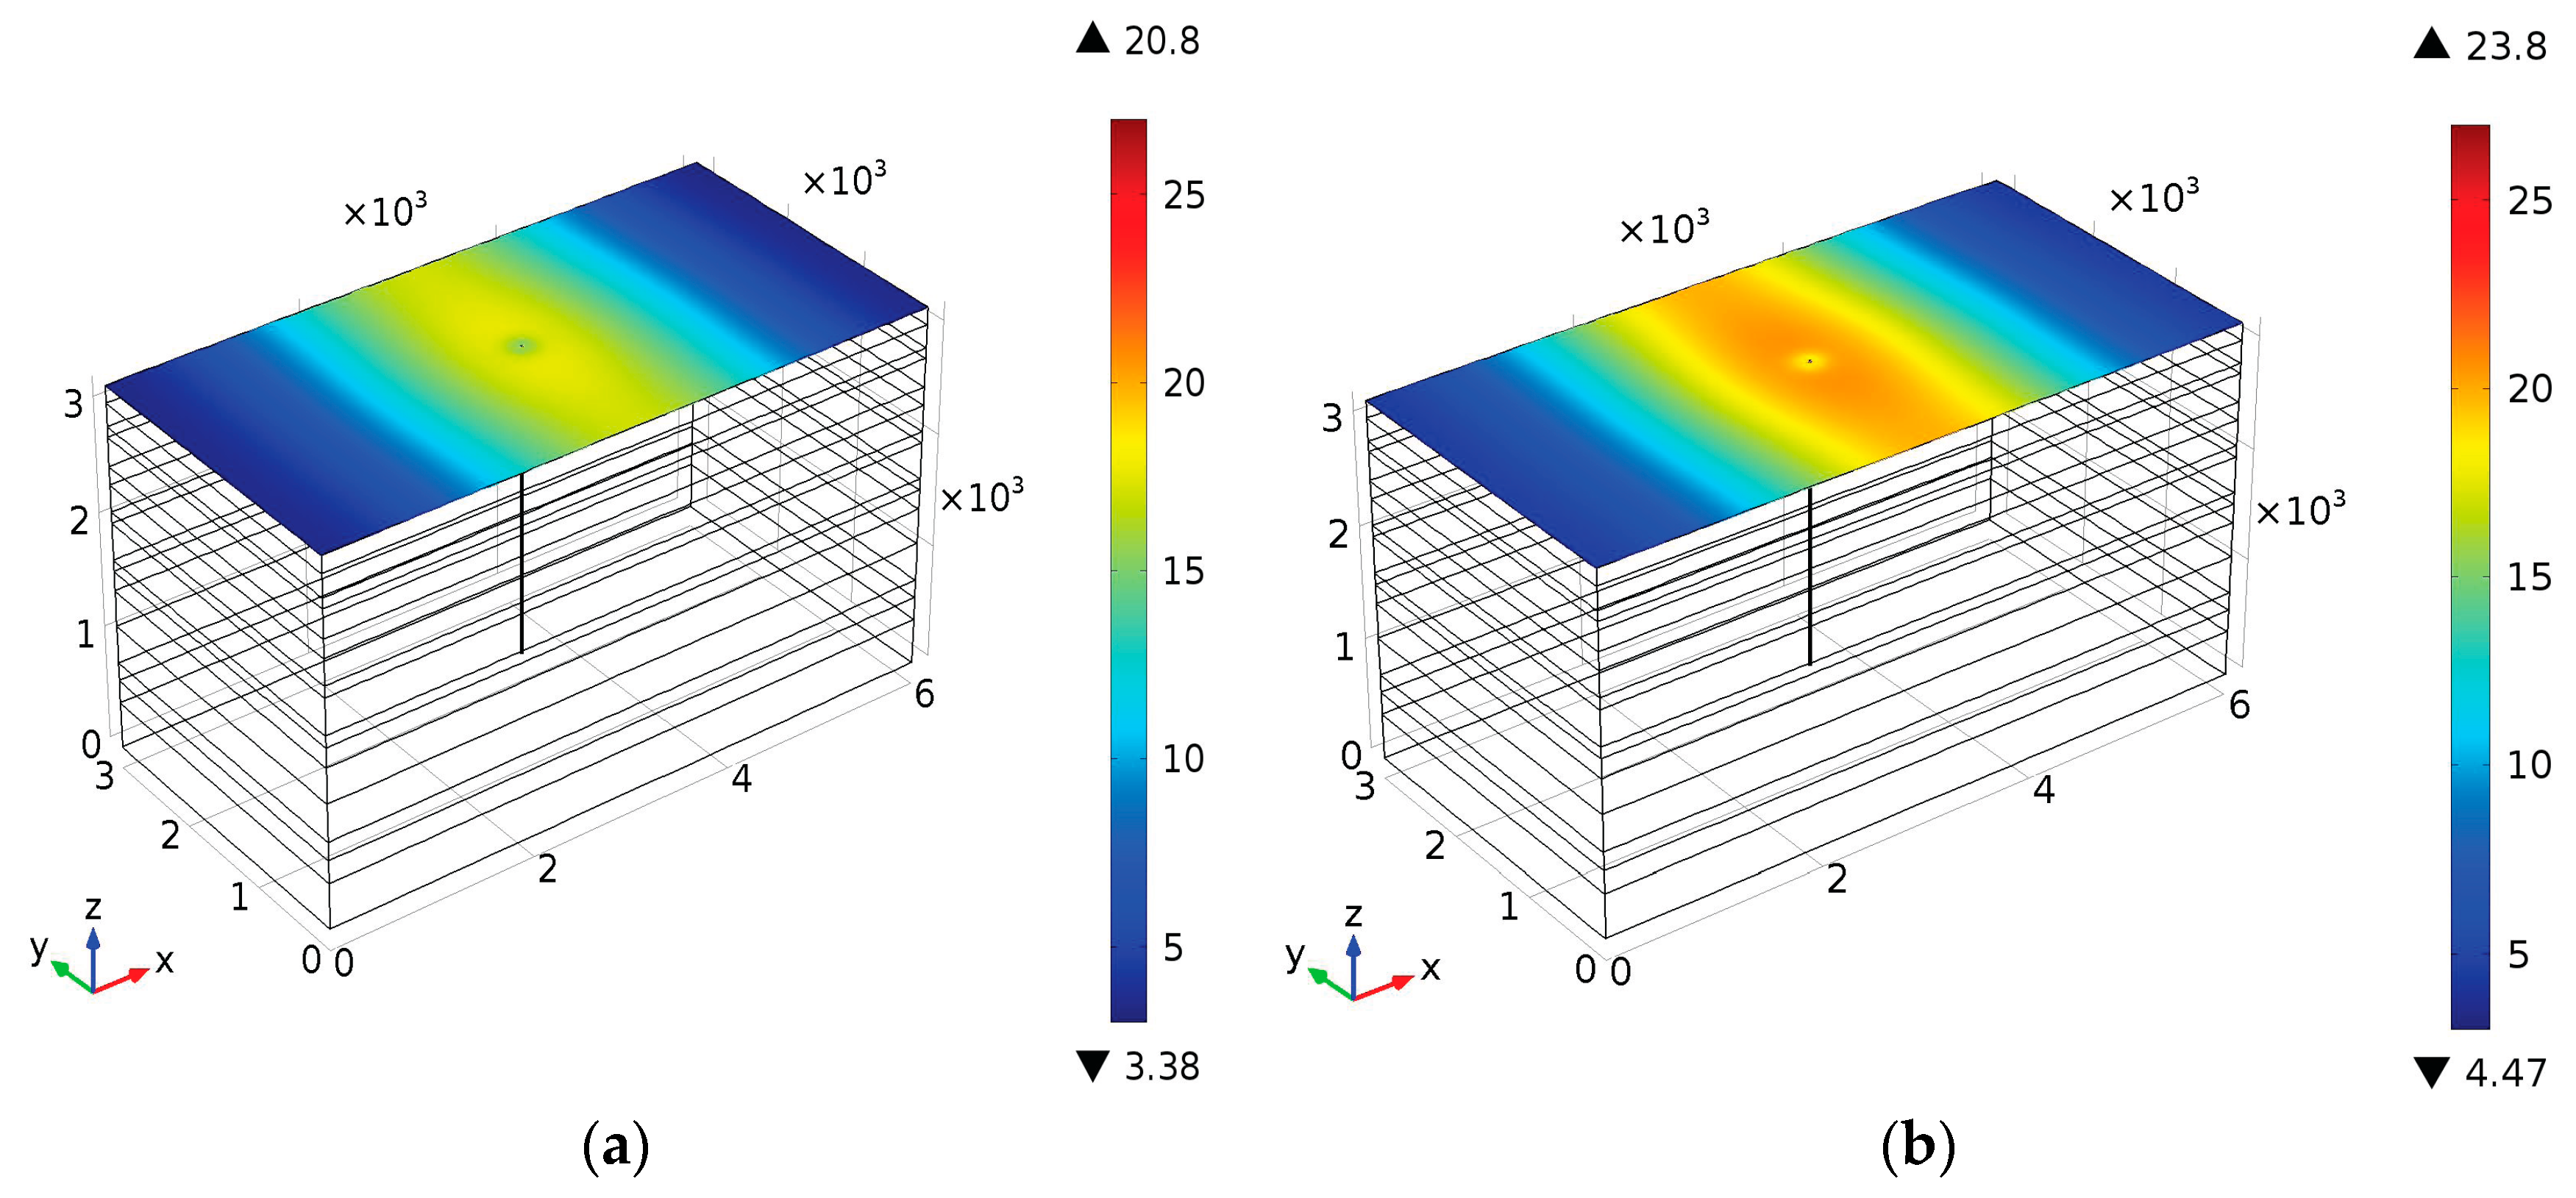
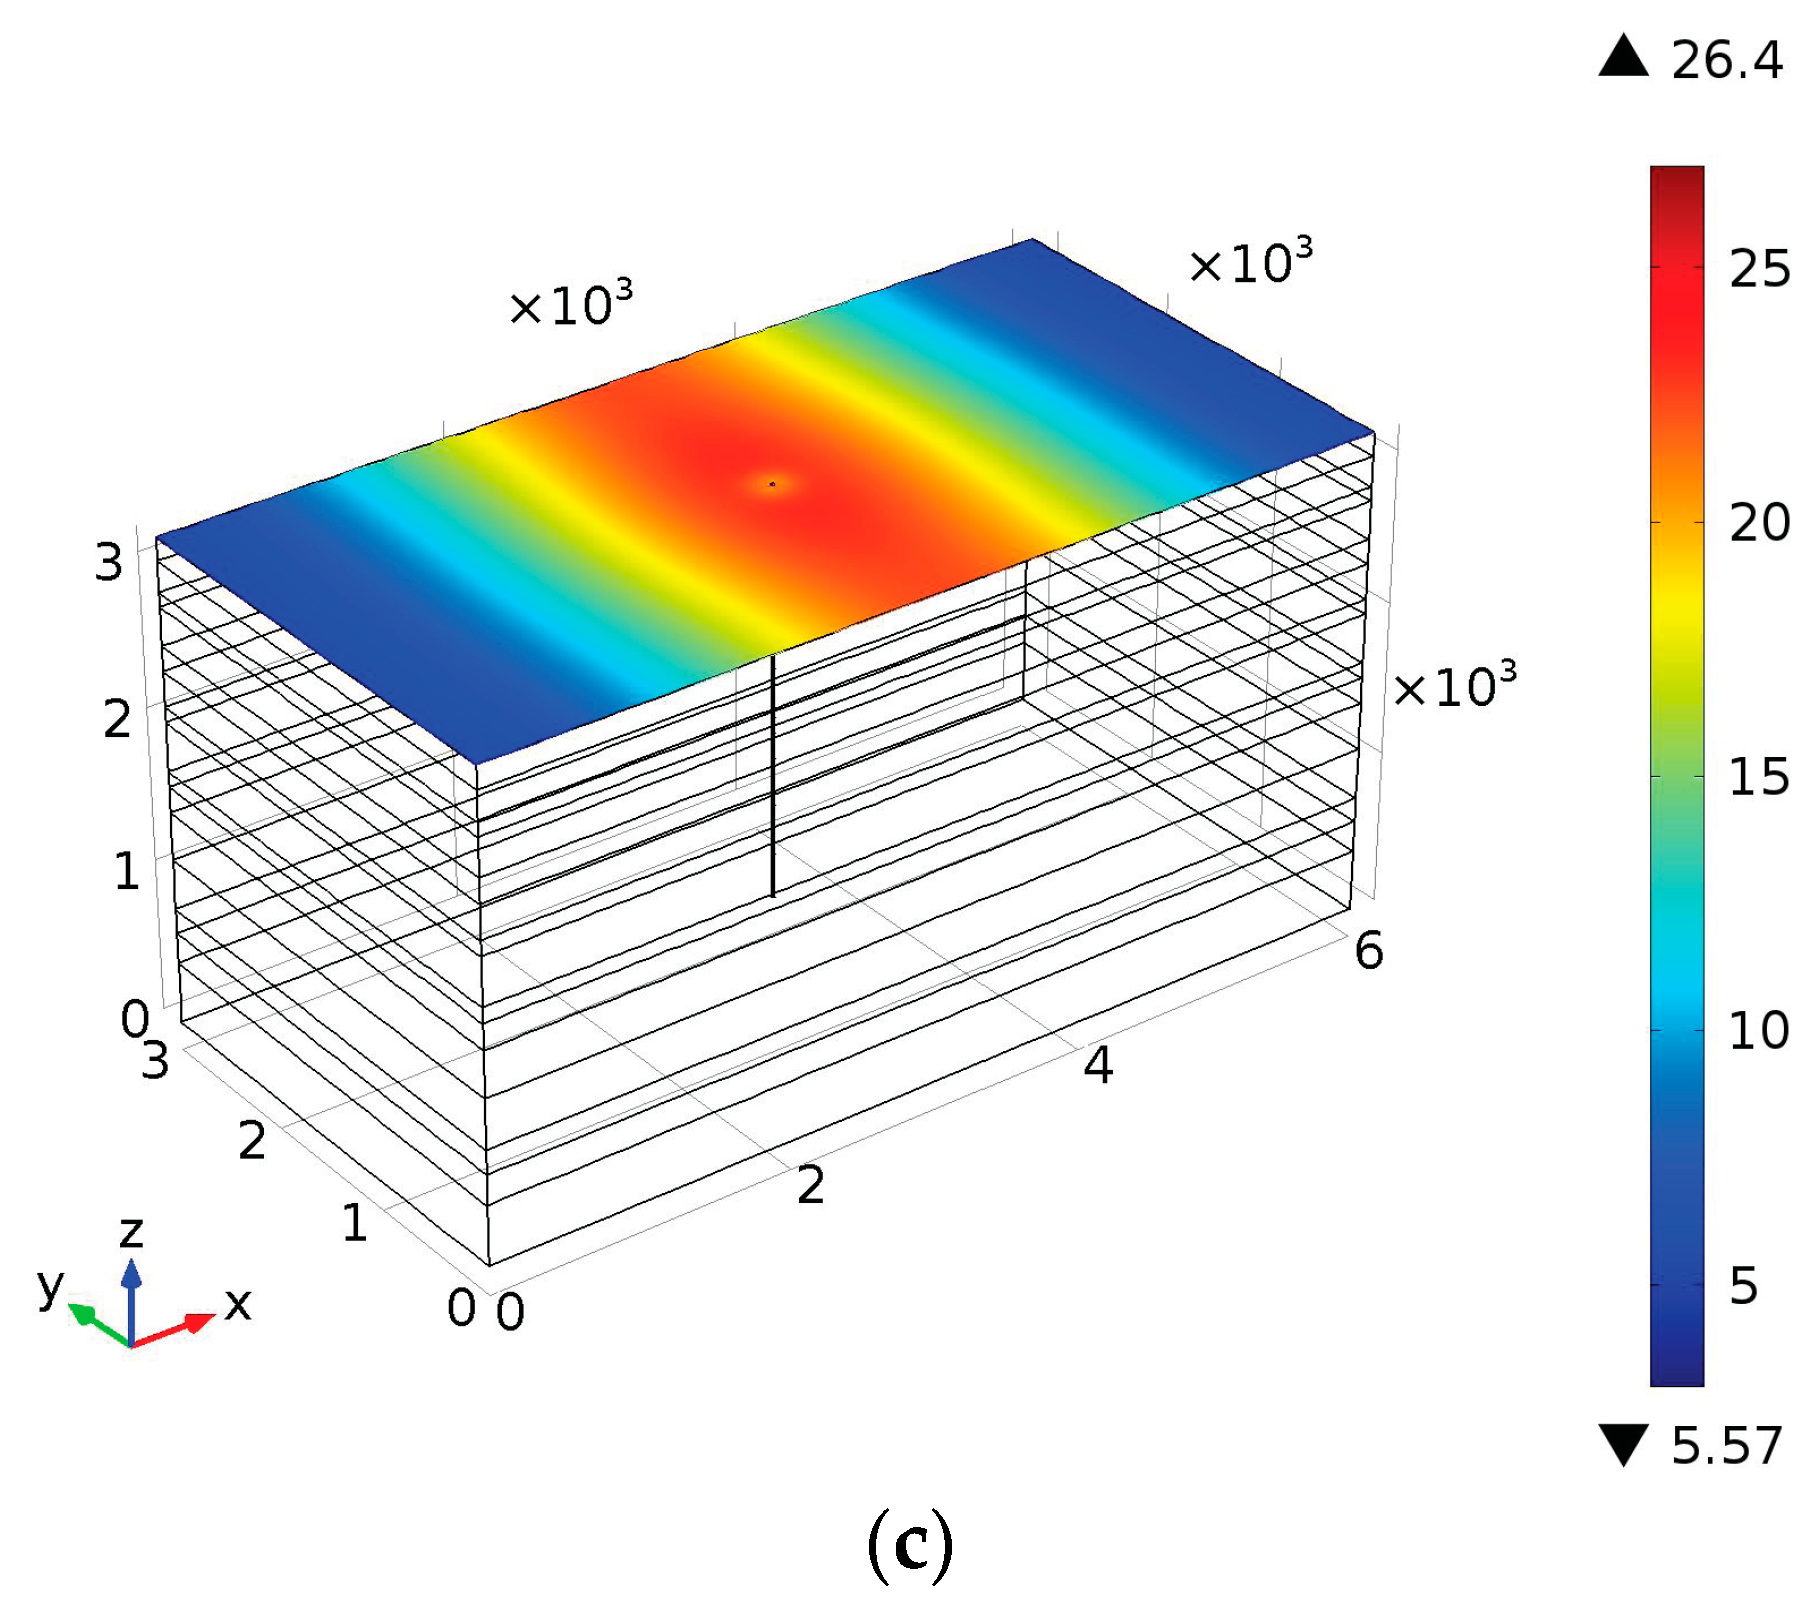
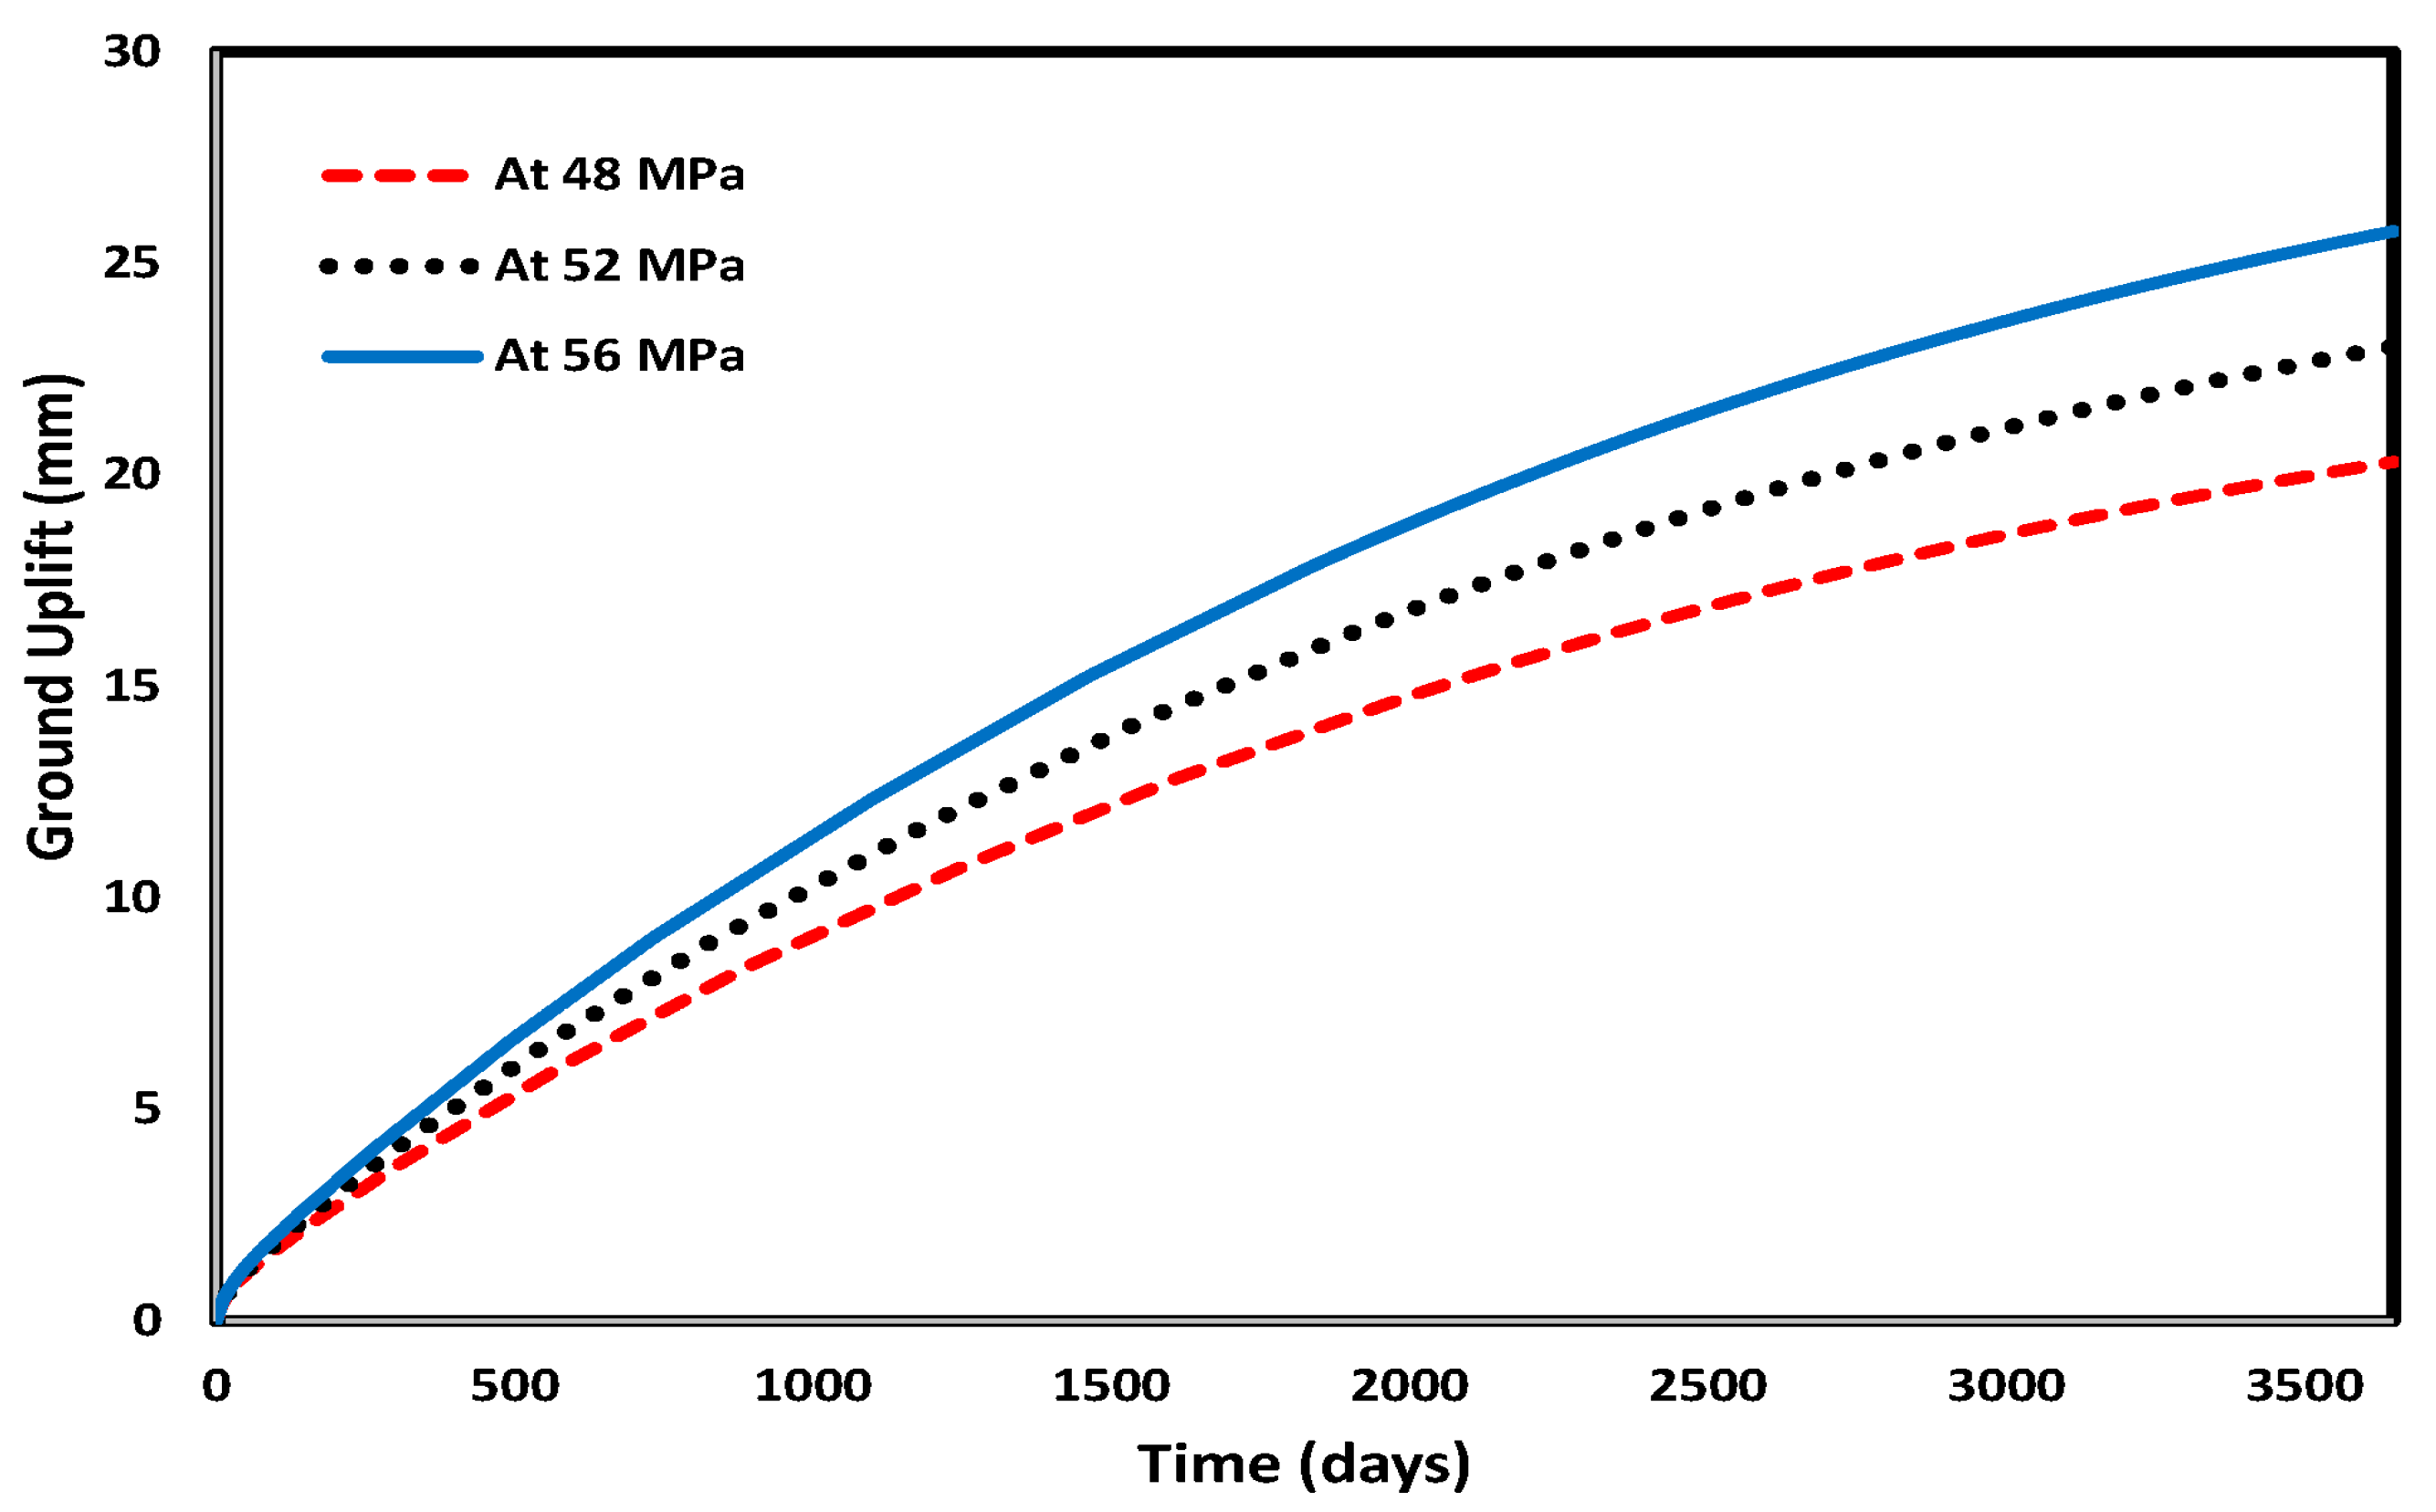
4.2. Ground Vertical Displacement (Uplift)

As CO2 was injected, the reservoir pore pressure increased, thus tending to expand the reservoir. Due to the confinement of the reservoir by the geological layers from all sides, the deformation was very negligible in the horizontal directions and also in the vertical downward direction, but the reservoir could expand in the top vertical direction. As displayed in Figure 7 and Figure 8, the ground uplift continued to increase as the pressurized CO2 was injected into the reservoir. As displayed in Figure 7, the maximum amplitude of the ground uplift existed just above the CO2 injection port. The ground uplift was extended to cover a wider area around the injection port. The vertical ground displacement was basically restricted by the static load exerted by the overburden layers.

4.3. Fault Permeability Variation

Injecting CO2 near a geological fault will increase the pore pressure near the fault plan and will decrease the effective stresses on the fault that keep the fault closed. As the pore pressure was increased with CO2 injection, the fault permeability also increased, but as the pore pressure reached a critical value, the effective stresses became zero or even negative and the fault was opened. The permeability of the fault was suddenly increased to a high value as the fault was opened. The stored CO2 would leak into the overburden layers, thus leading to significant changes in the magnitudes of pore pressure and the ground vertical displacement. The saturation plots in Figure 9 show the CO2 leakage to the Dhruma overburden layer after the activation of the fault. The pore-pressure profile in the Dhruma overburden layer after the fault opening is displayed in Figure 10. Figure 11 shows ground uplift before and after the fault activation. As displayed in Figure 11, the ground vertical displacement attained its maximum value just above the injection port before the fault opening, while after the fault opening, this maximum value shifted to follow the location above the fault opening point.

5. Stability Analysis

The stability analysis during CO2 injection was performed for the case of absence of a fault across the reservoir and caprock as well as for the case with a fault. The stability analysis was performed for preventing the reservoir’s failure and to avoid the possibility of the stored CO2 leakage into the atmosphere or to the overburden layers, in case of the fault activation in the caprock. The intact rock strength is one of the important properties that is needed to predict the behavior of the rock in geomechanics [51]. Various failure criteria are discussed in the literature for predicting the failure behavior of the intact rock. Among the failure criteria available in the literature, some have not considered the intermediate stress while the others have considered the intermediate stress for predicting the failure behavior of the intact rock [52,53,54,55,56,57,58].
In general, in order to reflect the strength of intact rock in geomechanics, six important failure criteria can be listed: (a) Drucker–Prager, (b) Mogi, (c) Modified Wiebols and Cook, (d) Modified Lade, (e) Hoek–Brown [59], and (f) Mohr–Coulomb. In 1977, Lade introduced his criteria for soils [60], and in 1999, Ewy [51] extended this criterion to rock by introducing a cohesion representation parameter. He established this criterion for the study of wellbore stability and it is used in petroleum engineering. Zhou proposed his criteria for modeling the initial form and extension of the borehole breakout around a wellbore prior to Ewy, in 1994. This is an extended form of the criteria of Drucker–Prager. Similar to the Wiebols and Cook criterion, it predicts rock intensity and is also known as the Adjusted Wiebols and Cook criterion [52]. The Mogi criterion is also a major failure criterion. By conducting three different types of tests (confined extension tests, confined compression tests, and biaxial loading tests) on various rock types, Mogi developed his first criterion in 1967. By extending Von Mises’s theory, he introduced his second criterion in 1971. The Hoek–Brown criterion, introduced in 1980, does not consider the intermediate principle stress in the prediction of the failure behavior of the intact rock [59]. Mohr–Coulomb and Drucker–Prager were the most common failure criteria used in the study of wellbore stability prior to the above-mentioned failure criteria. Rock strength was strongly overestimated by the Drucker–Prager failure criterion [51]. The Mohr–Coulomb failure criterion is still used for predicting the failure behavior of the intact rock. The Mohr–Coulomb failure criterion does not consider the intermediate principal stress for predicting the failure behavior of the intact rock; however, due to its simplicity and extensibility to rock masses, the Mohr–Coulomb criterion is the most common rock failure criterion [61].
During the geomechanical modeling in the current study, the injection of CO2 at 56 MPa injection pressure for 10 years causes the maximum magnitude of the pore pressure. In Figure 12a,b, the Mohr–Coulomb model was invoked to assess the failure criterion and examine the stability of the reservoir. The dotted circles in Figure 12a,b are based on the magnitudes of the initial stresses in the reservoir before CO2 injection. The magnitudes of the pore pressure and stresses will be changed with the injection of CO2 into the reservoir. The solid circles in Figure 12a,b display the final stress condition of the reservoir after CO2 injection for 10 years. As displayed in Figure 12a, the solid circle is nearer to the failure envelope as compared to the dotted circle, which means that the reservoir will move closer to the failure envelope with an increase in the magnitude of pore pressure due to CO2 injection. Figure 12a displays that CO2 injection at 56 MPa for a 10-year injection period into the reservoir without fault will not initiate the reservoir’s shear failure. As displayed in Figure 12b, the increase in the pore pressure in the presence of the fault across the caprock causes the activation of the fault in the caprock. The solid circle corresponding to the final stress condition of the reservoir touches the failure envelope. Figure 12b shows that the injection of CO2 at 56 MPa for a 10-year injection period into the reservoir in the presence of the fault will initiate the shear failure of the reservoir and will cause leakage of the stored CO2 into the overburden layers.
In practical applications, it is important to note that the geochemical modeling of various reactions is critical to the success of CO2 sequestration predictions. To apply the developed modeling scheme in real-life situations, one must rely on actual field records, as gleaned from the available logging data. Although, the current model provides good predictions of the geomechanical behavior due to the pore-pressure buildup and its subsequent possible caprock fracturing, leakage to the overburden layers, ground uplift, and safety of the reservoir, the model can be further refined to mimic a real-life application. Such predictions can be enhanced by taking into account the hysteresis resulting from post-injection pathway changes of the capillary pressure and relative permeability [32]. To account for such effects and bring our model to practical fidelity, we are currently extending the modeling scheme to account for the important aspects of the trapping mechanisms.

6. Conclusions

In the current paper, coupled geomechanical modeling was performed during CO2 injection into the deep Minjur reservoir, which has a geological fault that passes across the reservoir and the Marrat shale caprock. The current study deals with the prevention of the reservoir’s shear and tensile failures and with the prevention of the geological fault’s reactivation in the reservoir and caprock. The outcomes of the current study are summarized below:
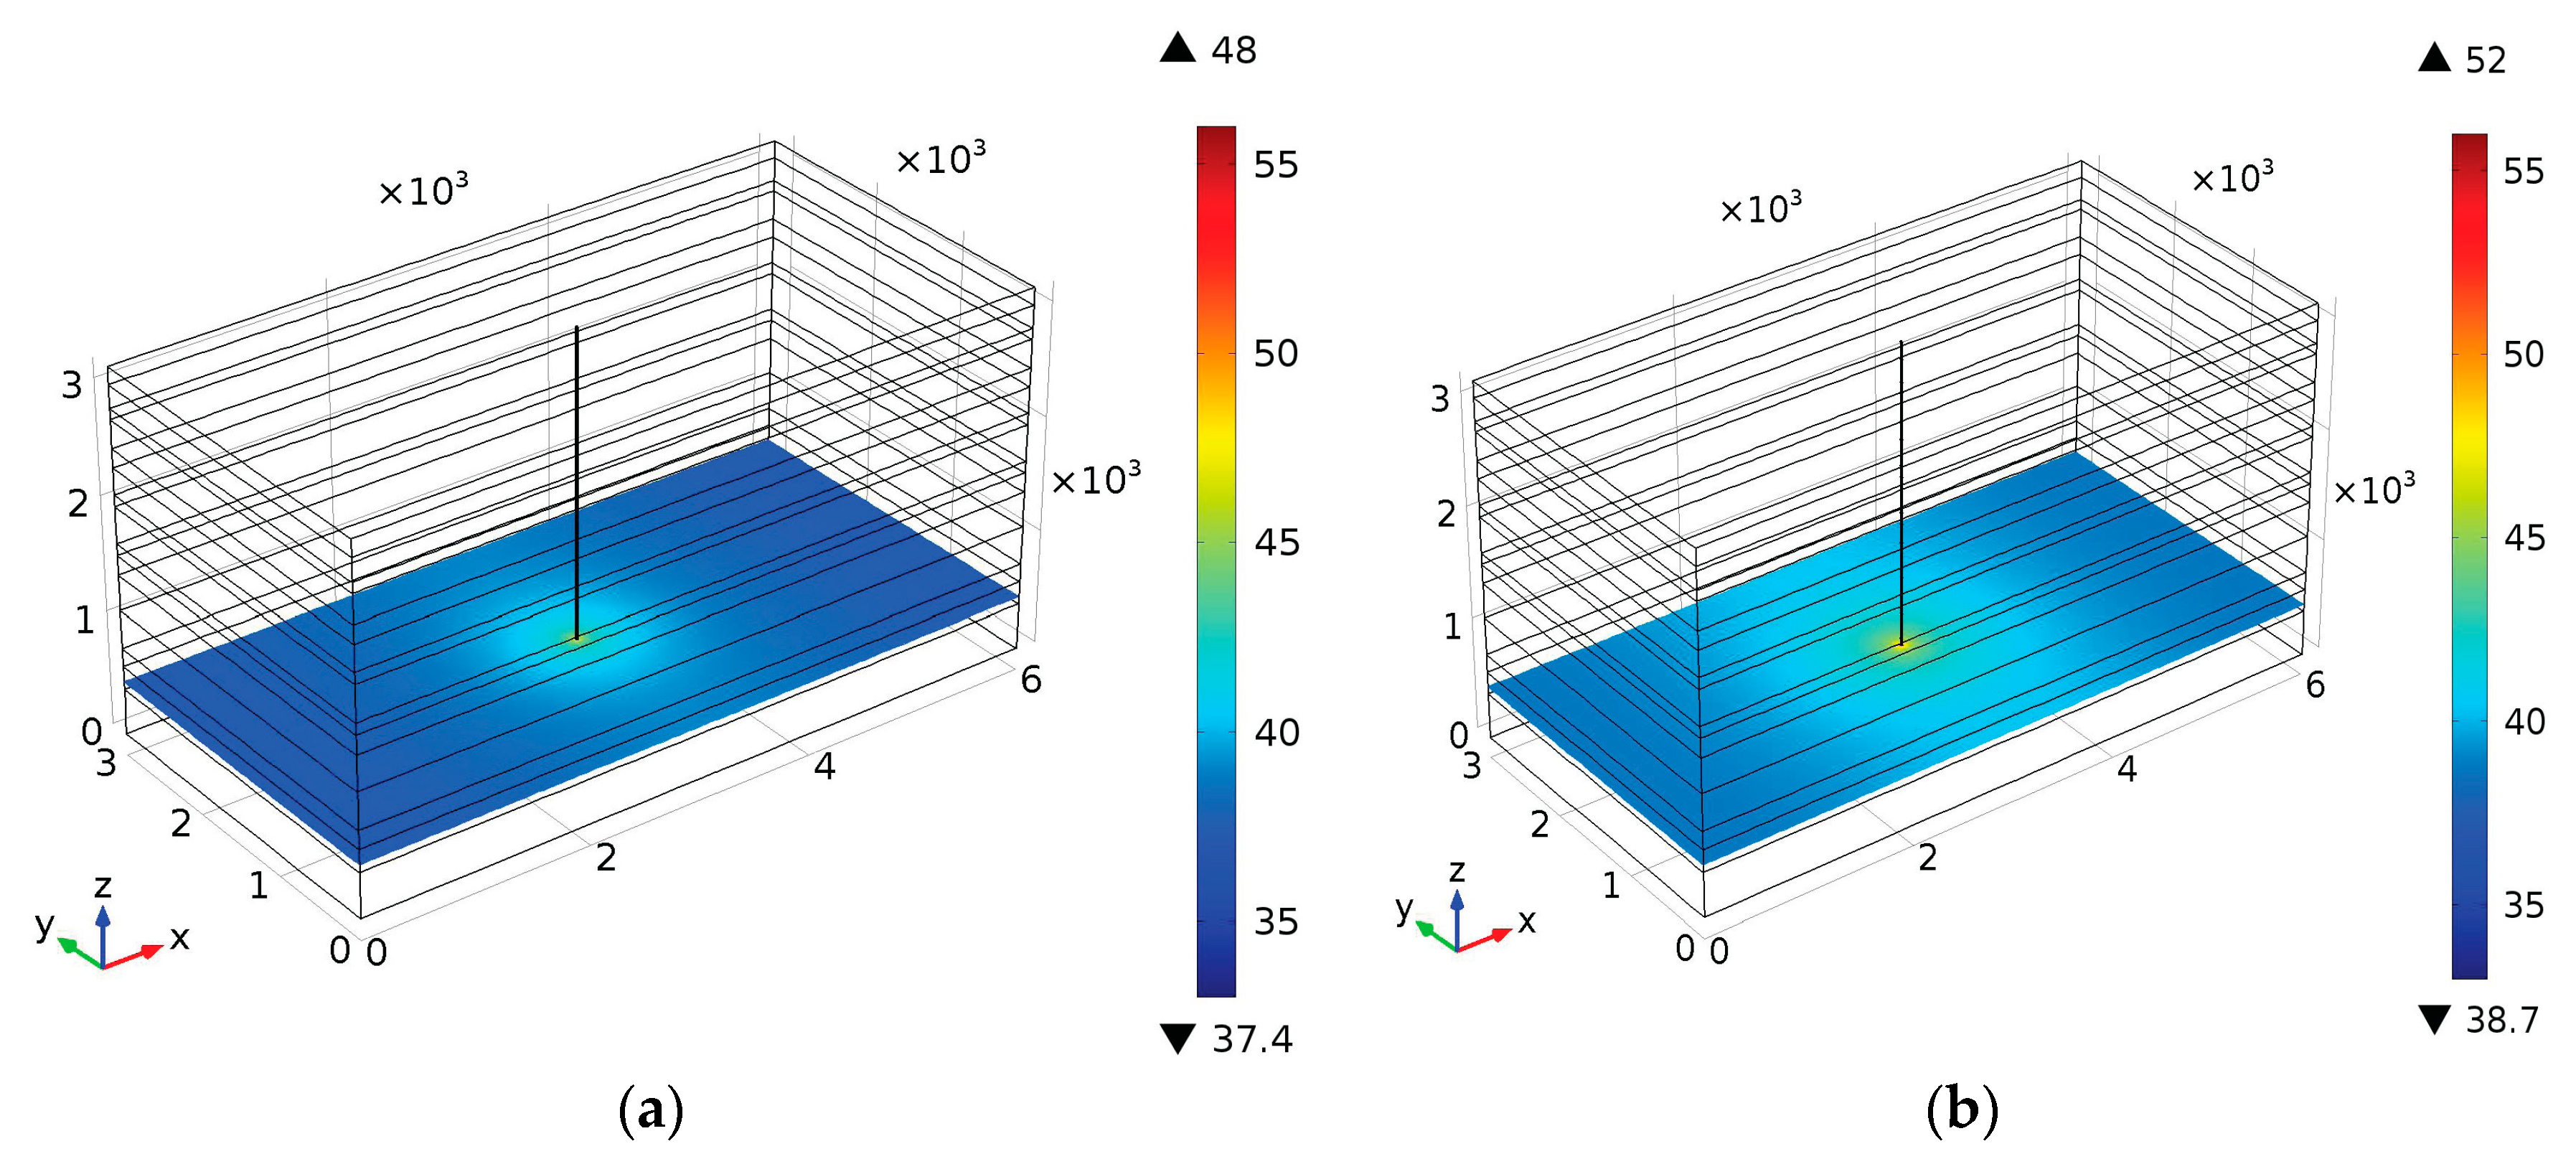
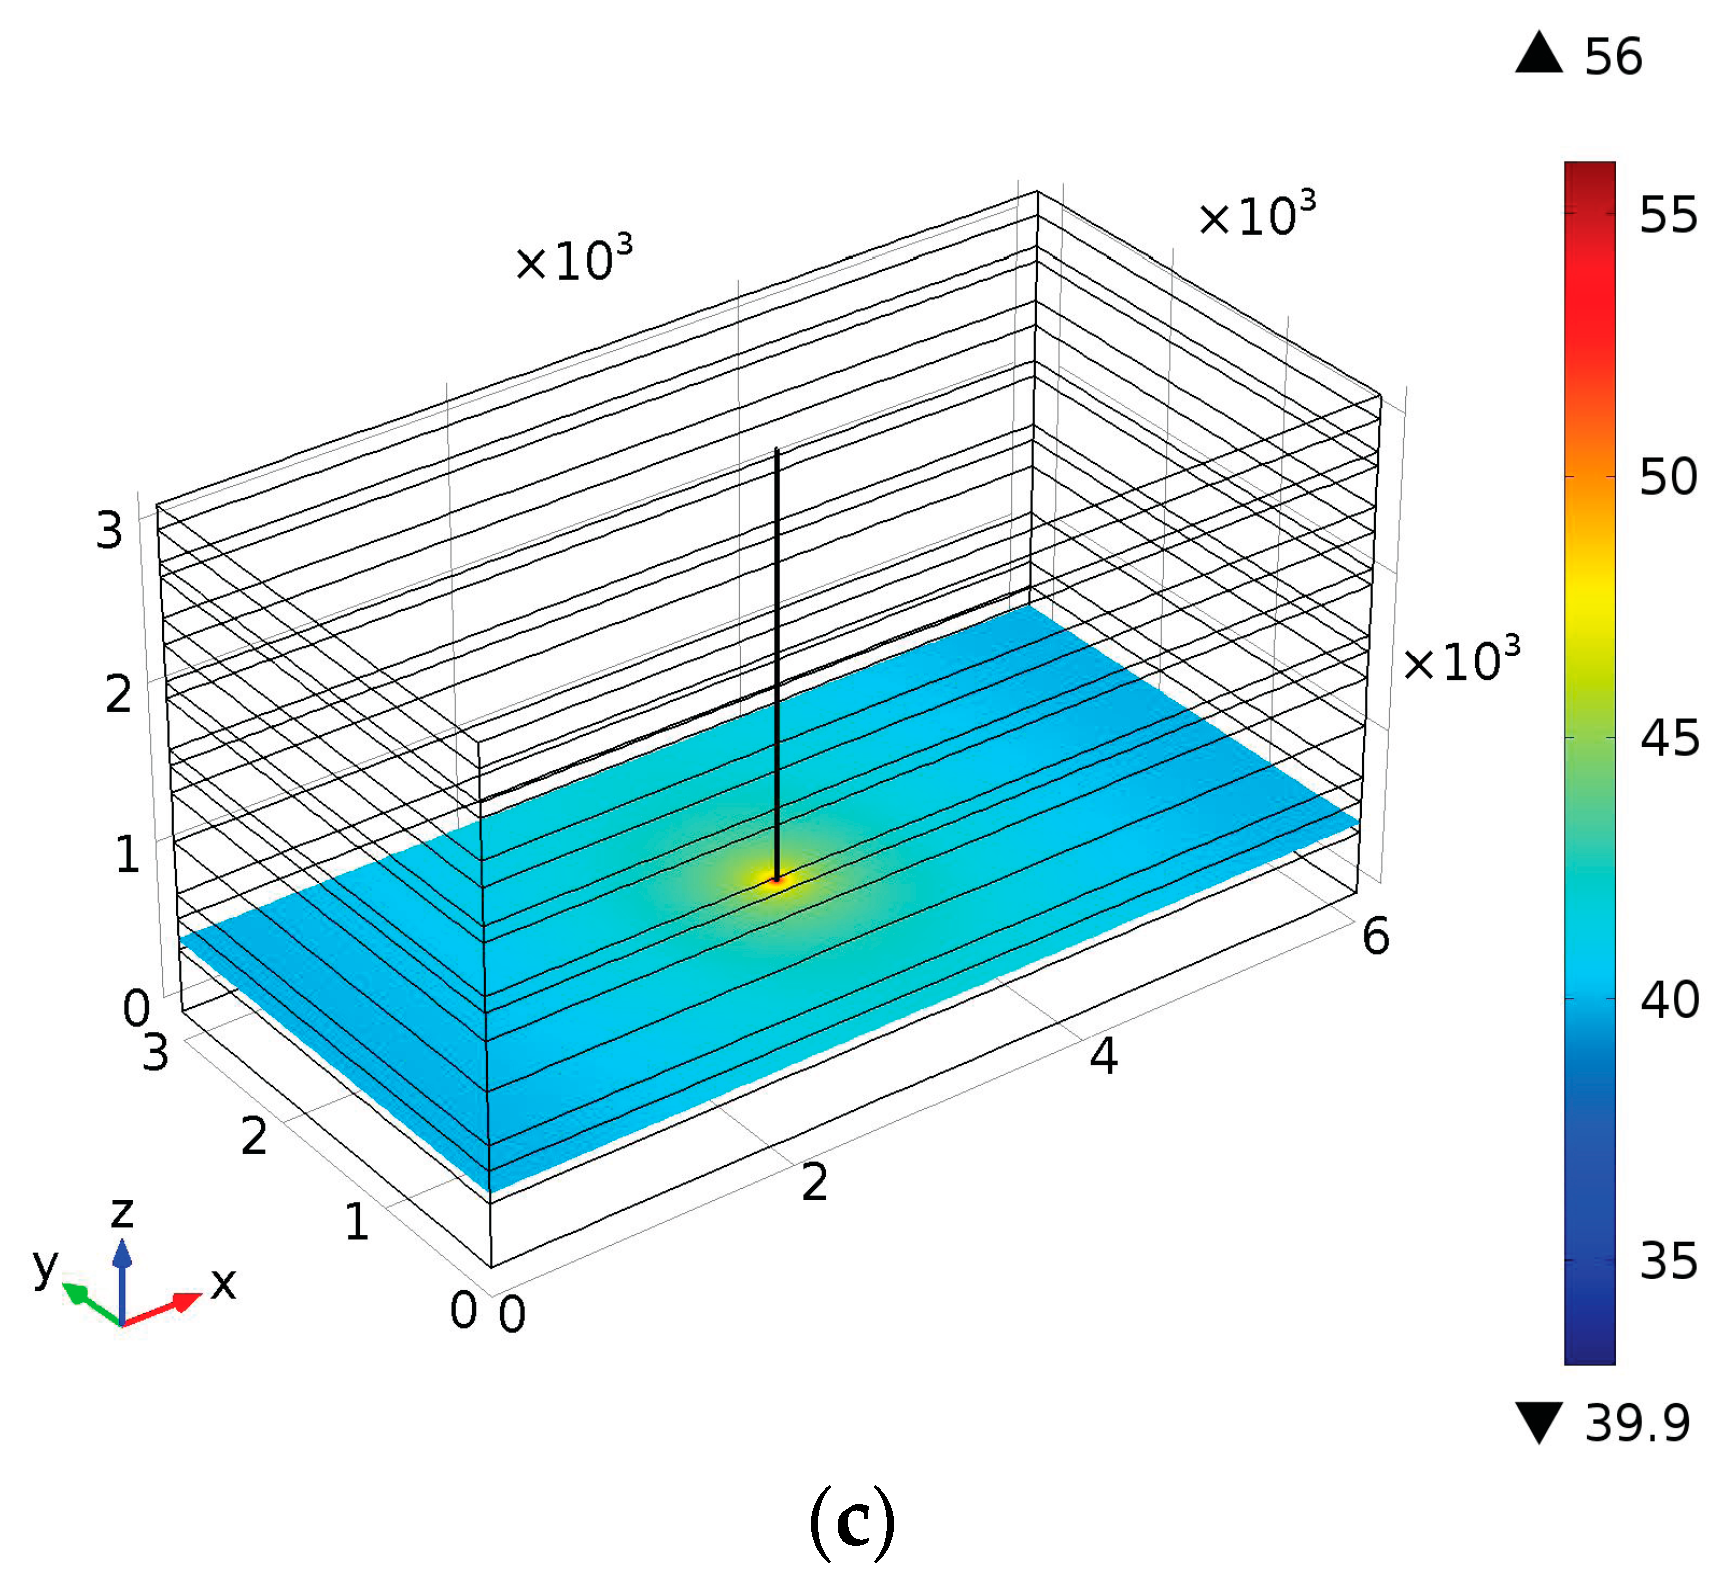
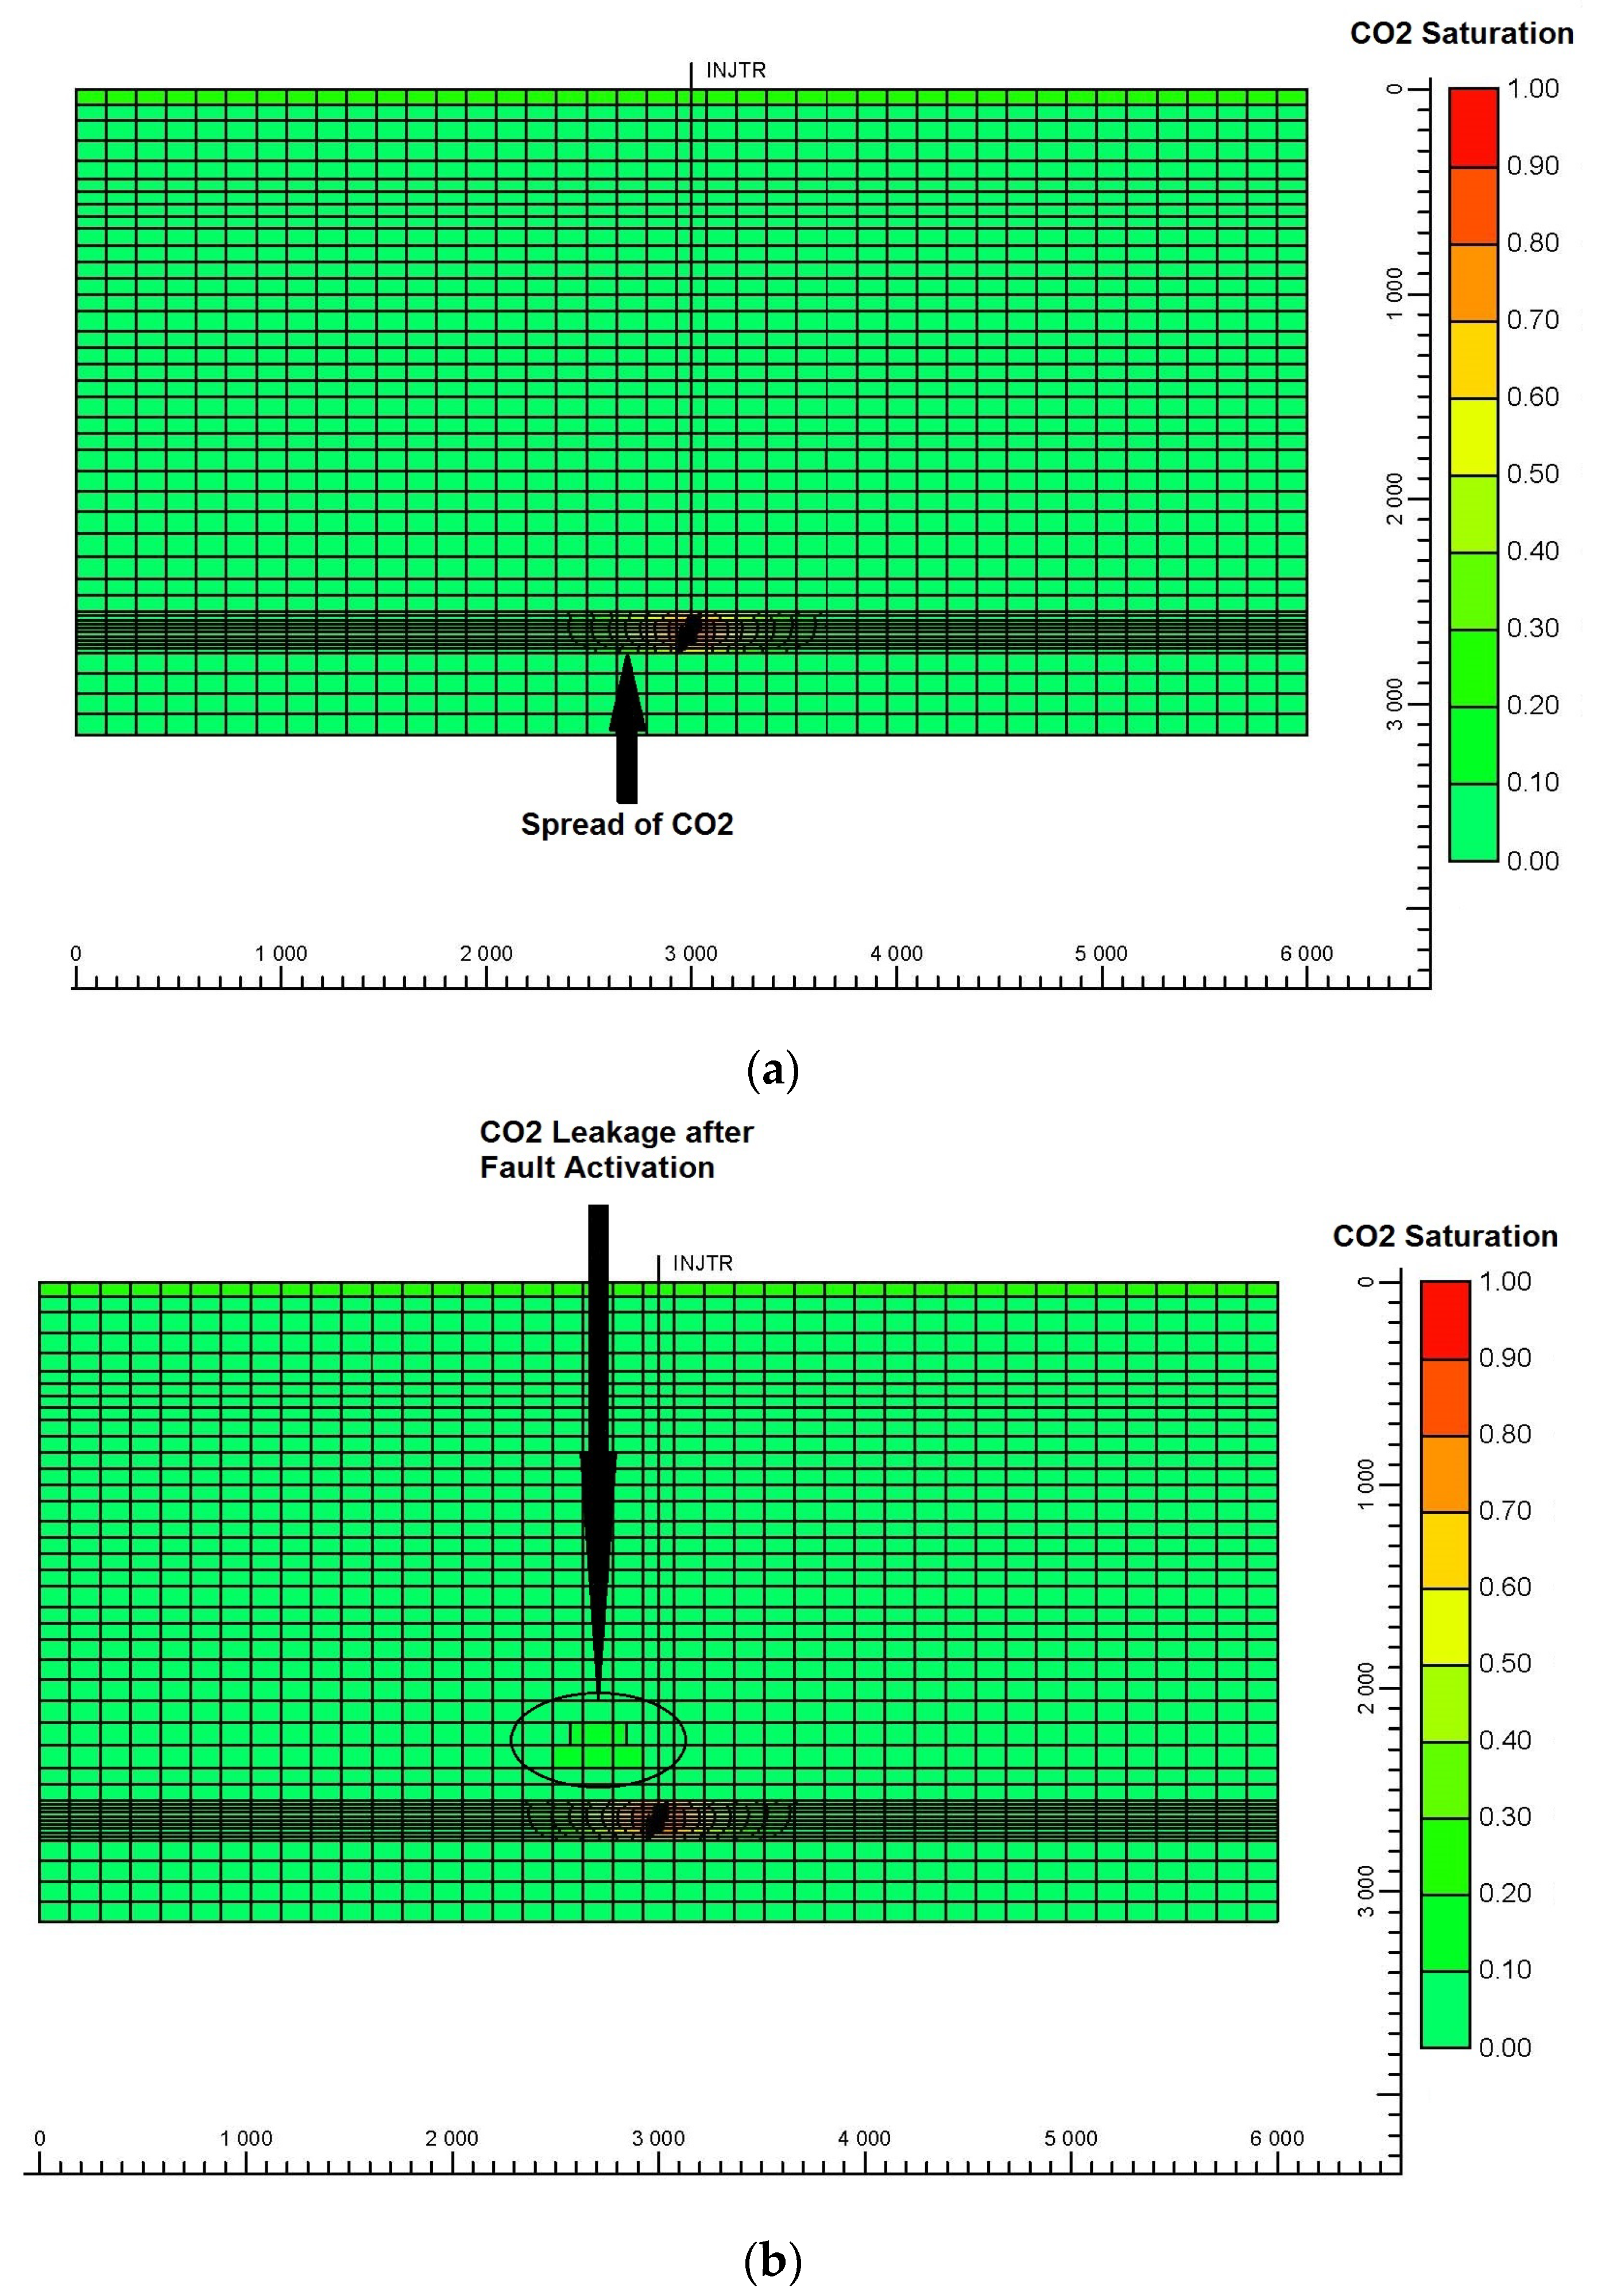
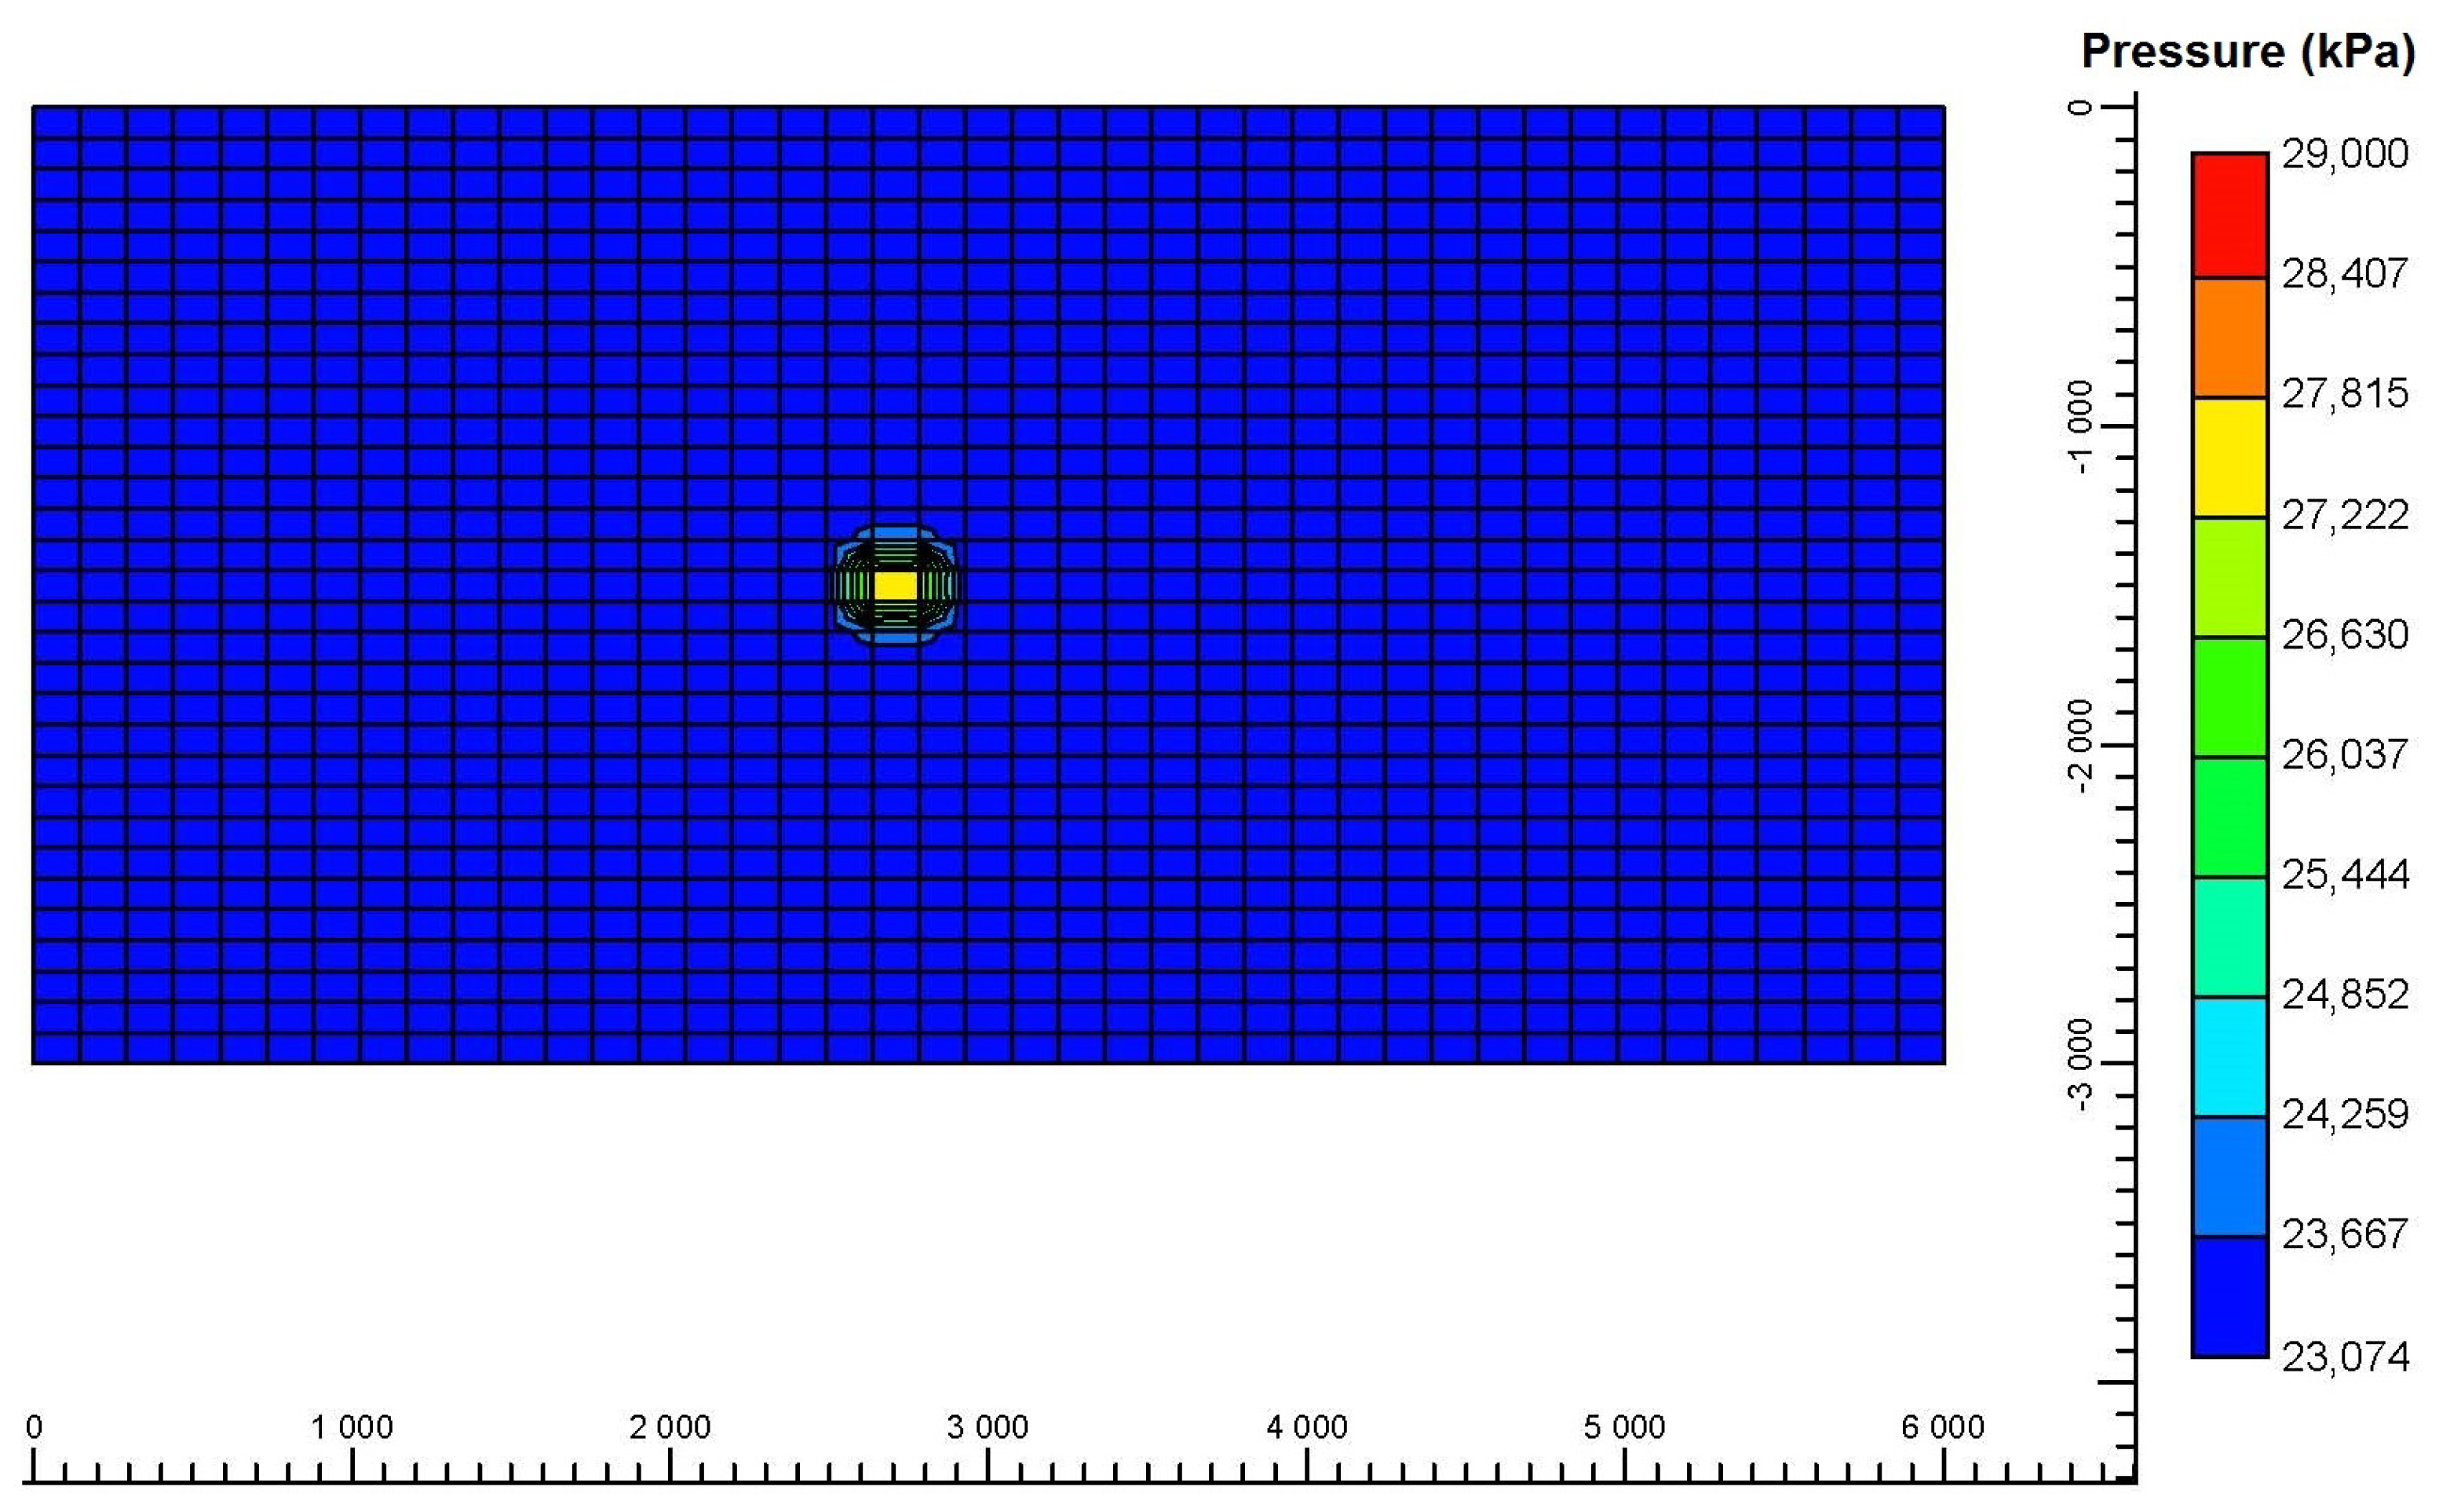
  • As CO2 is injected into the reservoir, the magnitude of the pore pressure increases, with a maximum rate of increase during the initial injection period due to a large pressure difference between the base reservoir and injected CO2. Furthermore, the magnitude of the pressure buildup is also dependent on the variation of the injection pressure. In the presence of geological faults in the reservoir and caprock, the excessive increase in the pore pressure will activate the faults and CO2 will be leaked to the overburden layers. The leakage of the pressurized CO2 will cause an increase in the pressure magnitude of the overburden layers.
  • The injection of CO2 will cause the reservoir’s structure to experience deformations. As CO2 continues to be injected, the reservoir will be volumetrically expanded. The coupling between pore pressure and stresses will cause an increase in stress magnitudes. Due to the restriction of the deformation of the reservoir in horizontal and downward vertical directions, the reservoir movement is only possible in the upward vertical direction. The vertical movement of the reservoir and caprock causes ground uplift during CO2 injection. The increase in the injection depth will be helpful in reducing the magnitude of ground uplift. The ground uplift will be maximum just above the CO2 injection port in the absence of the fault in the reservoir, whereas, in the presence of the geological fault, the ground uplift will be maximum just above the CO2 leakage point.
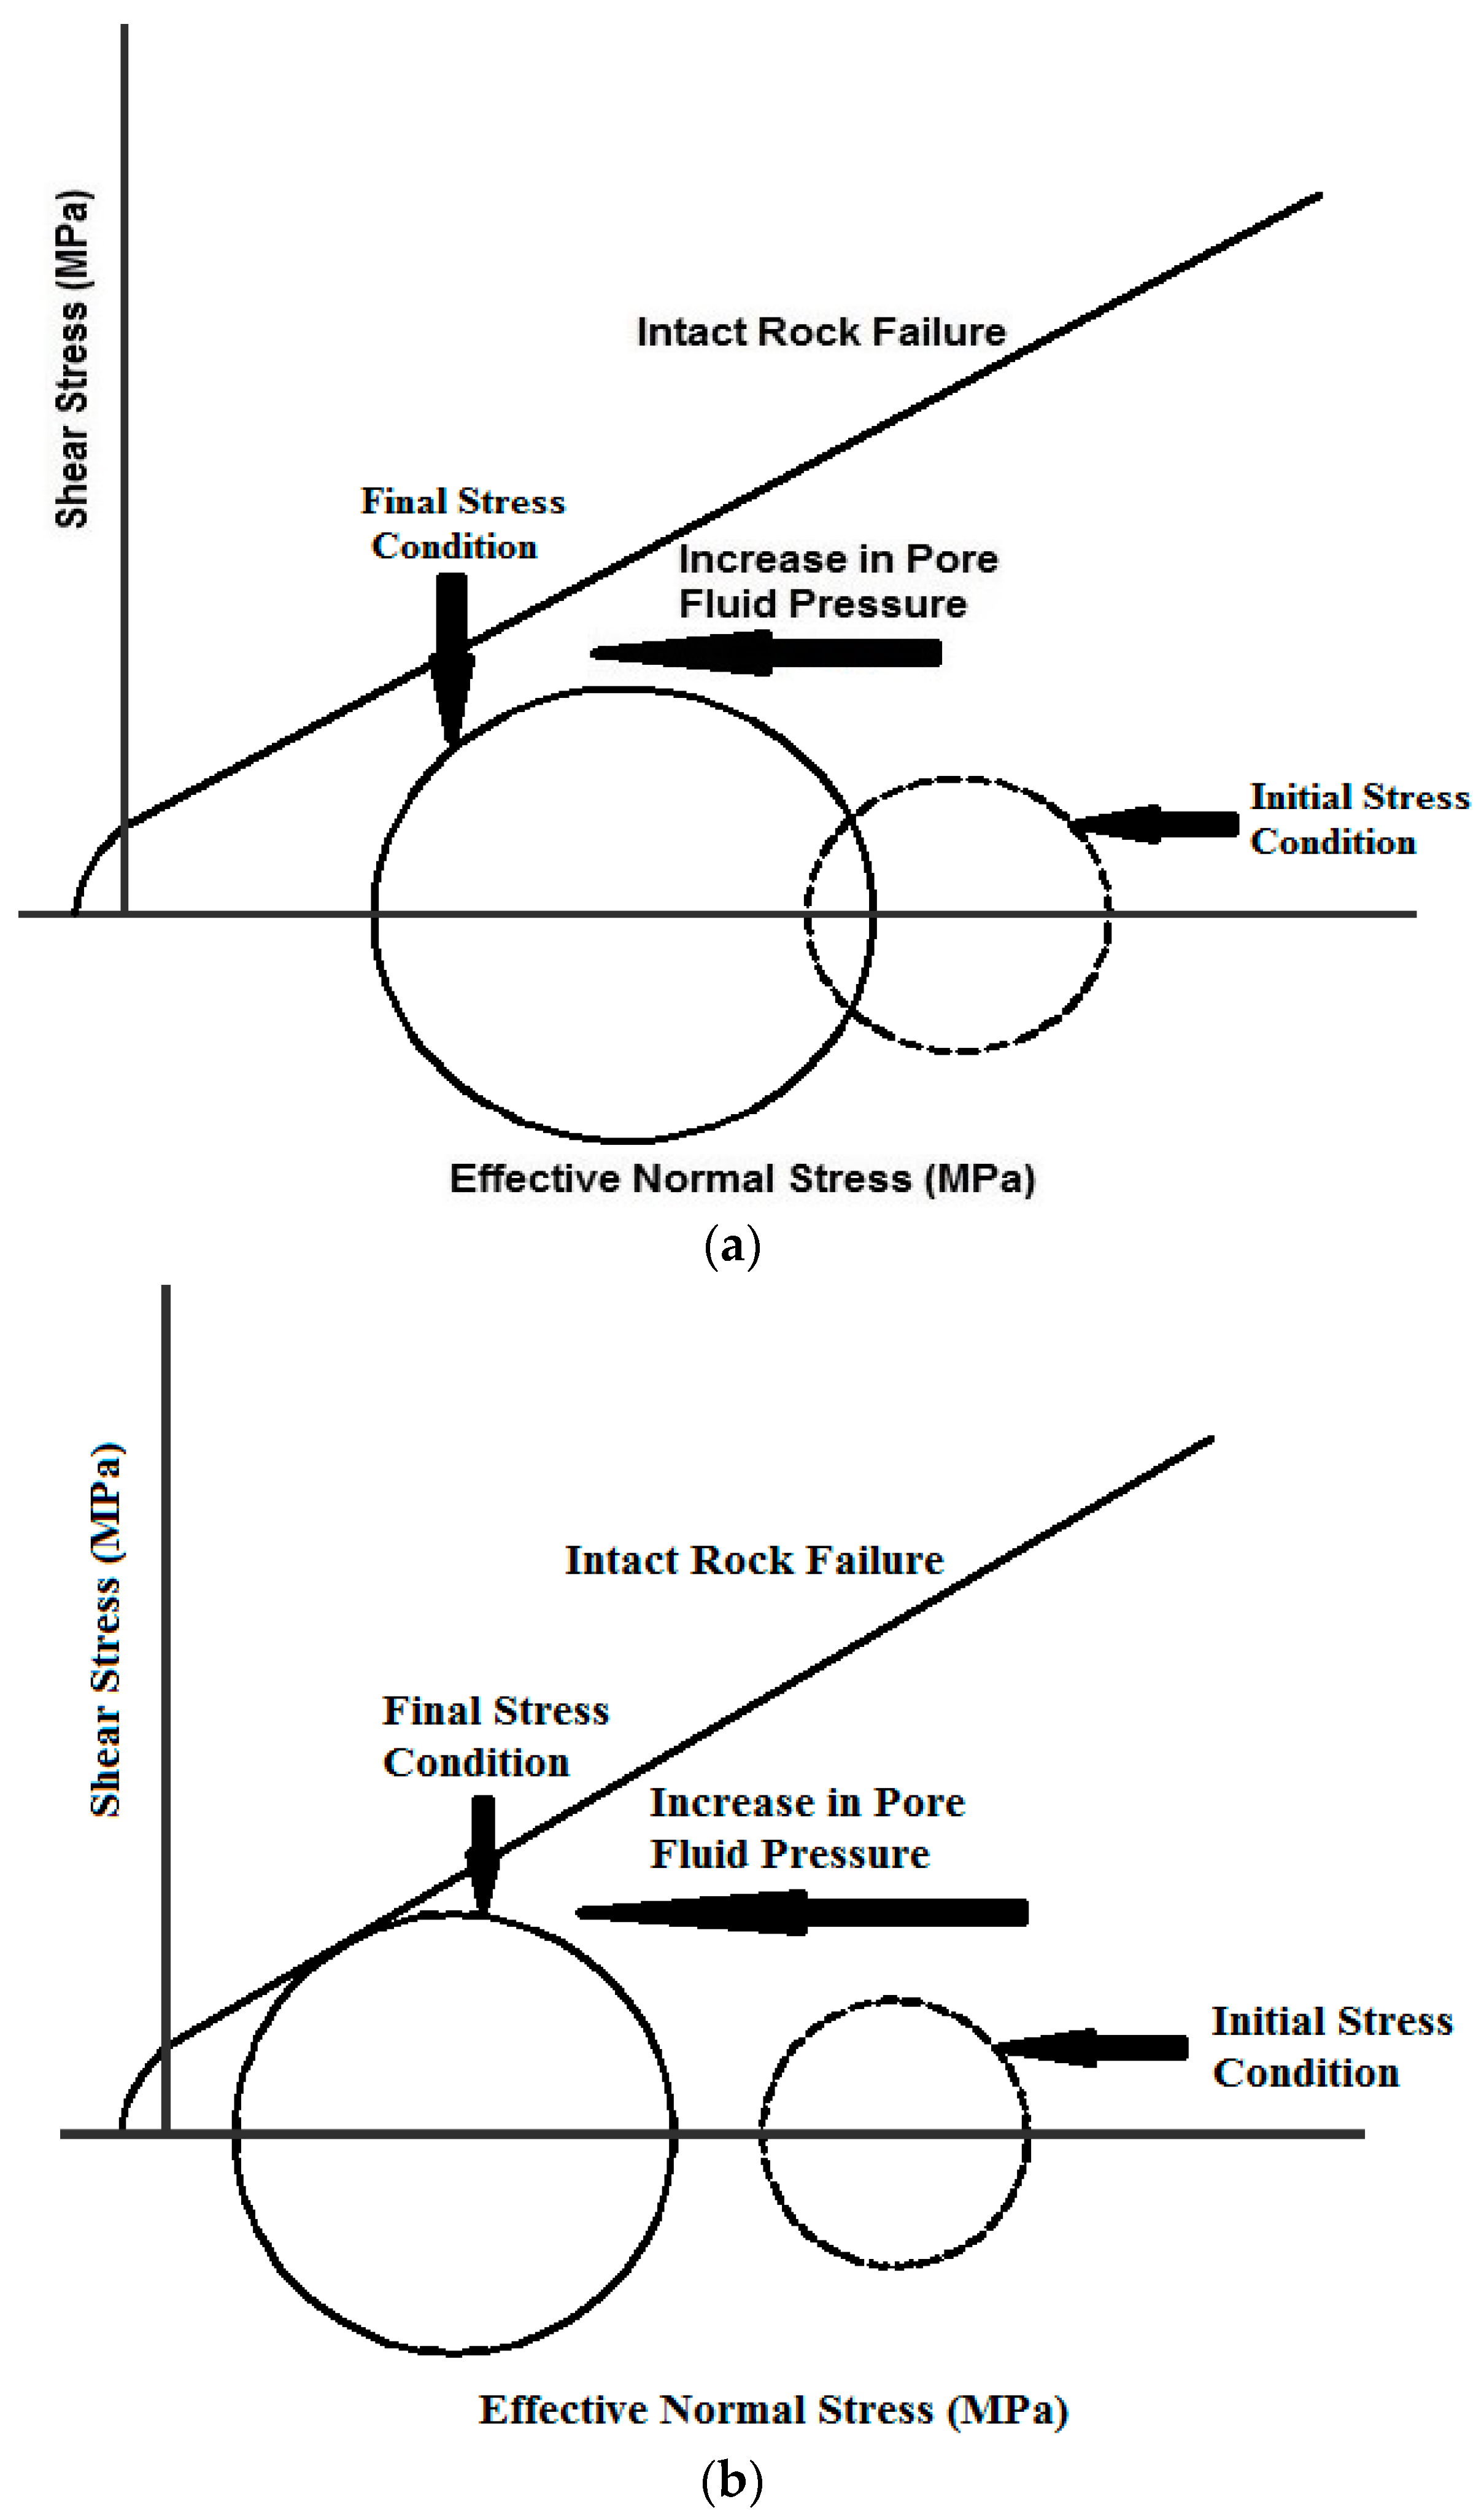
  • The Mohr–Coulomb failure criterion shows that the reservoir’s stability is highly dependent on the excessive increase in pore pressure during CO2 injection. The excessive increase in pore pressure in the absence of geological faults will move the reservoir closer to the failure envelope but in the presence of geological faults, the reservoir will reach to the failure envelope and the faults will be activated.

Author Contributions

Conceptualization, S.K., Y.K., A.A.-S., and S.B.; methodology, S.K., Y.K., A.A.-S., and N.I.; software, S.K., Y.K., and S.B.; validation, S.K., Y.K., N.I., and A.A.-S.; formal analysis, S.K., Y.K., A.A.-S., S.B., and N.I.; investigation, S.K., Y.K., and A.A.-S.; resources, S.K. and A.A.-S.; data curation, S.K., Y.K., A.A.-S., S.B., and N.I.; writing—original draft preparation, S.K., Y.K., A.A.-S., S.B., and N.I.; writing—review and editing, S.K., Y.K., A.A.-S., S.B., and N.I.; visualization, S.K., Y.K., and A.A.-S. All authors have read and agreed to the published version of the manuscript.

Funding

This research received funding from the College of Petroleum Engineering and Geosciences of KFUPM through Startup Fund Grant number SF 18060.

Acknowledgments

The authors appreciate and acknowledge the support provided by King Fahd University of Petroleum and Minerals (KFUPM) by providing all the essential resources to conduct this study.

Conflicts of Interest

The authors declare no conflict of interest.

References

  1. Leung, D.Y.; Caramanna, G.; Maroto-Valer, M.M. An overview of current status of carbon dioxide capture and storage technologies. Renew. Sustain. Energy Rev. 2014, 39, 426–443. [Google Scholar] [CrossRef] [Green Version]
  2. Rubin, E.S.; Davison, J.E.; Herzog, H.J. The cost of CO2 capture and storage. Int. J. Greenh. Gas Control 2015, 40, 378–400. [Google Scholar]
  3. Selma, L.; Seigo, O.; Dohle, S.; Siegrist, M. Public perception of carbon capture and storage (CCS): A review. Renew. Sustain. Energy Rev. 2014, 38, 848–863. [Google Scholar] [CrossRef]
  4. Bahrami, A.; Jamialahmadi, M.; Moghadasi, J.; Alimohammadi, N. Simulation study of carbon dixoide sequestration potential of the Mary Lee coal zone, Black Warrior basin. Environ. Earth Sci. 2013, 70, 2501–2509. [Google Scholar]
  5. Gibbins, J.; Chalmers, H. Carbon capture and storage. Energy Policy 2008, 36, 4317–4322. [Google Scholar] [CrossRef] [Green Version]
  6. Folk, R.L.; Andrews, P.B.; Lewis, D. Detrital sedimentary rock classification and nomenclature for use in New Zealand. N. Z. J. Geol. Geophys. 1970, 13, 937–968. [Google Scholar] [CrossRef] [Green Version]
  7. Pan, P.; Wu, Z.; Feng, X.; Yan, F. Geomechanical modeling of CO2 geological storage: A review. J. Rock Mech. Geotech. Eng. 2016, 8, 936–947. [Google Scholar]
  8. Ringrose, P.; Mathieson, A.; Wright, I.; Selama, F.; Hansen, O.; Bissell, R.; Saoula, N.; Midgley, J. The In Salah CO2 Storage Project: Lessons Learned and Knowledge Transfer. Energy Procedia 2013, 37, 6226–6236. [Google Scholar] [CrossRef] [Green Version]
  9. Rutqvist, J.; Cappa, F.; Rinaldi, A.P.; Godano, M. Modeling of induced seismicity and ground vibrations associated with geologic CO2 storage, and assessing their effects on surface structures and human perception. Int. J. Greenh. Gas Control 2014, 24, 64–77. [Google Scholar] [CrossRef]
  10. Rinaldi, A.P.; Vilarrasa, V.; Rutqvist, J.; Cappa, F. Fault reactivation during CO2 sequestration: Effects of well orientation on seismicity and leakage. Greenh. Gases Sci. Technol. 2015, 5, 645–656. [Google Scholar] [CrossRef]
  11. Birkholzer, J.T.; Cihan, A.; Zhou, Q. Impact-driven pressure management via targeted brine extraction—Conceptual studies of CO2 storage in saline formations. Int. J. Greenh. Gas Control 2012, 7, 168–180. [Google Scholar] [CrossRef] [Green Version]
  12. Martinez, M.J.; Newell, P.; Bishop, J.E.; Turner, D. Coupled multiphase flow and geomechanics model for analysis of joint reactivation during CO2 sequestration operations. Int. J. Greenh. Gas Control 2013, 17, 148–160. [Google Scholar] [CrossRef]
  13. Rutqvist, J.; Birkholzer, J.; Cappa, F.; Tsang, C.-F. Estimating maximum sustainable injection pressure during geological sequestration of CO2 using coupled fluid flow and geomechanical fault-slip analysis. Energy Convers. Manag. 2007, 48, 1798–1807. [Google Scholar] [CrossRef] [Green Version]
  14. Vilarrasa, V.; Carrera, J. Geologic carbon storage is unlikely to trigger large earthquakes and reactivate faults through which CO2 could leak. Proc. Natl. Acad. Sci. USA 2015, 112, 5938–5943. [Google Scholar] [PubMed] [Green Version]
  15. Yamamoto, S.; Miyoshi, S.; Sato, S.; Suzuki, K. Study on Geomechanical Stability of the Aquifer-caprock System During CO2 Sequestration by Coupled Hydromechanical Modelling. Energy Procedia 2013, 37, 3989–3996. [Google Scholar] [CrossRef] [Green Version]
  16. Boosari, S.S.H.; Aybar, U.; Eshkalak, M.O. CO2 storage and sequestration in unconventional shale reservoirs. J. Geosci. Environ. Prot. 2015, 3, 7. [Google Scholar]
  17. Matter, J.M.; Takahashi, T.; Goldberg, D. Experimental evaluation of in situ CO2-water-rock reactions during CO2 injection in basaltic rocks: Implications for geological CO2 sequestration. Geochem. Geophys. Geosystems 2007, 1–19. [Google Scholar] [CrossRef]
  18. Vidas, H.; Hugman, B.; Chikkatur, A.; Venkatesh, B. Analysis of the Costs and Benefits of CO2 Sequestration on the U.S. Outer Continental Shelf; OCS Study BOEM 2012-100; ICF International: Herndon, VA, USA, 2012. [Google Scholar]
  19. Bissell, R.; Vasco, D.; Atbi, M.; Hamdani, M.; Okwelegbe, M.; Goldwater, M. A full field simulation of the in Salah gas production and CO2 storage project using a coupled geo-mechanical and thermal fluid flow simulator. Energy Procedia 2011, 4, 3290–3297. [Google Scholar] [CrossRef] [Green Version]
  20. Davis, E.J. Interpretation of CO2 Sequestration-Induced Surface Deformation over KB-502 at Krechba, Algeria. In Proceedings of the SPE Annual Technical Conference and Exhibition, Denver, CO, USA, 20 October–2 November 2011. [Google Scholar]
  21. Eiken, O.; Ringrose, P.; Hermanrud, C.; Nazarian, B.; Torp, T.A.; Høier, L. Lessons learned from 14 years of CCS operations: Sleipner, In Salah and Snøhvit. Energy Procedia 2011, 4, 5541–5548. [Google Scholar] [CrossRef] [Green Version]
  22. Trupp, M.; Frontczak, J.; Torkington, J. The gorgon CO2 injection project—2012 update. Energy Procedia 2013, 37, 6237–6247. [Google Scholar] [CrossRef] [Green Version]
  23. Vilarrasa, V.; Bolster, D.; Olivella, S.; Carrera, J. Coupled hydromechanical modeling of CO2 sequestration in deep saline aquifers. Int. J. Greenh. Gas Control 2010, 4, 910–919. [Google Scholar] [CrossRef] [Green Version]
  24. Evans, J.P.; Forster, C.B.; Goddard, J.V. Permeability of fault-related rocks, and implications for hydraulic structure of fault zones. J. Struct. Geol. 1997, 19, 1393–1404. [Google Scholar] [CrossRef]
  25. Holzbecher, E. Poroelasticity benchmarking for FEM on analytical solutions. In Proceedings of the 2013 COMSOL Conference in Rotterdam, Rotterdam, The Netherlands, 23–25 October 2013; pp. 1–7. [Google Scholar]
  26. Jourde, H.; Flodin, E.A.; Aydin, A.; Durlofsky, L.J.; Wen, X.-H. Computing permeability of fault zones in eolian sandstone from outcrop measurements. AAPG Bull. 2002, 86, 1187–1200. [Google Scholar] [CrossRef] [Green Version]
  27. Khan, S.; Al-Shuhail, A.; Khulief, Y. Numerical modeling of the geomechanical behavior of Ghawar Arab-D carbonate petroleum reservoir undergoing CO2 injection. Environ. Earth Sci. 2016, 75, 1499. [Google Scholar] [CrossRef]
  28. Khan, S.; Khulief, Y.; Al-Shuhail, A. The effect of injection well arrangement on CO2 injection into carbonate petroleum reservoir. Int. J. Glob. Warm. 2018, 14, 462–487. [Google Scholar]
  29. Nordbotten, J.M.; Celia, M.A.; Bachu, S. Injection and Storage of CO2 in Deep Saline Aquifers: Analytical Solution for CO2 Plume Evolution During Injection. Transp. Porous Media 2005, 58, 339–360. [Google Scholar] [CrossRef]
  30. Rutqvist, J.; Vasco, D.W.; Myer, L. Coupled reservoir-geomechanical analysis of CO2 injection and ground deformations at In Salah, Algeria. Int. J. Greenh. Gas Control 2010, 4, 225–230. [Google Scholar] [CrossRef] [Green Version]
  31. Jia, B.; Tsau, J.S.; Barati, R. A review of the current progress of CO2 injection EOR and carbon storage in shale oil reservoirs. Fuel 2019, 236, 404–427. [Google Scholar] [CrossRef]
  32. Ajayi, T.; Gomes, J.S.; Bera, A. A review of CO2 storage in geological formations emphasizing modeling, monitoring and capacity estimation approaches. Pet. Sci. 2019, 16, 1028–1063. [Google Scholar] [CrossRef] [Green Version]
  33. Siqueira, T.A.; Iglesias, R.S.; Ketzer, J.M. Carbon dioxide injection in carbonate reservoirs—a review of CO2-water-rock interaction studies. Greenh. Gas Sci. Technol. 2017, 7, 802–816. [Google Scholar]
  34. Cao, C.; Liu, H.; Hou, Z.; Mehmood, F.; Liao, J.; Feng, W. A review of CO2 storage in view of safety and cost-effectiveness. Energies 2020, 13, 600. [Google Scholar] [CrossRef] [Green Version]
  35. Bjørnarå, T.I.; Aker, E.; Skurtveit, E. Safe Storage Parameters During CO2 Injection Using Coupled Reservoir-Geomechanical Analysis. In Proceedings of the COMSOL Conference, Milan, Italy, 14–16 October 2009. [Google Scholar]
  36. Curnow, J.S.; Tutuncu, A.N. Coupled geomechanics and fluid flow model for production optimization in naturally fractured shale reservoirs. In Proceedings of the SEG Technical Program Expanded Abstracts, Vancouver, BC, Canada, September 2015; pp. 399–403. [Google Scholar]
  37. Al-Shuhail, A.; Alshuhail, A.A.; Khulief, Y.A.; Salam, S.A.; Chan, S.A.; Ashadi, A.L.; Al-Lehyani, A.F.; Almubarak, A.M.; Khan, M.Z.U.; Khan, S.; et al. KFUPM Ghawar digital viscoelastic seismic model. Arab. J. Geosci. 2019, 12, 245. [Google Scholar] [CrossRef]
  38. Kazemi, H.; Vestal, C.R.; Shank, D.G. An efficient multi component numerical simulator. Soc. Pet. Eng. J. 1978, 18, 355–368. [Google Scholar]
  39. Anjani, K.; Varun, P. The Role of Coupled Geomechanical Modeling in Reservoir Simulation. Calgary, Alberta. 1998. Available online: https://www.cmgl.ca/events/webinar-coupled-geomechanics (accessed on 11 November 2020).
  40. GEM Advanced Compositional Reservoir Simulator: User Guide. Calgary. Available online: https://www.cmgl.ca/gem (accessed on 11 November 2020).
  41. Barton, C.A.; Zoback, M.D.; Moos, D. Fluid flow along potentially active faults in crystalline rock. Geology 1995, 23, 683–686. [Google Scholar] [CrossRef]
  42. Tran, D.; Buchanan, W.L.; Nghiem, L.X. Improved Gridding Technique for Coupling Geomechanics to Reservoir Flow. SPE J. 2010, 15, 64–75. [Google Scholar] [CrossRef]
  43. Sahimi, M. Flow and Transport in Porous Media and Fractured Rock: From Classical Methods to Modern Approaches; Wiley: Weinheim, Germany, 2011. [Google Scholar]
  44. Chowdhury, S.; Al-Zahrani, M. Characterizing water resources and trends of sector wise water consumptions in Saudi Arabia. J. King Saud Univ.-Eng. Sci. 2015, 27, 68–82. [Google Scholar] [CrossRef] [Green Version]
  45. Tan, X.; Konietzky, H. Numerical study of variation in Biot’s coefficient with respect to microstructure of rocks. Tectonophysics 2014, 610, 59–171. [Google Scholar]
  46. Al Ansari, Y.; Fateh, A.; Shehab, A.; Almoulani, G.; Ahmed, A.; Thampi, S. Hanifa-Tuwaiq Mountain Zone: The Edge between Conventional and Unconventional Systems? In Proceedings of the 12th Middle East Geosciences Conference and Exhibition (GEO-2016), Manama, Bahrain, 7–10 March 2016; pp. 1–14. [Google Scholar]
  47. Afifi, A.M. Ghawar: The anatomy of the world’s largest oil field. AAPG Search Discov. 2005. Available online: http://www.searchanddiscovery.com/documents/2004/afifi01/images/affifi01.pdf (accessed on 11 November 2020).
  48. Heidbach, O.; Tingay, M.; Barth, A.; Reinecker, J.; Kurfeß, D.; Müller, B. The 2008 Database Release of World Stress Map Project; Commission for the Geological Map of the World: Paris, France, 2008. [Google Scholar] [CrossRef]
  49. Martin, A.Z. Late Permian to Holocene paleofacies evolution of the Arabian Plate and its hydrocarbon occurrences. GeoArabia 2001, 6, 445–504. [Google Scholar]
  50. Robert, B. Regional depositional history, stratigraphy and palaeo geography of the Shu’aiba. GeoArabia 2007, 12, 135–152. [Google Scholar]
  51. Ewy, R. Wellbore-stability predictions by use of a modified lade criterion. SPE Drill. Complet. 1999, 14, 85–91. [Google Scholar] [CrossRef]
  52. Colmenares, L.B.; Zoback, M.D. A statistical evaluation of intact rock failure criteria constrained by polyaxial test data for five different rocks. Int. J. Rock Mech. Min. Sci. 2002, 39, 695–729. [Google Scholar] [CrossRef]
  53. Fjær, E.; Ruistuen, H. Impact of the intermediate principal stress on the strength of heterogeneous rock. J. Geophys. Res. Solid Earth 2002, 107, 1–42. [Google Scholar] [CrossRef] [Green Version]
  54. Benz, T.; Schwab, R. A quantitative comparison of six rock failure criteria. Int. J. Rock Mech. Min. Sci. 2008, 45, 1176–1186. [Google Scholar] [CrossRef]
  55. Mogi, K. Effect of the intermediate principal stress on rock failure. J. Geophys. Res. 1967, 72, 5117–5131. [Google Scholar] [CrossRef]
  56. Handin, J.; Heard, H.A.; Magouirk, J.N. Effects of the intermediate principal stress on the failure of limestone, dolomite, and glass at different temperatures and strain rates. J. Geophys. Res. 1967, 72, 611–640. [Google Scholar] [CrossRef]
  57. Takahashi, M.; Koide, H. Effect of the intermediate principal stress on strength and deformation behavior of sedimentary rocks at the depth shallower than 2000 m. In Proceedings of the ISRM International Symposium, Pau, France, 30 August–2 September 1989. [Google Scholar]
  58. Chang, C.; Haimson, B. True triaxial strength and deformability of the German Continental Deep Drilling Program (KTB) deep hole amphibolite. J. Geophys. Res. Solid Earth 2000, 105, 18999–19013. [Google Scholar] [CrossRef]
  59. Hoek, E.; Brown, E.T. Empirical strength criterion for rock masses. J. Geotech. Geoenviron. 1980, 106, 1013–1035. [Google Scholar]
  60. Lade, P.V. Elasto-plastic stress-strain theory for cohesionless soil with curved yield surfaces. Int. J. Solids Struct. 1977, 13, 1019–1035. [Google Scholar] [CrossRef]
  61. Mehranpour, M.H.; Kulatilake, P.H.S.W. Comparison of six major intact rock failure criteria using a particle flow approach under true-triaxial stress condition. Geomech. Geophys. Geo-Energy Geo-Resour. 2016, 2, 203–229. [Google Scholar] [CrossRef] [Green Version]
Figure 1. Minjur reservoir with overburden and underlying layers [37].
Sustainability 12 09800 g001
Figure 2. COMSOL model for the Minjur reservoir.
Sustainability 12 09800 g002
Figure 3. Model constructed in CMG-GEM software for the Minjur reservoir.
Sustainability 12 09800 g003
Figure 4. Pore-pressure magnitude after different injection periods: (a) 2 years, (b) 6 years, and (c) 10 years.
Sustainability 12 09800 g004aSustainability 12 09800 g004b
Figure 5. Pore-pressure increase for 10 years of CO2 injection at various injection pressures: (a) 48 MPa, (b) 52 MPa, and (c) 56 MPa.
Sustainability 12 09800 g005
Figure 6. Pore-pressure buildup near the injection point over 10 years of CO2 injection at various injection pressures.
Sustainability 12 09800 g006
Figure 7. Ground uplift after 10 years of CO2 injection at various injection pressures: (a) 48 MPa, (b) 52 MPa, and (c) 56 MPa.
Sustainability 12 09800 g007aSustainability 12 09800 g007b
Figure 8. Ground uplift near the injection point over 10 years of CO2 injection at various injection pressures.
Sustainability 12 09800 g008
Figure 9. CO2 saturation plots (a) before fault activation and (b) after fault activation.
Sustainability 12 09800 g009
Figure 10. Pore pressure in the Dhruma overburden layer after fault opening.
Sustainability 12 09800 g010
Figure 11. Magnitude of ground uplift (a) before fault opening, (b) after partial opening of the fault, and (c) after complete opening of the fault.
Sustainability 12 09800 g011
Figure 12. Stability analysis of the Minjur reservoir before (dotted circle) and after (solid circle) 10 years of CO2 injection at a pressure of 56 MPa (a) in the absence of fault and (b) in the presence of fault.
Sustainability 12 09800 g012
Table 1. Various properties of the Minjur reservoir [37,44,45,46].
Input ParametersFor Reservoir
Initial Permeability, kf (10−15 m2)0.7
Dynamic   Viscosity ,   μ   ( 10 5 Pa . s ) 1.84
Young’s Modulus, E (GPa)50.4
Rock   Density ,   ρ   ( Kg / m 3 )2472
Biot   Coefficient ,   α 0.8
Bulk Modulus, K (GPa) 40.6
Initial   Porosity ,   m 0.15
Shear Modulus, G (GPa)18.8
Publisher’s Note: MDPI stays neutral with regard to jurisdictional claims in published maps and institutional affiliations.

