Article

Calculation Methods of Emission Factors and Emissions of Fugitive Particulate Matter in South Korean Construction Sites

1
Department of Architectural Engineering, Hanyang University, 55 Hanyangdaehak-ro, Sangrok-gu, Ansan 15588, Korea
2
Department of Smart City Engineering, Hanyang University, 55 Hanyangdaehak-ro, Sangrok-gu, Ansan 15588, Korea
*
Authors to whom correspondence should be addressed.
Sustainability 2020, 12(23), 9802; https://doi.org/10.3390/su12239802
Submission received: 21 October 2020 / Revised: 19 November 2020 / Accepted: 22 November 2020 / Published: 24 November 2020
(This article belongs to the Section Environmental Sustainability and Applications)

Abstract

:
Recently, efforts to effectively reduce particulate matter by identifying its sources and trends have become necessary due to the sustained damage it has caused in East Asia. In the case of South Korea, damage due to fugitive dust generated at construction sites in densely populated downtown areas is significant, and particulate matter in such fugitive dust directly influences the health of nearby residents and construction workers. Accordingly, the purpose of the present study was to develop a method for calculating emission factors for PM10 and PM2.5 emission amounts in the fugitive dust generated in construction sites and to derive emission amount trends for major variables to predict the amounts of generated particulate matter. To this end, South Korean emission factors for PM10 and PM2.5 for different construction equipment and activities that generate fugitive dust were derived and a method for calculating the amount of particulate matter using the derived emission factors was proposed. In addition, the calculated total emissions using these factors were compared to those calculated using construction site fugitive dust equations developed for the United States, Europe, and South Korea, and the trend analysis of total emissions according to the major emission factor variables was conducted.

1. Introduction

Damage caused by particulate matter accompanied by rapid economic growth in the East Asia region has emerged as a significant problem [1,2,3,4,5,6,7,8]. Particulate matter having a size < 10 μm (PM10), when inhaled, causes physical damage such as increased morbidity in patients with pulmonary disease, reduced lung function, and increased incidences of cardiovascular diseases; these health conditions become more severe when the size of the inhaled particles is <2.5 μm (PM2.5) [9,10,11,12,13,14]. There are several sources of such particulate matter, and the construction sector is a major contributor [15]. According to the study by Reff et al., unpaved roads and construction sites (dust from which significantly influences the generation of fugitive dust during construction work) were found to be respectively the first and eighth among a total of 84 particulate matter (PM) emission source categories in the United States, thereby implying that the generation of PM due to construction is significant [15]. This means that residents near construction sites and construction workers could be exposed to serious health risks associated with PM.
In South Korea, the number of civil complaints related to fugitive dust generated in industrial sites from 2011 to 2015 was approximately 89,000. Approximately 90% (79,000 cases) of the complaints were about fugitive dust generated in construction sites, which reflects the urgent need for research on construction site particulate matter [16,17]. However, currently only prevention measures have been proposed for fugitive dust in construction sites, with no standards formulated for emission amount regulation, despite the seriousness of the problem; a calculation method to establish the emission regulation standard is lacking [18].
The Midwest Research Institute (MRI) in the US and the European Environment Agency (EEA) proposed calculation formulas to determine the PM emissions in construction sites depending on the use of the structure, based on the emission sources for the construction operation of the US EPA [19,20]. The National Institute of Environmental Research (NIER) of South Korea also proposed a similar formula that calculates PM10 in fugitive dust in construction sites. However, these calculations are based only on the construction period and size, and consequently, calculations reflecting various construction situations are limited.
Emission factors should be developed separately for dust-generating equipment and activities, and calculation methods that appropriately use these emission factors should be established. Accordingly, the purpose of this study was to develop a method for calculating the emission factors and total emissions of PM10 and PM2.5 in the fugitive dust generated from various construction sites, as well as to derive the emission trend for major variables by predicting the amount of particulate matter generated due to fugitive dust in urban construction sites in South Korea.

2. Materials and Methods

The emission factors for PM10 and PM2.5 emissions in the fugitive dust generated at construction sites were derived, along with a method for calculating the total emission amount generated at construction sites using the derived emission factors. First, major dust-generating equipment and activities at construction sites were identified, and the emission factors for PM10 and PM2.5 were derived according to the AP-42 (Compilation of Air Emissions Factors) [21] of the US EPA. In addition, the total construction emissions were calculated by applying the emission factors according to the equipment used in each construction phase, and the calculation results were examined and analyzed. Figure 1 shows the framework of this study.

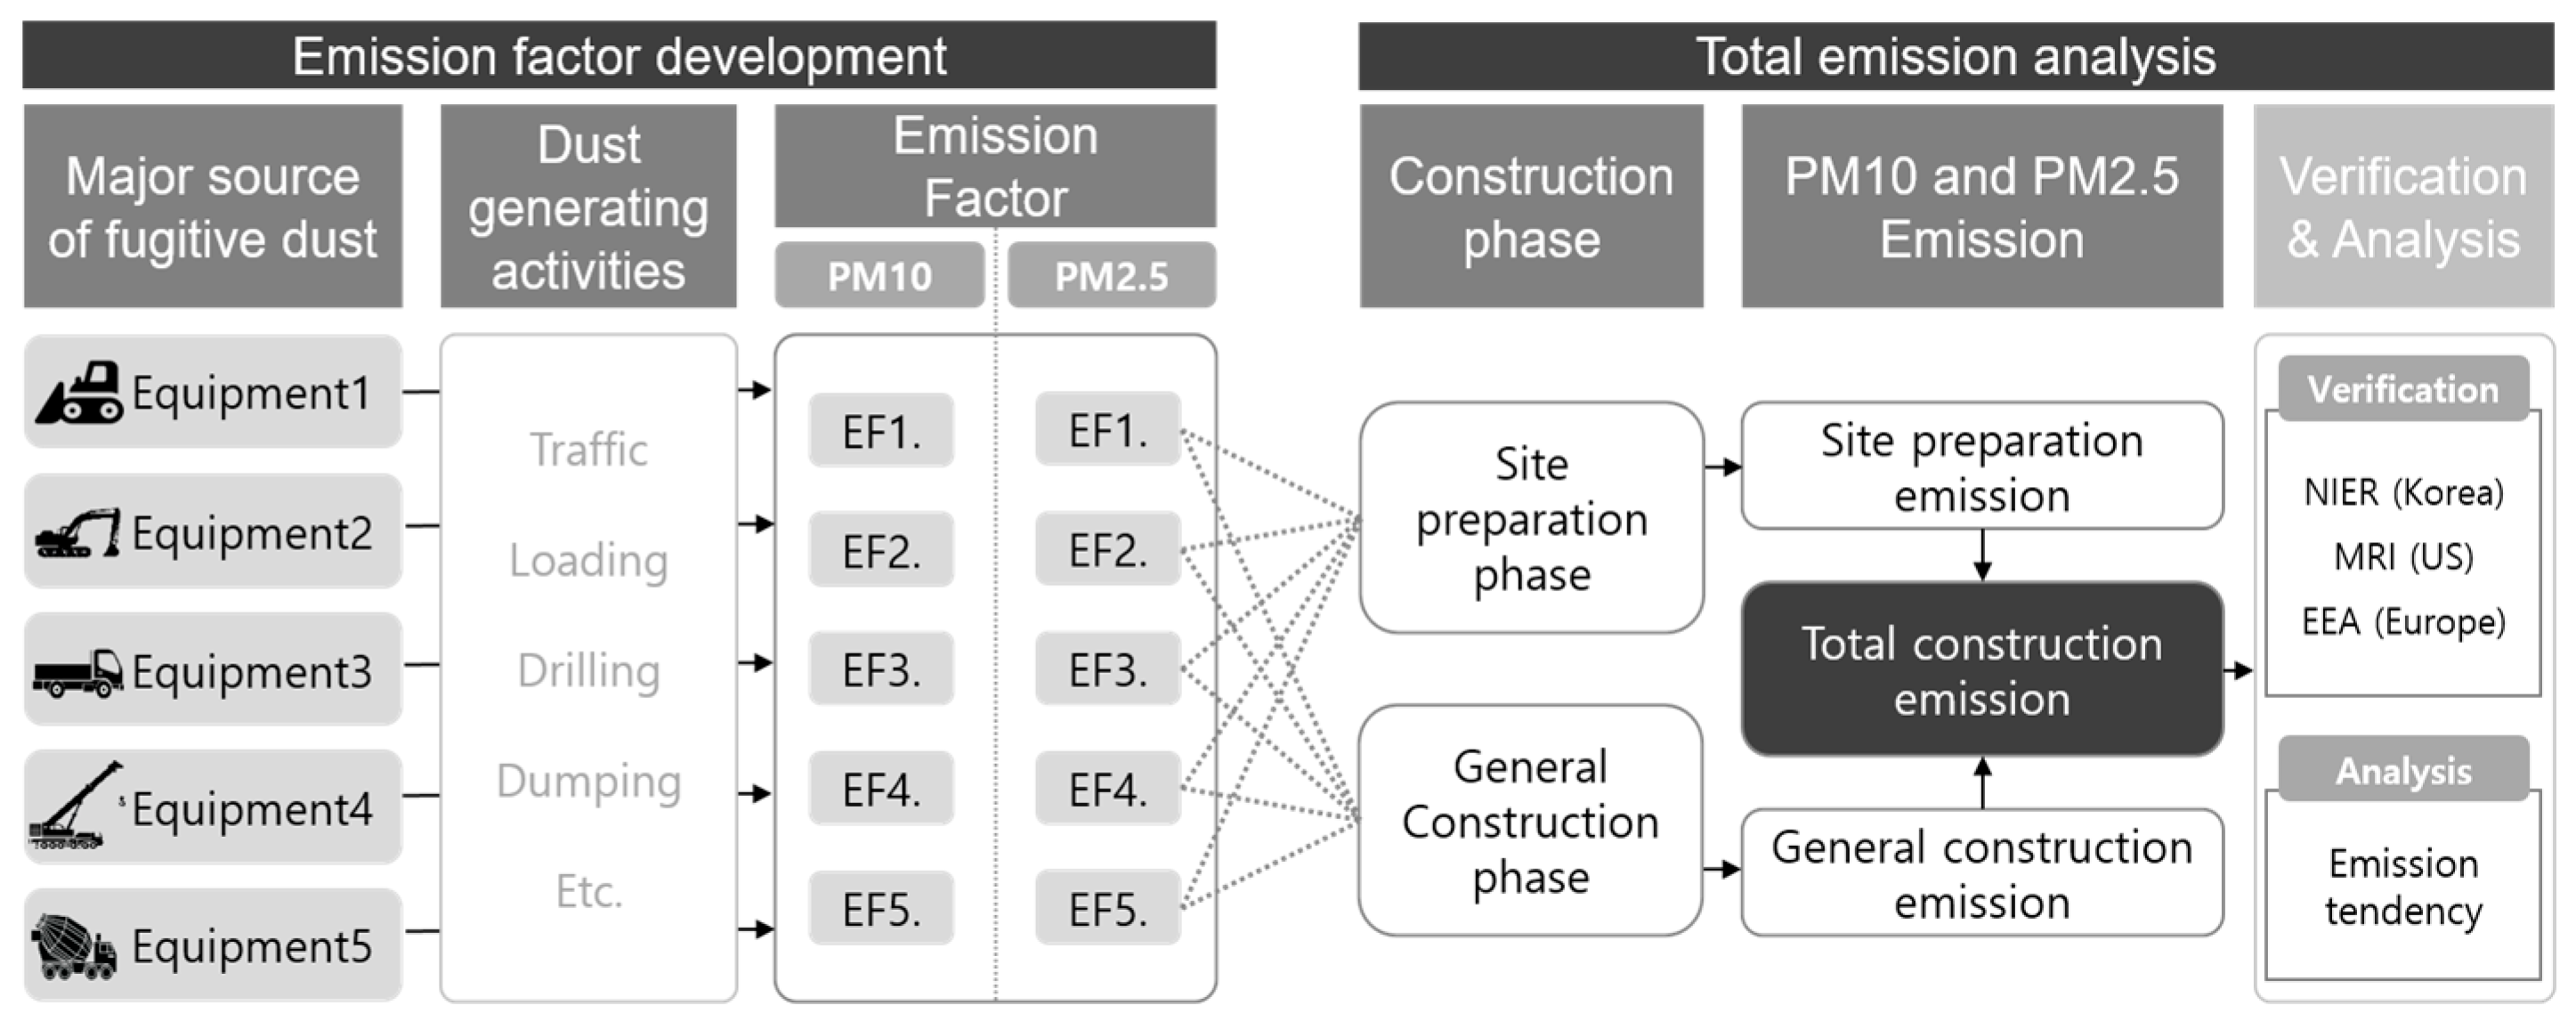
2.1. Emission Factor Development

2.1.1. Major Dust-Generating Equipment and Construction Site Activities

Fugitive dust in construction sites is mainly generated by the movement of construction equipment and construction activities. Accordingly, it is important to utilize major construction equipment and activities that generate dust to efficiently calculate PM due to construction work. This study organized major equipment that generates fugitive dust based on heavy construction operations defined by the AP-42 of the US EPA and PM-generating major construction equipment defined by the ME and GRI of South Korea. Dust generation is shown in Table 1 [21,22,23]. However, forklifts, concrete pumps, and compressors were excluded because estimates of PM generation were not clear.

2.1.2. Emission Factor

The PM emission factors for the operation and transport of major construction equipment such as bulldozers and scrapers are presented in the Heavy Construction Operation chapter of the EPA AP-42. The variables used to calculate the emission factors were silt content, moisture content, vehicle weight, wind speed, and vehicle speed, and emission factors were derived by applying the appropriate environmental variables [24,25] to South Korean construction sites, as shown in Table 2.

2.2. Particulate Matter Emission

2.2.1. Dust-Generating Activities

The life cycle of structures is divided into the production, construction, use, and end-of-life stages [26,27] according to ISO 21930. Here, the production stage refers to the process of producing the materials of the structure, the construction stage refers to transporting the construction materials and the construction process, the usage stage refers to using the structure, and the end-of-life stage refers to the process of dismantling and disposing of the structure. Since PM in construction sites is generated by the movement of construction equipment and construction activities, this study investigated the generation of PM that corresponds to the construction stage of the four life cycle stages.
In the Heavy Construction Operation chapter of the EPA AP-42, the construction phase for calculating PM in construction sites is largely divided into demolition and debris, site preparation, and general construction; dust-generating activities for each phase are listed in Table 3. This study did not consider the demolition and debris handling of existing structures that correspond to the end-of-life phase to calculate the PM emission amount generated during the construction stage of the life cycle of structures. Material producing activities such as portable plants and mineral production that correspond to the production stage were also excluded from this investigation.
The dust-generating activities applied in this study can be divided into earthwork and general construction. Earthwork refers to the stage before structural construction, such as site preparation, drilling, and land clearing. A series of structural construction processes are represented as general constructions. The major dust-generating equipment used in the earthwork phase are bulldozers, loaders, excavators, scrapers, dump trucks, graders, rollers, and boring machines. Cranes, dump trucks, and concrete mixer trucks are used in the general construction phase.

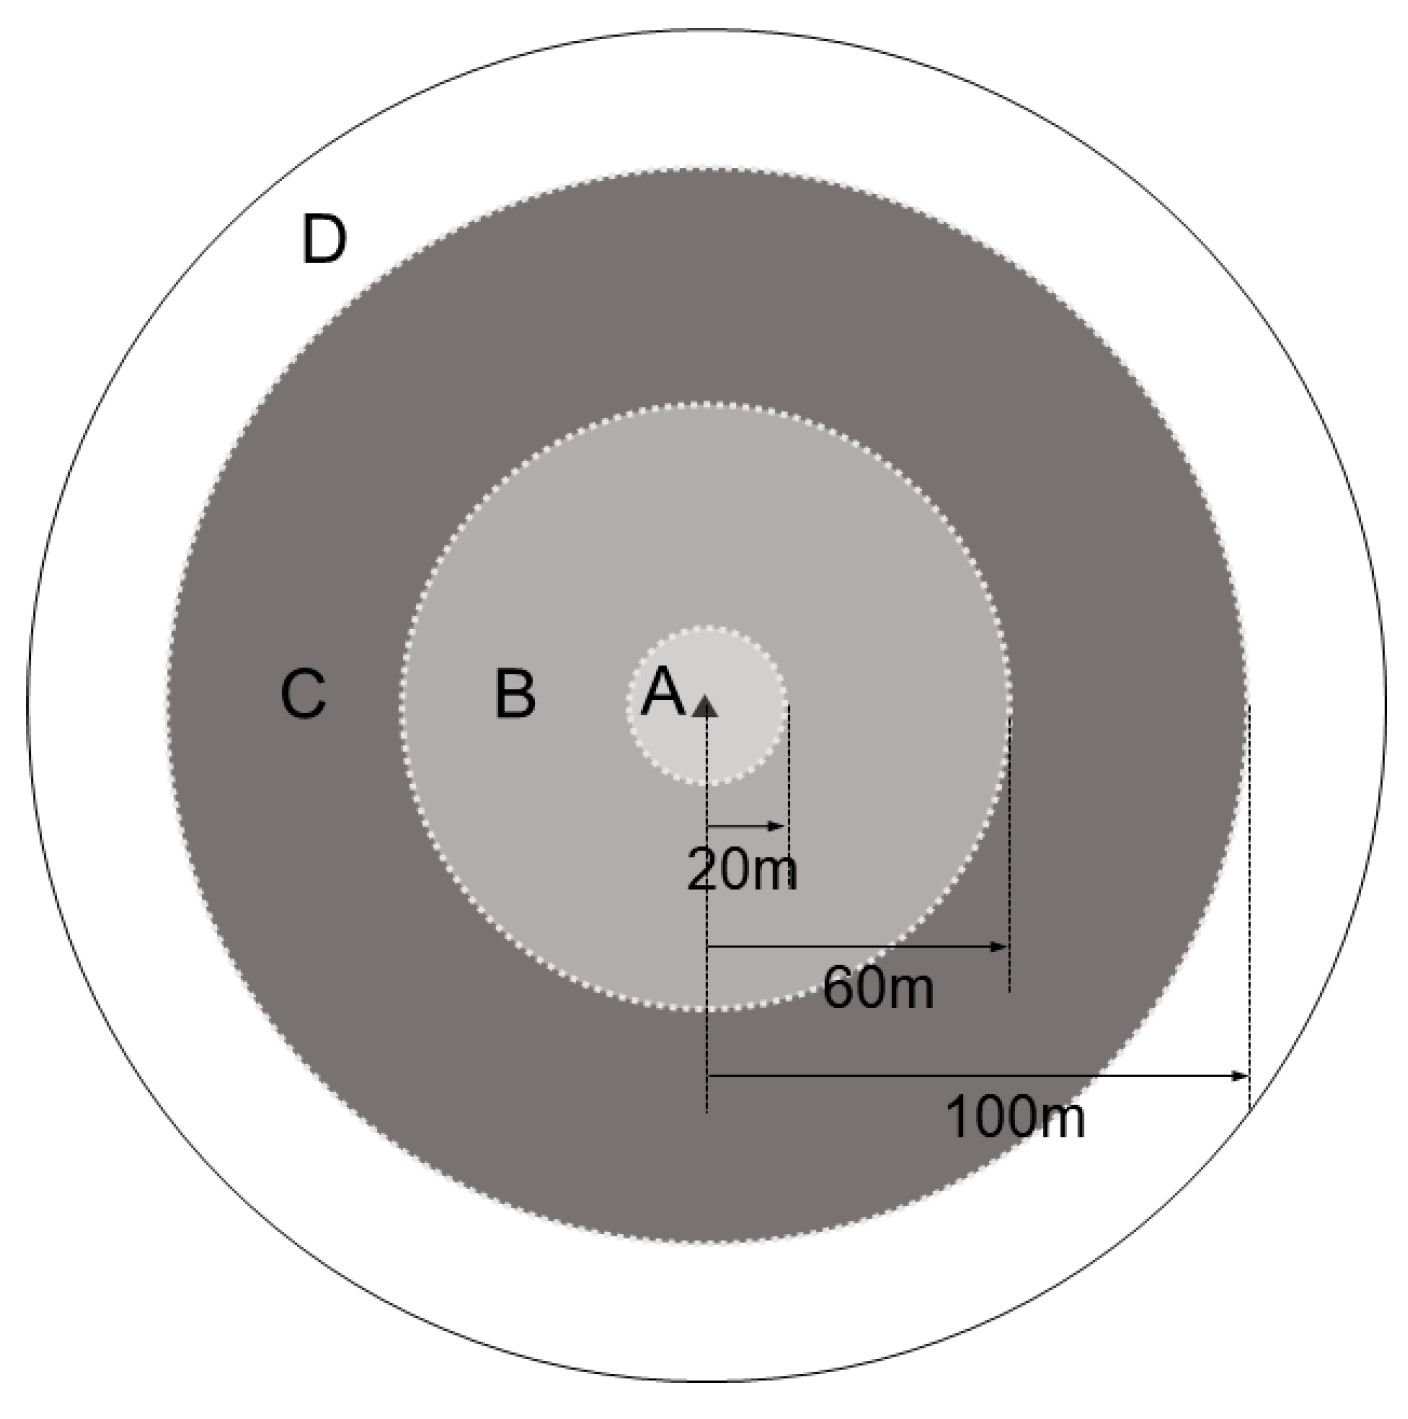
2.2.2. Workload Allocation by Equipment for Emission Calculation

The emission factor unit of fugitive dust represents the unit travel distance of equipment or the quantity generated per unit amount of work performed. Therefore, the distance traveled or the amount of work conducted by the equipment must be known to calculate the emissions. The distance traveled can be calculated using Equation (1).
VKT = Q q × VKT unit × t
where VKT is vehicle kilometers traveled (km), Q is the total work of the equipment (t), q is the amount of work completed by the equipment per operation (ton/operation), VKT-unit is the distance traveled by the equipment (km/operation), t is the number of trips (one way is one operation and a round trip is two operations). Equation (1) shows that the amount of work performed is necessary to calculate the distance traveled by the equipment.
In the general construction phase, the performance of the equipment can be calculated based on the amount of input material, such as concrete, rebar, and cement. However, in the earthwork phase, the workload should be allocated based on the calculated workloads being appropriate for each range of work, because the range of work is different for different equipment.
This study allocated the amount of soil for each working distance by referring to the estimated standard of construction to calculate the amount of work performed for each piece of equipment. Working areas are designated as A zone with a working radius of ≤20 m, B zone with a radius ≤ 60 m or less, C zone with a radius of 60–100 m, and D zone with a radius ≥ 100 m. The earthwork was assigned to each zone, and equipment was distributed. The equipment distribution by working distance for the calculation of earthwork workload is presented in Table 4, and the construction site zones are shown in Figure 2.

2.2.3. Emission Calculation

The general equation for estimating the emission of EPA AP-42 is presented in Equation (2).
E = A × EF × ( [ 1 ER ] 100 )
where E is the emissions, A is the activity rate, EF is the emission factor, ER is the overall emission reduction efficiency, and the total emissions can be calculated by summing the equation results for each piece of equipment. However, in this study, equipment workload or distance traveled was applied to A, and ER was not considered because it was intended to be developed separately in future research. Accordingly, the equation used for estimating the emissions in this study is shown in Equation (3).
E = i = 1 m j = 1 n A i , j EF i , j ,
where i denotes the construction equipment, and j denotes activities.

3. Result

3.1. Emission Factor (EF)
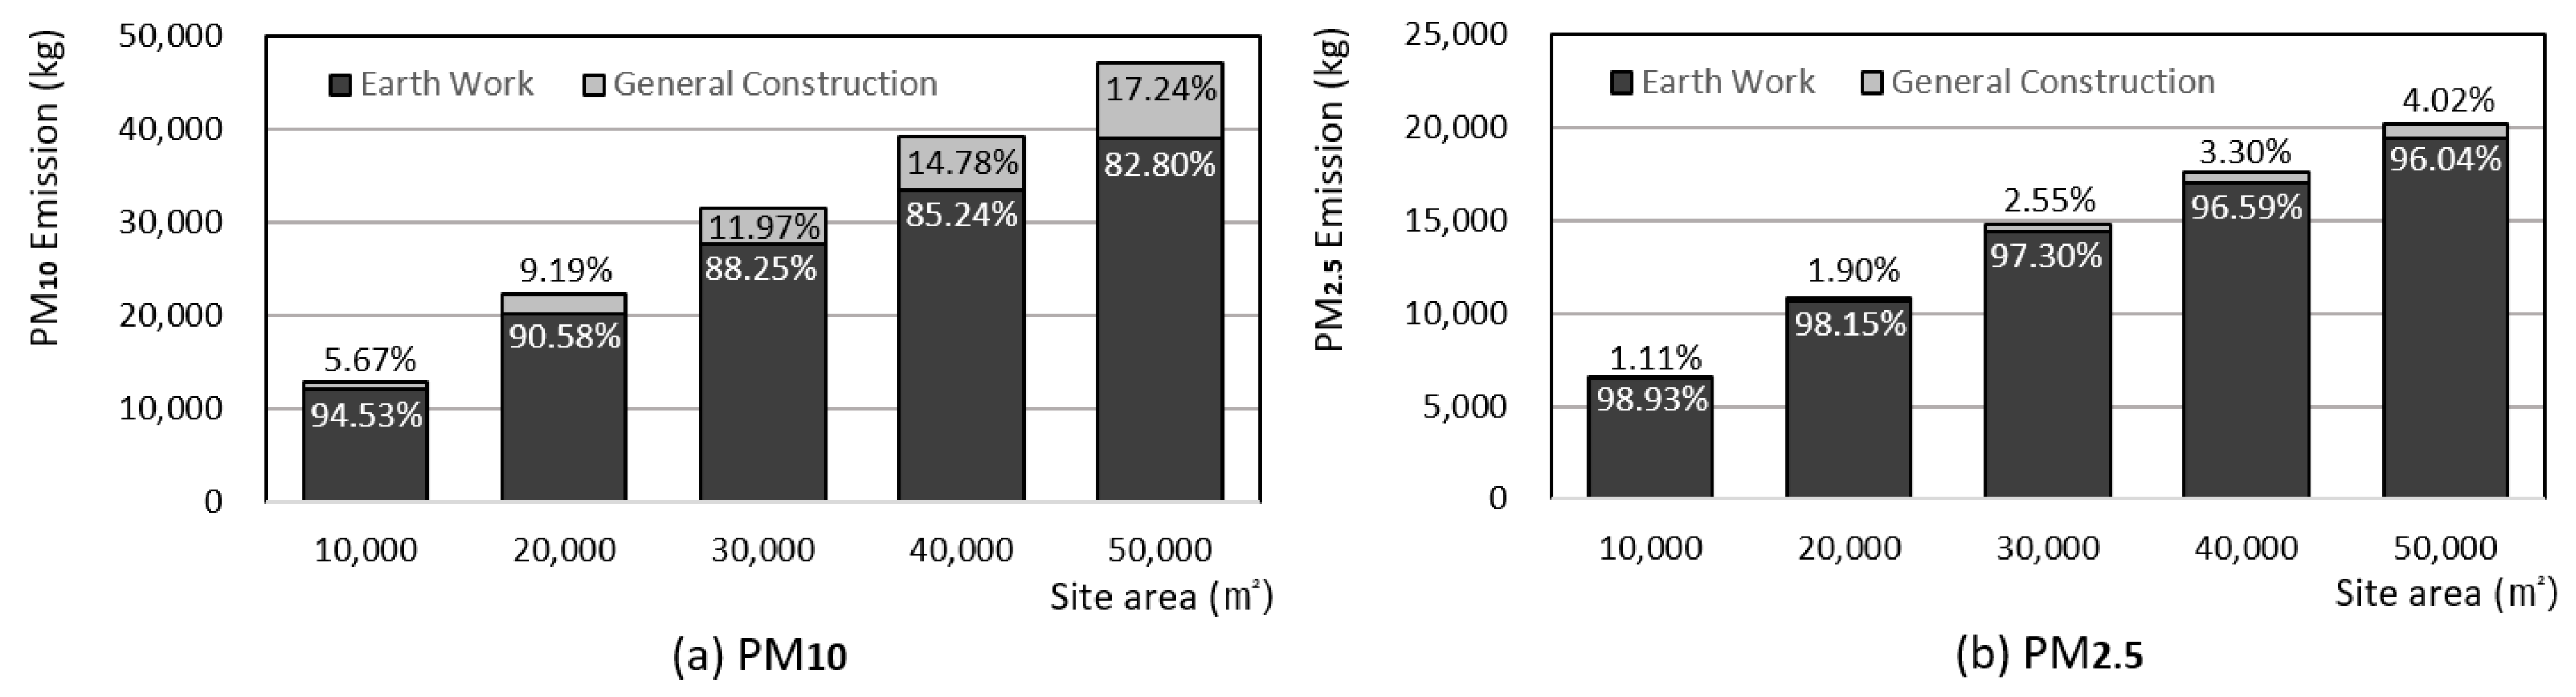
Table 5 shows PM10 and PM2.5 emission factors according to the construction equipment and activities. Since the emission factors calculated in this study were obtained using South Korean data, other countries or construction sites in unique environments should calculate emission factors according to their unique variables.

3.2. Emissions (E)

The input data necessary to calculate the total emissions for earthwork and general construction phases were defined. Earth volume, which is the input data for the earthwork phase, can be allocated for each type of construction equipment following the allocation method explained in Section 2.2.2, and the amount of construction materials in the general construction phase can be determined using tailored design specifications.
This study calculated the emissions based on the assumption of a structure with a height and depth of 10 m, which corresponds to 70% (for non-residential buildings) of the site area according to the National Land Planning and Utilization Act of South Korea [28]. Additionally, the weight distribution of the input materials for 64 structures demonstrated that the weight of ready-mixed concrete, rebars, and cement were the main materials that accounted for approximately 90% of the total material weight. Consequently, the average amount of these input materials per unit area was calculated and applied. Accordingly, the emissions were calculated as the site area increased by 10,000 m2 from 10,000 m2 to 50,000 m2, and the results are presented in Table 6.
Based on the results presented in Table 6, the emissions trend according to site area was examined, and the ratio for each construction phase is shown in Figure 3. In the case of PM10, the ratio between the emissions in the earthwork phase and the general construction phase was 94.53% and 5.67%, respectively, when the site area was 10,000 m2. The ratio of the general construction phase increased with the increase in the site area. However, the emissions in the earthwork phase were the largest. This indicates that residents in the vicinity and on-site workers may be exposed to the largest amount of fine dust during the earthwork phase among all construction phases. A similar pattern was observed for PM2.5 which showed a greater impact of the earthwork phase than PM10, indicating that earthwork increases human exposure to ultra-fine dust.

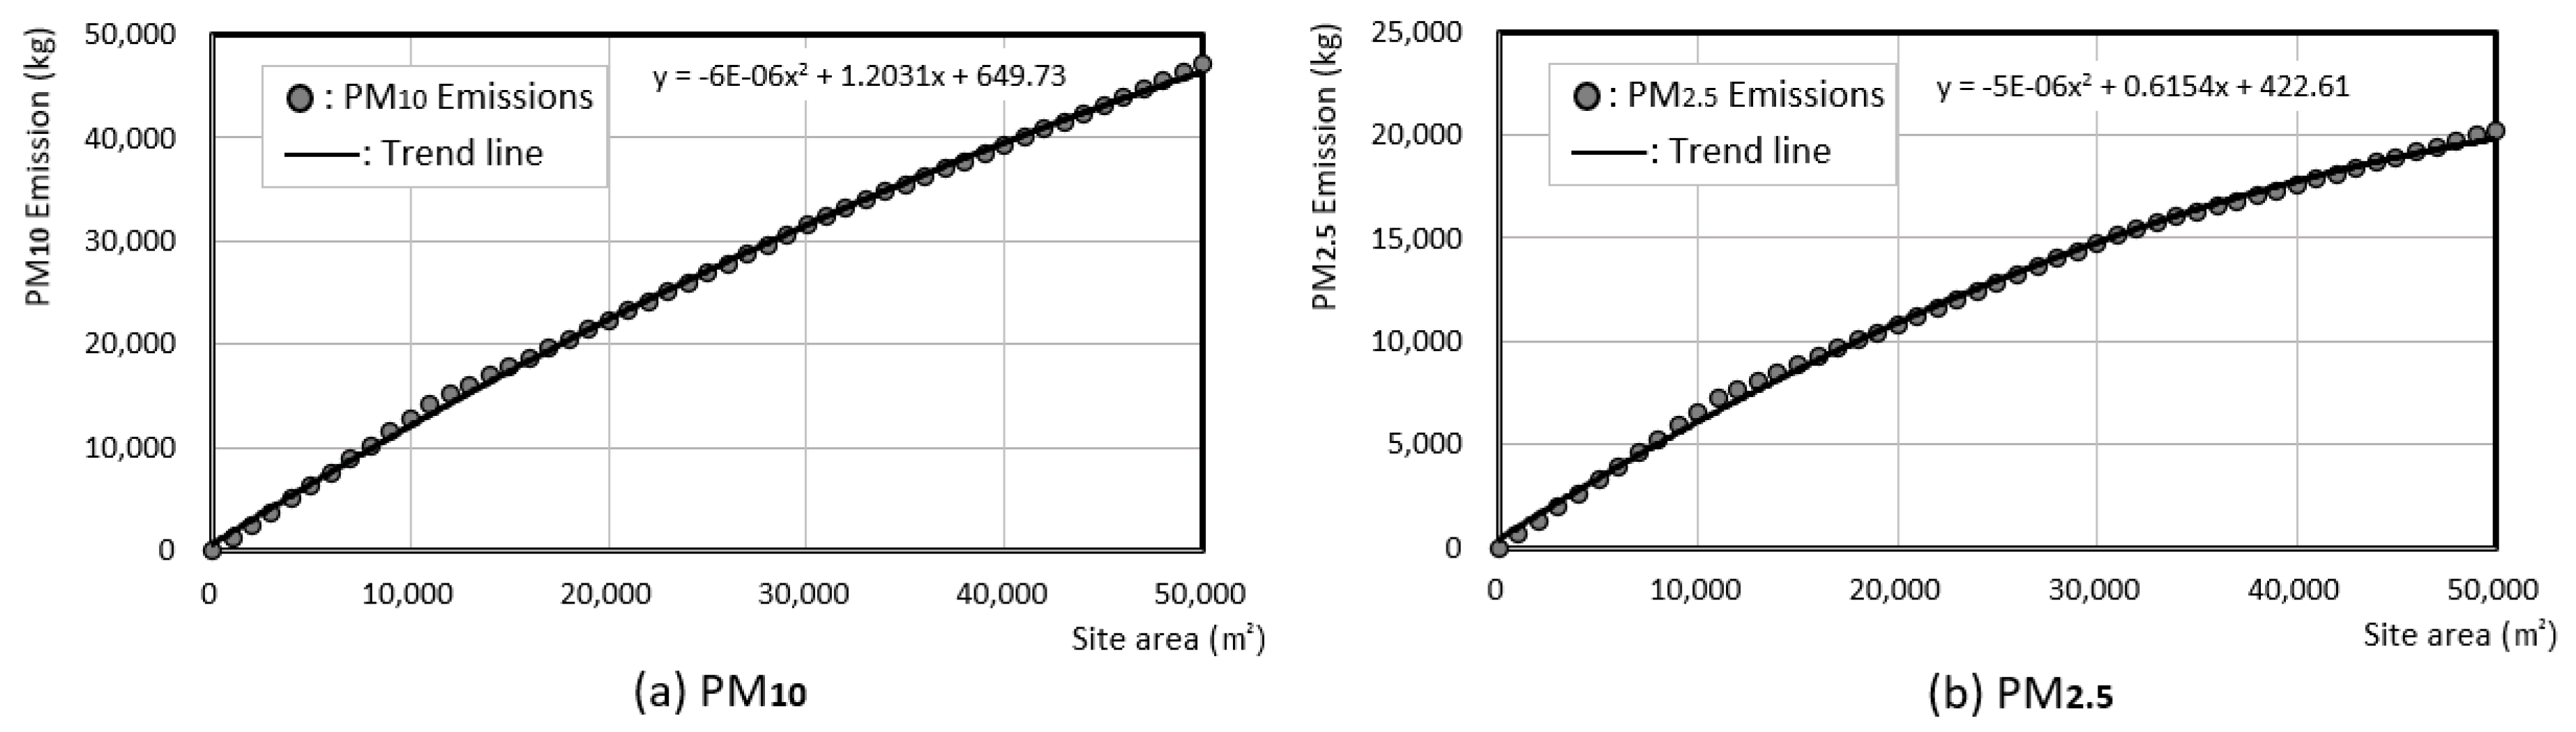
3.3. Results and Trend Analysis

Previously, EEA in Europe, MRI in the US, and NIER in South Korea conducted research on fugitive dust in construction sites and developed equations to calculate PM emissions. Although the equations produced different results due to differences in the development process, each study assigned the area of the construction site and construction period as common variables. However, this study considered changes in emissions according to equipment travel and the level of work by arranging the amount of work performed at each construction phase during the construction period as a variable instead of the construction period, even though the site area information is the same. The PM10 emissions were calculated, while increasing the area of the construction site by 1000 m2 under the same condition as presented in Section 3.2 (height and depth of 10 m, which corresponds to 70% of the site area), using all equations to determine the trends in the emissions according to these differences and to test the similarity of the results. The results are shown in Figure 4.
The PM10 emissions calculated according to site areas in this study were the closest using the MRI equation [19,29]. The similarity may vary according to the silt and moisture content of the earth, which are the major variables used in the calculation of emission factors. However, the test results are based on variables used in this study, which are appropriate for construction sites in South Korea. Furthermore, the existing emissions equations are linear under the assumption that the emissions per unit area are constant. However, when the emissions calculation method of this study was used, the results formed a negative quadratic curve. This means that the emissions per unit area will decrease when the site area increases if the construction site area is ≤50,000 m2. The emission trends of PM10 and PM2.5, according to the increase in area calculated using the emission evaluation method developed in this study, are presented in Figure 5.

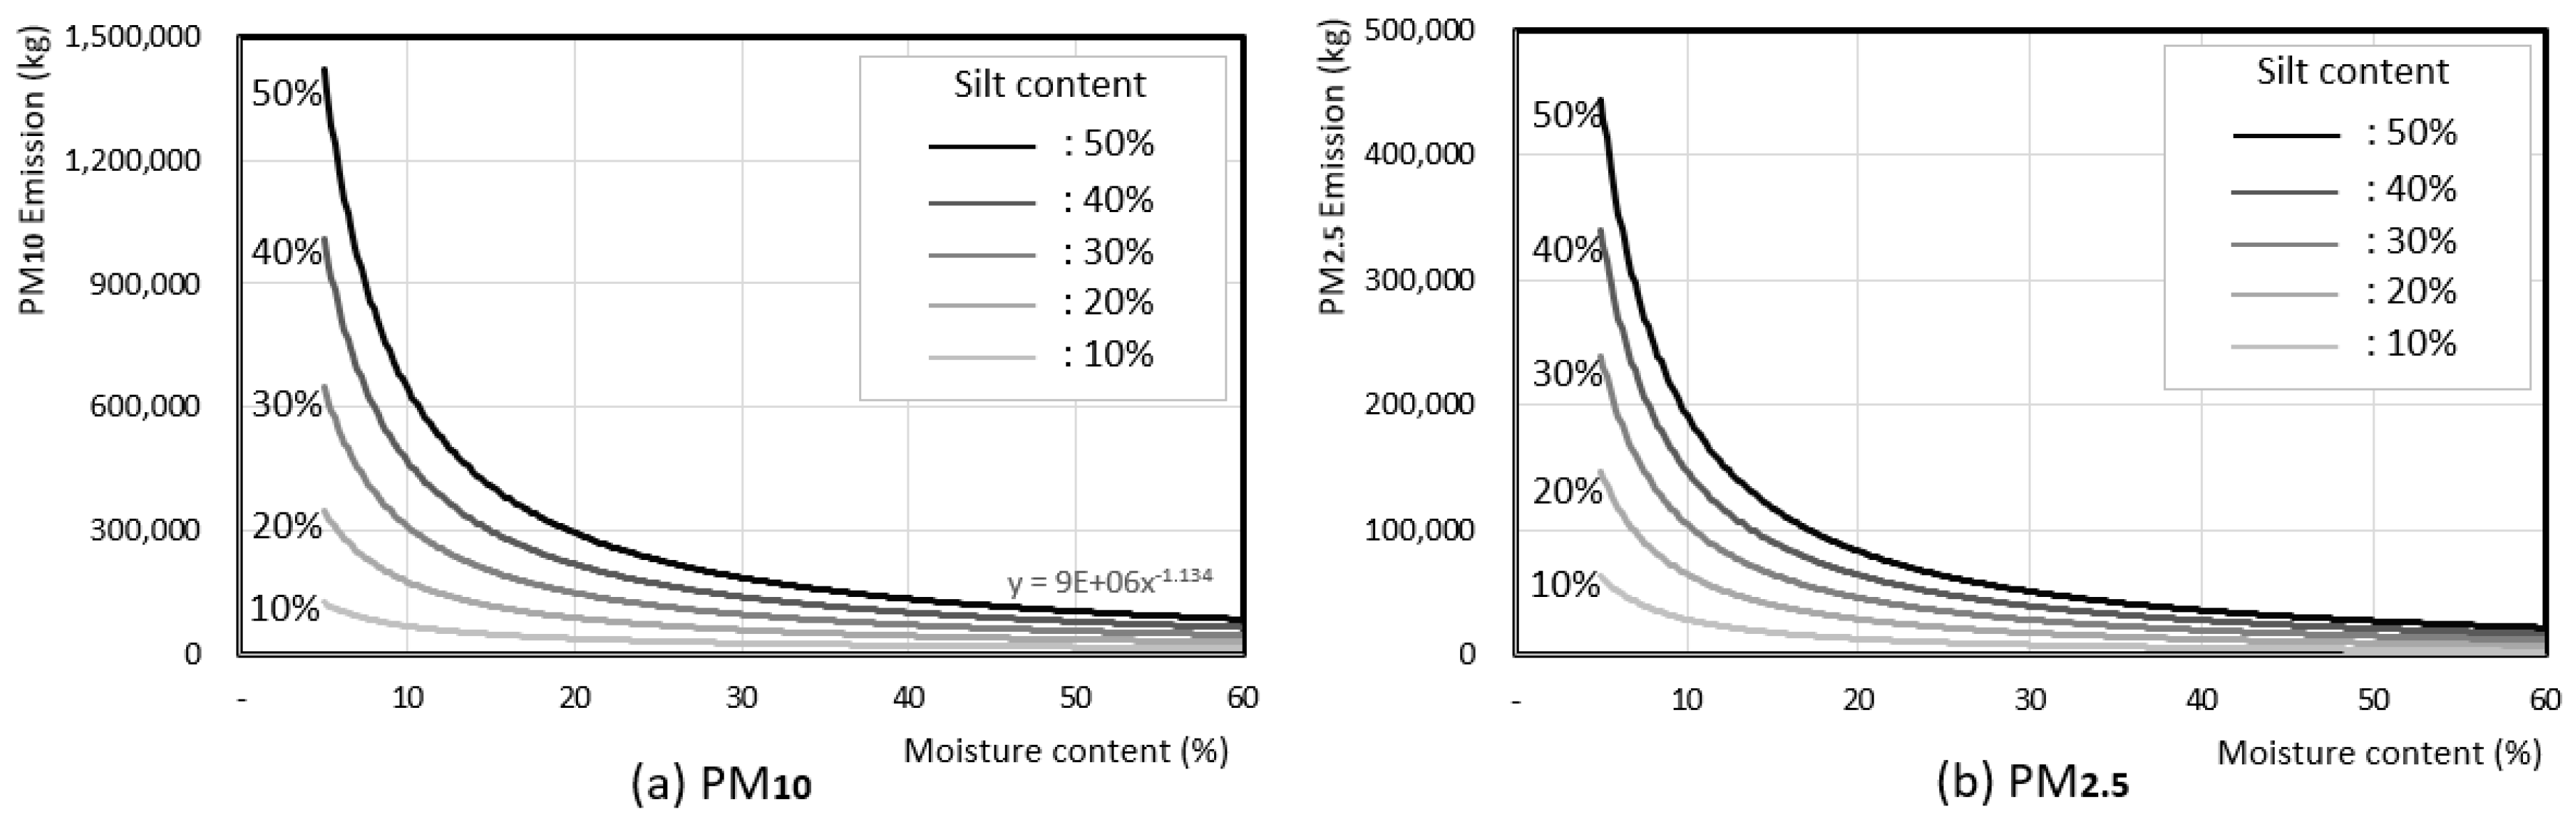
3.4. Emission Amount Trend Analysis According to the Major Emission Factor Variables

Silt and moisture content are major considerations in developing PM emission factors of fugitive dust [30]. Since the generation of dust due to construction activities varies according to the characteristics of the soil at the construction site, the development of emission factors that accurately reflect the soil environment of the site is necessary for precise emission calculation. The PM10 and PM2.5 emission calculations and trend analysis according to changes in silt and moisture content were performed to provide a foundation for the future development of emission factors. The soil characteristics of the construction sites are reflected in Figure 6.
The PM emissions decreased in the form of a power curve with an increase in the moisture content of the soil, and accordingly, a steeper decreasing curve was observed with increasing moisture content. In particular, the emission amount changes significantly with a slight change in moisture if the moisture content is 40% or less, but the change is minimal if the moisture content is higher than 40%. In addition, silt content was also found to have a significant effect on the emissions: the higher the silt content, the higher the PM emissions. This tendency appears because silt contributes to a small amount of airborne PM scattering since silt is defined as particles less than 75 μm in diameter [31]. As such, the reliability of emission factors needs to be improved through additional research on the regional and seasonal characteristics of the soil, since moisture and silt content significantly influence the calculation of PM emissions.

4. Discussion

Recently, problems due to particulate matter have emerged in Asia, and accordingly, various studies on PM emission characteristics have been conducted. However, most research focuses on the generation of PM due to fuel combustion, and research considering fugitive dust is lacking. Particularly, damage caused by fugitive dust in construction sites is significant in South Korea, and efforts to ensure resident and on-site worker safety are necessary by predicting harmful PM concentrations in the dust.
This study developed PM emission factors of fugitive dust and presented a method for calculating the concentration of emissions using these emission factors so that preventative measures can be employed before damage occurs by effectively predicting the amount of PM generated at construction sites. The developed emission factors can be used to evaluate which equipment and activities produce more PM emissions at different stages of construction. Using this information, PM is efficiently controlled in the construction process by applying PM reduction technologies. Furthermore, safety is promoted by employing on-site emission reduction strategies by predicting the total amount of PM emissions due to construction activities.
This study is expected to provide basic data for establishing integrated PM emission management systems for construction sites in the future. However, data collection on dust generated in the general construction phase is difficult. This study is limited by the lack of standards proposed for the optimal emissions of PM to ensure the safety of the residents in the vicinity of construction sites and on-site workers. It is necessary to extend the application of the results of emission trends according to construction site area analyzed beyond various tangible cases to establish standards for reasonable emissions. As such, a standard for reasonable emissions per total ground area of the construction site should be derived. Recently, South Korea has employed the total emission control of air pollutants at business hub regions as part of the Special Act on the Improvement of Air Quality in Air Management Areas, which determines the annual standards for SOx, NOx, and TSP emissions at industrial workplaces [32]. Although construction sites face difficulty complying with this system because they are not the type of businesses that continuously produce specific products at a specific place, the system offers a method for establishing emission standards for each site by assuming each site as a place of business and the unit area of the construction site as a product.
Additionally, appropriate emission factors that reflect regional and seasonal characteristics should be developed and applied to a standard setting. Future guidelines for implementing control measures depending on the emission evaluation should be considered by establishing clear PM standards by conducting these additional studies.

5. Conclusions

The purpose of this study was to develop a method for calculating emission factors and emission concentrations for PM10 and PM2.5 in the fugitive dust generated at construction sites and to derive the emission trends for major variables as part of research to prevent damage by PM due to fugitive dust generated at construction sites.
  • The South Korean emission factors of PM10 and PM2.5, according to the generation of fugitive dust for 10 types of construction equipment and activity due to the workload and travel speed of construction equipment, were derived using the methods presented in EPA AP-42.
  • In addition, methods to calculate the amount of PM10 and PM2.5 generated due to fugitive dust in construction sites by including information about the site area, earth volume, and the amount of construction materials using the derived emission factors were presented, and the results obtained using these methods were analyzed.
  • Analysis from the perspective of construction site area and construction phases showed that the ratio of PM emission generated in the general construction phase increases compared to the earthwork phase when site area increases. However, the absolute amount of PM generated in the earthwork phase was found to be significantly higher than the amount generated in the general construction phase. This information indicated that nearby residents and on-site workers were exposed to the greatest amount of PM during earthwork.
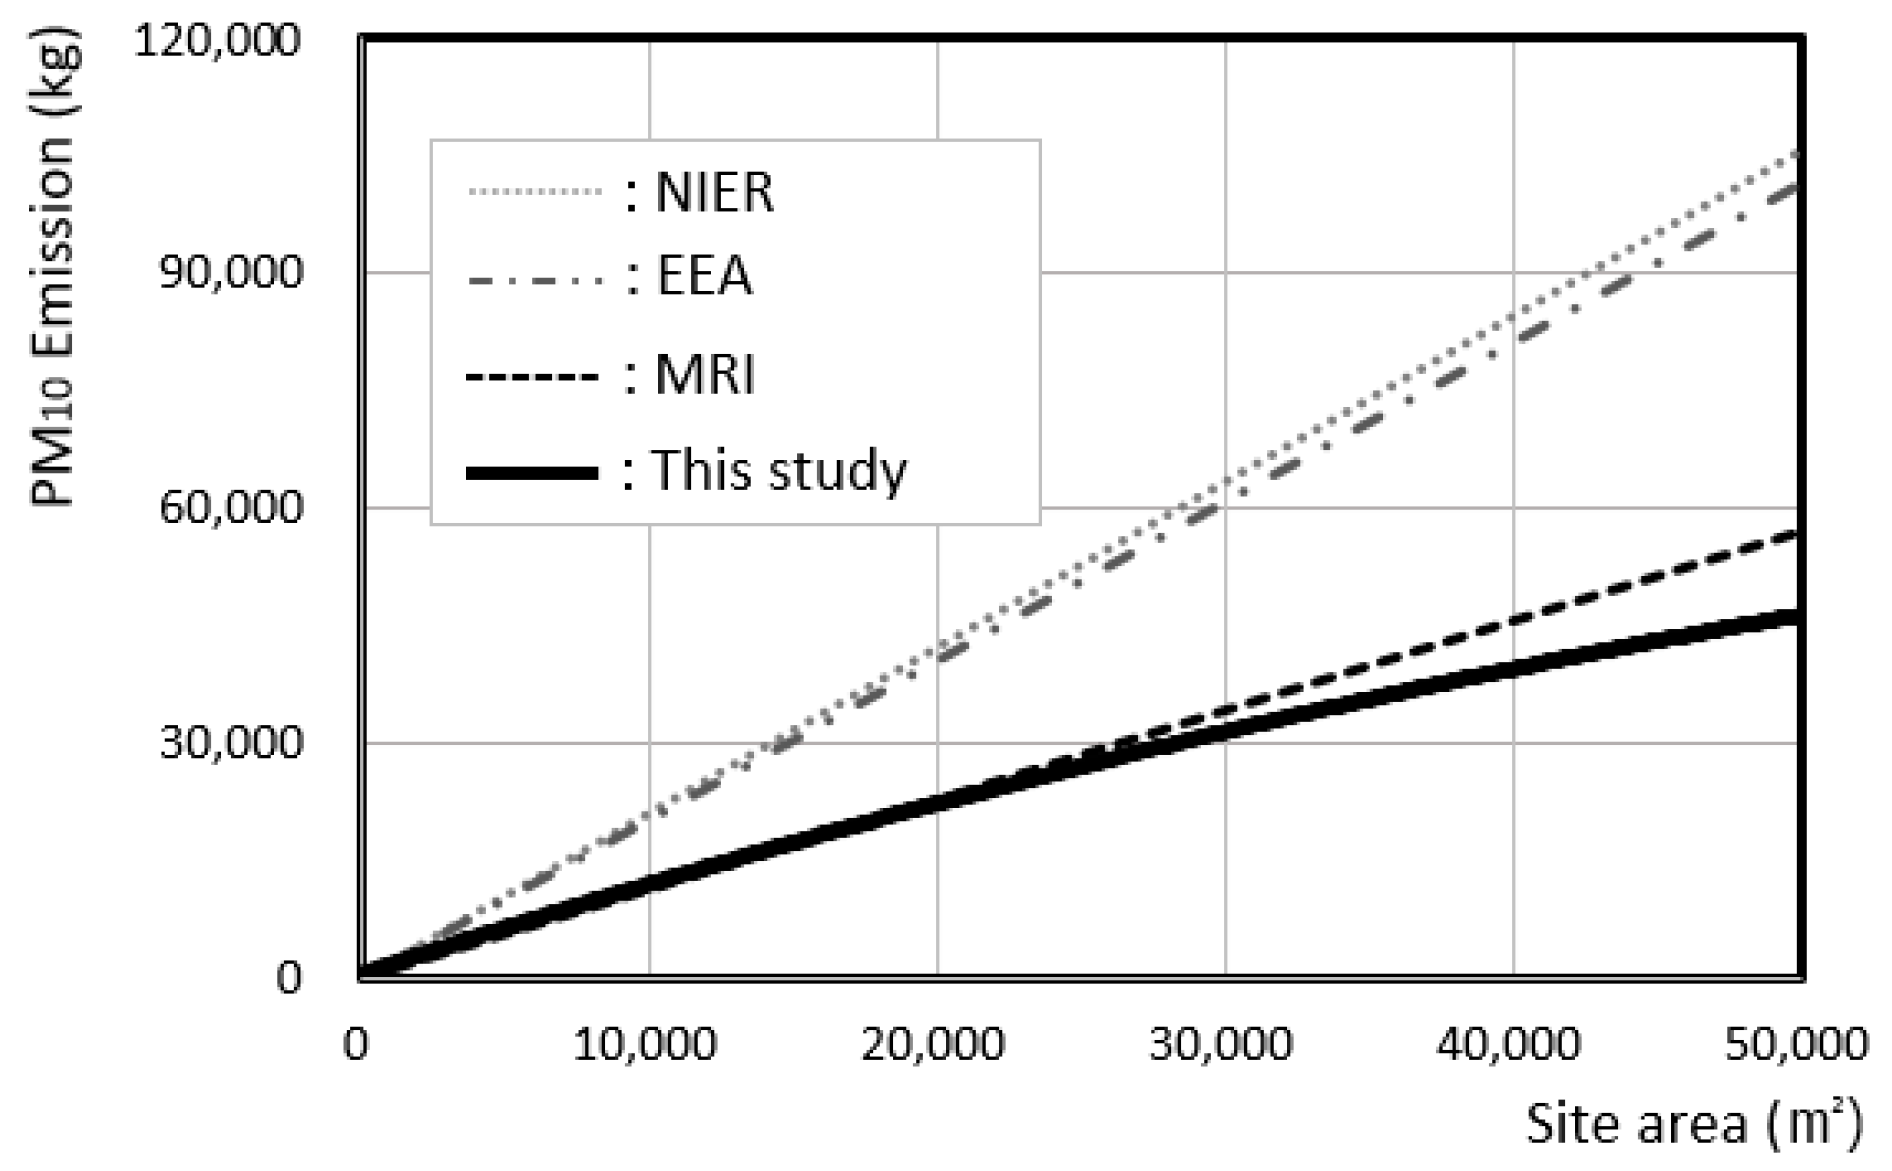
  • Of emission equations developed in the US, Europe, and South Korea, emissions by the area of the construction site were most accurate when derived by the MRI equation of the US. However, unlike the existing equations that showed a linear increase in emissions with an increase in the area, the results of this study showed a decrease in emissions per unit area when site area increased.
  • Emission trend analysis according to silt and moisture content, which are major variables of fugitive dust, showed that emissions decreased in the form of a power curve with an increase in the moisture content. The change was minimal if the moisture content was higher than 40%, while PM emissions increased with an increase in silt content.
  • The findings of this study are expected to be used as basic data for setting reasonable emissions standards for PM at construction sites in South Korea through comparisons with the results of case studies in real construction sites. Additionally, the importance of establishing the emission standards and appropriate emission factors are discussed. The results present guidelines for PM emission management at construction sites and to establish integrated PM emission management systems for construction sites.

Author Contributions

Writing—original draft preparation, H.K.; writing—review and editing, H.K.; design and supervision, H.K., S.T. and J.Y. All authors have read and agreed to the published version of the manuscript.

Funding

This research was supported by the National Research Foundation of Korea (NRF) grant funded by the Korea government (MSIT) (No. 2015R1A5A1037548) and supported by the Korea Agency for Infrastructure Technology Advancement (KAIA) grant funded by the Ministry of Land, Infrastructure and Transport (No. 20CTAP-C152276-02).

Conflicts of Interest

The authors declare no conflict of interest.

References

  1. Yoo, S.-Y.; Kim, T.; Ham, S.; Choi, S.; Park, C.-R. Importance of urban green at reduction of particulate matters in Sihwa Industrial Complex, Korea. Sustainability 2020, 12, 7647. [Google Scholar] [CrossRef]
  2. Ohara, T.; Akimoto, H.; Kurokawa, J.; Horii, N.; Yamaji, K.; Yan, X.; Hayasaka, T. An Asian emission inventory of anthropogenic emission sources for the period 1980–2020. Atmos. Chem. Phys. 2007, 7. [Google Scholar] [CrossRef] [Green Version]
  3. Zhang, Q.; Streets, D.G.; Carmichael, G.R.; Huo, H.; Kannari, A.; Klimont, Z.; Park, I.; Reddy, S.; Fu, J.S.; Chen, D.; et al. Asian emissions in 2006 for the NASA INTEX-B mission. Atmos. Chem. Phys. 2009, 9, 4081–4139. [Google Scholar] [CrossRef] [Green Version]
  4. Guo, S.; Hu, M.; Zamora, M.L.; Peng, J.; Shang, D.; Zheng, J.; Du, Z.; Wu, Z.; Shao, M.; Zeng, L. Elucidating severe urban haze formation in China. Proc. Natl. Acad. Sci. USA 2014, 111, 17373–17378. [Google Scholar] [CrossRef] [PubMed] [Green Version]
  5. Basile-Doelsch, I.; Meunier, J.D.; Parron, C. Another continental pool in the terrestrial silicon cycle. Nature 2005, 433, 399. [Google Scholar] [CrossRef]
  6. Sun, Y.; Zhuang, G.; Tang, A.; Wang, Y.; An, Z. Chemical characteristics of PM2.5 and PM10 in haze−fog episodes in Beijing. Environ. Sci. Technol. 2006, 40, 3148–3155. [Google Scholar] [CrossRef] [PubMed]
  7. Yang, X.; Lu, D.; Tan, J.; Sun, X.; Zhang, Q.; Zhang, L.; Li, Y.; Wang, W.; Liu, Q.; Jiang, G. Two-Dimensional silicon fingerprints reveal dramatic variations in the sources of particulate matter in Beijing during 2013–2017. Environ. Sci. Technol. 2020, 54, 7126–7135. [Google Scholar] [CrossRef] [PubMed]
  8. Wong, C.-M.; Vichit-Vadakan, N.; Kan, H.; Qian, Z. Public Health and Air Pollution in Asia (PAPA): A multicity study of shortterm effects of air pollution on mortality. Environ. Health Perspect 2008, 116, 1195. [Google Scholar] [CrossRef] [PubMed] [Green Version]
  9. Health Effects Institute (HEI). Understanding the Health Effects of Ambient Ultrafine Particles; Health Effects Institute: Boston, MA, USA, 2011. [Google Scholar]
  10. United States Environmental Protection Agency (US EPA). Integrated Science Assessment for Particulate Matter; Center for Public Health & Environment Assessment: Washington, DC, USA, 2019.
  11. Delfino, R.J.; Quintana, P.J.E.; Floro, J.; Gastañaga, V.M.; Samimi, B.S.; Kleinman, M.T.; Liu, L.J.S.; Bufalino, C.; Wu, C.F.; McLaren, C.E. Association of FEV1 in asthmatic children with personal and microenvironmental exposure to airborne particulate matter. Environ. Health Perspect 2004, 112, 932–941. [Google Scholar] [CrossRef] [PubMed] [Green Version]
  12. van Donkelaar, A.; Martin, R.V.; Brauer, M.; Boys, B.L. Use of satellite observations for long-term exposure assessment of global concentrations of fine particulate matter. Environ. Health Perspect 2015, 123, 135–143. [Google Scholar] [CrossRef] [PubMed] [Green Version]
  13. Chowdhury, S.; Dey, S. Cause-specific premature death from ambient PM 2.5 exposure in India: Estimate adjusted for baseline mortality. Environ. Int. 2016, 91, 283–290. [Google Scholar] [CrossRef] [PubMed]
  14. Han, X.; Liu, Y.; Gao, H.; Ma, J.; Mao, X.; Wang, Y.; Ma, X. Forecasting PM 2.5 induced male lung cancer morbidity in China using satellite retrieved PM 2.5 and spatial analysis. Sci. Total Environ 2017, 607–608, 1009–1017. [Google Scholar] [CrossRef] [PubMed]
  15. Reff, A.; Bhave, P.V.; Simon, H.; Pace, T.G.; Pouliot, G.A.; Mobley, J.D.; Houyoux, M. Emissions inventory of PM2.5 trace elements across the United States. Environ. Sci. Technol. 2009, 43, 5790–5796. [Google Scholar] [CrossRef] [PubMed]
  16. The Ministry of Environment (ME). Status of Civil Complaint Related to Fugitive Dust. Available online: http://stat.me.go.kr/ (accessed on 30 July 2020).
  17. Noh, H.J.; Lee, S.-K.; Yu, J.-H. Identifying Effective Fugitive Dust Control Measures for Construction Projects in Korea. Sustainability 2018, 10, 1206. [Google Scholar] [CrossRef] [Green Version]
  18. Ministry of Environment. Scattering Dust Management Manual; Ministry of Environment: Sejong, Korea, 2017.
  19. Midwest Research Institute (MRI). Background Document for Revisions to Fine Fraction Ratios Used for AP-42 Fugitive Emission Factors; Midwest Research Institute: Kansas City, MO, USA, 2006. [Google Scholar]
  20. European Environmental Agency (EEA). EMEP/EEA Air Pollutant Emission Inventory Guidebook; European Environmental Agency: Copenhagen, Denmark, 2019. [Google Scholar]
  21. US EPA. AP-42: Compilation of Air Emissions Factors; Chapter 13.2.3 Heavy Construction Operations; Environmental Protection Agency: Washington, DC, USA, 1995.
  22. National Institute of Environmental Research (NIER). National Air Pollutant Emission Calculation Method Manual III; National Institute of Environmental Research: Incheon, Korea, 2013.
  23. Gyeonggi Research Institute (GRI). Introduction Plan of Seasonal Management System for Particulate Matter in Gyonggi-do; Gyeonggi Research Institute: Suwon, Korea, 2019. [Google Scholar]
  24. NIER. Improvement in the Calculation Method of the Amount of Fugitive Dust Emission Amount and the Development of Real-Time Measurement Method of Resuspended Road Dust; Final report; National Institute of Environmental Research: Incheon, Korea, 2008.
  25. Ministry of Land, Infrastructure and Transport (MOLIT). Standard of Construction Estimate; Ministry of Land, Infrastructure and Transport: Sejong, Korea, 2020.
  26. International Standards Organization (ISO). Sustainability in Buildings and Civil Engineering Works—Core Rules for Environmental Product Declarations of Construction Products and Services; ISO: Geneva, Switzerland, 2017. [Google Scholar]
  27. Nunes, A.; Palmeri, J.; Love, S. Deconstruction vs. Demolition: An Evaluation of Carbon and Energy Impacts from Deconstructed Homes in the City of Portland, City of Portland Bureau of Planning and Sustainability (BPS); State of Oregon Department of Environmental Quality: Portland, OR, USA, 2019.
  28. Korea Ministry of Government Legislation. National Land Planning and Utilization Act, Enforcement; Ministry of Government Legislation: Sejong, Korea, 2012.
  29. Western Governors’ Association Western Regional Air Partnership (WRAP). Fugitive Dust Handbook; WRAP: Denver, CO, USA, 2006. [Google Scholar]
  30. Dyck, R.I.J.; Stukel, J.J. Fugitive dust emissions from trucks on unpaved roads. Environ. Sci. Technol. 1976, 10, 1046–1048. [Google Scholar] [CrossRef]
  31. US EPA. AP-42: Compilation of Air Emissions Factors; Chapter 13.2.2 Unpaved Roads; Environmental Protection Agency: Washington, DC, USA, 2006.
  32. The Ministry of Environment (ME). Air Pollutant Emission-Cap Management for Industrial Work Place, Korea Environment Corporation. Available online: https://www.keco.or.kr/en/core/climate_air2/contentsid/1947/index.do (accessed on 25 July 2020).
Figure 1. Research framework.
Sustainability 12 09802 g001
Figure 2. Construction site zone.
Sustainability 12 09802 g002
Figure 3. (a) PM10 and (b) PM2.5 percentage according to the construction phase.
Sustainability 12 09802 g003
Figure 4. Comparison of PM10 emission trends according to construction site areas.
Sustainability 12 09802 g004
Figure 5. Trends in (a) PM10 and (b) PM2.5 emissions according to construction site area.
Sustainability 12 09802 g005
Figure 6. Trends in (a) PM10 and (b) PM2.5 emissions according to silt and moisture content.
Sustainability 12 09802 g006
Table 1. Fugitive dust-generating activities of PM-generating equipment.
Major EquipmentSelection BasisFugitive Dust-Generating Activities [EPA AP-42]
BulldozerNIER, EPABulldozing
LoaderNIERLoading material
ForkliftNIER, GRIN/A
ExcavatorNIER, GRIPower shovel
CraneNIERVehicular travel
Concrete pumpNIERN/A
RollerNIERCompacting
CompressorNIERN/A
Boring machineNIER, EPADrilling
Dump truckGRI, EPADumping, loading material, vehicular travel
ScraperEPAUnloading topsoil, removing topsoil, vehicular travel
GraderEPAGrading
Concrete mixer truckGRIVehicular travel
Table 2. Variables for emission factor calculation.
Major EquipmentActivitiesVariables
(a) Silt
Content (%)
(b) Moisture
Content (%)
(c) Vehicle
Weight (ton)
(d) Wind Speed (m/s)(e) Vehicle
Speed (km/h)
BulldozerBulldozing912---
LoaderLoading-12-3.65-
ExcavatorPower shovel-----
CraneTravel9-5 --
RollerCompacting912---
Boring machineDrilling-----
Dump truckDumping-----
Loading-12-3.65-
Travel
(25, 20 t)
9-15 --
Travel
(8 t)
9-8 --
ScraperUnloading-----
Removing-----
Travel9-72 --
GraderGrading----15
Concrete mixer truckTravel9-11 --
(a), (b), (d): National Institute of Environmental Research (NIER), improvement in the calculation method of the amount of fugitive dust emission and the development of a real-time measurement method of resuspended road dust [24]. (c): Construction equipment catalogs (e): Ministry of Land, Infrastructure and Transport (MOLIT), 2020 standard of construction estimate [25].
Table 3. Dust-generating activities [22].
EPA AP-42 Heavy Construction Operation
Construction PhaseDust-Generating Activities
1. Demolition and debris(1) Demolition of buildings or other (natural) obstacles such as trees, boulders, etc.
 a. Mechanical dismemberment of existing structures
 b. Implosion of existing structures
 c. Drilling and blasting of soil
 d. General land clearing
(2) Loading of debris into trucks
(3) Truck transport of debris
(4) Truck unloading of debris
2. Site preparation (earth moving)(1) Bulldozing
(2) Scrapers unloading topsoil
(3) Scrapers in travel
(4) Scrapers removing topsoil
(5) Loading of excavated material into trucks
(6) Truck dumping of fill material, road base, or other materials
(7) Compacting
(8) Motor grading
3. General construction(1) Vehicular travel
(2) Portable plants
 a. Crushing
 b. Screening
 c. Material transfers
(3) Other operations
Table 4. Equipment by earthwork distance.
Work ClassificationWork DistanceEquipment Standard Earth-Work Allocation
Soil compactingAverage of 20 m- BulldozerA zone
Soil transportation60 m or less- BulldozerB zone
60–100 m- Bulldozer
- Loader + dump truck
- Excavator + dump truck
C zone
100 m or longer- Loader + dump truck
- Excavator + dump truck
- Scraper
D zone
Reference: MOLIT, 2020 standard of construction estimate [25].
Table 5. Emission factors according to equipment and activities.
EquipmentActivityEmission Factor (kg/unit)
PM2.5PM10Unit
BulldozerBulldozing3.20 × 10−25.96 × 10⁻²ton
LoaderLoading1.33 × 10−58.80 × 10⁻⁵ton
ExcavatorPower shovel1.80 × 10−39.00 × 10⁻³ton
CraneTravel4.11 × 10−24.11 × 10⁻¹VKT
RollerCompacting3.20 × 10−25.96 × 10⁻²ton
Boring machineDrilling1.45 × 10−27.26 × 10⁻²hole
Dump truckDumping1.00 × 10−45.00 × 10⁻⁴ton
Loading1.33 × 10−58.80 × 10⁻⁵ton
Travel (25 t)6.73 × 10−26.73 × 10−1VKT
Travel (20 t)6.73 × 10−26.73 × 10−1VKT
Travel (8 t)5.07 × 10−25.07 × 10−1VKT
ScraperUnloading5.78 × 10−45.78 × 10⁻³ton
Removing1.65 × 10−11.65 × 10VKT
Travel1.36 × 10−11.36 × 10VKT
GraderGrading9.18 × 10−27.56 × 10⁻¹VKT
Concrete mixer truckTravel5.86 × 10−25.86 × 10⁻¹VKT
Table 6. Particulate matter emissions (PM10, PM2.5).
Site Area (m2)PM10 Emissions (kg)PM2.5 Emissions (kg)
EarthworkGeneral ConstructionTotalEarthworkGeneral ConstructionTotal
10,0001.21 × 1047.26 × 1021.28 × 1046.50 × 1037.26 × 106.57 × 103
20,0002.02 × 1042.05 × 1032.23 × 1041.06 × 1042.05 × 1021.08 × 104
30,0002.78 × 1043.77 × 1033.15 × 1041.44 × 1043.77 × 1021.48 × 104
40,0003.35 × 1045.81 × 1033.93 × 1041.70 × 1045.81 × 1021.76 × 104
50,0003.90 × 1048.12 × 1034.71 × 1041.94 × 1048.12 × 1022.02 × 104
Publisher’s Note: MDPI stays neutral with regard to jurisdictional claims in published maps and institutional affiliations.

