Abstract
In this study, electrodes of titanium dioxide nanotube arrays (TNAs) were successfully synthesized by applying the anodic oxidation etching method, as well as the use of green synthetic technology to add reducing agents of tea or coffee to reduce metal palladium from palladium chloride. Synthesis of palladium modified TNAs (Pd/TNAs) was conducted by the microwave hydrothermal method after the metal palladium was reduced. In order to identify the surface structure, light absorption and elemental composition, TNAs and Pd/TNAs were characterized by X-ray photoelectron spectroscopy (XPS), and X-ray diffraction (XRD). Furthermore, to test the photocurrent density, electron resistance, and hydroxyl radicals by I-t plot, electrochemistry impedance spectroscopy (EIS), and electron paramagnetic resonance (EPR) were investigated. The photocurrent (4.0 mA/cm2) of Pd/TNAs-C (using coffee as the reducing agent) at +1.0 V (vs. Ag/AgCl) was higher than that of the pure TNAs (1.5 mA/cm2), illustrating that Pd/TNAs-C can effectively separate photogenerated electrons and holes. Pd/TNAs is a favorable material as a photoanode for the photoelectrochemical (PEC) removal of organic pollutants in wastewater.
1. Introduction
Chemical oxidation methods such as Fenton, ozone, hydrogen peroxide and chlorine oxidation are common used for the degradation of organic pollutants [1,2,3]. However, the oxidation efficiency may be low for compounds with benzene rings. To completely degrade persistent organic compounds, huge amounts of oxidation chemical are needed. The Fenton method applies Fe2+ as a catalyst to react with H2O2 to form hydroxyl radicals (·OH) and oxidize organic compounds, but it is accompanied with sludge, which leads to another environmental problem.
Catalytic oxidation using TiO2 is an emerging and promising method to remove organic pollutants in water. Compared with other semiconductors, TiO2 has the advantages of non-toxicity, high stability, and strong oxidation ability. Recently, TiO2 has been used in many different types of applications such as photocatalytic degradation [4], CO2 reduction [5], solar cells [6,7,8], biomedical science [9], supercapacitors [10] and so on. Since Fujishima and Honda [11,12] first discovered the photoelectrochemical ability of TiO2, various types of TiO2 have been studied over the subsequent decades. Among them, titanium dioxide nanotube arrays (TNAs) are practical owing to their film structure, which is easy to reuse and recycle. Furthermore, TNAs can be applied as photo-anodes to conduct photoelectrochemical (PEC) experiments. The PEC system has demonstrated the ability to reduce the recombination of photo-generated holes and electrons, and, therefore, to enhance the oxidation ability of TNAs [1,13]. The absorption edge of TiO2 is about 380–400 nm, depending on its allotropic crystalline phase, e.g., direct bandgap of 3.0 eV for rutile [14], indirect bandgap of 3.2 eV for anatase [15], and indirect bandgap of 3.4 eV for brookite Pure [16]. TNAs have a similar light utilization region to TiO2 NPs (nano-particles), i.e., 300–320 nm, which can only be excited by UV-light. Studies have attempted to solve the limitation of the light response of TNAs. Metals, non-metals, and metal oxides have been employed to modify TNAs. Peng et al. (2017) applied carbon and nitrogen to modify TNAs and found that this approach is useful to degrade perfluorooctanoic acid (PFOA). Sun et al. (2016) employed Cu2O to modify TNAs to form a p-n junction in Cu2O/TNAs. The results indicated that Cu2O/TNAs can PEC oxidize Ibuprofen effectively. Among noble metals, palladium (Pd) is the cheapest and the most commonly used for co-catalysis with TiO2. Ye et al. (2012) indicated that TNAs modified by palladium quantum dots exhibit significantly efficient photoelectrocatalytic hydrogen generation. Photo-generated electrons can be easily transferred from TiO2 to Pd particles deposited on the surface of TiO2, owing to the fact that the Fermi level of Pd is lower than TiO2, thereby greatly reducing the recombination of photo-generated electron-holes and leading to effective charge separation and increased photocatalysis reactions [17]. In addition to TNAs, Pd decorated TiO2 nanofibers (TiO2-Pd300 NFs) have proven to be an effective photocatalyst due to the formation of nano-sized Schottyky interfaces between TiO2 and nano-Pd particles [18].
The above studies show good examples of using TNAs for modification. However, these methods are either energy consuming or require chemicals that may cause other environmental problems. In recent years, the green synthesis of metal nanomaterials has attracted widespread attention. According to Anatas (1999), the definition of green chemistry refers to the design, development and implementation of chemical products and processes to reduce or eliminate the use and generation of substances hazardous to human health and the environment [19]. Palladium nanoparticles have been green synthesized with the help of aloe vera gel [20], extracts of Aspalathus Linearis [21], tea [22,23], coffee [22,24], etc. In this study, coffee and green tea was employed to green-synthesize palladium modified TNAs (Pd/TNAs) for the first time.
In Taiwan, the heavy use of organic compounds by humans has caused severe environmental damage. Most organic compounds are toxic and will cause harm to the environment and organisms once discharged without proper treatment. Discharge of dyeing wastewater into rivers can cause chromaticity problems, and some dyes can even cause cancer. In this study, methyl orange was selected as a target compound for the PEC oxidation experiment.
2. Results and Discussion
2.1. Physical and Chemical Properties of TNAs and Pd/TNAs
The microstructure of the surface of the as-synthesized material was observed by SEM. From Figure 1a, it can be seen that TNAs were successfully fabricated by the anodization method. The average diameter of the nanotube columns is 300–400 nm. The length of the nano tube is about 2–3 μm, according to the cross-sectional view shown in Figure 1b. Figure 1c shows the SEM image of Pd/TNAs prepared by the microwave hydrothermal method. It can be seen that the Pd NPs were deposited on the surface of TNAs. Furthermore, Figure 1d and e shows the SEM images of Pd/TNAs-C and Pd/TNAs-G, which were synthesized by using coffee and green tea as reductants. The obvious Pd NPs were deposited on the surface of the tubular structure of TNAs with a size of about 10 nm. Figure S1 shows the SEM mapping of Pd/TNAs-C that illustrates the existence of Pd NPs on the TNAs. The at% of Pd was 1.49%, as determined from the results of SEM EDS analysis (Table S1). The results of SEM demonstrate that Pd NPs were successfully deposited in the TNAs and this was enhanced when using coffee and green tea as reductants.
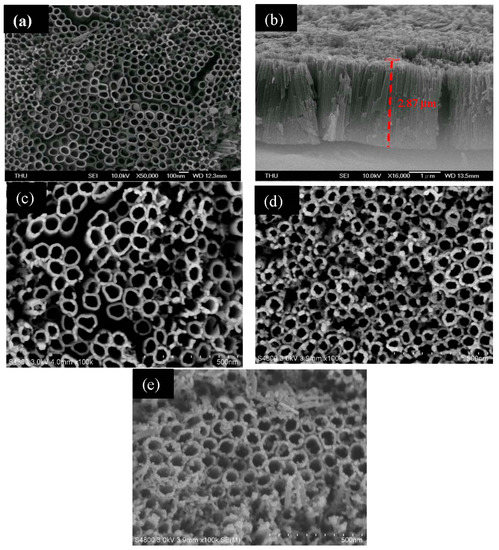
Figure 1.
SEM images of (a) titanium dioxide nanotube arrays (TNAs), (b) TNAs (cross section), (c) palladium modified TNAs (Pd/TNAs), (d) Pd/TNAs-C and (e) Pd/TNAs-G.
The formed nano-palladium metal particles are mainly deposited as round nano-particles, and the conditions of different palladium chloride concentrations, dosages and reaction times will affect the deposition effect. Figure 2 shows the X-ray diffraction analysis of TNAs, Pd/TNAs, Pd/TNAs-C and Pd/TNAs-G. The standard cards of the Joint Committee for Powder Diffraction Files (JCPDS) were employed for XRD discussion. The TNAs were mainly dominated by TiO2 anatase at 2θ of 25.3°, 37.8°, and 54.0°, corresponding to the crystal planes of (101), (004), and (105), respectively. According to JCPDS 46-1043, ideally, 2θ will have characteristic peaks of Pd at 40.0°, 46.7°, 68.0°, 82.0°, and 86.5°. The results are similar to those of El-Rady et al. [25], illustrating that palladium NPs are successfully dispersed in the TiO2 substrate.

Figure 2.
XRD analysis of TNAs, Pd/TNAs, Pd/TNAs-C, and Pd/TNAs-G.
Figure 3 shows the results of XPS analysis for Pd/TNAs-C (The results of XPS analysis for Pd/TNAs-G and Pd/TNAs are shown in Supporting Information as Figures S1 and S2). Figure 3a shows peaks at 284.6 and 286.5 eV that were attributed to element carbon and C–O bands. Figure 3b shows that the Ti spectrum includes two characteristic peaks at 458.8 eV and 464.3 eV, corresponding to element states of Ti 2p3/2 and Ti 2p1/2, respectively. The peak in the Ti 2p region demonstrates that Ti exists in Ti4+, as confirmed by the oxidation of Ti to TiO2. Figure 3c shows the O 1s spectra, which includes two characteristic peaks at 530.0 eV and 532.8 eV, which are assigned to the Ti-O bonds in TiO2 [26]. The Pd spectra (Figure 3d) include four clear peaks at 335.1, 337.8, 340.5, and 342.7 eV. The Pd 3d5/2 peaks at about 335.1 eV and the Pd 3d3/2 peaking near 340.5 eV, are represented as Pd0, while the Pd 3d5/2 peaking at 337.8 eV and Pd 3d3/2 peaking at 342.7 eV are represented as PdO [27]. Table 1 shows the XPS analysis results of Pd/TNAs-C, revealing that the atomic percentages for C, O, Ti, and Pd were 58.30%, 34.60%, 5.97%, and 1.13%, respectively. Notably, the Pd occupied 0.82%, 1.13%, and 1.08% of Pd/TNAs, Pd/TNAs-C, and Pd/TNAs-G, respectively. From the XPS results, we can confirm that Pd was successfully deposited on the surface of TNAs by the microwave hydrothermal method.

Figure 3.
XPS analysis of Pd/TNAs-C (a) C 1s, (b) Ti 2p, (c) O 1s, and (d) Pd 3d5 3d3.

Table 1.
The percentage of each element by XPS analysis of Pd/TNAs, Pd/TNAs-C and Pd/TNAs-G.
Figure 4 shows the UV-VIS absorption spectra for TNAs, Pd/TNAs, Pd/TNAs-C, and Pd/TNAs-G. The absorption of TNAs mainly falls in the range of 383 nm (Eg = 3.2 eV), which corresponds to the anatase phase of TiO2. TNAs were successfully synthesized by doping Pd with the microwave hydrothermal method to form Pd/TNAs. The absorption of Pd/TNAs red-shifts to the visible light region at about 414 nm (Eg = 2.95 eV). The light response of the as-synthesized material was enhanced by adding the reducing agent (tea, coffee) during the microwave hydrothermal method, as evidenced by the Pd/TNAs-C (474 nm, i.e., Eg = 2.37 eV) and Pd/TNAs-G (441 nm, i.e., Eg = 2.75 eV) performing higher light absorptions than the TNAs and Pd/TNAs.

Figure 4.
UV-VIS spectra of TNAs, Pd/TNAs, Pd/TNAs-C, and Pd/TNAs-G.
2.2. Electrochemical Performance
Figure 5 shows the photo–current–time response for TNAs, Pd/TNAs, Pd/TNAs-C, and Pd/TNAs-G under light (100 W mercury lamp) at +1.0 V (vs. Ag/AgCl). From Figure 5, when the light is on, the photo-generated currents are 1.5, 3.1, 4.0, and 3.7 mA/cm2 for TNAs, Pd/TNAs, Pd/TNAs-C, and Pd/TNAs-G, respectively. The photo-currents of Pd/TNAs, Pd/TNAs-G, and Pd/TNAs-C are 2.00, 2.47, and 2.67 times higher than that of pure TNAs, respectively. This result confirms the UV-VIS findings, that depositing Pd on TNAs can enhance the photo-response of TNAs, leading to the generation of a photocurrent.
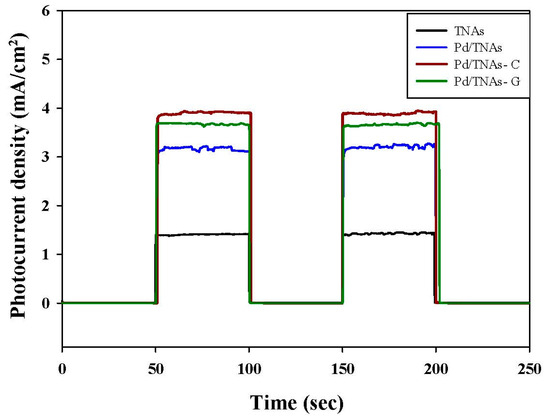
Figure 5.
I-t graph of each material by switching lamp test under 100 W Hg lamp illuminations.
The behavior of charge transfer and recombination at the semiconductor–electrolyte interface can be studied by EIS. Figure 6 shows the Nyquist plots for TNAs, Pd/TNAs, Pd/TNAs-C, and Pd/TNAs-G electrodes (fitting parameters are shown in Figure S2 in supplementary information). According to the literature, a smaller semi-circular arc diameter means a faster transfer of interfacial charge to an electron donor-acceptor or photo-generated electron-hole, thereby enabling more efficient separation [28]. The radii follow the order of TNAs > Pd/TNAs > Pd/TNAs-C > Pd/TNAs-G. Electrochemical analysis results can clearly prove that Pd/TNAs, Pd/TNAs-C and Pd/TNAs-G electrodes have a smaller charge transfer resistance than TNA electrodes. Pd/TNAs-G and Pd/TNAs-C electrodes with tea and coffee as reducing agents can reduce electrode impedance to 1.5 times that of TNAs. Table 2 summarizes the impedance of the tested electrodes, where Rs represents the resistance of the solution; Rp represents the resistance to charge transfer at the interface between Cu2O/TNAs and electrolytes, and CPE represents the constant phase element. From Table 2, the Rp values were 112.72 and 108.93 Ω for Pd/TNAs-C and Pd/TNAs-G, respectively, which are significantly smaller than that of TNAs (384.25 Ω). The Rp may also vary with the thickness and the crystalline composition for the electrode [29,30]. Yalavarthi et al. (2019) applied an anatase and rutile mixed-phase TiO2 for PEC water splitting and found that the Rp was the smallest at the anatase-to-rutile ratio of 82:18. On the other hand, Gimenez et al. (2012) used mesoporous TiO2 for water splitting and indicated that the Rp was reduced with the increasing thickness of the mesoporous TiO2 electrode. In this study, we investigated the electron lifetime τel of the photoexcited electrons in the PEC system. Figure 7 shows the Bode plot in the range of 10−2–102 Hz. Results show that the peak values are 0.72 and 0.96 Hz for Pd/TNAs-C and Pd/TNAs-G, respectively. As shown in Table 3, according to the formula, τel = 1/(2πfmax), the electron lifetimes are 221.2 ms and 165.9 ms for Pd/TNAs-C and Pd/TNAs-G, respectively. Similar results can also be found in the study by Chang et al. (2016), who showed that the τel was 13.28 ms for pure TNAs under electrochemical anodizing for synthesis [31].
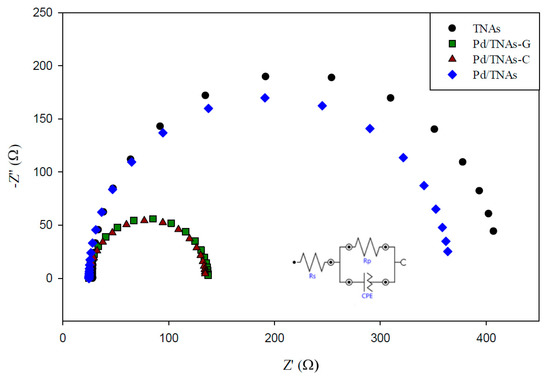
Figure 6.
Nyquist graph of TNAs, Pd/TNAs, Pd/TNAs-C, and Pd/TNAs-G under 100 W Hg lamp.
Table 2.
The fitting result of TNAs, Pd/TNAs, Pd/TNAs-C and Pd/TNAs-G.
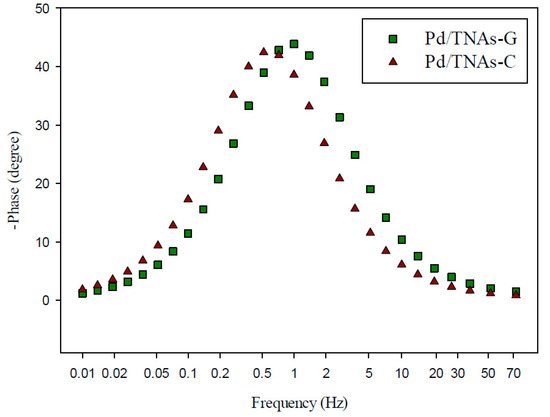
Figure 7.
Bode plot of Pd/TNAs-C and Pd/TNAs-G under 100 W Hg lamp.
Table 3.
The electronic life of Pd/TNAs-C and Pd/TNAs-G.
2.3. MO Degradation via the Pd/TNAs PEC System
In this study, methyl orange was used as the target pollutant to evaluate the degradation ability of TNAs, Pd/TNAs, Pd/TNAs-C, and Pd/TNAs-G. The photoelectrochemical, photocatalytic, photolysis and electrochemical methods were compared for MO degradation. The initial concentration of MO was 10 ppm in 0.1 M NaCl solution. In the PEC, PC, and P systems, the light source was a 100 W Hg lamp. The bias potential was +1.0 V (vs. Ag/AgCl) in the PEC and EC (electrochemical) system. Figure 8a–d compares different methods for degrading MO by using TNAs as photo-anodes. Among the four methods, the MO removal efficiency follows the order of PEC > PC > EC > P. PCE is the most efficient way to remove MO. From Figure 8, it seems that MO is rarely degraded by electrochemical oxidation and photolysis. This observation is similar to that of Peng et al. (2012), who applied an N-doped TiO2 thin film as a photoanode in a PEC system to remove MO [32]. Photocatalytic oxidation of MO was effective for TNAs, Pd/TNAs, Pd/TNAs-C, and Pd/TNAs-G. With light illuminating the photocatalysts (i.e., TNAs), photo-generated electrons can jump from a valence band to the conduction band and leave photo-generated holes to react with water molecules, and thus generate hydroxyl radicals (·OH). The ·OH is one of the strong oxidantants which can degrade MO easily. However, the recombination of photo-generated electrons and holes may decrease the efficiency of MO degradation. Notably, MO can be completely removed in 2, 1, 0.5, and 1 h, with a rate constant of 2.16 × 10⁻¹, 7.58 × 10⁻¹, 1.05, and 7.91 × 10⁻¹ h−1, in TNAs, Pd/TNAs, Pd/TNAs-C, and Pd/TNAs-G PEC systems, respectively. In the Pd/TNAs PEC system, with Pd NP modification, the rate constant of MO degradation is 4.86 times higher than that of the pure TNAs. This result illustrates that Pd depositing can reduce the bandgap of TNAs and enhance the light response. Although some researchers proposed that dyes are inappropriate as model systems for the testing of the PC activity of photocatalysts [33], dyes are easy to observe and important sources of water pollutants. Figure 9a shows the results of the total organic carbon (TOC) removal rate of MO PEC degradation by using TNAs, Pd/TNAs, Pd/TNAs-C, and Pd/TNAs-G. Similar to MO degradation, PEC performs the most efficiently to remove the TOC of MO. In a 4 h PEC reaction time, the TOC removal rates reached 32%, 39%, 55%, and 51% by using TNAs, Pd/TNAs, Pd/TNAs-C, and Pd/TNAs-G, respectively. Similar results are found by Hernández-Gordillo et al. (2019), who used Bi2O3 to degrade rhodamine-B (RhB), acid blue 113 (AB) and indigo carmine (IC). The TOC removal reached 52%, 81%, and 56% for RhB, AB and IC, respectively, indicating that by-products were remaining in the solutions [34].
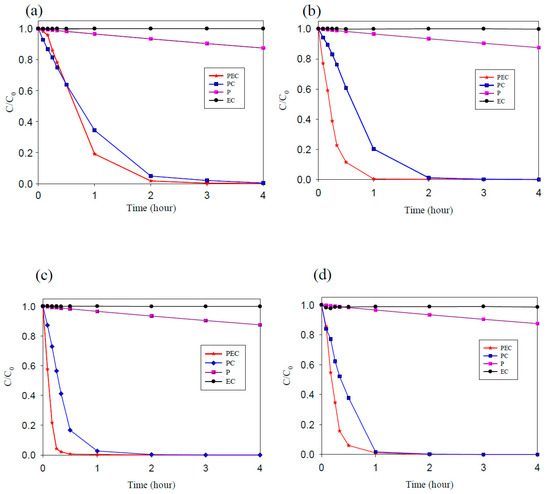
Figure 8.
The degradation efficiency of methyl orange (a) TNAs, (b) Pd/TNAs, (c) Pd/TNAs-C, and (d) Pd/TNAs-G.
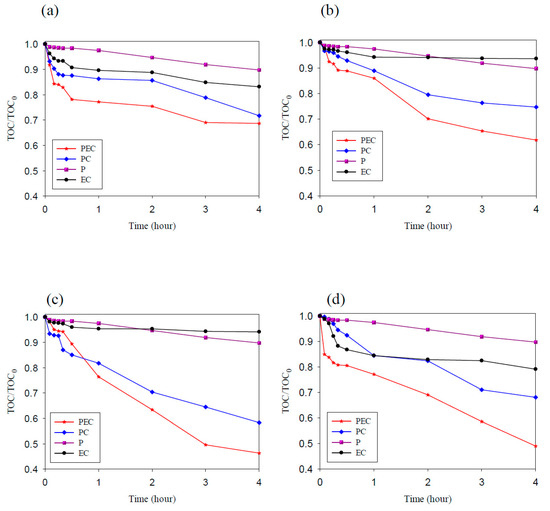
Figure 9.
The removal rate of total organic carbon (TOC) by degrading methyl orange (a) TNAs, (b) Pd/TNAs, (c) Pd/TNAs-C, and (d) Pd/TNAs-G.
2.4. Hydrogen Generation via the Pd/TNAs PEC System
In the cathodic chamber, the photo-generated electrons, which are attracted from the anodic chamber, could reduce water to hydrogen. Figure 10 compares the hydrogen production of various materials using PEC methods. Upon 30 min of reaction, hydrogen—with a concentration of 238.6 mM/cm2—was observed in the Pd/TNAs-C PEC system, while no hydrogen was yet detected in the TNAs, Pd/TNAs, and Pd/TNAs-G PEC systems. In the fourth hour, hydrogen production of TNAs, Pd/TNAs, Pd/TNAs-C, and Pd/TNAs-G was 560.1, 838.8, 1677.9, and 1273.3 mM/cm2, respectively. In general, the trends of hydrogen generation in the cathodic chamber are consistent with the results of photocurrent-time responses (Figure 5).
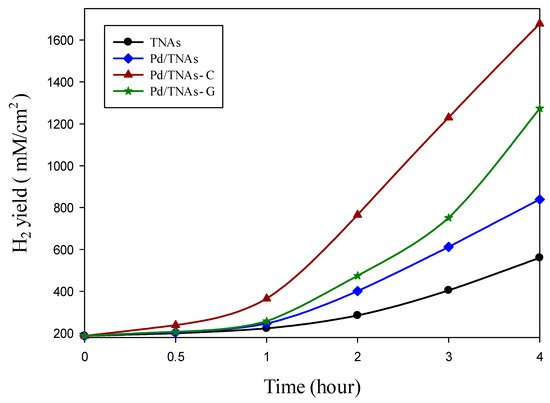
Figure 10.
Comparison of hydrogen production by each material via the photoelectrochemical method.
2.5. Durable Test for Pd/TNAs
The durability test of the Pd/TNAs-C PEC degradation of MO, as well as hydrogen generation were also performed. As shown in Figure 11, the Pd/TNAs-C PEC removal of MO showed good stability during PEC cycle and retained 100% of its initial activity, with the first-pseudo rate constants of 0.0174, 0.0165, 0.052 min−1 for three runs. Meanwhile, TOC removal in triplicate experiments all reached 50%, with rate constants of 0.0034, 0.0032 and 0.0027 min−1. In addition, in the cathodic chamber, the concentration of hydrogen generation was 1677, 1605 and 1593 μM/cm2 after 4 h of reaction time for each cycle. The results above illustrate that Pd/TNAs-C exhibits high stability and can be reused.
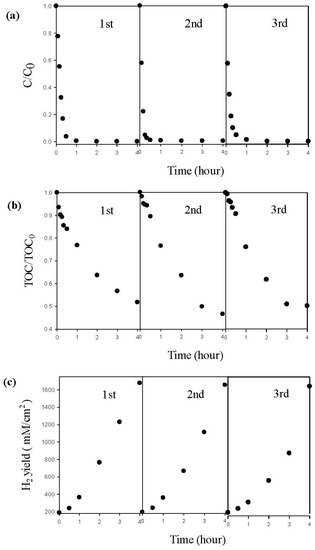
Figure 11.
The repeated experiment by Pd/TNAs-C in photoelectrochemical (PEC) system (a) methyl orange degradation, (b) total organic carbon removal, and (c) hydrogen production.
2.6. ESR Analysis
Figure 12 shows the results of ESR (electron spin resonance) analyses for TNA and Pd/TNAs. As seen in Figure 12a, a peak intensity of 1:2:2:1 was observed after irradiation, indicating the continuous generation of DMPO–·OH. Figure 12b shows the results of ESR analyses for Pd/TNAs, where hydroxyl radicals were also observed upon light irradiation. The hole—electron pair generated under light illumination and produced applied bias potential promoted valence band electrons (eVB) at the conduction band, which yielded valance band holes (hVB) and produced hydroxyl radicals at the surface of photoanode. The latter process is related to the PEC degradation of the pollutant.
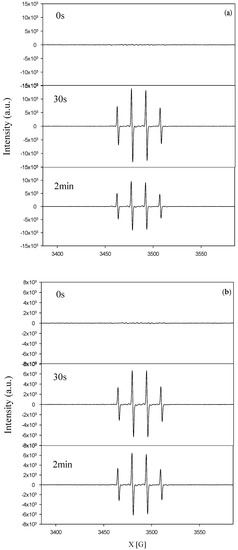
Figure 12.
Electron paramagnetic resonance (EPR) signal of DMPO-OH compound under dark reaction and ultraviolet irradiation (a) TNAs and (b) Pd/TNAs.
3. Experimental Section
3.1. Synthesis of TNAs and Pd/TNAs
TNAs were prepared by electrochemical anodization, similar to the method described by Peng et al. [35]. Briefly, before anodization, Ti foil (0.25 mm thick, 99.5% purity, Sigma-Aldrich, St. Louis, MI, USA) was cleaned by sonication in 1:1 volume ratio of acetone and ethanol, followed by rinsing with DI water (deionized water) and drying in a stream of air. The cleaned Ti foil and Pt were used as anode and cathode, respectively, and placed at a distance of 5.0 cm from each other in a glass reactor. We then immersed them in ethylene glycol solution (99.8%, Sigma-Aldrich) containing 0.25 wt% NH4F (98.0%, Sigma-Aldrich) and 2 vol% H2O. A DC power supply with a constant voltage of 40 V was used to anodize the Ti foil at room temperature for 1 h. All the obtained TNAs, initially amorphous, were annealed at 450 °C for 3 h in the air atmosphere to increase crystallinity.
The Pd-deposited TNAs were synthesized by the microwave-hydrothermal method. First, TNAs were immersed in a solution of 0.1 M PdCl2 (purity > 99.9%, Sigma-Aldrich Co., Ltd.) with a volume of 50 mL, and subjected to microwave heating at 90 °C for 5 min under the power of 400 W. Green syntheses of Pd/TNAs were conducted by applying tea leaves and coffee powders as green reductants. Briefly, tea leaves (8 g) were brewed in 200 mL of boiled water for 5 min followed by filtration through a 0.22 μm filter to collect the tea solution. Another method of green synthesis of Pd/TNAs-C was conducted using coffee powder. Three grams of coffee powders was brewed in 50 mL of boiled water for 5 min. The coffee solution was collected by filtration through a 0.22 μm filter. Pd/TNAs-C and Pd/TNAs-G were synthesized with the same procedure but replacing the DI water with coffee and green tea solution, respectively.
3.2. Characterization of Pd-TNAs
The crystal structure of TNA was analyzed by X-ray diffraction (XRD) (D8 discover SSS, Bruker, Germany) with a Cu Kα source with a wavelength of 0.154 nm. The JCPDS PDF card database was employed as a reference to identify the XRD peak. A field-emission scanning electron microscope (FE-SEM) (S-4800, Hitachi, Japan) was applied to observe the morphology of as-synthesized materials. The UV-VIS absorption spectra were measured under the diffused reflection mode using the integrating sphere attached to a Jasco T-60 UV-VIS spectrometer. The XPS analyses were conducted on the TNAs with a PHI 5000 Versa Probe system (Physical Electronics, Chanhassen MN, USA). The binding energy of the XPS spectra was calibrated with reference to the C1s peak 284.8 eV.
3.3. PEC and Electrochemical Measurements
All PEC experiments were conducted in a self-designed three-electrode system. A Pd-TNA, a platinum wire and an Ag/AgCl electrode were selected as the working electrode, counter electrode and reference electrode, respectively. In the PEC, PC (photocatalytic) and P (photolysis) processes, a 100 W Hg lamp with a power of 95.5 mW/cm2 was used as the light source. All methyl orange removal experiments were carried out in a H-type reactor, which was designed to separate the anodic and cathodic chamber for comparison of the MO (methyl orange) degradation by different methods. A cation-exchanged membrane was used to connect these two chambers to maintain the ion balance in the system. A quartz window (7 cm2), on the side of the anode chamber, was used for efficient optical quality. Upon light irradiation, the reaction solution was sampled to determine the concentration change of MO using a UV-VIS spectrophotometer (T-630). In this study, the MO degradation in the PEC system conforms to a pseudo-first-order reaction, and its kinetics can be represented by the following equation: ln(C0/C) = kt, where k is the apparent rate constant and C0 and C are the initial and reaction concentrations of aqueous MO, respectively. The PC experiment was conducted by applying the same system without external potential. An EC oxidation experiment was performed on the same bias without light irradiation. Electrochemical impedance spectroscopy (EIS) tests were carried out under an open circuit voltage over a frequency range from 10 kHz to 10 MHz with an AC voltage magnitude of 5 mV. The I-t curve measurements and PEC degradation experiments were controlled by an electricity workstation (AutoLAB PGSTAT302N, Utrecht, The Netherlands).
4. Conclusions
In this study, an anodic oxidation etching method was successfully used to fabricate a titanium dioxide nanotube array. Palladium was successfully synthesized by a green synthesis technology-microwave hydrothermal method with tea and coffee as reductants. According to the SEM results, TNAs have a highly ordered tube structure with an average diameter between 300–400 nm. The length of the tube is between 2–3 μm. XRD analysis showed that TNAs were dominated by the anatase phase. However, Pd could not be judged due to the absence of characteristic peaks. XPS results indicate that Ti in Pd/TNAs exists as +4 state, while Pd is shown in 0 and +2 states. According to the UV-VIS results, the absorption range of Pd/TNAs red-shifts from 383 nm to 474 nm. The result of the photocurrent test confirms the UV-VIS findings, that depositing Pd on TNAs can enhance the photo-response of TNAs, leading to the generation of a photocurrent. Hydrogen production experiments can be performed in the cathodic chamber while degrading methyl orange in the anodic chamber. Among the four materials, Pd/TNAs-C and Pd/TNAs-G performed better in MO degradation and hydrogen production than TNAs did. ESR uses a DMPO spin trapping agent to capture short-lived radicals, proving that TNAs and Pd/TNAs both form electrons and holes and generate hydrogen and hydroxyl radicals after irradiation with light. In the current PEC system, most of the electrons were transferred to the cathode, which can reduce the recombination of photogenerated electrons and holes, thereby increasing the photon efficiency.
Supplementary Materials
The following are available online at https://www.mdpi.com/2073-4344/10/11/1330/s1, Figure S1: SEM mapping of Pd/TNAs-C; Table S1: EDS results of Pd/TNAs-C.
Author Contributions
Formal analysis, S.-W.H.; Investigation, C.-E.H. and H.-W.L. (Hsing-Wang Li); Methodology, H.-W.L. (Hsiao-Wu Lai); Project administration, C.-H.C.; Supervision, Y.-C.L. (Yuan-Chung Lin) and K.-S.C.; Writing—original draft, Y.-P.P.; Writing—review & editing, Y.-C.L. (Yung-Chang Lin). All authors have read and agreed to the published version of the manuscript.
Funding
This research was founded by the Ministry of Science and Technology, Taiwan, under grant number 108-2628-E110-007-MY3.
Acknowledgments
This study was funded by the Ministry of Science and Technology, Taiwan, under Grant No. 108-2628-E-110-007-MY3.
Conflicts of Interest
The authors declare no conflict of interest.
References
- Anastas, P.T. Green chemistry and the role of analytical methodology development. Crit. Rev. Anal. Chem. 1999, 29, 167–175. [Google Scholar] [CrossRef]
- Batmunkh, M.; Shearer, C.J.; Bat-Erdene, M.; Biggs, M.J.; Shapter, J.G. Single-Walled Carbon Nanotubes Enhance the Efficiency and Stability of Mesoscopic Perovskite Solar Cells. ACS Appl. Mater. Interfaces 2017, 9, 19945–19954. [Google Scholar] [CrossRef] [PubMed]
- Chang, K.L.; Sun, Q.; Peng, Y.P.; Lai, S.W.; Sung, M.; Huang, C.Y.; Kuo, H.W.; Sun, J.; Lin, Y.C. Cu2O loaded titanate nanotube arrays for simultaneously photoelectrochemical ibuprofen oxidation and hydrogen generation. Chemosphere 2016, 150, 605–614. [Google Scholar] [CrossRef] [PubMed]
- Chen, H.; Peng, Y.P.; Chen, T.Y.; Chen, K.F.; Chang, K.L.; Dang, Z.; Lu, G.N.; He, H. Enhanced photoelectrochemical degradation of Ibuprofen and generation of hydrogen via BiOI-deposited TiO2 nanotube arrays. Sci. Total. Environ. 2018, 633, 1198–1205. [Google Scholar] [CrossRef]
- Cronemeyer, D.C. Electrical and optical properties of rutile single crystals. Phys. Rev. 1952, 87, 876. [Google Scholar] [CrossRef]
- El-Rady, A.A.A. Characterization and photocatalytic efficiency of palladium doped-TiO2 nanoparticles. Adv. Nanoparticles 2013, 2, 372–377. [Google Scholar] [CrossRef][Green Version]
- Fujishima, A.; Honda, K. Electrochemical photolysis of water at a semiconductor electrode. Nature 1972, 238, 37–38. [Google Scholar] [CrossRef]
- Gimenez, S.; Dunn, H.K.; Rodenas, P.; Fabregat-Santiago, F.; Miralles, S.G.; Barea, E.M.; Trevisan, R.; Guerrero, A.; Bisquert, J. Carrier density and interfacial kinetics of mesoporous TiO2 in aqueous electrolyte determined by impedance spectroscopy. J. Electroanal. Chem. 2012, 668, 119–125. [Google Scholar] [CrossRef]
- Habisreutinger, S.N.; Schmidt-Mende, L.; Stolarczyk, J.K. Photocatalytic reduction of CO2 on TiO2 and other semiconductors. Angew. Chem. Int. Ed. Engl. 2013, 52, 7372–7408. [Google Scholar] [CrossRef]
- Hanawa, T. A comprehensive review of techniques for biofunctionalization of titanium. J. Periodontal Implant. Sci. 2011, 41, 263–272. [Google Scholar] [CrossRef]
- Hariharan, D.; Thangamuniyandi, P.; Selvakumar, P.; Devan, U.; Pugazhendhi, A.; Vasantharaja, R.; Nehru, L. Green approach synthesis of Pd@ TiO2 nanoparticles: Characterization, visible light active picric acid degradation and anticancer activity. Process. Biochem. 2019, 87, 83–88. [Google Scholar] [CrossRef]
- Hernández-Gordillo, A.; Bizarro, M.; Gadhi, T.A.; Martínez, A.; Tagliaferro, A.; Rodil, S.E. Good practices for reporting the photocatalytic evaluation of a visible-light active semiconductor: Bi2O3, a case study. Catal. Sci. Technol. 2019, 9, 1476–1496. [Google Scholar] [CrossRef]
- Jung, K.H.; Seo, J.Y.; Lee, S.; Shin, H.; Park, N.G. Solution-processed SnO2 thin film for a hysteresis-free planar perovskite solar cell with a power conversion efficiency of 19.2%. J. Mater. Chem. A 2017, 5, 24790–24803. [Google Scholar] [CrossRef]
- Kar, A.; Raja, K.; Misra, M. Electrodeposition of hydroxyapatite onto nanotubular TiO2 for implant applications. Surf. Coat. Technol. 2006, 201, 3723–3731. [Google Scholar] [CrossRef]
- Koelsch, M.; Cassaignon, S.; Guillemoles, J.F.; Jolivet, J.P. Comparison of optical and electrochemical properties of anatase and brookite TiO2 synthesized by the sol–gel method. Thin Solid Films 2002, 403, 312–319. [Google Scholar] [CrossRef]
- Lebaschi, S.; Hekmati, M.; Veisi, H. Green synthesis of palladium nanoparticles mediated by black tea leaves (Camellia sinensis) extract: Catalytic activity in the reduction of 4-nitrophenol and Suzuki-Miyaura coupling reaction under ligand-free conditions. J. Colloid Interface Sci. 2017, 485, 223–231. [Google Scholar] [CrossRef] [PubMed]
- Lu, L.W.; Peng, Y.P.; Chang, C.N. Applying an activated carbon/silver catalyst to the decomposition of the aqueous solutions of tetramethyl ammonium hydroxide. J. Taiwan Inst. Chem. Eng. 2018, 88, 130–136. [Google Scholar] [CrossRef]
- Lu, L.W.; Peng, Y.P.; Chang, C.N. Catalytic ozonation by palladium–manganese for the decomposition of natural organic matter. Sep. Purif. Technol. 2018, 194, 396–403. [Google Scholar] [CrossRef]
- Lu, X.; Wang, G.; Zhai, T.; Yu, M.; Gan, J.; Tong, Y.; Li, Y. Hydrogenated TiO2 nanotube arrays for supercapacitors. Nano Lett. 2012, 12, 1690–1696. [Google Scholar] [CrossRef]
- Mayedwa, N.; Mongwaketsi, N.; Khamlich, S.; Kaviyarasu, K.; Matinise, N.; Maaza, M. Green synthesis of nickel oxide, palladium and palladium oxide synthesized via Aspalathus linearis natural extracts: Physical properties & mechanism of formation. Appl. Surf. Sci. 2018, 446, 266–272. [Google Scholar]
- Meriam Suhaimy, S.H.; Lai, C.W.; Tajuddin, H.A.; Samsudin, E.M.; Johan, M.R. Impact of TiO2 Nanotubes’ Morphology on the Photocatalytic Degradation of Simazine Pollutant. Materials 2018, 11, 2066. [Google Scholar] [CrossRef] [PubMed]
- Nadagouda, M.N.; Varma, R.S. Green synthesis of silver and palladium nanoparticles at room temperature using coffee and tea extract. Green Chem. 2008, 10, 859–862. [Google Scholar] [CrossRef]
- Ohtani, B. Preparing articles on photocatalysis—Beyond the illusions, misconceptions, and speculation. Chem. Lett. 2008, 37, 216–229. [Google Scholar] [CrossRef]
- Park, J.; Won, S.W.; Mao, J.; Kwak, I.S.; Yun, Y.S. Recovery of Pd (II) from hydrochloric solution using polyallylamine hydrochloride-modified Escherichia coli biomass. J. Hazard. Mater. 2010, 181, 794–800. [Google Scholar] [CrossRef]
- Peng, Y.P.; Peng, L.C.; Chen, K.F.; Chen, C.H.; Chang, K.L.; Chen, K.S.; Dang, Z.; Lu, G.N.; Sun, J. Degradation of trichloroethylene by photoelectrochemically activated persulfate. Chemosphere 2020, 254, 126796. [Google Scholar] [CrossRef]
- Peng, Y.P.; Yassitepe, E.; Yeh, Y.T.; Ruzybayev, I.; Shah, S.I.; Huang, C. Photoelectrochemical degradation of azo dye over pulsed laser deposited nitrogen-doped TiO2 thin film. Appl. Catal. B Environ. 2012, 125, 465–472. [Google Scholar] [CrossRef]
- Rahman, M.; Wei, M.; Xie, F.; Khan, M. Efficient Dye-Sensitized Solar Cells Composed of Nanostructural ZnO Doped with Ti. Catalalysts 2019, 9, 273. [Google Scholar] [CrossRef]
- Riboni, F.; Nguyen, N.T.; So, S.; Schmuki, P. Aligned metal oxide nanotube arrays: Key-aspects of anodic TiO2 nanotube formation and properties. Nanoscale Horiz. 2016, 1, 445–466. [Google Scholar] [CrossRef]
- Rochkind, M.; Pasternak, S.; Paz, Y. Using dyes for evaluating photocatalytic properties: A critical review. Molecules 2014, 20, 88–110. [Google Scholar] [CrossRef]
- Tang, H.; Prasad, K.; Sanjinès, R.; Schmid, P.; Levy, F. Electrical and optical properties of TiO2 anatase thin films. J. Appl. Phys. 1994, 75, 2042–2047. [Google Scholar] [CrossRef]
- Wu, M.C.; Lee, P.H.; Lee, D.L. Enhanced photocatalytic activity of palladium decorated TiO2 nanofibers containing anatase-rutile mixed phase. Int. J. Hydrog. Energy 2015, 40, 4558–4566. [Google Scholar] [CrossRef]
- Yalavarthi, R.; Naldoni, A.; Kment, Š.; Mascaretti, L.; Kmentová, H.; Tomanec, O.; Schmuki, P.; Zbořil, R. Radiative and non-radiative recombination pathways in mixed-phase TiO2 nanotubes for PEC water-splitting. Catalalysts 2019, 9, 204. [Google Scholar] [CrossRef]
- Yang, X.; Li, Q.; Wang, H.; Huang, J.; Lin, L.; Wang, W.; Sun, D.; Su, Y.; Opiyo, J.B.; Hong, L. Green synthesis of palladium nanoparticles using broth of Cinnamomum camphora leaf. J. Nanoparticle Res. 2010, 12, 1589–1598. [Google Scholar] [CrossRef]
- Ye, M.; Gong, J.; Lai, Y.; Lin, C.; Lin, Z. High-efficiency photoelectrocatalytic hydrogen generation enabled by palladium quantum dots-sensitized TiO2 nanotube arrays. J. Am. Chem. Soc. 2012, 134, 15720–15723. [Google Scholar] [CrossRef]
- Peng, Y.P.; Chen, H.; Huang, C. The synergistic effect of photoelectrochemical (PEC) reactions exemplified by concurrent perfluorooctanoic acid (PFOA) degradation and hydrogen generation over carbon and nitrogen codoped TiO2 nanotube arrays (CN-TNTAs) photoelectrode. Appl. Catal. B Environ. 2017, 209, 437–446. [Google Scholar] [CrossRef]


Publisher’s Note: MDPI stays neutral with regard to jurisdictional claims in published maps and institutional affiliations. |
© 2020 by the authors. Licensee MDPI, Basel, Switzerland. This article is an open access article distributed under the terms and conditions of the Creative Commons Attribution (CC BY) license (http://creativecommons.org/licenses/by/4.0/).