Group versus Individualised Minimum Velocity Thresholds in the Prediction of Maximal Strength in Trained Female Athletes


 ,
,  , and
, and
Abstract
:1. Introduction
2. Materials and Methods
2.1. Participants
2.2. Experimental Design
2.3. Incremental Loading Test
2.4. Description of Exercises
2.5. Data Acquisition
2.6. Statistical Analysis
3. Results
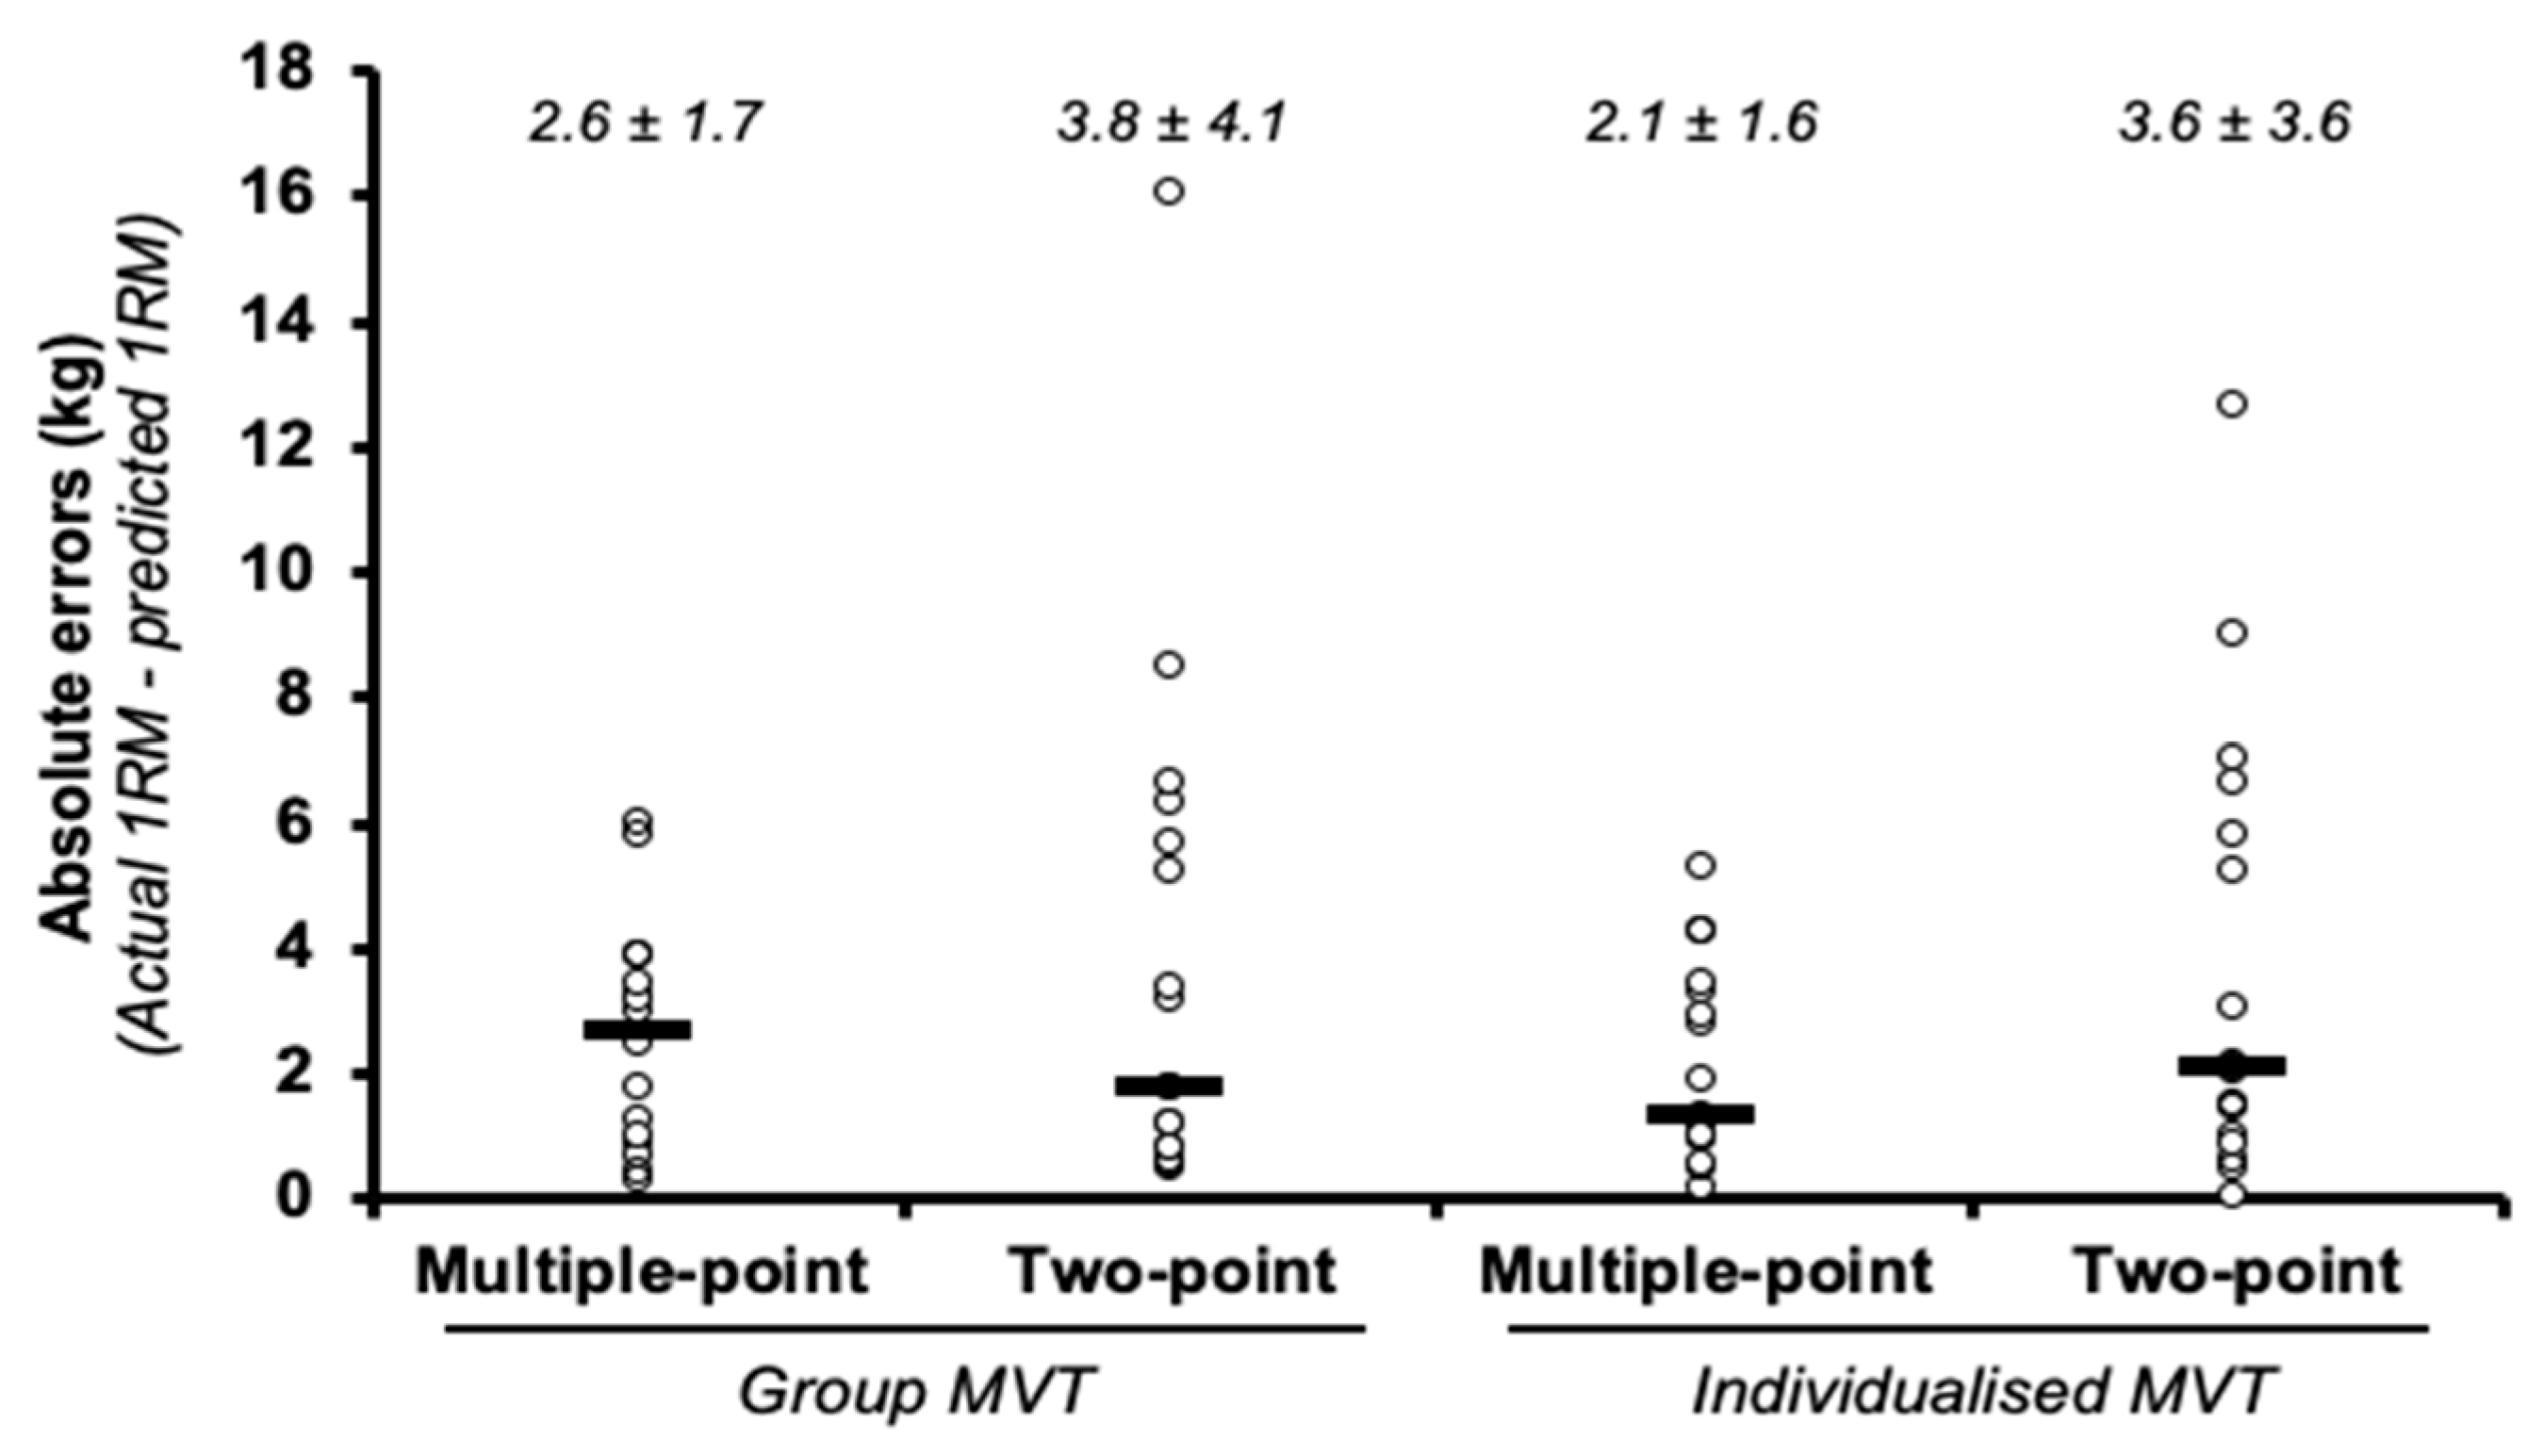
3.1. Bench Press
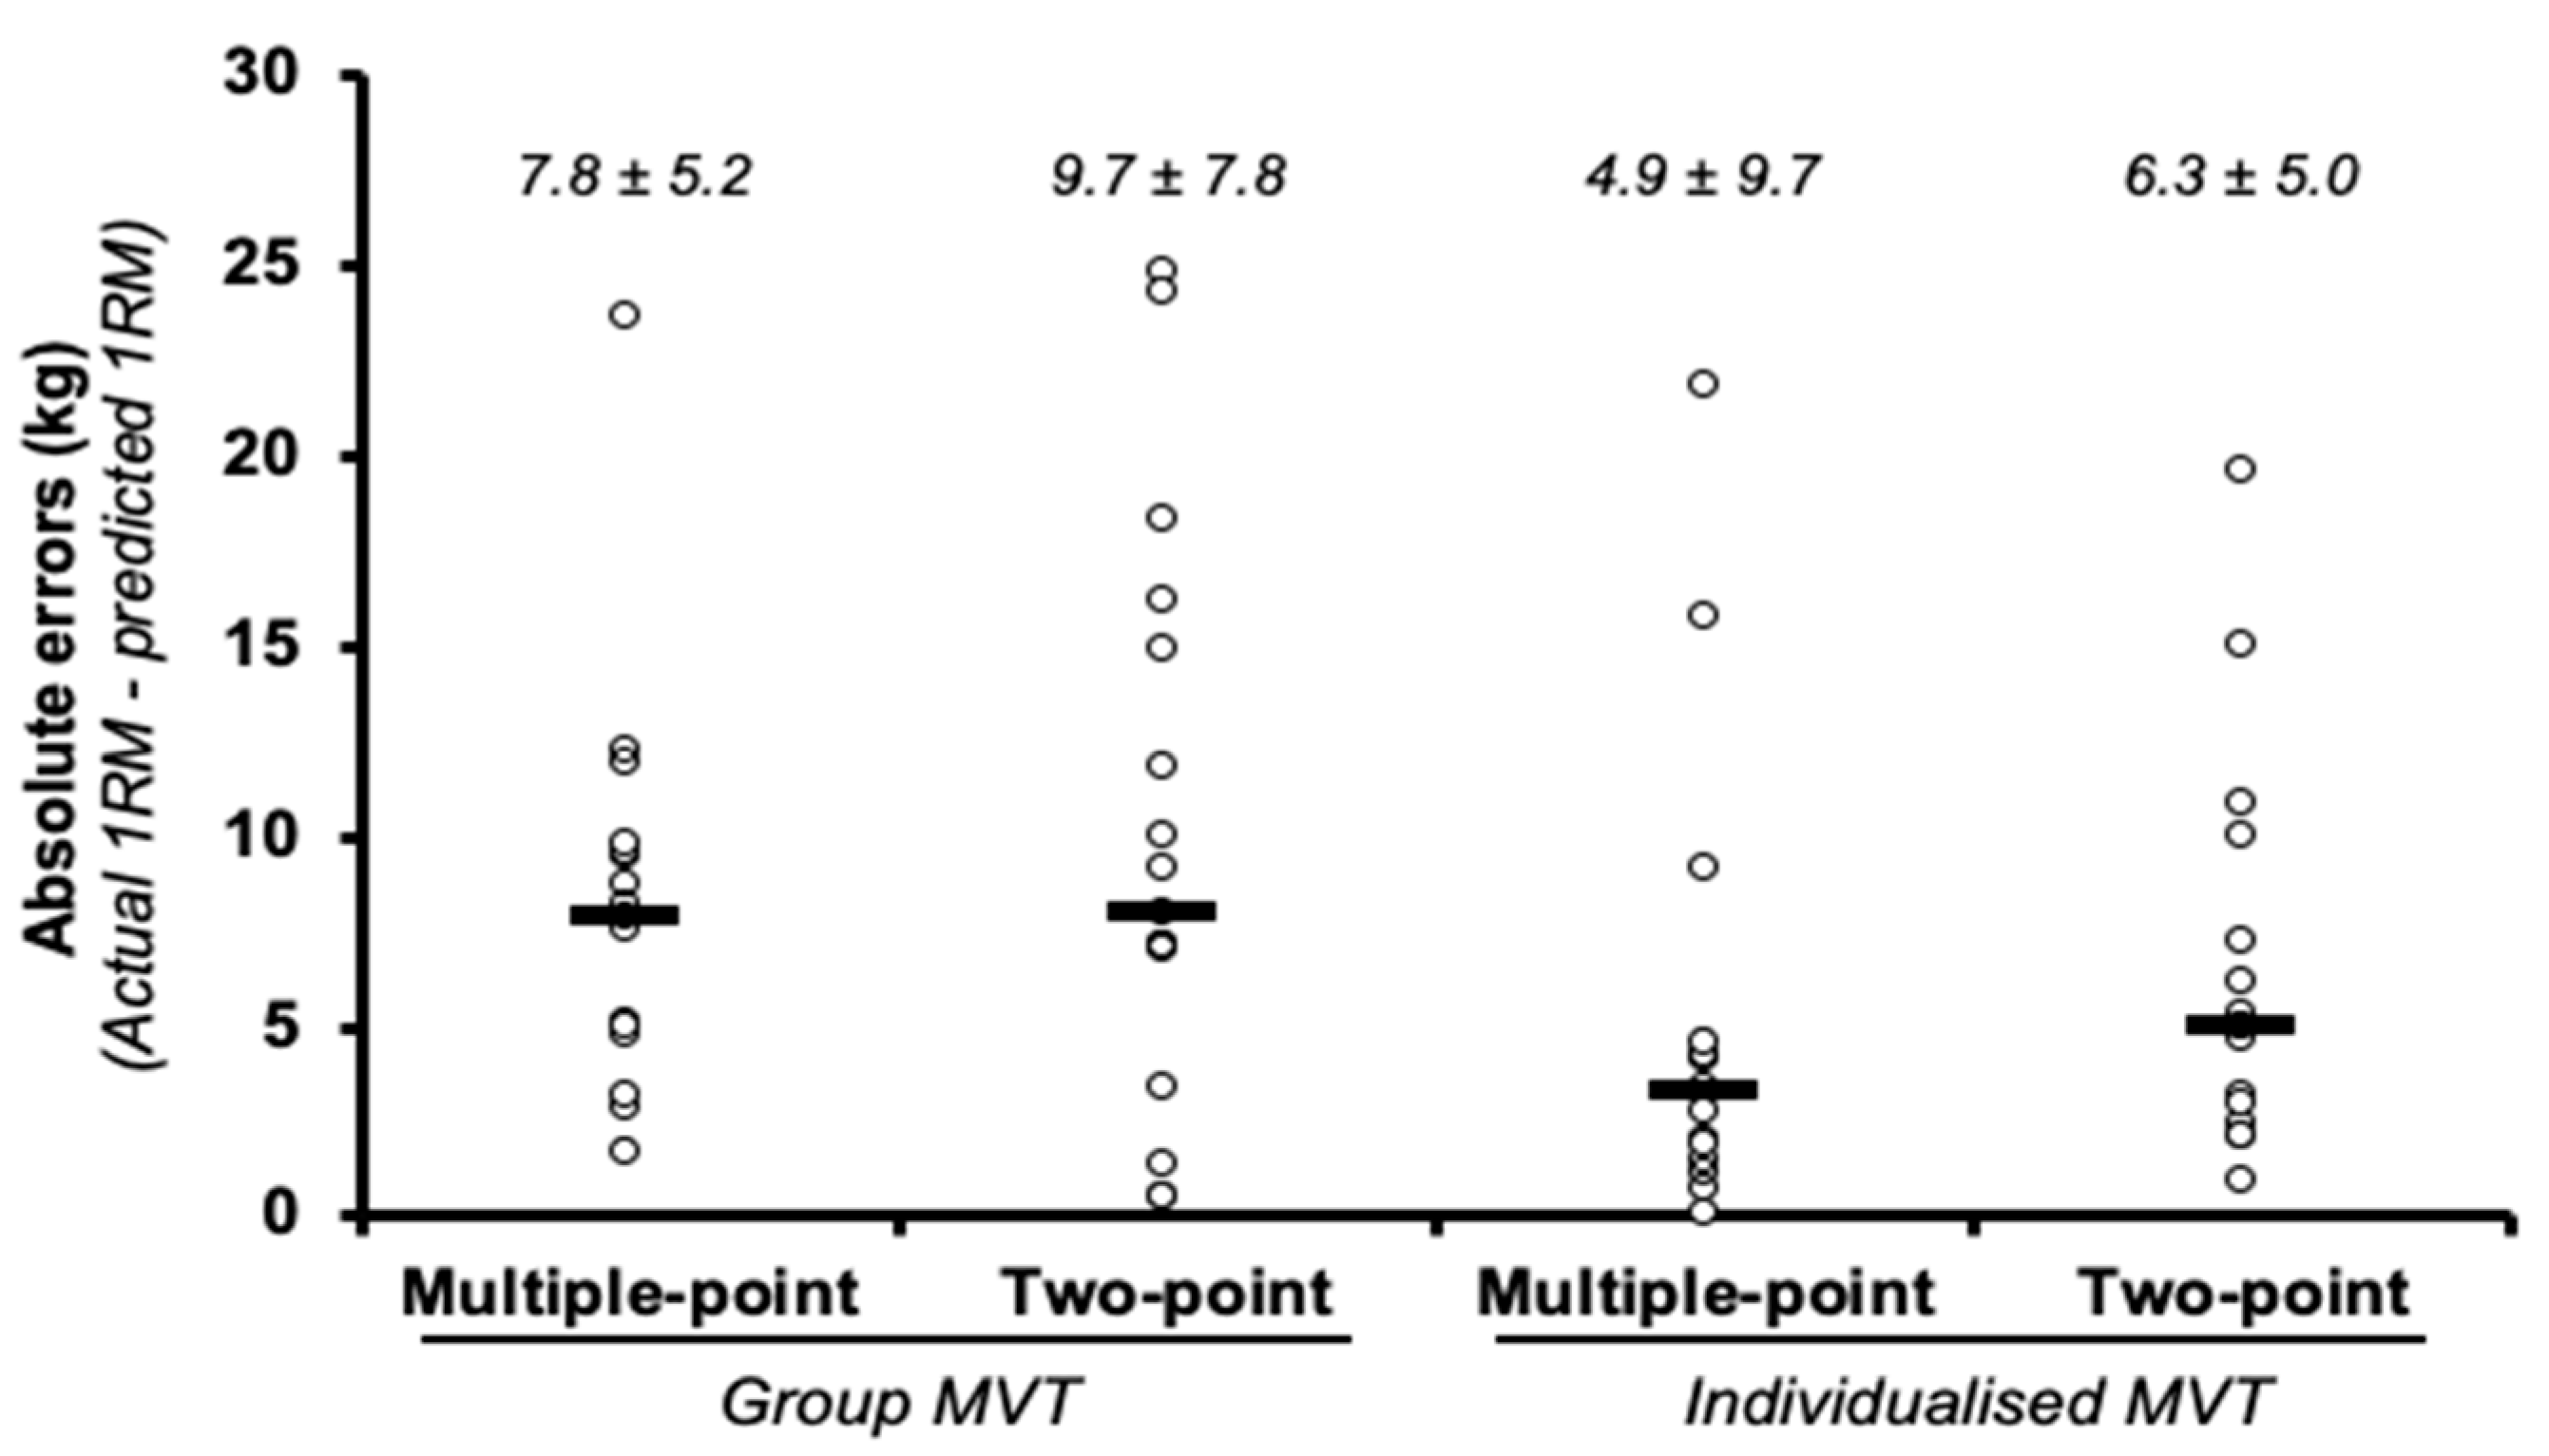
3.2. Squat
4. Discussion
5. Conclusions
Author Contributions
Funding
Acknowledgments
Conflicts of Interest
References
- Knuttegen, H.G.; Komi, P.V. Strength and Power in Sport. In Strength and Power in Sport; Komi, P.V., Ed.; Blackwell Publishing Company: Oxford, UK, 2003; pp. 3–11. ISBN 0632059117. [Google Scholar]
- Scott, B.R.; Duthie, G.M.; Thornton, H.R.; Dascombe, B.J. Training monitoring for resistance exercise: Theory and applications. Sport. Med. 2016, 46, 687–698. [Google Scholar] [CrossRef] [PubMed]
- Fernandes, J.F.T.; Daniels, M.; Myler, L.; Twist, C. Influence of playing standard on upper- and lower-body strength, power, and velocity characteristics of elite rugby league players. J. Funct. Morphol. Kinesiol. 2019, 4, 22. [Google Scholar] [CrossRef] [Green Version]
- Comfort, P.; Stewart, A.; Bloom, L.; Clarkson, B. Relationship between strength sprint and jump performance in well-trained youth soccer players. J. Strength Cond. Res. 2014, 28, 173–177. [Google Scholar] [CrossRef] [PubMed]
- Suchomel, T.J.; Nimphius, S.; Stone, M.H. The importance of muscular strength in athletic performance. Sport. Med. 2016, 46, 1419–1449. [Google Scholar] [CrossRef] [PubMed]
- Perez-Castilla, A.; Suzovic, D.; Domanovic, A.; Fernandes, J.F.T.; Garcia-Ramos, A. Validity of different velocity-based methods and repetitions-to-failure equations for predicting the 1 repetition maximum during 2 upper-body pulling exercises. J. Strength Cond. Res. 2019, 1–9. [Google Scholar] [CrossRef] [PubMed]
- Weakley, J.; Mann, B.; Banyard, H.; Mclaren, S.; Scott, T.; Garcia-ramos, A. Velocity-based training: From theory to application. Strength Cond. J. 2020, 1–19. [Google Scholar] [CrossRef]
- Banyard, H.G.; Nosaka, K.; Haff, G.G. Reliability and validity of the load-velocity relationship to predict the 1RM back squat. J. Strength Cond. Res. 2017, 31, 1897–1904. [Google Scholar] [CrossRef]
- Jukic, I.; García-Ramos, A.; Malecek, J.; Omcirk, D.; Tufano, J.J. Validity of load–velocity relationship to predict 1 repetition maximum during deadlifts performed with and without lifting straps. J. Strength Cond. Res. 2020, 1–9. [Google Scholar] [CrossRef]
- Jiménez-Alonso, A.; García-Ramos, A.; Cepero, M.; Miras-Moreno, S.; Rojas, F.J.; Pérez-Castilla, A. Velocity performance feedback during the free-weight bench press testing procedure: An effective strategy to increase the reliability and one repetition maximum accuracy prediction. J. Strength Cond. Res. 2020, 1. [Google Scholar] [CrossRef]
- García-Ramos, A.; Barboza-González, P.; Ulloa-Díaz, D.; Rodriguez-Perea, A.; Martinez-Garcia, D.; Guede-Rojas, F.; Hinojosa-Riveros, H.; Chirosa-Ríos, L.J.; Cuevas-Aburto, J.; Janicijevic, D.; et al. Reliability and validity of different methods of estimating the one-repetition maximum during the free-weight prone bench pull exercise. J. Sports Sci. 2019, 37, 2205–2212. [Google Scholar] [CrossRef]
- Torrejón, A.; Balsalobre-Fernández, C.; Haff, G.G.; García-Ramos, A. The load-velocity profile differs more between men and women than between individuals with different strength levels. Sport. Biomech. 2019, 18, 245–255. [Google Scholar] [CrossRef] [PubMed]
- Balsalobre-Fernández, C.; García-Ramos, A.; Jiménez-Reyes, P. Load–velocity profiling in the military press exercise: Effects of gender and training. Int. J. Sport. Sci. Coach. 2018, 13, 743–750. [Google Scholar] [CrossRef]
- García-Ramos, A.; Suzovic, D.; Pérez-Castilla, A. The load-velocity profiles of three upper-body pushing exercises in men and women. Sport. Biomech. 2019, 1–3. [Google Scholar] [CrossRef] [PubMed]
- García-Ramos, A.; Haff, G.G.; Pestaña-Melero, F.L.; Pérez-Castilla, A.; Rojas, F.J.; Balsalobre-Fernández, C.; Jaric, S. Feasibility of the 2-point method for determining the 1-repetition maximum in the bench press exercise. Int. J. Sports Physiol. Perform. 2018, 13, 474–481. [Google Scholar] [CrossRef]
- Costello, J.T.; Bieuzen, F.; Bleakley, C.M. Where are all the female participants in Sports and Exercise Medicine research? Eur. J. Sport Sci. 2014, 14, 847–851. [Google Scholar] [CrossRef] [Green Version]
- O’Malley, L.M.; Greenwood, S. Female coaches in strength and conditioning—Why so few? Strength Cond. J. 2018, 40, 40–48. [Google Scholar] [CrossRef]
- Pérez-Castilla, A.; Jerez-Mayorga, D.; Martínez-García, D.; Rodríguez-Perea, Á.; Chirosa-Ríos, L.J.; García-Ramos, A. Influence of grip width and anthropometric characteristics on the bench press load–velocity relationship. Int. J. Sports Physiol. Perform. 2020, 1, 1–9. [Google Scholar] [CrossRef]
- Fernandes, J.F.T.; Lamb, K.L.; Twist, C. The intra- and inter-day reproducibility of the FitroDyne as a measure of multi-jointed muscle function. Isokinet. Exerc. Sci. 2016, 24, 39–49. [Google Scholar] [CrossRef]
- Fernandes, J.F.T.; Lamb, K.L.; Twist, C. A comparison of load-velocity and load-power relationships between well-trained young and middle-aged males during three popular resistance exercises. J. Strength Cond. Res. 2018, 32, 1440–1447. [Google Scholar] [CrossRef]
- Fernandes, J.F.T.; Lamb, K.L.; Clark, C.C.T.; Moran, J.; Drury, B.; Garcia-Ramos, A.; Twist, C. Comparison of the FitroDyne and GymAware rotary encoders for quantifying peak and mean velocity during traditional multijointed exercises. J. Strength Cond. Res. 2018, 00, 1–6. [Google Scholar] [CrossRef]
- Dorrell, H.F.; Moore, J.M.; Smith, M.F.; Gee, T.I. Validity and reliability of a linear positional transducer across commonly practised resistance training exercises. J. Sports Sci. 2019, 37, 67–73. [Google Scholar] [CrossRef] [PubMed]
- McLaughlin, P. Testing agreement between a new method and the gold standard-How do we test? J. Biomech. 2013, 46, 2757–2760. [Google Scholar] [CrossRef] [PubMed]
- Hopkins, W.G.; Marshall, S.W.; Batterham, A.M.; Hanin, J. Progressive statistics for studies in sports medicine and exercise science. Med. Sci. Sports Exerc. 2009, 41, 3–12. [Google Scholar] [CrossRef] [PubMed] [Green Version]
- Atkinson, G.; Nevill, A.M. Statistical methods for assessing measurement error (reliability) in variables relevant to sports medicine. Sport. Med. 1998, 26, 217–238. [Google Scholar] [CrossRef]
- Balsalobre-Fernández, C.; Marchante, D.; Muñoz-López, M.; Jiménez, S.L. Validity and reliability of a novel iPhone app for the measurement of barbell velocity and 1RM on the bench-press exercise. J. Sports Sci. 2018, 36, 64–70. [Google Scholar] [CrossRef]
- Pérez-Castilla, A.; Piepoli, A.; Garrido-Blanca, G.; Delgado-García, G.; Balsalobre-Fernández, C.; García-Ramos, A. Precision of 7 commercially available devices for predicting bench-press 1-repetition maximum from the individual load–velocity relationship. Int. J. Sports Physiol. Perform. 2019, 14, 1442–1446. [Google Scholar] [CrossRef]
- Pérez-Castilla, A.; Jerez-Mayorga, D.; Martínez-García, D.; Rodríguez-Perea, Á.; Chirosa-Ríos, L.J.; García-Ramos, A. Comparison of the bench press one-repetition maximum obtained by different procedures: Direct assessment vs. lifts-to-failure equations vs. two-point method. Int. J. Sport. Sci. Coach. 2020, 15, 337–346. [Google Scholar] [CrossRef]
- Pérez-Castilla, A.; Piepoli, A.; Delgado-García, G.; Garrido-Blanca, G.; García-Ramos, A. Reliability and concurrent validity of seven commercially available devices for the assessment of movement velocity at different intensities during the bench press. J. Strength Cond. Res. 2019, 33, 1258–1265. [Google Scholar] [CrossRef]
- Burnham, T.R.; Ruud, J.D.; McGowan, R. Bench press training program with attached chains for female volleyball and basketball athletes. Percept. Mot. Skills 2010, 110, 61–68. [Google Scholar] [CrossRef]
- Nunes, J.A.; Crewther, B.T.; Viveiros, L.; de Rose, D., Jr.; Aoki, M.S. Effects of resistance training periodization on performance and salivary immune-endocrine responses of elite female basketball players. J. Sports Med. Phys. Fit. 2016, 2011, 676–682. [Google Scholar]
- Moran, J.; Sandercock, G.; Clark, C.C.T.; Fernandes, J.F.T.; Drury, B. A meta-analysis of resistance training in female youth: Its effect on muscular strength, and shortcomings in the literature. Sport. Med. 2018, 48, 1661–1671. [Google Scholar] [CrossRef] [PubMed] [Green Version]
- Hughes, L.J.; Banyard, H.G.; Dempsey, A.R.; Scott, B.R. Using a load-velocity relationship to predict one repetition maximum in free-weight exercise: A comparison of the different methods. J. Strength Cond. Res. 2019, 33, 2409–2419. [Google Scholar] [CrossRef] [PubMed]
- Loturco, I.; Pereira, L.A.; Cal Abad, C.C.; Gil, S.; Kitamura, K.; Kobal, R.; Nakamura, F.Y. Using bar velocity to predict maximum dynamic strength in the half-squat exercise. Int. J. Sports Physiol. Perform. 2016, 11, 697–700. [Google Scholar] [CrossRef] [PubMed]
- Bazuelo-Ruiz, B.; Padial, P.; García-Ramos, A.; Morales-Artacho, A.J.; Miranda, M.T.; Feriche, B. Predicting maximal dynamic strength from the load-velocity relationship in squat exercise. J. Strength Cond. Res. 2015, 29, 1999–2005. [Google Scholar] [CrossRef]
- Banyard, H.G.; Nosaka, K.; Vernon, A.D.; Gregory Haff, G. The reliability of individualized load–velocity profiles. Int. J. Sports Physiol. Perform. 2018, 13, 763–769. [Google Scholar] [CrossRef]
- Kell, R.T. The influence of periodized resistance training on strength changes in men and women. J. Strength Cond. Res. 2011, 25, 735–744. [Google Scholar] [CrossRef]
- Veliz, R.R.; Suarez-Arrones, L.; Requena, B.; Haff, G.G.; Feito, J.; de Villarreal, S.E. Effects of in-competitive season power-oriented and heavy resistance lower-body train- ing on performance of elite female water polo players. J. Strength Cond. Res. 2015, 29, 458–465. [Google Scholar] [CrossRef]
- Gür, H. Concentric and eccentric isokinetic measurements in knee muscles during the menstrual cycle: A special reference to reciprocal moment ratios. Arch. Phys. Med. Rehabil. 1997, 78, 501–505. [Google Scholar] [CrossRef]
- McNulty, K.L.; Elliott-Sale, K.J.; Dolan, E.; Swinton, P.A.; Ansdell, P.; Goodall, S.; Thomas, K.; Hicks, K.M. The effects of menstrual cycle phase on exercise performance in eumenorrheic women: A systematic review and meta-analysis. Sport. Med. 2020, 50, 1–5. [Google Scholar] [CrossRef]
- Fridén, C.; Hirschberg, A.L.; Saartok, T. Muscle strength and endurance do not significantly vary across 3 phases of the menstrual cycle in moderately active premenopausal women. Clin. J. Sport Med. 2003, 13, 238–241. [Google Scholar] [CrossRef]
- Lebrun, C.M.; McKenzie, D.; Lucia, A.; Diaz, B.; Hoyos, J.; Fernández, C.; Villa, G.; Bandrés, F.; Chicharro, J.L.; Giacomoni, M.; et al. Effects of menstrual cycle phase on athletic performance. Eur. J. Appl. Physiol. 2018, 103, 153–160. [Google Scholar] [CrossRef]
- De Jonge, X.J.; Boot, C.R.; Thom, J.M.; Ruell, P.A.; Thompson, M.W. The influence of menstrual cycle phase on skeletal muscle contractile characteristics in humans. J. Physiol. 2001, 530, 161–166. [Google Scholar] [CrossRef] [PubMed]
- Romero-Moraleda, B.; Del Coso, J.; Gutiérrez-Hellín, J.; Ruiz-Moreno, C.; Grgic, J.; Lara, B. The influence of the menstrual cycle on muscle strength and power performance. J. Hum. Kinet. 2019, 68, 123–133. [Google Scholar] [CrossRef] [Green Version]
- Blagrove, R.C.; Bruinvels, G.; Pedlar, C.R. Variations in strength-related measures during the menstrual cycle in eumenorrheic women: A systematic review and meta-analysis. J. Sci. Med. Sport 2020, 6–13. [Google Scholar] [CrossRef]
- García-Pinillos, F.; Lago-Fuentes, C.; Bujalance-Moreno, P.; Pérez-Castilla, A. Effect of the menstrual cycle when estimating 1 repetition maximum from the load-velocity relationship during the bench press exercise. J. Strenght Cond. Res. 2020, 1, 1–4. [Google Scholar] [CrossRef]

| MVT | Method | Predicted 1RM (kg) | Raw Diff (kg) | ES | r(Pearson) | r(Heteroscedasticity) |
|---|---|---|---|---|---|---|
| Group | Multiple-point | 39.4 ± 8.6 | 0.8 ± 3.0 | 0.10 | 0.94 | 0.37 |
| Two-point | 41.3 ± 9.0 | 2.7 ± 4.9 | 0.32 | 0.84 | 0.33 | |
| Individualised | Multiple-point | 39.5 ± 8.8 | 0.9 ± 2.5 | 0.11 | 0.97 | 0.54 |
| Two-point | 41.3 ± 9.1 | 2.8 ± 4.3 | 0.33 | 0.89 | 0.39 |
| MVT | Method | Predicted 1RM (kg) | Raw Diff (kg) | ES | r(Pearson) | r(heteroscedasticity) |
|---|---|---|---|---|---|---|
| Group | Multiple-point | 88.6 ± 17.6 | 3.1 ± 9.1 | 0.19 | 0.86 | 0.37 |
| Two-point | 90.3 ± 17.8 | 4.7 ± 11.7 | 0.29 | 0.76 | 0.28 | |
| Individualised | Multiple-point | 88.3 ± 19.5 | 2.7 ± 7.1 | 0.16 | 0.95 | 0.69 |
| Two-point | 89.4 ± 18.1 | 3.8 ± 7.2 | 0.23 | 0.93 | 0.49 |
Publisher’s Note: MDPI stays neutral with regard to jurisdictional claims in published maps and institutional affiliations. |
© 2020 by the authors. Licensee MDPI, Basel, Switzerland. This article is an open access article distributed under the terms and conditions of the Creative Commons Attribution (CC BY) license (http://creativecommons.org/licenses/by/4.0/).
Share and Cite
Caven, E.J.G.; Bryan, T.J.E.; Dingley, A.F.; Drury, B.; Garcia-Ramos, A.; Perez-Castilla, A.; Arede, J.; Fernandes, J.F.T. Group versus Individualised Minimum Velocity Thresholds in the Prediction of Maximal Strength in Trained Female Athletes. Int. J. Environ. Res. Public Health 2020, 17, 7811. https://doi.org/10.3390/ijerph17217811
Caven EJG, Bryan TJE, Dingley AF, Drury B, Garcia-Ramos A, Perez-Castilla A, Arede J, Fernandes JFT. Group versus Individualised Minimum Velocity Thresholds in the Prediction of Maximal Strength in Trained Female Athletes. International Journal of Environmental Research and Public Health. 2020; 17(21):7811. https://doi.org/10.3390/ijerph17217811
Chicago/Turabian StyleCaven, Elias J. G., Tom J. E. Bryan, Amelia F. Dingley, Benjamin Drury, Amador Garcia-Ramos, Alejandro Perez-Castilla, Jorge Arede, and John F. T. Fernandes. 2020. "Group versus Individualised Minimum Velocity Thresholds in the Prediction of Maximal Strength in Trained Female Athletes" International Journal of Environmental Research and Public Health 17, no. 21: 7811. https://doi.org/10.3390/ijerph17217811