Article

Application of X-rays Diffraction for Identifying Thin Oxide Surface Layers on Zinc Coatings

Department of Physics, Aristotle University of Thessaloniki, 54124 Thessaloniki, Greece
Coatings 2020, 10(10), 1005; https://doi.org/10.3390/coatings10101005
Submission received: 15 July 2020 / Revised: 1 October 2020 / Accepted: 16 October 2020 / Published: 20 October 2020
(This article belongs to the Special Issue Industrial Coatings: Applications and Developments)

Abstract

:
Structural characterization of compound material coatings is usually achieved using time-consuming and destructive techniques such as optical and electrical microscopy, which require the use of grinding processes not always compatible with the material. This paper reports on the effective use of a theoretical model based on X-ray diffraction to calculate the thickness and composition of thin oxide films formed on the surface of zinc coatings. Zinc coatings are widely used in industrial application as protective layers against the atmospheric corrosion of steel substrates. The thickness of single- and multi-layer coatings is estimated using grazing incidence X-ray diffraction and various incidence angles. The coatings were grown using hot-dip, pack cementation and thermal spray techniques, and their experimental characteristics were compared to the theoretically predicted values of thickness and composition. The results indicate the formation of a thin zinc oxide film on top of each coating, which acts as an isolation layer and protects the surface of the sample against the environmental corrosion. Finally, the penetration depth of the X-rays into the zinc-based coatings for grazing incidence and Bragg–Brentano X-ray diffraction geometries were calculated using theoretical equations and experimentally confirmed.

Graphical Abstract

1. Introduction

Zinc coatings are technologically important for a wide range of protective applications including anticorrosion layers in wires, tanks and automotive manufacturing components depending on their chemical characteristics [1,2,3,4,5,6,7,8,9,10,11,12]. The thickness, structure and chemical composition is of particular interest for corrosion shield applications in the marine and architectural field. Atmospheric and marine corrosion processes significantly alter the properties of the coatings as the oxides formed on the surface are usually well adherent and passivate the surface. Thus, a thorough and detailed characterization of the coatings is required, which will allow the development of high quality, reliable and reproducible products. The information required to determine the structural properties of a coating are most commonly provided by optical or scanning electron microscopy characterization. However, these techniques do not allow the comprehensive evaluation of the coating, as information is provided only from a small area. Furthermore, microscopy characterization is a time-consuming method and is hardly applicable in limited size specimens, as cross-sectional cutting, polishing and in certain cases even chemical etching preparation is required [13,14].
It is thus important to develop a faster, simpler and non-destructive characterization method that can provide a thorough analysis of thin films and coatings without affecting the material, such as the one proposed by Yamada to identify pharmaceutical coatings [15]. X-ray diffraction (XRD) is a high precision evaluation technique that provides important information regarding the structure characteristics of a coating while enabling chemical composition identification without causing any damage to the sample under investigation. Bragg–Brentano is a widely used XRD geometry (BB-XRD), which provides information about the compounds located on the surface of a sample as well as at a certain depth below the surface. The effectiveness of XRD depends on the penetration depth of the X-ray beam, which is related to the incidence angle. The penetration depth can be narrowed to the top surface layers using grazing incidence X-ray geometry (GI-XRD). Thus, controlling the incidence angle of the X-ray beam enables the overall identification of the composition of the coating as well as the precise stoichiometry of the surface layers [16,17].
This work presents the results of a detailed theoretical analysis of zinc coatings based on grazing incidence X-ray diffraction technique. The samples grown using the hot-dip galvanizing process [1,2,3,4,8,13,14,16,18,19,20], chemical vapor deposition by pack cementation [5,6,7,8,13,14,16,21,22,23,24,25] and wire flame thermal spray [9,10,11,12,13,14,16,26,27,28] were examined using scanning electron microscopy (SEM), Bragg–Brentano and grazing incidence XRD, with specific interest in the composition of the thin zinc oxide layer formed on the surface. The X-rays theoretical penetration depth for all three types of sample was also calculated and compared to the experimental results. The described methodology is the first approach of a non-destructive theoretical monitoring procedure of zinc coatings after deposition or after exposure to aggressive environments.

2. Theoretical Calculations of the Penetration Depth of X-rays

The functionality of X-ray diffraction analysis relies on the penetration depth of the X-ray beam, which depends strongly on the material properties, the wavelength and the incident angle of the X-ray beam. Here, we present theoretical calculations of the penetration depth for BB and GI-XRD geometry [29].

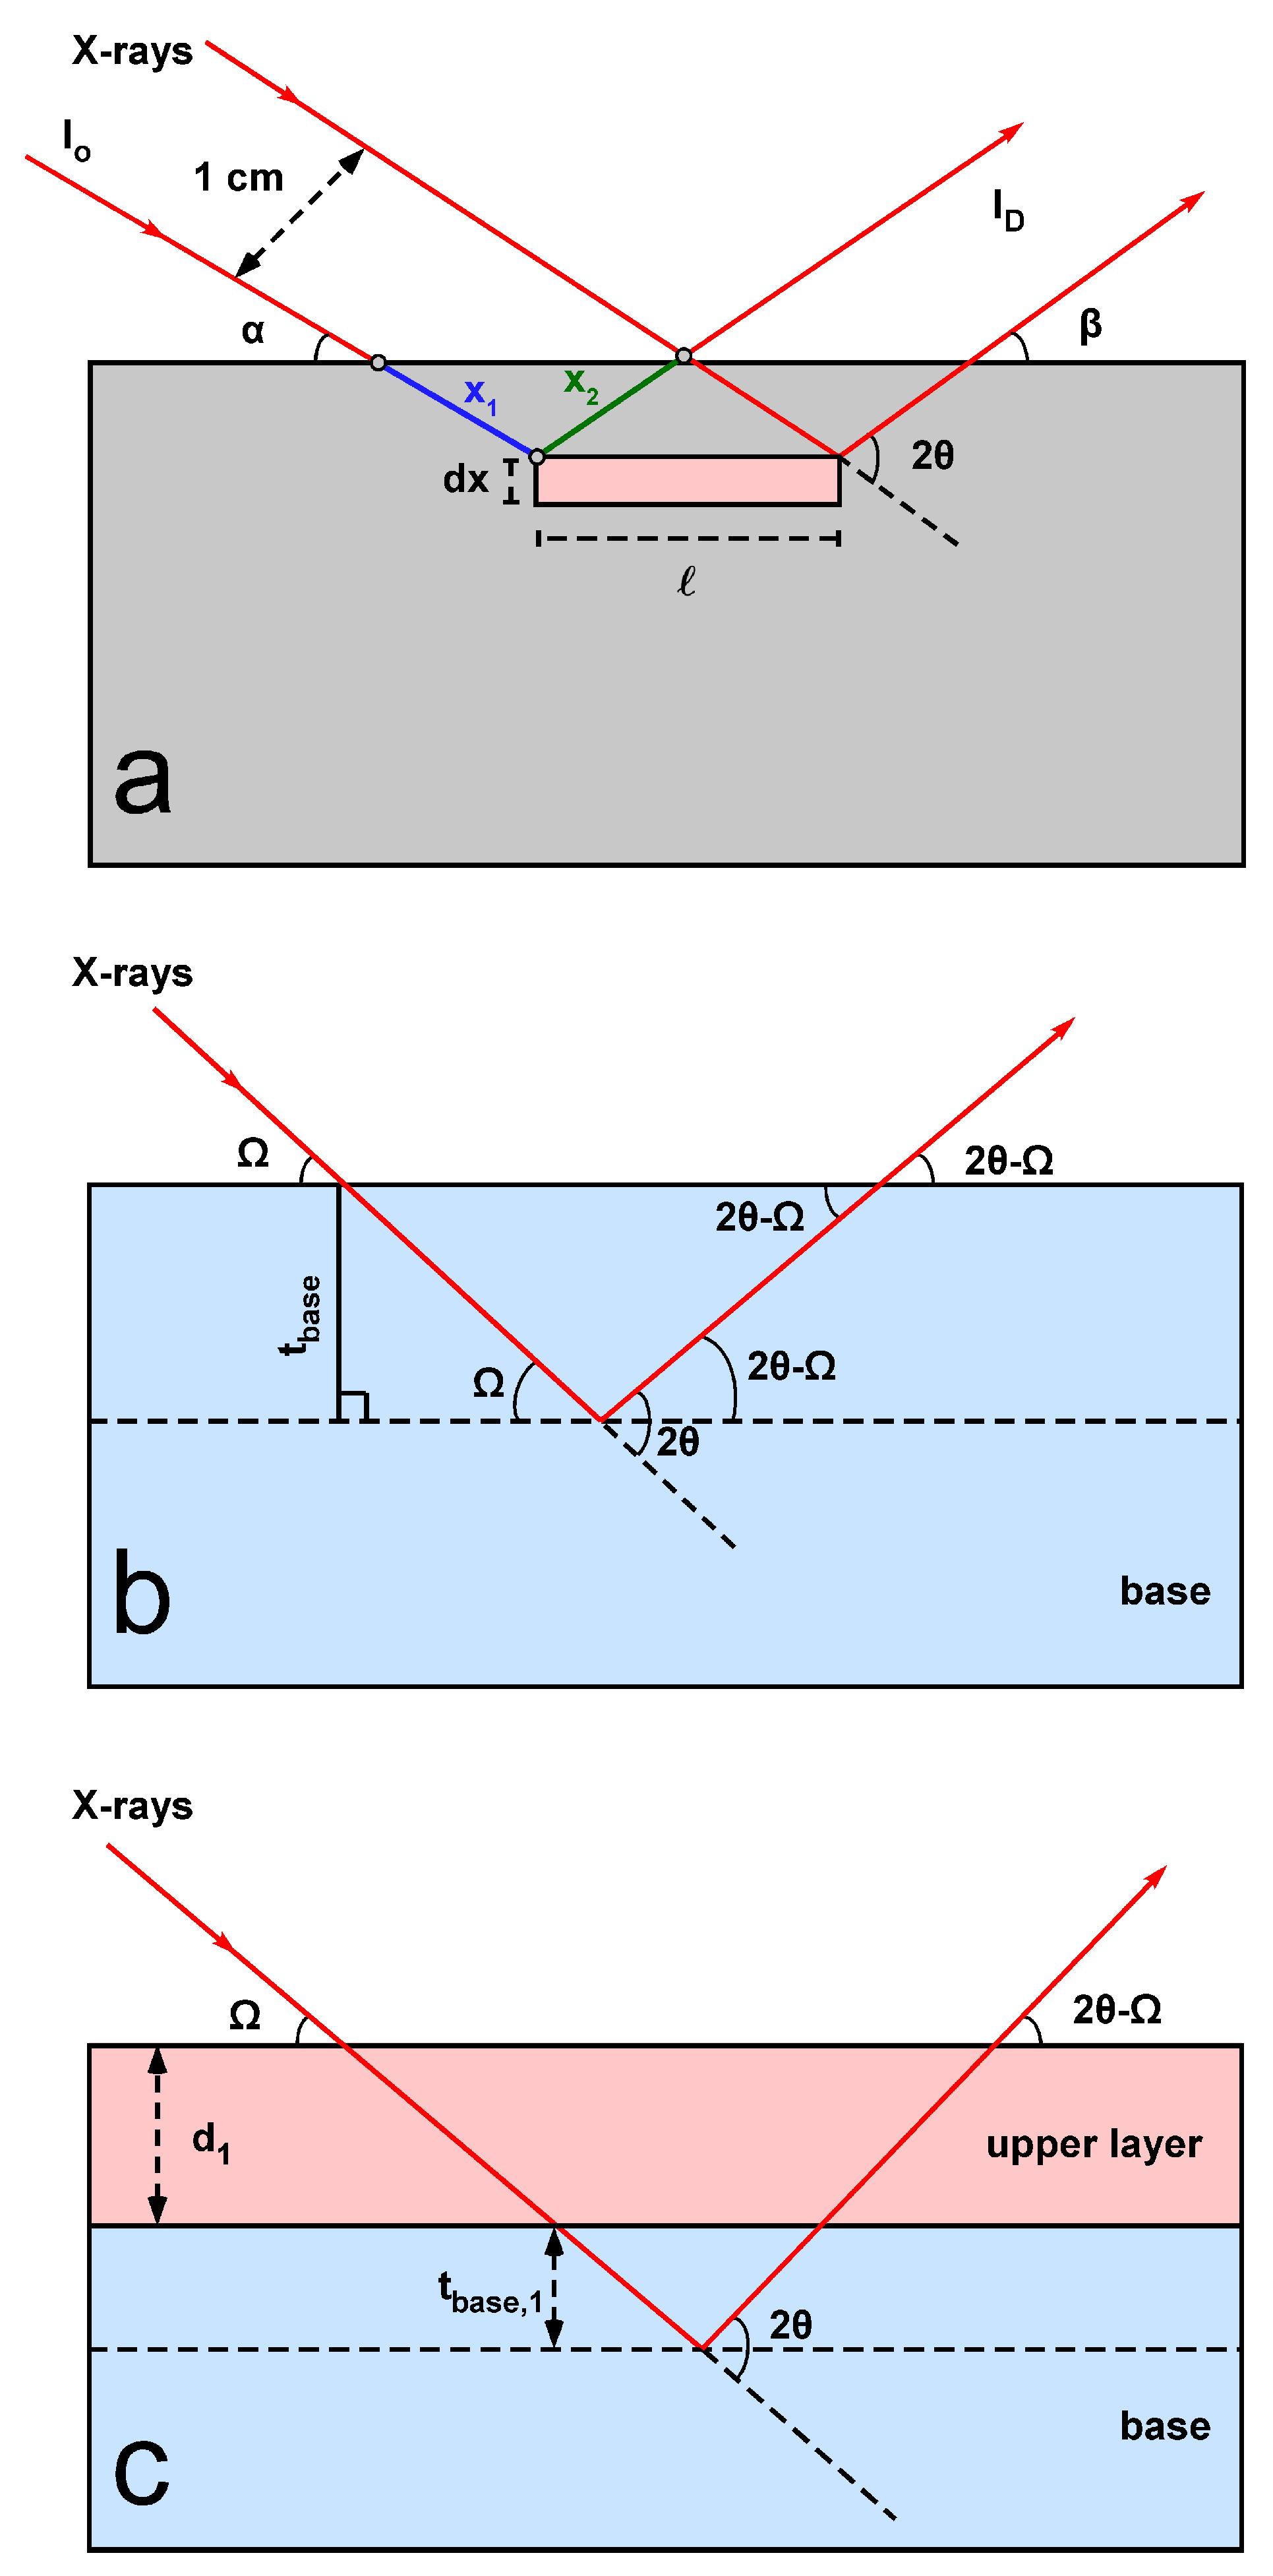
2.1. Calculation of the Penetration Depth of X-rays in BB-XRD

Bragg–Brentano X-ray diffraction has a unique geometric configuration where the angle of the X-ray incidence beam is equal to the angle between the diffracted beam and the surface of the sample. This enables accurate monitoring of the material parameters. An ideal sample of infinite thickness is considered here. The intensity of the X-ray incidence beam is I0, while α is the incidence angle. The intensity of the beam diffracted by an essential part of the sample of thickness dx and width ℓ, located at a distance x below the surface, is given by the equation:
I = κ I0 e−μ(x1) dx
where κ is the fraction of crystallites orientated so that they can diffract the incident beam, μ is the linear attenuation coefficient of the material, and x1 is the length of the optic path of the incident beam in the material (Figure 1a). The intensity of the diffracted beam, which has passed through the optic path x2 inside the material, is given by:
ID = κ Ι0·e−μ(x2)
Using Equations (1) and (2), the differentiation of the intensity can be written as:
dID = κ ℓ I0·e−μ(x1+x2) dx
Due to the geometric characteristics of BB-XRD geometry (ℓ = l/sinα, x1 = x/sinα, x2 = x/sinβ, α = β = θ, β is the diffraction angle), Equation (3) can take the form of:
dID = (κ I0/sinθ) e−2μx/sinθ dx
However, detection of the diffracted beam is possible only when the intensity ID is higher than the ID = 0.001 × I0 limit, which corresponds to a penetration depth of tBB. The ratio dID (x = 0)/dID(x = tBB) = etBB/sinθ = 1000 can be calculated using Equation (4), which gives:
tBB = 3.45·sinθ/μ

2.2. Penetration Depth of X-rays in GI-XRD

In GI-XRD geometry, the penetration depth of X-rays in a single compound material can be calculated using the equation [15,30,31,32,33,34,35,36]:
t GI = ln ( 1 G ) μ [ 1 sin Ω + 1 sin ( 2 θ Ω ) ]
where G is the fraction of the incident beam absorbed by the material before the beam reaches the maximum penetration depth tGI, Ω is the incidence angle and 2θ − Ω is the angle of the diffracted beam. As for BB-XRD geometry, the penetration depth depends strongly on the incidence angle. Equation (6) takes the form of Equation (5) when the BB-XRD geometry variables are used, resulting in α = θ and G = 0.99 (as the penetration depth is considered equal to the thickness at which the intensity of the incident beam is equal to ID/1000).

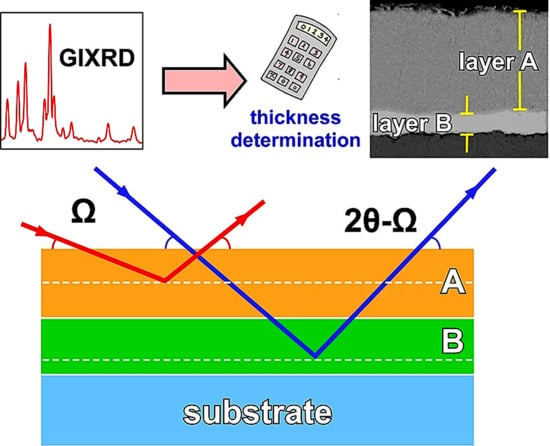
2.3. Penetration Depth of X-rays in a Multilayered Material

Even though Equation (6) provides essential knowledge about the characteristics of a single compound coating, it is not applicable to two-layered or multi-layered coatings. This section presents a theoretical calculation of the penetration depth of X-rays in a multi-layered coating, taking in consideration the fraction of the beam absorbed by each layer. First, a single layer coating of a linear attenuation coefficient μbase is considered, named as base coating, tested by GI-XRD. Equation (3) now takes the form of (Figure 1b):
dI Dbase = κ I 0 e μ base x ( 1 sin Ω + 1 sin ( 2 θ Ω ) ) d x
Integration over the examined area results in:
I Dbase = κ I 0 [ e μ base t base ( 1 sin Ω + 1 sin ( 2 θ Ω ) ) 1 ] μ base ( 1 sin Ω + 1 sin ( 2 θ Ω ) )
where tbase is the penetration depth of the beam in the base coating. Following, a second layer is placed on top of the base coating, named as layer one, of attenuation coefficient μ1 and thickness d1. It is considered here that the X-ray beam passes through this new layer and reaches the underlying base coating. As a result, the intensity, IDcoated, of the beam diffracted by both layers can be described by the equation (Figure 1c):
dI Dcoated = I 0 e μ 1 d 1 ( 1 sin Ω ) ( κ e μ base x ( 1 sin Ω + 1 sin ( 2 θ Ω ) ) d x ) e μ 1 d 1 ( 1 sin ( 2 θ Ω ) )
If the total penetration depth inside the base coating is tbase,1 then integration of Equation (9) results in:
I Dcoated = I 0 κ e μ 1 d 1 ( 1 sin Ω + 1 sin ( 2 θ Ω ) ) { [ e μ base t base , 1 ( 1 sin Ω + 1 sin ( 2 θ Ω ) ) 1 ] μ base ( 1 sin Ω + 1 sin ( 2 θ Ω ) ) }
The ratio IDcoated/IDbase is equal to:
I Dcoated I Dbase = e μ 1 d 1 ( 1 sin Ω + 1 sin ( 2 θ Ω ) ) [ e μ base t base , 1 ( 1 sin Ω + 1 sin ( 2 θ Ω ) ) 1 ] e μ base t base ( 1 sin Ω + 1 sin ( 2 θ Ω ) ) 1
where μbasetbase = μ1d1 + μbasetbase,1.
If the thickness d1 of the epilayer, the linear attenuations μ1 and μbase and the incidence angle Ω are known, then the thickness tbase,1 of the penetration depth inside the base coating (after passing through layer one) is given by equation:
t base , 1 = ln [ e μ 1 d 1 ( 1 sin Ω + 1 sin ( 2 θ Ω ) ) I Dcoated I Dbase e μ 1 d 1 ( 1 sin Ω + 1 sin ( 2 θ Ω ) ) ( 1 I Dcoated I Dbase ) ] μ base ( 1 sin Ω + 1 sin ( 2 θ Ω ) )
The above-described process can also be used for multilayered coatings. For example, for a three-layered coating (base layer, layer one and layer two), the penetration depth of the X-rays in the base layer, after passing through the two epilayers, will be given by:
t base , 1 , 2 = ln [ e μ 2 d 2 ( 1 sin Ω + 1 sin ( 2 θ Ω ) ) e μ 1 d 1 ( 1 sin Ω + 1 sin ( 2 θ Ω ) ) I Dcoated I Dbase e μ 2 d 2 ( 1 sin Ω + 1 sin ( 2 θ Ω ) ) e μ 1 d 1 ( 1 sin Ω + 1 sin ( 2 θ Ω ) ) ( 1 I Dcoated I Dbase ) ] μ base ( 1 sin Ω + 1 sin ( 2 θ Ω ) )
where μ2 and d2 are the linear coefficient and thickness of the new layer (layer 2), respectively, and I Dcoated is the total diffracted beam by the three-layered coating.

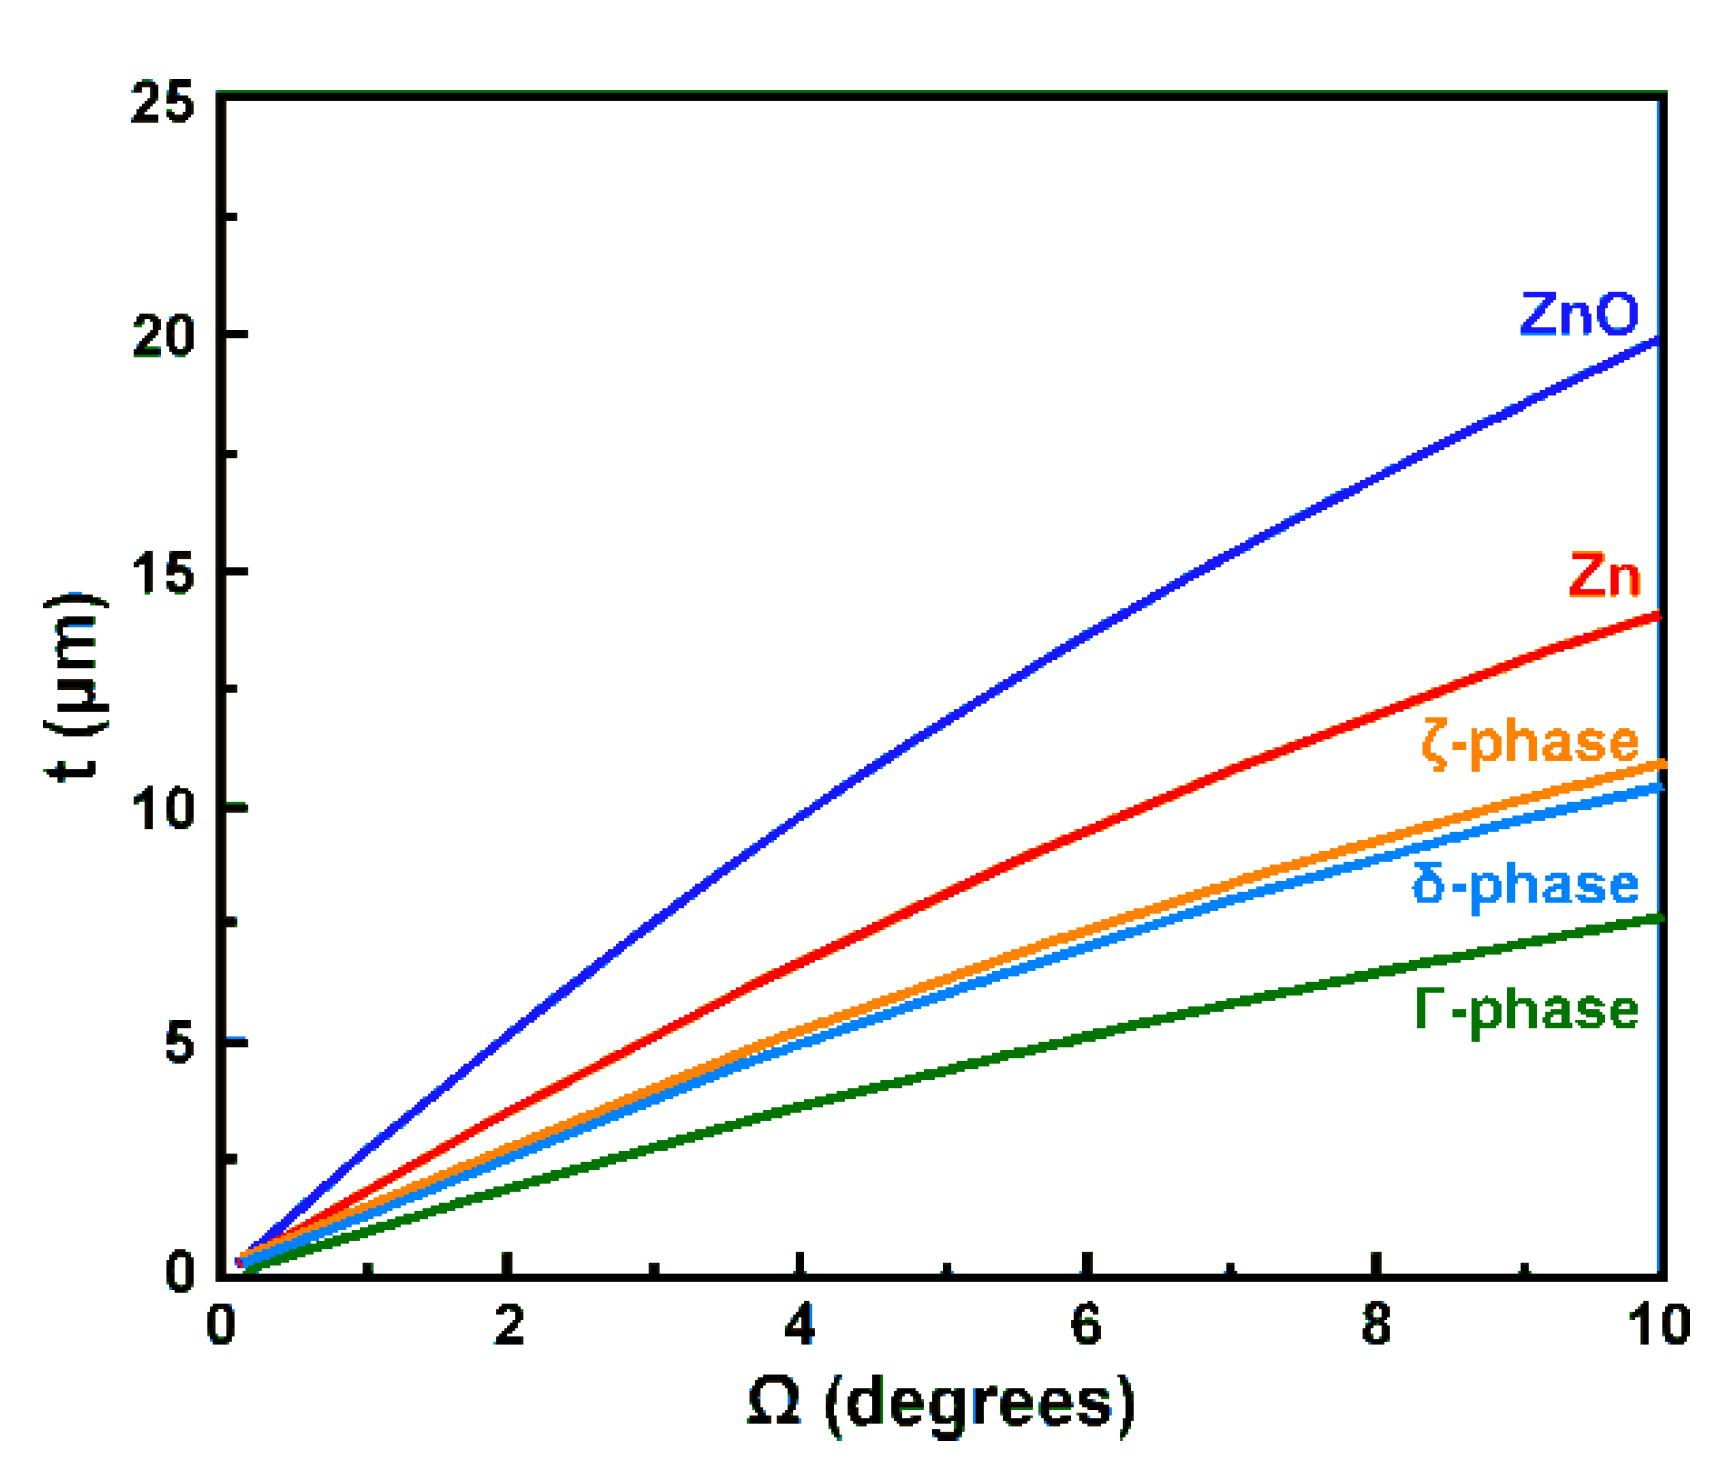
2.4. Evaluation of the Penetration Depth of X-rays in Particular Zn Compounds

According to previous publications [1,2,11,18], Zn–Fe and Zn compounds are the most favorable to be formed during the growth of zinc coatings. The penetration depth of X-rays in several Zn–Fe compound coatings was calculated using Equation (5). The calculations were based on the diffraction angles of the first three, stronger peaks of the X-ray diffraction pattern of each Zn phase (presented by decreasing intensity). Table 1 shows the linear attenuation coefficients of these phases and the penetration depth in each case [36,37].
The penetration depth for GI-XRD geometry was also calculated for these phases, using again the diffraction angles corresponding to the highest intensity peaks of the diffraction pattern and Equation (6). Figure 2 shows the dependence of the penetration depth to the incidence angle for each Zn phase.

3. Experimental Details

3.1. Growth Processes

Zinc coatings were grown on a commercial hot rolled low carbon steel sheet St-37 (information regarding the chemical composition are provided by the standard alloy numbering system of the Society of Automotive Engineers (SAE) SAE 1010, Table 2) using three different growth techniques, namely hot-dip galvanizing, chemical vapour deposition by pack cementation and wire flame thermal spraying, to verify the results presented in the previous section. Details on the type of substrate have been reported previously [8,22]. These coatings form a protective layer on the surface with a sacrificial and barrier effect, which prevents diffusion of the corrosive elements [38,39,40,41].
During hot-dip galvanizing, the substrates were immersed in a graphite crucible with molten zinc, inside an electric furnace. The dipping temperature was 450 °C and the total time 3 min. Prior to galvanizing, the coupons were degreased in H3PO4 solution, pickled and deoxidized in an 16% HCl aqueous solution and finally fluxed in a 50% ZnCl2–2NH4Cl aqueous solution [1,2,41,42]. As a result, the immersed substrates were covered by a zinc layer alongside some internal Fe-Zn phase layers. Prior to the pack cementation deposition, the substrates were packed and sealed in porcelain crucibles together with a powder mixture containing 3% NH4Cl (activator), 50% Zn (donor material) and Al2O3 (filler) as balance. The crucibles were then inserted in an Ar purged electric furnace at 400°C for 60 min. As a result, the formed coating had a similar thickness to the galvanized coating but different chemical composition—Consisting only of Fe–Zn phases [16,41,43]. Finally, for the wire flame thermal spraying, the substrates were previously degreased with a 10% HCl solution and then sandblasted in order to create the necessary roughness for coating adhesion. The deposition process was performed using a METCO 14E wire flame spray gun, keeping 120 mm spraying distance. The donor material was 99.9% pure Zn in form of a 2.4 mm diameter wire. The molten particles, produced from the wire melting by the combustion flame, were accelerated by compressed air towards the substrate, forming a characteristic rough laminar thick coating consisting of Zn and ZnO. The average thickness of the coating was much higher (over 200 μm) in comparison to the other techniques [41,44].

3.2. Characterization of Coatings

Characterization of the structure, morphology and chemical composition of the coatings was performed using a 20 kV JEOL 840A scanning electron microscope (SEM, Jeol Ltd., Akishima, Tokyo, Japan). The SEM was equipped with an OXFORD INCA Energy Dispersive X-ray Spectroscopy (EDS) analyzer (Oxford Instruments Nanoanalysis, Oxford, UK) and the INCA 18D 4.15 software that enabled point microanalysis and linear microanalysis of the area of interest. In order to perform the cross-section examination, the samples were cut with low speed saw, polished down to 5 μm using alumina emulsion and then suitably etched with Nital solution. X-ray diffraction was carried out for the Zn phase identification, using a 2-circles Regaku Ultima+ diffractometer (CuKα radiation, 40 KV, 30 mA) with Bragg–Brentano (BB-XRD, Rigaku Corporation, Shibuya-Ku, Tokyo, Japan) and grazing incidence geometry (GI-XRD, Rigaku Corporation, Shibuya-Ku, Tokyo, Japan), using 1.5° and 5° incidence angle (Ω). This angle range is identified as suitable to get sufficient information of the composition of the top surface layers.

4. Results and Discussion

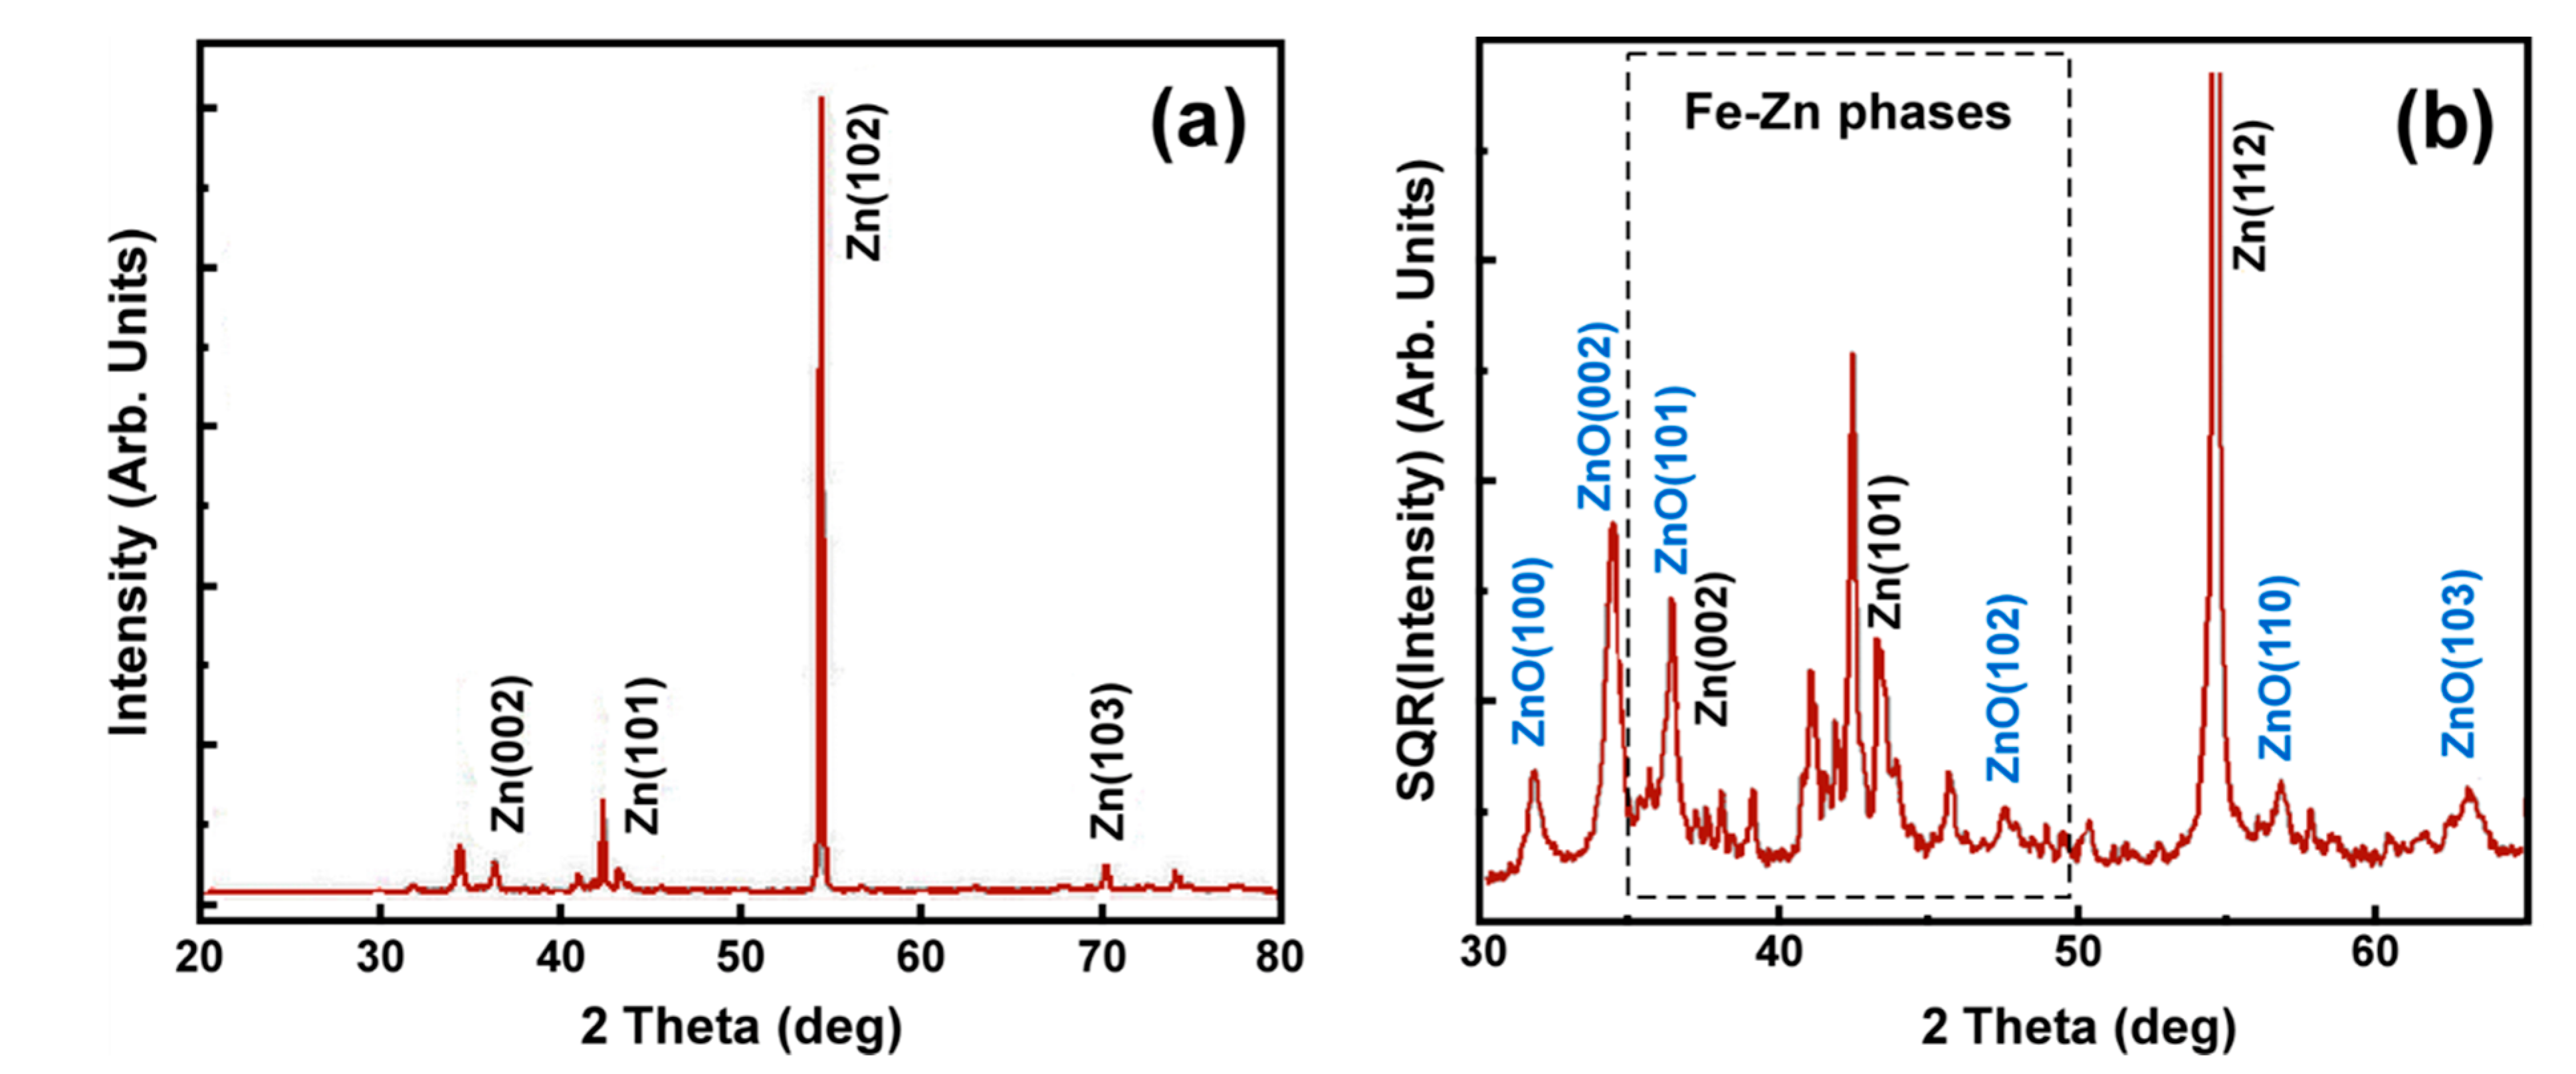
4.1. Hot-Dip Galvanized Coatings

BB-XRD diffraction characterization of the hot-dip galvanized zinc coating confirmed the formation of several Zn compounds (Figure 3a,b). Diffraction peaks and Zn phases identification was accomplished using the following powder diffraction file (PDF) cards: 04-0831 (Zn), 65-3411 (ZnO), 45-1184 (delta phase), 65-1238 (zeta phase) [45]. Namely, various Zn phases were confirmed, such as phase eta, zeta and delta alongside the zinc oxide (ZnO). According to theory, the strongest peak should be that of Zn, which corresponds to the (101) reflection. However, the strongest intensity peak in the diffraction pattern of Figure 3 corresponds to (102) Zn peak, indicating a preferable growth orientation for the Zn crystals. This is attributed to the cooling rate following the immersion of the samples in the Zn liquid bath and the presence of Fe–Zn grains in the eta phase of the coating. These grains act as nucleation sites that favor the (102) growth direction instead of the (101).
SEM micrograph analysis was also used to confirm the various Zn phases present in the coating. As shown in the SEM micrograph of Figure 4a, the presence of eta, zeta and delta Zn phases were formed in layers. EDS analysis indicated a Fe concentration of 7–11.5 wt.% and 5–6 wt.% in the delta and zeta phase, respectively. The oxygen concentration was lower than 4 wt.%. The top layer has an average thickness of 18 μm and consisted entirely of eta phase. As shown in Table 1, for an X-ray incidence angle higher than 18,146° (2θ > 36°), the penetration depth in eta phase is larger than 25 μm. This is significantly higher compared to the thickness of the eta phase layer thus the X-ray beam fully penetrates this phase and reaches the underlying zeta phase layer.
In addition, examination of the same samples with GI-XRD using an incidence angle of 5° (Figure 5a) and 1.5° (Figure 5b) confirmed the formation of eta phase and ZnO compounds in the top layer of the coating. Even though the penetration depth of the X-rays for an incidence angle of 5° is low, the peaks of zeta and delta phases were not completely eliminated from the diffraction pattern (Figure 5a) due to precipitation of zeta phase crystallites in the mass of the eta-phase [2,42]. This is due to the detachment of zeta phase grains during their formation or formed during cooling right after the emersion of the samples from the Zn bath in areas saturated with iron. Moreover, in the same XRD pattern, the ZnO peaks have also significantly higher intensity as compared to that of the BB-XRD pattern (Figure 3). Their intensity is further increased in the GI-XRD pattern with incidence angle 1.5° (Figure 5b). These results indicate that the ZnO oxides are restricted in the surface of the coating and can act as shield when the samples are exposed in aggressive environments.

4.2. Characterization of Pack Cementation Coatings

BB-XRD examination of the samples grown by pack cementation revealed the existence of ZnO and Fe–Zn phases (Figure 6). Considering the SEM images shown in Figure 4b, two different FeZn phases can be identified. The EDS analysis indicated a Fe concentration of 8–12 wt.% in the top thick layer and 20–25 wt.% in the thin layer placed above the substrate confirming the formation of delta and gamma phase, respectively. The presence of gamma phase in the interface with substrate has been reported previously [5,8,22]. However, as the thickness of the delta phase layer is larger than the corresponding X-rays penetration depth, the gamma phase could not be identified in the X-rays diffraction pattern. In contrast to the XRD pattern of the galvanized samples, no Zn peak could be identified, while low intensity ZnO peaks are also present (concentration lower than 3 wt.%). Furthermore, low intensity peaks corresponding to mixed Fe–Zn oxides were also present in the XRD pattern of Figure 6b. This is attributed to oxygen diffusion in the coating.
Furthermore, examination of the sample using small incidence angles GI-XRD (Figure 7a) confirmed the presence of the referred oxides into the first surface layers of the coatings. The corresponding oxides peaks in the GI pattern were much stronger as compared to those in the BB diagram, while the intensity of the delta phase peaks has been significantly decreased, especially in the 1.5° incidence angle pattern (Figure 7b). In this case, the crystals did not demonstrate any preferable growth orientation as following deposition process the samples were left to cool down slowly in the furnace using a slow cooling rate. These conditions do not favour the crystallization along specific crystalline orientations.

4.3. Characterization of Thermal Sprayed Zn Coatings

Figure 8a shows the BB-XRD pattern of the thermal sprayed Zn coating, indicating the presence of pure zinc. This is due to the fact that during thermal spray deposition, the diffusion processes are eliminated leading to confinement of the formation of Fe–Zn phases. This was also confirmed by the SEM image shown in Figure 4c. The GI-XRD diffractograms for both 5° and 1.5° were similar (Figure 8b,c). This is attributed to the characteristic rough surface morphology of such coatings [13,14,16]. It also important to mention that as the Zn diffraction peaks are very strong, low intensity peaks arising from very small concentrations of Zn compounds could not be identified in the pattern. To decrease the surface roughness, which is mainly responsible for the hide out of low intensity peaks, the thermal sprayed samples were mechanically polished. As a result, low intensity ZnO peaks were observed in the BB-XRD diffraction pattern of the polished samples (Figure 9). As reported previously [44], the oxidation of liquid metal droplets as they “flight” from the pistol flame to the substrate during deposition leads to the formation of ZnO oxides. Moreover, additional oxides were formed after the polishing process required to decrease the noise in the X-ray patterns as the Zn is very reactive and can oxidized immediately.

4.4. Experimental Verification of the Theoretical Calculations

In this section, Equation (12) is experimentally verified using a hot-dip galvanized sample that was exposed to 350 °C in inert atmospheric for 6 h. Two layers were formed due to the oxidation process, one of pure Zn material and one of Zn oxides (ZnO) on top. This procedure was followed in order to deal with a pure ZnO and Zn phases and not with complicated Zn–Fe phases, as following oxidation these phases are not easily reachable by the X-ray beam. We can assume that the top layer (scale) formed on the sample consists of ZnO as this phase is thermodynamically favored. The average thickness of this layer was evaluated using SEM to f = 10 ± 2 μm (Figure 10b). In case of GI-XRD examination (Ω = 5 deg) of this sample, the beam is expected to pass through the ZnO layer and reach the Zn layer, as according to Figure 2 the theoretically calculated penetration depth into ZnO is bigger than 10 μm. To get the penetration depth of the beam into the underling Zn layer, the integrated area of the main Zn GI-XRD diffracted peaks (2θ = 43.23°) of the non-oxidized Zn sample (Figure 5a) and the hot-dip oxidized sample (Figure 10) was obtained in order to calculate the ratio IDcoated/IDbase = IDcoated/IDZn, as the linear attenuation coefficients of Zn and ZnO are already known. Using Equation (12), it was concluded that the penetration depth into the underlying layer is tbase,1 = tZn = 1.257 μm. As a result, the penetration depth into the oxidized sample is d = f + tZn = 11.257 μm. The empirical law of Beer–Lambert for a Zn and a ZnO layer was also used to calculate the experimental X-ray’s penetration depth resulting in IZn = I0eμZn*tZn and IZnO = I0eμZnO*tZnO. For thicknesses such that IZn = IZnO, the empirical low leads to tZnO = tZn·μZnZnO. If the sample was completely consisted of ZnO, instead of Zn and ZnO, then tZn could be replaced by tZnO, and d = f + tZn·μZnZnO = 11.878 μm, which is in good agreement with the ZnO penetration depth shown in Figure 2 for an incident angle of 5°.
This result alongside the SEM thickness measurement indicates that the initial calculations obtained using Equation (12) were correct and thus it could be used for the estimation of the penetration depth (x) in a two layered material as follows: the thickness of the surface layer can be measured by varying the incident angle Ω of the X-rays at a certain range where the characteristic peaks of the underlying layer are barely visible. Under these conditions, the calculated penetration depth from Equation (6) corresponds to the thickness of the surface layer.

5. Conclusions

XRD analysis was used to phase monitor zinc coatings deposited by the hot-dip galvanizing process, pack cementation and the thermal spray technique. Calculations of the penetration depth of X-rays in various Zn phases present in the coating were used to theoretically verify the experimental results. The final equation (Equation (12)), corresponding to the penetration depth of the X-rays in a two-layer coating, was verified by applying it to the ZnO layers formed on the surface of the hot-dip galvanized samples. The results obtained using traditional methods such as SEM and XRD analysis were found to be in excellent agreement with those calculated by Equation (12). It was concluded that regardless of the structure and chemical content of the Zn coatings, a varied thickness thin zinc oxide film is formed on top of the as-deposited coatings. This oxide film is expected to offer additional protection to the metallic components/steel against aggressive environmental factors.

Funding

This research received no external funding.

Acknowledgments

I gratefully acknowledge K. Papanastasiou, D.D. Chaliampalias, N. Pistofidis, and E. Delli for their substantial assistance in the experimental procedure and data processing.

Conflicts of Interest

The authors declare no conflict of interest.

References

  1. Marder, A.R. The metallurgy of zinc-coated steel. Prog. Mater. Sci. 2000, 45, 191–271. [Google Scholar] [CrossRef]
  2. Vourlias, G.; Pistofidis, N.; Stergioudis, G.; Tsipas, D. The effect of alloying elements on the crystallization behavior and on the properties of galvanized coatings. Cryst. Res. Technol. 2004, 39, 23–29. [Google Scholar] [CrossRef]
  3. Chen, X.; Li, C.; Bai, X.; Wang, H.; Xu, S.; Song, S. Microstructure, mechanical properties, abrasive wear, and corrosion behavior in molten zinc of boride-based coatings in situ synthesized by an HVOF spraying process. Coatings 2019, 9, 665. [Google Scholar] [CrossRef] [Green Version]
  4. Thierry, D.; LeBozec, N.; Le Gac, A.; Persson, D. Long-term atmospheric corrosion rates of hot dip galvanised steel and zinc-aluminium-magnesium coated steel. Mater. Corros. 2019, 70, 2220–2227. [Google Scholar] [CrossRef]
  5. Pistofidis, N.; Vourlias, G.; Chaliampalias, D.; Pavlidou, E.; Chrissafis, K.; Stergioudis, G.; Polychroniadis, E.K.; Tsipas, D. DSC study of the deposition reactions of zinc pack coatings up to 550 °C. J. Therm. Anal. Calorim. 2006, 54, 191–194. [Google Scholar] [CrossRef]
  6. Liu, Y.; Zhang, L.; Pei, L.; Sheng, H. Improved corrosion resistance of hydroxyapatite coating on carbon fiber by applying SiC interlayer. Appl. Surf. Sci. 2020, 512, 145692. [Google Scholar] [CrossRef]
  7. He, J.; Guo, X.; Qiao, Y. Oxidation behavior and adhesion performance of TiSi2–NbSi2 composite coating prepared via magnetron sputtering and then pack cementation. J. Alloys Compd. 2020, 820, 153425. [Google Scholar] [CrossRef]
  8. Vourlias, G.; Pistofidis, N.; Chaliampalias, D.; Patsalas, P.; Stergioudis, G.; Tsipas, D. A comparative study of the structure and the corrosion behavior of zinc coatings deposited with various methods. Surf. Coat. Technol. 2006, 200, 6594–6600. [Google Scholar] [CrossRef]
  9. Kawaguchi, Y.; Miyazaki, F.; Yamasaki, M.; Yamagata, Y.; Kobayashi, N.; Muraoka, K. Coating qualities deposited using three different thermal spray technologies in relation with temperatures and velocities of spray droplets. Coatings 2017, 7, 27. [Google Scholar] [CrossRef] [Green Version]
  10. Curry, N.; VanEvery, K.; Snyder, T.; Markocsan, N. Thermal conductivity analysis and lifetime testing of suspension plasma-sprayed thermal barrier. Coatings 2014, 4, 630–650. [Google Scholar] [CrossRef]
  11. Kahar, S.; Singh, A.; Vala, U.; Desai, A.; Smit Desai, S. Thermal sprayed coating using zinc: A review. Int. Res. J. Eng. Technol. 2020, 7, 6497–6503. [Google Scholar]
  12. Milanti, A.; Koivuluoto, H.; Vuoristo, P.; Bolelli, G.; Bozza, F.; Lusvarghi, L. Microstructural characteristics and tribological behavior of HVOF-sprayed novel fe-based alloy coatings. Coatings 2014, 4, 98–120. [Google Scholar] [CrossRef]
  13. Vourlias, G.; Pistofidis, N.; Chrissafis, K.; Stergioudis, G. Zinc coatings for oxidation protection of ferrous substrates: Part I. Macroscopic examination of the coating oxidation. J. Therm. Anal. Calorim. 2007, 90, 769–775. [Google Scholar] [CrossRef]
  14. Vourlias, G.; Pistofidis, N.; Chrissafis, K.; Stergioudis, G. Zinc coatings for oxidation protection of ferrous substrates: Part II. Microscopic and oxidation mechanism examination. J. Therm. Anal. Calorim. 2007, 90, 777–782. [Google Scholar] [CrossRef]
  15. Yamada, H.; Suryanarayanan, R. Calculation of the penetration depth of X-rays in intact pharmaceutical film-coated tablets by microdiffractometry. Pharm. Res. 2006, 23, 2149–2157. [Google Scholar] [CrossRef]
  16. Chaliampalias, D.; Pistofidis, N.; Pavlidou, E.; Tsipas, D.; Stergioudis, G.; Vourlias, G. Resistance of different Zn coatings at elevated temperature air environments. Surf. Eng. 2016, 32, 53–60. [Google Scholar] [CrossRef]
  17. Kolaklieva, I.; Kakanakov, R.; Chaliampalias, D.; Vourlias, G.; Cholakova, T.; Pashinski, C.; Chitanov, V.; Bahchedjiev, C.; Petkov, N.; Polychroniadis, E. Mechanical, structural and thermal properties of multilayered gradient nanocomposite coatings. J. Nano Res. 2012, 17, 193–202. [Google Scholar] [CrossRef]
  18. Riyas, A.H.; Shibli, S.M.A. Assessment of the role of ζ- and δ-phases in ZrO2–Al2O3 composite based hot dip zinc galvanized coating by layer wise tuning. Appl. Surf. Sci. 2019, 481, 972–986. [Google Scholar] [CrossRef]
  19. Kania, H.; Saternus, M.; Kudláček, J.; Svoboda, J. Microstructure characterization and corrosion resistance of zinc coating obtained in a Zn–AlNiBi galvanizing bath. Coatings 2020, 10, 758. [Google Scholar] [CrossRef]
  20. Yang, T.; He, Y.; Chen, Z.; Zheng, W.; Wang, H.; Li, L. Effect of dew point and alloy composition on reactive wetting of hot dip galvanized medium manganese lightweight steel. Coatings 2020, 10, 37. [Google Scholar] [CrossRef] [Green Version]
  21. Choi, K.; Yang, W.; Baik, K.-H.; Kim, Y.; Lee, S.; Park, J.S. Growth kinetics and isothermal oxidation behavior of aluminide pack coatings on a multiphase Mo–Si–B alloy. Oxid. Met. 2019, 92, 423–437. [Google Scholar] [CrossRef]
  22. Pistofidis, N.; Vourlias, G.; Chaliampalias, D.; Chrysafis, K.; Stergioudis, G.; Polychroniadis, E.K. On the mechanism of formation of zinc pack coatings. J. Alloys Compd. 2006, 407, 221–225. [Google Scholar] [CrossRef]
  23. Chaia, N.; Cossu, C.M.F.A.; Ferreira, L.M.; Parrisch, C.J.; Cotton, J.D.; Coelho, G.C.; Nunes, C.A. Protective aluminide coating by pack cementation for Beta 21-S titanium alloy. Corros. Sci. 2019, 160, 108165. [Google Scholar] [CrossRef]
  24. Chaia, N.; Cury, P.L.; Rodrigues, G.; Coelho, G.C.; Nunes, C.A. Aluminide and silicide diffusion coatings by pack cementation for Nb–Ti–Al alloy. Surf. Coat. Technol. 2020, 389, 125675. [Google Scholar] [CrossRef]
  25. Chaliampalias, D.; Pistofidis, N.; Vourlias, G. Effect of temperature and zinc concentration on zinc coatings deposited with pack cementation. Surf. Eng. 2008, 24, 259–263. [Google Scholar] [CrossRef]
  26. Guo, X.; Planche, M.-P.; Chen, J.; Liao, H. Relationships between in-flight particle characteristics and properties of HVOF sprayed WC–CoCr coatings. J. Mater. Process. Technol. 2014, 214, 456–461. [Google Scholar] [CrossRef]
  27. Ce, N.; Paul, S. Thermally sprayed aluminum coatings for the protection of subsea risers and pipelines carrying hot fluids. Coatings 2016, 6, 58. [Google Scholar] [CrossRef] [Green Version]
  28. Xie, M.; Lin, Y.; Ke, P.; Wang, S.; Zhang, S.; Zhen, Z.; Ge, L. Influence of process parameters on high velocity oxy-fuel sprayed Cr3C2–25%NiCr. Coatings 2017, 7, 98. [Google Scholar] [CrossRef]
  29. Papanastasiou, K. Study of Zinc Coatings in Correlation with the Penetration Depth of X-rays-Applications. Ref. No. GRI-2011-6023. Master’s Thesis, Aristotle University of Thessaloniki, Thessaloniki, Greece, 7 July 2010. [Google Scholar]
  30. Angerer, P.; Mann, R.; Gavrilovic, A.; Nauera, G.E. In situ X-ray diffraction study of the electrochemical reaction on lead electrodes in sulphate electrolytes. Mater. Chem. Phys. 2009, 114, 983–989. [Google Scholar] [CrossRef]
  31. Chaudhuri, J.; Shah, S. Thickness measurement of thin films by X-ray absorption. J. Appl. Phys. 1991, 69, 499–501. [Google Scholar] [CrossRef]
  32. Huaqiang, W.; Bin, L.; Wei, M.; Xingtao, L.; Kun, T. Computed depth profile method of X-ray diffraction and its application to Ni/Pd films. Surf. Coat. Technol. 2002, 149, 198–205. [Google Scholar]
  33. Doerner, M.F.; Brennan, S. Strain distribution in thin aluminum films using X-ray depth profiling. J. Appl. Phys. 1988, 63, 126–131. [Google Scholar] [CrossRef]
  34. Eisenberger, P.; Marra, W.C. X-ray diffraction study of the Ge(001) reconstructed surface. Phys. Rev. Lett. 1981, 46, 1081–1084. [Google Scholar] [CrossRef]
  35. Skrzypek, S.J.; Baczmanski, A.; Ratuszek, W.; Kusior, E. New approach to stress analysis based on grazing-incidence X-ray diffraction. J. Appl. Crystallogr. 2001, 34, 427–435. [Google Scholar] [CrossRef]
  36. Hubbell, J.H.; McMaster, W.H.; Del Grande, N.K.; Mallett, J.H. X-ray crosssections and attenuation coefficients. In IUCr International Tables for X-ray Crystallography; Kynoch Press: Birmingham, UK, 1974; pp. 47–49. [Google Scholar]
  37. Cullity, B.D.; Stock, S.R. Elements of X-ray Diffraction, 3rd ed.; Prentice Hall Inc.: New York, NY, USA, 2001; pp. 466–468. [Google Scholar]
  38. Korb, L.J.; Olson, D.L. Hot Dip Coatings, Corrosion. In ASM Handbook; ASM International: New York, NY, USA, 1992; Volume 13, pp. 975–1009. [Google Scholar]
  39. Korb, L.J.; Olson, D.L. CVD/PVD Coatings, Corrosion. In ASM Handbook; ASM International: New York, NY, USA, 1992; Volume 13, pp. 1035–1042. [Google Scholar]
  40. Tucker, R.C. Thermal Spray Coatings in Surface Engineering. In ASM Handbook; ASM International: New York, NY, USA, 2000; Volume 5, pp. 1446–1471. [Google Scholar]
  41. Pistofidis, N.; Vourlias, G.; Stergioudis, G.; Polychroniadis, E.K.; Tsipas, D. Corrosion Protection: Processes, Management and Technologies; Nova Publishing, Nova Science Publishers, Inc.: Hauppauge, NY, USA, 2009; Chapter 1; pp. 1–38. [Google Scholar]
  42. Vourlias, G.; Pistofidis, N.; Stergioudis, G.; Pavlidou, E.; Tsipas, D. Influence of alloying elements on the structure and on the corrosion resistance of the galvanized coatings. Phys. Status Solidi (A) Appl. Res. 2004, 201, 1518–1527. [Google Scholar] [CrossRef]
  43. Vourlias, G.; Pistofidis, N.; Chaliampalias, D.; Pavlidou, E.; Stergioudis, G.; Polychroniadis, E.K.; Tsipas, D. Zinc deposition with pack cementation on low carbon steel substrates. J. Alloys Compd. 2006, 416, 125–130. [Google Scholar] [CrossRef]
  44. Chaliampalias, D.; Vourlias, G.; Pistofidis, N.; Stergioudis, G.; Polychroniadis, E.K. A morphological and microstructural study of flame-sprayed zinc coatings on low-alloyed steels as a contribution to explaining their corrosion resistance. Phys. Status Solidi (A) Appl. Res. 2008, 205, 1566–1571. [Google Scholar] [CrossRef]
  45. Joint Committee on Powder Diffraction Standards (JCPDS). Powder Diffraction Files; International Centre for Diffraction Data (ICDD): Newton Square, PA, USA, 2003. [Google Scholar]
Figure 1. Schematic representation of X-ray diffraction in a flat sample. (a) Schematic representations of X-ray diffraction in a flat sample from the second layer of the examined material (b) and from both formed layers (c).
Coatings 10 01005 g001
Figure 2. The dependence of the penetration depth of X-rays in Zn, ZnO and in Zn–Fe phases to the incidence angle for the grazing incidence X-ray geometry (GI-XRD). The angle corresponds to the diffraction peaks with the highest intensity.
Coatings 10 01005 g002
Figure 3. Bragg–Brentano (BB-XRD) diffraction pattern of the hot-dip galvanized sample with intensity on the (a) and the square root of the intensity (b) on the y-axis, respectively. Use of the square root enables identification of even the lowest intensity peaks of the XRD pattern.
Coatings 10 01005 g003
Figure 4. SEM micrograph of the cross section of the coatings deposited by hot-dip galvanizing (a), pack cementation (b) and thermal spray (c).
Coatings 10 01005 g004
Figure 5. GI-XRD diffraction pattern of the hot-dip galvanized samples using an incidence angle of (a) 5° and (b) 1.5°.
Coatings 10 01005 g005
Figure 6. BB-XRD diffraction pattern (a) of the samples coated by pack cementation and (b) XRD pattern focusing on the framed area for the identification of the existing oxides. Peak identification was accomplished using the following PDF cards: 65-3411 and 65-0523 (ZnO), 76-1364 (ZnO2), 48-0567 (Fe0.76Zn0.24O1.165), 45-1184 (delta phase) [45].
Coatings 10 01005 g006
Figure 7. GI-XRD diffraction pattern of the samples grown using pack cementation with an incidence angle of (a) 5° and (b) 1.5°, respectively.
Coatings 10 01005 g007
Figure 8. (a) BB-XRD diffraction pattern of the samples grown by thermal spray. GI-XRD diffraction patterns of the same samples obtained using an incidence angle of (b) 5° and (c) 1.5°.
Coatings 10 01005 g008
Figure 9. BB-XRD diffraction pattern of the polished samples grown by thermal spray. The inset pattern is a zoom-in to the area of interest (ZnO peaks).
Coatings 10 01005 g009
Figure 10. (a) GI-XRD pattern and (b) SEM micrograph of the oxidized hot-dip coating.
Coatings 10 01005 g010
Table 1. The linear attenuation coefficients of Zn, ZnO and Zn–Fe compounds and the penetration depth of X-rays in BB-XRD calculated using Equation (5).
Phaseμ (cm−1)θ (ο)t (μm)
η-phase
(Zn)
430.30021.61629.540
18.14824.970
41.05152.650
ζ-phase
FeZn13
549.89020.74922.227
21.29422.784
44.39443.918
δ-phase
FeZn10
576.35021.13821.586
20.54421.006
20.89221.346
Γ-phase
Fe3Zn10
749.70121.33815.796
21.80016.122
20.70915.351
ZnO287.97318.12837.276
15.88632.793
17.21035.447
Table 2. Chemical composition (wt.%) of SAE 1010 specimens.
FeCMnSPSiAl
Balance0.110.550.0120.01600
Publisher’s Note: MDPI stays neutral with regard to jurisdictional claims in published maps and institutional affiliations.

