Abstract
The purpose of this research is to consider if the growing popularity of sustainable investment does not create additional risks in investing. Different views on sustainable investments were analyzed to identify different approaches to the main risks. A quantitative analysis was carried out to investigate the possible benefits and advantages of sustainable investment. Without taking into account the social perks of investing in sustainable funds, this study evaluates the performance and economic returns of both sustainable and traditional funds. The research was carried out in two parts by comparing samples of 30 sustainable and 30 traditional funds. Firstly, such methods as annual returns, standard deviations, Sharpe ratios, skewness, and kurtosis were calculated and analyzed. The Capital Asset Pricing Model (CAPM), Fama–French three-factor model and Carhart four-factor model were used to value different market portfolios. The findings of this study suggest that sustainable funds are less risky than traditional funds. However, at the same time, we want to point to pay attention to the period of our analysis and to have in mind that an increasing demand of social responsible assets increases risks as well. However, no clear evidence was found to confirm that sustainable funds can generate higher returns compared to traditional piers or benchmark index. Moreover, after studying different methods the study reveals that the Fama–French three-factor model was the most suitable for explaining the traditional and sustainable funds’ results.
1. Introduction
Sustainable investment is a relatively new concept in capital markets as it received extensive attention only in the 21st century. At the moment, it is probably one of the most discussed topics among not only professional investors but also the wider public. Responsible investing, lately, reaches the biggest popularity among institutional investors.
Authors Edward et al. found that the top-quintile (most compliant) stocks ranked by the environmental, social, and governance ESG score underperform the out-sample research universe [1]. Filtering an investment research universe by ESG factors in general detracts value for investors. The mentioned authors also determined the impact of incorporating the ESG factors into an existing investment process and they concluded that overlaying ESG factors onto an existing investment process detracts value, although the results are not statistically significant. Furthermore, consistent with Statman and Glushkov (2009), the authors found evidence of a negative impact to investor returns when low-ESG stocks were excluded and, therefore, concluded that incorporating ESG into a robust quantitative investment process could mitigate negative effects, thus providing investors with a portfolio that outperformed a benchmark while allowing investors to embrace ESG [2].
Early studies of ESG returns focused on stock mutual funds. Bauer et al. (2005) found no statistically significant difference between the returns of ESG mutual funds and those of all funds [3]. Studies of mutual fund returns, however, are hampered by the confounding effects of differences in mutual fund expenses and differences in the investment skills of their managers. Comparisons of the returns of indexes are free of these confounding effects. Yet, Statman (2016) found no statistically significant differences between the returns of ESG indexes and the return of the S & P 500 Index of conventional companies [2].
Many more recent studies also have found no statistically significant difference between the returns of ESG investments and those of conventional investments.
The author Meir Statman in his research identified that transition expanded the ESG movement by adding investors but degraded it from doing good to doing well [4]. The author stressed that it is time for the movement to regain its way, transitioning back from doing well to doing good, from banner-minded and pseudo-ESG investors to plow-minded investors, and from wants for utilitarian returns for oneself to wants for utilitarian, expressive, and emotional benefits for others [4].
In practice, asset owners can very often use ESG benchmarks to ensure consistency in their total portfolio and individual allocations and avoid potentially sub-optimal portfolio construction. Some large asset owners have started to follow this strategy.
The main purpose of this research is to consider if increasing sustainable investments does not increase risks in investing. To reach the main goal we used quantitative analysis trying to identify the biggest benefits and advantages of sustainable investments. Without taking into account the social perks of investing in sustainable funds, our research evaluates the performance and economic returns of both sustainable and traditional funds. In order to reach our goal, we calculated as annual returns, standard deviations, Sharpe ratios, skewness, and kurtosis. For different market portfolios valuation, we used the Capital Asset Pricing Model (CAPM), the Fama–French three-factor model and the Carhart four-factor model.
We add value to the scientific literature by determining that sustainable funds are less risky than traditional funds but at the same time we raise an issue that an increasing demand of socially responsible assets increases risk as well. The latter point is an especially new aspect in the field of scientific research. However, no clear evidence was found to confirm that sustainable funds can generate higher returns compared to traditional piers or benchmark index. After studying different methods our research reveals that the Fama–French three-factor model was the most suitable for explaining the traditional and sustainable funds’ results.
So, our research filled the gap of more critical literature about sustainable funds valuing the profitability aspects in comparing it with lately raising risks.
The article is divided into three parts. First of all, we made a literature review of scientific articles and pointed to the main ideas of different findings. Secondly, we discussed methodological aspects and presented the methodology we have used in our research. Finally, we presented our results and discussed on different issues.
2. Literature Review
There are several definitions of sustainable investment in the literature. However, they all emphasize the importance of consideration of environmental, social, and governance (ESG) factors simultaneously to traditional financial analysis while performing investment valuation process [5,6,7]. ESG is still evolving field so we can meet different terms trying to describe the same concept. Different authors use such terms as sustainable investing, socially responsible investing, thematic investing, and responsible investing.
Therefore, sustainable investment is defined as the incorporation of ESG factors into the investment decision process. However, some definitions of ESG are quite narrow. The full approach of responsible investment covers not only investment decisions but also the role of owners and creditors. So according to Principles for Responsible Investment (PRI), “Responsible investment is an approach to managing assets that sees investors include environmental, social and governance (ESG) factors in: their decisions about what to invest in and the role they play as owners and creditors” [8].
Socially responsible investing (SRI) is an investment thesis that considers financial return and ethical behavior to bring about social and environmental change. ESG is a set of criteria used for evaluating the activities of investee companies from the perspectives of governance and environmental and social impact [1].
According to Kevin D. Mahn, SRI is an investment style that uses both positive and negative screens to include or exclude companies in a portfolio based on social, moral, ethical, and religious criteria. Usually in an investing process companies that have revenues from areas such as weapons are excluded from the portfolio [9].
Lewis and Juravle distinguish several reasons explaining sustainable investment popularity: profitability of investments, company scandals, globalization, geophysical and environmental changes, changes in public opinion, political climate [10,11].
Firstly, even 86% of millennials are interested in sustainable investments which in turn means that the new generation is interested not only in economic returns but also in investments that are aligned with their values [12,13,14]. This trend leads investment management firms and institutional investors where they can be more focused on incorporating ESG factors into the investment decision process [15].
Secondly, according to Principles of Responsible Investing, as the public sector is incapable of solving all worldwide problems like scarcity or global warming without additional resources, economic growth and stability are dependable on investments by the private sector [5]. From the introduction of Principles of Responsible Investing in 2006, the number of signatories increased from 100 to over 1800 by 2018 which emphasizes the growth of sustainable investments. Moreover, investing sustainably is also useful for institutional investors or investment management firms not only for ensuring stable growth of economy which in turns means growth of investment returns but also for incorporating additional evaluation of potential risks and opportunities which creates a strategic advantage for any long-term investor [16]. Urwin et al. (2009) supplement by stating that sustainable investment enables pension funds and other institutional investors to use a more effective model of investing [17,18].
The attitude to responsible investment has changed a lot in recent years. Looking at Global Sustainable Investment Alliance (GSIA) data, we can see that assets related to responsible investment reached 30.7 trillion USD in 2018, while in 2016, the level of such assets was just 22.9 trillion USD. According to Lloyd Kurtz (2020), approximately 50% of assets under management (AUM) in Europe, Canada, and Australia are managed under a responsible investment policy [19]. The situation in the US is a bit different, as there, only 25% of AUM is related to responsible investment policy. Looking at the trends in financial markets, and among investors, we can say that the amount of AUM related to responsible investment will increase a lot in 2019 and 2020. Not only are commercial institutions related to responsible investments, but central banks are also starting to be involved in this field of investment.
Gaurav Talan and Gagan Deep Sharma made a great work by doing a systematic review and research agenda for sustainable investment [20].
Climate activism has accelerated and is supported not only by students but also by respected scholars in many disciplines. Even universities are strongly evolved with their sizable endowment funds into ESG [21].
Authors Jeff Dunn, Marisol Hernandez, and Christopher Palazzolo in their article presented six United Nations Principles of Responsible Investment (UN PRI) (Table 1).

Table 1.
United Nations Principles of Responsible Investment.
The PRI defines responsible investment as a strategy and practice to incorporate environmental, social, and governance (ESG) factors in investment decisions and active ownership. It is not just enough to buy an ESG fund and passively wait for investment return. Looking at six different ESG principals we can agree that the most important ones are principal 1 and principal 2. ESG investment is a long period investment and this type of strategic decision must be done continually, and the responsibility to add value to sustainable growth must be taken as long as an asset is held.
After the institution decides to include responsible investments into an investment portfolio, two main things must be considered: responsible asset selection and responsible ownership.
Responsible asset selection consists of two main fields: screening and ESG integration. ESG integration is related to valuation and risk. Responsible ownership is related to voting, engagement, activism, and direct management. However, despite the view that ESG investments must be related to responsible ownership, lots of institutional investors are passive. They just buy ESG mutual fund or exchange-traded fund (ETF) and believe that they have an active role in responsible investment. We support the idea that responsible investment must be active, and that investors must take the responsibility of ownership.
Responsible investment is not a new trend in the twenty-first century. The first socially responsible mutual fund in the US was launched in 1971. The development of socially responsible investments is shown in Figure 1.
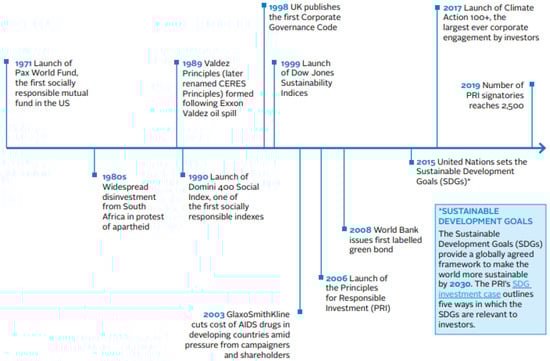
Figure 1.
The development of socially responsible investments. Source: [8].
The main point that we want to stress is that the popularity of responsible investments increases every year (see Figure 2), but the sad thing is that lots of investors are very passive. According to EY research wealth and asset managers have seen big inflows to sustainable investments [15].
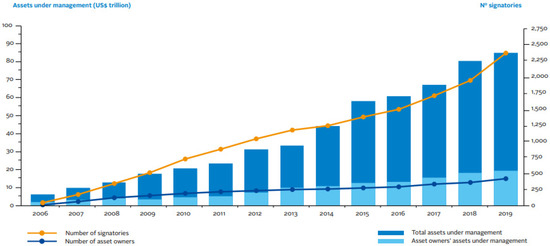
Figure 2.
Tendencies of assets under management. Source: [8].
Being passive, investors have a wrong understanding that to add value to sustainable economic growth, it is enough just having responsible investments without the responsibility of ownership. This insight can be drawn from the practical point and discussing with portfolio managers and central bankers. Sometimes to have sustainable investments in the portfolio is somehow like a good stamp for institution. Sometimes financial institutions are even forced to do that despite their willingness to participate in socially responsible investment and especially it is obvious in various communities, associations and unions. The authors Tizian M. Fritz and Georg von Schnurbein analyzed the aspect of mission driven portfolio and stressed the importance of the involvement in business activities [24].
Despite the fact that we strongly support the idea that responsible investments must be related with responsibility of ownership, we understand that most investments are done in a passive way. The popularity of ESG assets increased a lot [12]. More than one quarter of professionally managed assets in the US are invested according to ESG principles. Such investments are a business building opportunity.
The CFA Institute and United Nations Principles for Responsible Investment worked a lot in the field of ESG practical issues in order to identify ESG integration techniques and develop the ESG integration framework (see Figure 3).

Figure 3.
Environmental, social, and governance (ESG) Integration. Source: [25].
However, the importance of economic returns should also be emphasized as it is by far the most important factor while evaluating traditional investments. While recently conducted research was not able to determine whether traditional or sustainable investments are more profitable (Bauer et al., 2005; Kreander et al., 2005; Mill, 2006; Renneboog et al., 2011), several authors found that sustainable investing is less risky than traditional (Mallin et al., 1995; Kreander et al., 2005; Bauer et al., 2005) which in turn implies that sustainable investment may become better than traditional in all meanings. We think that because of the very high demand of sustainable investing, the risk profile of such investments has changed a lot [3,5,26,27,28].
As the economic return remains an important factor of every investment, the main question of this research is to evaluate if sustainable mutual funds that invest in equities issued by large European companies generate investors not lower investment returns than corresponding traditional funds.
George Serafeim analyzed public sentiment in the ESG investments and found that in the process of analyzing ESG investments public sentiment momentum about a firm’s sustainability activities had significant implications for the valuation of corporate sustainability activities and the performance of portfolios that seek alignment with better ESG performance [29]. The author made a conclusion that in the presence of negative public sentiment, firm sustainability activities are valued less and associated with positive abnormal returns in the future. No such future positive abnormal returns are associated with firm sustainability activities in the presence of positive public sentiment.
Guido Giese, Linda-Eling Lee, Dimitris Melas, Zoltán Nagy, and Laura Nishikawa described two possible paths to applying a consistent level of ESG integration: (1) a top-down approach, which starts with the definition of global ESG policy benchmarks and then derives ESG implementation methodologies for all allocations; (2) a bottom-up approach, which integrates ESG allocation-by-allocation and may ultimately lead to the adoption of an ESG policy benchmark [30].
The mentioned authors pointed that the choice of ESG benchmark may differ depending on whether it is used at a strategic level or at an allocation level.
Vaska Atta-Darkua, DavidChambers, Elroy Dimson, Zhenkai Ran, and Ting Yu in their research have written that empirical evidence has shown that engagement can be an effective tactic in some cases and can help enhance firm behavior [31]. The evidence for divestment having a direct impact on firms is more mixed. In practice, at present, both strategies have a following among investors, with many opting for a combination. In either case, responsible investors need to be cautious about the data they use to make decisions.
Christian Walkshäusl in his article about socially responsible firms analyzed the relationship between ESG ratings and average stock returns in the broad cross section of international firms drawn from 22 developed equity markets over the sample period from 2003 to 2016 with the aim of dissecting the performance of socially responsible firms. The author did not find that high-rated ESG firms outperform low-rated firms in international markets. However, rated firms in general outperform unrated firms after controlling for the most-established benchmark variables in the cross section of average stock returns based on firm SZ, BM, MOM, OP, and INV [32].
Mike Chen and George Mussalli analyzed ESG investing in the framework of three major pillars:
- PILLAR 1: ESG ALPHA FACTORS
- PILLAR 2: INVESTMENT MATERIALITY METRICS
- PILLAR 3: INTEGRATED ESG PORTFOLIO CONSTRUCTION [33]
Christian Walkshäusl in his research made a conclusion that under the assumption that investors will learn over time about the finding that being rated according to ESG criteria is per se sufficient to affect subsequent fundamental firm performance in a beneficial way. The author expected that the positive excess returns of ESG-rated firms relative to unrated firms would decrease toward zero in the long run [32].
The author Benjamin Tobias Peylo in his article, “A Synthesis of Modern Portfolio Theory and Sustainable Investment” pointed that the status quo of financial analysis based on the framework of modern portfolio theory did not allow for the integration of sustainability criteria, thus making modification necessary [34]. So, the author created a framework which was proposed for a synthesis of conventional and sustainable portfolio selection (Figure 4).
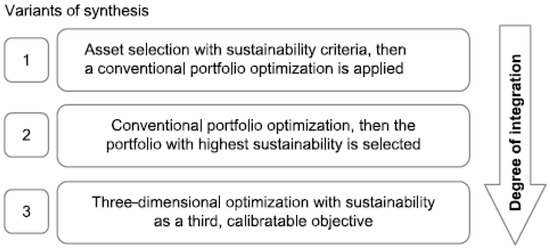
Figure 4.
Synthesis of conventional and sustainable portfolio selection. Source: [34].
The result of the research which was made by the author Benjamin Tobias Peylo showed the general advantages of the use of the framework of modern portfolio theory, because the optimization led to considerably superior financial results in comparison to the benchmark. The author pointed out that a synthesis with sustainable investment was possible. The proposed framework of the three-dimensional optimization (Figure 4) proved to be especially viable and successful.
Carmine de Franco in the article introduced an aggregated indicator of controversy built from 10 specific ESG indicators from the Sustainalytics database [35]. After classifying stocks dynamically as low, moderate, high, or no controversy the author first built portfolios of stocks with the same level of controversy and reviewed their aggregated performance in three different regions: Europe, US, and Asia-Pacific. The results showed that in Europe and the US, higher levels of controversy carried the expense of decreased performance and increased risk when measured, for example, by maximum drawdown. However, the mentioned author did not reach the same conclusion for the Asia-Pacific region, which does not exhibit the same characteristics.
Gordon B. Pye in his research described that the mean-variance approach was not well suited to investors who wanted to make periodic withdrawals, and the expected utility approach had been difficult to implement. In order to solve the mentioned problems, the author developed the model making the assumption that investors wanted to make sustainable real withdrawals. Gordon B. Pye thought that key factors for sustainability were the initial withdrawal as a percentage of the investment and how future withdrawals were reduced in response to shortfalls in return. The author analyzed the effect of the expected mean and variance of stock returns on the prospective withdrawals and also investigated the effect of errors in those expectations on the withdrawals actually received [36].
Javier Rodríguez and Herminio Romero in their study examined the international diversification value of SRI ETFs that invested globally in comparison with their conventional counterparts. They followed samples of SRI and conventional ETFs that traded daily in US exchanges. Using orthogonal returns, those authors showed the effects the US economy and its markets forces had on US-listed ETFs. Their results showed that SRI investors could calmly choose SRI ETFs as their went-to vehicle for international diversification, as the true diversification value of SRI ETFs was significantly higher than that of conventional ETFs. The results were robust to the use of portfolios or an analysis of individual ETFs [22]. The diversification aspect was analyzed in the article of Shao, X.-F et al. The authors. The authors focused on business risk and made a conclusion that diversification alone would not always lead to a lower corporate risk [37]. It is a very good aspect that diversification itself is not a solution for the purpose to lower risk.
The subject of sustainable investment lately has been widely investigated by researchers not only due to increasing interest in sustainability but also due to subsequent economic importance. The overall findings from the performance effects of sustainable investing are inconclusive and there is no consensus to the question of whether investors have to sacrifice part of their economic returns if they invest sustainably.
Meir Statman and Denys Glushkov constructed a factor model that extended the common four-factor asset-pricing model into a six-factor model by adding two social responsibility factors. Those authors offered the model as a tool for classifying mutual funds as socially responsible mutual funds and measuring their performance. The factors were related to good employee relations and exclusion of tobacco companies. The authors also discussed factors related to Catholic and Islamic values [2].
Renneboog et al. (2011) argue that sociably responsible investors value the fund’s sustainability more than profitability [38]. They suggest that investors are less sensitive to the past performance of the fund while valuing sustainable investments. However, Renneboog et al. (2011) did not find any evidence that sustainable funds underperform or overperform their traditional peers or benchmark index [38].
To examine the impact of adopting a sustainable approach to investments, Mill (2006) evaluated the results of mutual funds in the United Kingdom before and after they incorporated socially responsible investment principles into the investment decision process [28]. However, he found no support of either out- or underperformance relative to the benchmark market index.
The author Campion Chiromba analyzed responsible investment and its impact on investment decisions in Zimbabwe. The results of that analysis showed that there was no significant relationship between ESG factors and the decision to invest for Zimbabwean individual investors [39].
Nofsinger and Varma (2014) find evidence that state of the economy is an important factor when evaluating the performance [40]. Specifically, during non-crisis periods sustainable funds underperform their counterparties, whereas during crises they generate better returns than traditional funds. Based on these findings, the authors state that sustainable funds may offer protection from market fluctuations, but investors have to sacrifice part of returns during neutral market periods.
Becchetti et al. (2015) agree with these findings as they notice that sustainable funds do better than traditional funds in the period following the global financial crisis [41].
On the contrary, Mallin et al. (1995) find that sustainable funds outperform traditional funds in terms of Jensen’s alphas generated by these funds [27]. However, they also find sustainable funds’ outperformances decrease in terms of Sharpe Ratios and Treynor measures. Mallin et al. (1995) argue that these differences may be because sustainable funds tend to have lower betas than traditional ones [27]. This argument is corroborated by subsequent research. Specifically, Bauer et al. (2005) showed that sustainable funds were less sensitive to market fluctuations [3]. Kreander et al. (2005) also found that sustainable funds are less risky when measured by both beta and standard deviation [26]. The author Richey Greg in his article applied the Carhart four-factor model and Sortino ratio to investigate the risk-adjusted return of a portfolio of “vice stocks” from various industries against that of the market portfolio [42].
Ananth Madhavan and Aleksander Sobczyk contend that investors who prefer the fixed-income funds with high ESG scores or with an ESG focus need to be aware that these investment strategies may, through tilts on factors, affect risk and return [43]. We concur with these authors in that it is too early to tell if ESG will affect returns because they seem to be more long-run factors.
Bruno Gerard examines how firms’ ESG performance was related to their financial performance, valuation, and risk [44]. That is, higher ESG scores were related to higher profitability, higher stock values (and hence greater general collateral value), lower risk as well as more positive returns from M&A activity. ESG events also significantly affected firm value. Negative events reduced firm value. Furthermore, positive events had positive valuation consequences if they followed negative events, or if they occurred to firms with good governance. Bruno Gerard stresses the importance of G in ESG: the firms with fewer agency problems and better governances exhibit a stronger link between ESG scores and firm performance. Moreover, firms with better governance suffered smaller negative firm-value responses to adverse ESG events and positive rather than negative responses to positive ESG events. The author also finds that investor actions that improved firms’ governances or CSRs had a positive effect on stock values [44]. To analyze all the factors which have impact on stock price volatility is quite difficult task. The authors Narasimhan Jegadeesh and Sheridan Titman in their article make a conclusion that investor expectations are systematically biased [45].
Hershel Harper argues that integrating an ESG evaluation tool in an institutional investors’ research and selection process can generate additional information of risks beyond the financial statement analyses [46]. Although a growing number of investors around the world have adopted some form of responsible investing as an integral part of investment decision making, others remain on the sidelines due to the lack of consensus on global standards. These barriers prevent institutional investors from launching formal ESG initiatives. The author contends that properly implemented ESG analyses have the potential to enhance investment performance. Asset owners/investors should carefully consider how to best incorporate these additional analyses into their investment processes in order to develop a fuller understanding of the risk and return profile of their investments [46].
However, contrary to Mallin et al. (1995), neither Bauer et al. (2005) nor Kreander et al. (2005) find a statistically significant difference between the performance of sustainable and traditional funds [3,26,27]. The main contribution of the present paper, in a view of previous work, is to complement the research of sustainable investment focused on European markets taking the latest possible data in the account.
There are various articles analyzing factor investing, especially in bond market. Houweling P. and van Zundert J. analyzed the idea of factor investing in the corporate bond market. The mentioned authors offered empirical evidence that size, low-risk, value, and momentum factor portfolios generated economically meaningful and statistically significant aplhas in the corporate bond market [47].
New studies are more focused on positive aspects of sustainable funds not discussing the main issues of increasing different risks. The author Justina Alina Boitan analyzed different sustainable stock market indices and made a conclusion that sustainability indices can be included into investment portfolios in order to increase risk diversification and hedging [48]. Federica Ielasi and Monica Rossolini in their research made a conclusion that sustainability-themed mutual funds are more similar to other thematic funds. The authors made the performance analysis and stressed that such funds can give better results during financial crisis and that have extra benefits from SRI regulation and disclosure [49].
Pablo et al. in the article about sustainability score impact on mutual fund performance found out that the score of sustainability impacted positively the performance of the mutual funds. So, it means that lately the scoring became like a good guidance for choosing investments. The other aspect which was mentioned by the authors was that the higher the score of sustainability the bigger amount of the flows into the fund [50]. Iván Arribas et al. analyzed the issues of the inclusion of socially irresponsible companies in sustainable stock indices. The authors covered a very interesting point and raised the question if the companies which were defined as ethical, sustainable and socially responsible deserved that label. Their results showed that even in the Dow Jones Sustainability World Index, because of significant geographical and industrial bias, we could find companies conducting socially irresponsible activities [51].
3. Data and Research Methodologies
Different authors analyze socially responsible investments using very different methodologies. Ming-Lang Tseng et al. in the research used a very interesting way to analyze sustainable investments using the fuzzy set theory. The results of the study showed that corporate governance, economic performance and market risk were the causal aspects of sustainable investments [52]. Nomeda Dobrovolskiene and Rima Tamosiuniene in their article presented a sustainability-oriented model of financial resource allocation in a project portfolio and paid a lot attention to multi-criteria decision-making methods [53].
As shown in Section 2, the previous literature on the performance comparison of sustainable versus traditional funds is based on data from more than 15 years ago. Since then, the landscape of sustainable investing has been dramatically changed. Therefore, it is important to examine the recent performance of the sustainable funds. To this end, we collect a sample of representative funds that invest in large European stocks. The sample covers the period from December 2014 to December 2018.
Our sample comes from the Morningstar database. To classify sustainable and traditional funds, we use the Morningstar Sustainability Rating [14,54]. That is, the funds that are assigned with a high Morningstar Sustainability Rating are classified as sustainable funds, whereas the funds with a low rating are classified as traditional funds. To construct funds’ performance metrics, we obtain the funds’ Net Asset Values (NAV) data from the Financial Times database.
To compare the overall performance of sustainable versus traditional funds, we construct the sustainable portfolio and tradition portfolio, respectively, based on the aforementioned fund classifications. Following Becchetti et al. (2015), these two portfolios are equally weighted [41]. Before we construct the return time series of both portfolios, we first calculate the fund’s return in period i as follows:
where stands for the fund’s NAV in the end of period i. Then we aggregate the individual funds’ returns to portfolio returns.
Additionally, we need to define the benchmark index to measure the funds “Alpha”. The benchmark also serves as the proxy for market portfolio, which we will use in the subsequent part of the empirical research. We choose two benchmark indices (market portfolios): “MSCI Europe Index Net” and European market portfolio retrieved from Professor Kenneth French’s online library. MSCI Europe Index Net has over 400 constituents, covering approximately 85% of the free float-adjusted market capitalization across the European Developed Markets Equity universe [54]. European market portfolio data are compiled by Professor Kenneth French, the co-founder of the Fama–French three-factor model [55]. The data in Kenneth French online library is widely used in asset pricing studies all over the world.
In the first part of our empirical research, three main tools were used for comparison of different investments: annual return, standard deviation and Sharpe ratio. The annual returns are defined as
where denotes the returns in each period , and denotes the total number of periods in a year.
The volatility of a financial asset is usually measured by the standard deviation of its returns. The standard deviation is calculated as
where denotes returns in each period, and denotes the total number of periods in a year. Furthermore, in order to compare the funds’ annual returns with their return standard deviations, we also annualize the standard deviations as
where . The scaling factor 252 approximates the number of trading days in most financial markets.
Sharpe ratio gives us the information about how much return an investor can get given the level of risks that he or she is willing to take. Following Sharpe (1966), the Sharpe ratio is calculated as
where denotes the return in period , denotes the risk–free rate of return, denotes the standard deviation of excess returns over the risk-free rate of returns [56,57]. Our proxy for the risk-free rate return is German 10-year government bond yield. In this paper, the Sharpe ratio is also annualized using the method similar to the Equation (4) analogical approach, as in case of standard deviation.
The Sharpe ratio can also identify the ex post performance of a portfolio over a period of time. If a fund’s Sharpe ratio is greater than the slope of the capital market line, it means the fund’s performance is superior to what investors can expect in equilibrium. Similarly, a Sharpe ratio below the slope of the capital market line indicates an inferior performance.
As shown by numerous prior literatures, fund returns, along with the returns of other securities, do not follow normal distributions. Jondeau, E. et al. pointed that asset returns do not behave according to the bell-shaped curve, associated with the Gaussian or normal distribution [58] This creates risks of “higher moments”. Therefore, we also employ skewness and kurtosis metrics to measure these risks. Skewness is the degree of distortion from the symmetrical normal distribution. Kurtosis is a measure of whether the data are heavy-tailed or light-tailed, relative to a normal distribution [16].
Skewness is defined as
Kurtosis is defined as
In Equations (6) and (7), where denotes the return in a period , denotes the mean of the returns, denotes the number of days in a year, and denotes the standard deviation of the returns.
In the second part of our empirical research, we use asset pricing models to estimate the abnormal returns of both sustainable and traditional funds. In asset pricing theories, there are three widely accepted models: the Capital Asset Pricing Model (CAPM), the Fama–French three-factor model, and the Carhart four-factor model (Sharpe, 1964; Fama, French, 1996; Carhart, 1997) [55,56,59]. These models have been extensively used in the fund literature, such as in Bauer et al. (2005), Kreander et al. (2005), Renneboog et al. (2011), Nofsinger and Varma (2014), and Becchetti et al. (2015) [3,26,40,41,60].
William Sharpe (1964) and John Lintner (1965) independently proved the asset pricing theory that today we call the Capital Asset Pricing Model (CAPM) [56,61]. The Capital Asset Pricing Model distinguishes two risks: the idiosyncratic risk (i.e., the risk that can be diversified away) and the systematic risk (i.e., the risk that cannot be diversified away). The Capital Asset Pricing Model connects the expected return on a portfolio to its beta. The beta of a portfolio is the sensitivity of its returns to market returns. Beta is a measure of systematic risk and is calculated as:
where and are the returns of asset i and the market portfolio, respectively; and are their return standard deviations; and is the correlation between the returns of asset i and those of the market portfolio.
Building on the market factor in the Capital Asset Pricing Model (CAPM), the Fama–French three-factor model adds the size factor and growth factor, and the Carhart four-factor model adds the momentum factor [59]. The size factor indicates that small stocks outperform big stocks. The growth factor indicates that value stocks outperform growth stocks. The momentum factor indicates that investors can achieve superior performance by buying stocks that have performed well in the past 3–12 months (winners) and selling stocks that have performed poorly in the last 3–12 months (losers). CAPM, the Fama–French three–factor model, and the Carhart four–factor model can be summarized in the following equations:
In Equations (9)–(11), , , and denote the return of the risky asset , the risk-free asset, and the market portfolio in month , respectively. , , , are the loadings of respective factors and is the excess return of the risky asset . SMB (small minus big) is the size factor of the Fama–French three-factor model, calculated as the difference in returns between a small cap and a large cap portfolio in month t. HML (high minus low) is the growth factor of the Fama–French three-factor model, calculated as the difference in returns between a portfolio of stocks with high book-to-market ratios (value stocks) and a portfolio of stocks with low book-to-market ratio (growth stocks) in month t [62]. MOM is the momentum factor from the Carhart four-factor model, calculated as the difference in returns of a portfolio with stocks with the highest returns in the last 11 months and a portfolio of stocks with the lowest returns in the same market period [59].
Following the previous literature, we apply monthly returns of the fund portfolios and benchmark index to Equations (9)–(11). The data of the factors in these equations are retrieved from the Kenneth French online library and MSCI database.
4. Results and Discussion
Table 2 reports the annual returns, standard deviations, and Sharpe ratios of both fund portfolios and the benchmark index using daily returns.
Table 2.
Annual returns, standard deviations and Sharpe ratios of sustainable fund portfolio, traditional fund portfolio, and benchmark index using daily returns.
During our sample period, the benchmark index generated the best economical return for investors as its annual return is the highest among all three assets. Sustainable funds outperform traditional funds based on the returns for the whole period. However, the annual comparisons between sustainable and traditional funds are mixed.
In terms of return volatilities, sustainable funds are less risky than traditional funds and benchmark index because the standard deviation of sustainable funds is the lowest in each year and in the whole period. This finding is consistent with Mallin et al. (1995), Bauer et al. (2005), and Kreander et al. (2005) [3,26,27]. Our results show that investors can be better off in terms of lower volatilities by investing on sustainable funds.
Based on the results of Sharpe ratios, the benchmark index achieved the highest Sharpe ratio. However, it should be noted that benchmark index is also the most volatile among the three assets. Sustainable funds have better Sharpe ratios than traditional funds in almost every year and the whole period. This is mostly due to the lower standard deviations of sustainable funds. This finding refutes the claim of Ananth Madhavan and Aleksander Sobczyk that ESG attributes fail to affect Sharpe ratios in recent years [43].
Table 3 and Figure 5 further analyze the risks of higher moments of sustainable and tradition fund portfolios. The metrics are skewness and kurtosis defined in Section 3.
Table 3.
Skewness and kurtosis of sustainable fund portfolio and traditional fund portfolio using monthly returns.
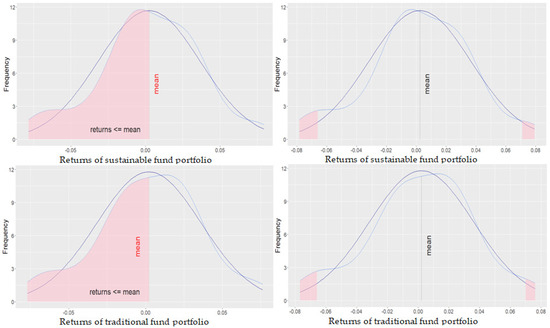
Figure 5.
The skewness (left) and kurtosis (right) of both fund portfolios.
As shown by Table 3 and Figure 5 neither sustainable funds nor traditional funds carry significant risks related to return asymmetry because the skewness and kurtosis measures in all cases are almost zero and the figure does not exhibit significant asymmetry in distribution.
In the second part of analyses, we use monthly return data to perform 15 regressions of the CAPM model, the Fama–French three-factor model, and the Carhart four-factor model, respectively [55,59]. The results of the CAPM regressions are in Table 4.
Table 4.
Results of the Capital Asset Pricing Model (CAPM) regressions.
As shown in Table 4, there is no statistically significant alpha for sustainable funds and traditional funds. Therefore, we fail to find evidence supporting the under- or out-performance of sustainable funds.
Panel A and B use the European market portfolio and MSCI European Index Net as proxies for market portfolio, respectively. The results seem to favor the latter as the better proxy. That is because the R-squared in Panel B is higher than that in Panel A. Furthermore, the market betas (the column titled ) in Panel A are around 0.7, whereas Panel B has betas that are approximately 1. According to the Markowitz portfolio theory and CAPM model, a well-diversified portfolio should have a beta of 1.
Figure 6 reports the CAPM regression residual analyses of the sustainable fund portfolio. The upper panel of Figure 6 uses European market portfolio to proxy for market, whereas the lower panel of figure uses the MSCI European Index Net. The figure shows that the regression that uses the MSCI European Index Net has a better fit.
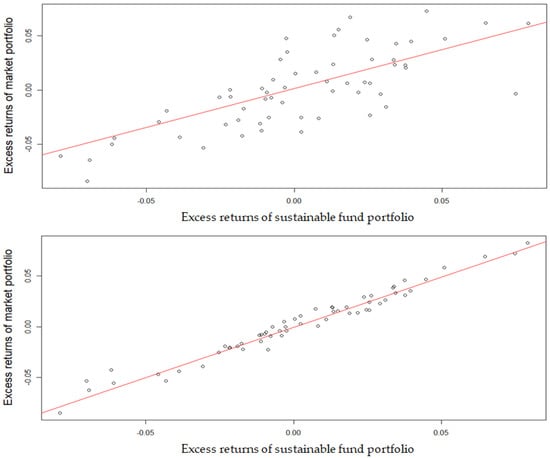
Figure 6.
CAPM regression residual analyses of the sustainable fund portfolio.
Table 5 reports the results of the Fama–French three-factor regressions. Notably, the Fama–French three-factor model has better explanatory power than the CAPM model as the R-squared all increase by approximately 10% compared to those in the CAPM model regressions in Table 4. It is further supported by the fact that all loading factors are statistically significant and therefore are useful when explaining the dynamics of returns.
Table 5.
Results of the Fama–French three-factor regressions.
Table 4 also shows that the biggest contributor to the returns of the research object is the returns of the market portfolio as it has the highest beta in all cases. Analogically, the smallest but still relevant contributor to the explanation of returns is the HML factor which represents the composition of the portfolio based on the book-to-market ratio of stocks. The most important finding from the results of the Fama–French regressions is statistically significant alphas when we use the MSCI European Index Net to proxy for market returns. Both sustainable and traditional funds have negative alphas (−1.7264% for sustainable funds and −2.0764% for traditional funds). Despite the fact that the excess returns are negative, sustainable fund portfolios generated better economical returns than their traditional counterparts.
In Figure 7 we can see regression residual analyses of sustainable funds with the Fama–French three-factor model using European market portfolio as market portfolio (upper panel) and using the MSCI European Index Net as market portfolio (lower panel).
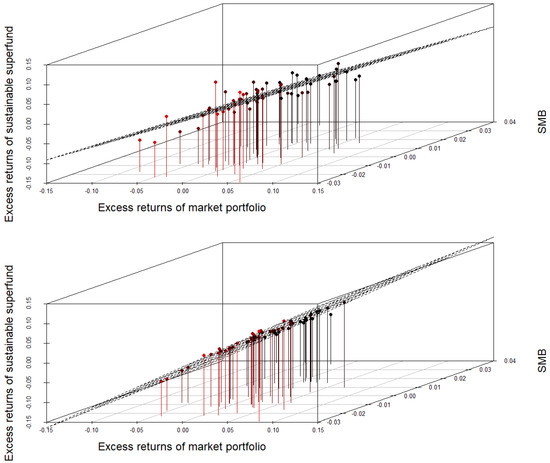
Figure 7.
Fama–French three-factor model regression residual analyses of the sustainable fund portfolio.
Moreover, we repeat the analysis using the Carhart four-factor model to evaluate the explanation power of MOM factor to returns. The results are in Table 6. However, the MOM factor is statistically insignificant. Therefore, the explanation power of the model is almost identical to the one of the Fama–French three-factor model.
Table 6.
Results of the Carhart four-factor regressions.
We also get the same conclusion as in Fama–French three-factor model case in that sustainable funds’ excess returns are not significantly different from zero, whereas traditional funds’ excess returns are significantly negative. In other words, sustainable fund portfolios generated better economical returns than their traditional counterparts when using the MSCI European Index Net to proxy for market portfolio.
5. Conclusions
Lately, sustainable investments became a very relevant issue in finance. Lots of finance institutions started to consider an active involvement in the sustainability process with the purpose of adding value to the greener environment. The main question for the financial sector is how to value sustainability and profitability aspects in investment strategy. Some cases show that sustainable investments do not always add value to green finance and sometime just create additional risks to institutions.
The main goal of this research was to determine if sustainable investment funds can generate better performance compared to traditional funds. However, of course, here we have an issue that those financial institutions that consider participating in a sustainability process have not only to consider the profitability aspect, and maybe even in some cases those organizations have to take less profit in order to add value to green finance. Our analysis showed that sustainable funds were less risky than traditional funds. However, we want to stress that only market risk was calculated. For further research it would be very interesting to value other type of risks which were related to investments in investment products which were related with sustainability. Furthermore, it is very interesting to measure a reputational risk which can be very strong in cases when the sustainability aspect appears very low. Not all green investments are green. So here is a big issue.
The period for the analysis was from December 2014 to December 2018. This period was taken to show the real situation, as in 2019 we had a very big increase in sustainable investment demand. When central banks joined the green finance market the demand for green investments increased a lot. So, the profitability in sustainable funds increased for old positions but it was not related with future tendencies at all.
During that period sustainable fund portfolios had less risk and generated higher returns than traditional funds in one of our scenarios. We completely agree that if the investments are really green then it can lower the risk of losing money in high volatility periods and more pessimistic scenarios.
In another scenario there was no evidence that sustainable funds performed better than traditional ones. Because of that, we conclude that there was no clear-cut dominance of sustainable funds over traditional funds. So, when there is a risk-taking environment in the financial markets then sustainable funds’ performance can be even poorer compared to traditional funds.
We have tested different models for explanation of sustainable and traditional funds’ results and made a conclusion that the Fama–French three-factor model was considered to have the best explanation power of the sustainable and traditional funds’ returns during the research period.
Author Contributions
Conceptualisation, X.-G.Y., Y.H., D.T., J.M.; methodology, Y.H., D.T., J.M.; software, J.M., W.L.; formal analysis, Y.H., D.T., J.M.; investigation, D.T., J.M.; data curation, D.T., J.M., W.L.; writing—original draft preparation, X.-G.Y., Y.H., D.T., J.M.; writing—review and editing, X.-G.Y., Y.H., D.T.; visualization, D.T., J.M., W.L.; supervision, Y.H. All authors have read and agreed to the published version of the manuscript.
Funding
This research was funded by the National Natural Science Foundation of China, grant number 71772013.
Conflicts of Interest
The authors declare no conflict of interest.
References
- Aw, E.N.; LaPerla, S.J.; Sivin, G.Y. A Morality Tale of ESG: Assessing Socially Responsible Investing. J. Wealth Manag. 2017, 19, 14–23. [Google Scholar] [CrossRef]
- Statman, M.; Glushkov, D. Classifying and Measuring the Performance of Socially Responsible Mutual Funds. J. Portf. Manag. 2016, 42, 140–151. [Google Scholar] [CrossRef]
- Bauer, P.; Koedijk, K.; Otten, R. International evidence on ethical mutual fund performance and investment style. J. Bank. Financ. 2005, 29, 1751–1767. [Google Scholar] [CrossRef]
- Statman, M. ESG as Waving Banners and as Pulling Plows. J. Portf. Manag. Ethical Investig. 2020, 46, 16–25. [Google Scholar] [CrossRef]
- Principles for Responsible Investment: The SDG Investment Case. 2017. Available online: https://www.unpri.org/download?ac=5909 (accessed on 10 July 2020).
- Sandberg, J.; Juravle, C.; Hedesström, T.M. The Heterogeneity of Socially Responsible Investment. J. Bus. Ethics 2009, 87, 519–533. [Google Scholar] [CrossRef]
- He, H.; Li, S.; Hu, L.; Duarte, N.; Manta, O.; Yue, X.-G. Risk Factor Identification of Sustainable Guarantee Network Based on Logistic Regression Algorithm. Sustainability 2019, 11, 3525. [Google Scholar] [CrossRef]
- An Investor Initiative in Partnership with UNEP Finance Initiative and UN Global Compact What Is Responsible Investment? Available online: https://www.unpri.org/download?ac=6998 (accessed on 12 February 2020).
- Kevin, D.M. The Impact of Sustainable Investment Strategies. J. Investig. 2016, 25, 96–102. [Google Scholar] [CrossRef]
- Lewis, A.; Juravle, C. Morals, Markets and Sustainable Investments: A Qualitative Study of ‘Champions’. J. Bus. Ethics 2010, 93, 483–494. [Google Scholar] [CrossRef]
- Lewis, E.; Pinchot, A.; Christianson, G. Navigating the Sustainable Investment Landscape; Working Paper; World Resources Institute: Washington, DC, USA, 2016; Available online: http://www.wri.org/publication/sustainable-investment-landscape (accessed on 10 June 2020).
- Morgan Stanley Institute for Sustainable Investing. Sustainable Signals. New Data from the Individual Investor. 2017. Available online: https://www.morganstanley.com/pub/content/dam/msdotcom/ideas/sustainable-signals/pdf/Sustainable_Signals_Whitepaper.pdf (accessed on 19 January 2020).
- Morgan Stanley Institute for Sustainable Investing. Sustainable Signals: Growth and Opportunity in Asset Management. Available online: https://www.morganstanley.com/assets/pdfs/2415532_Sustainable_Signals_Asset_Manager_2019_L.pdf (accessed on 12 June 2019).
- Morningstar. The Morningstar sustainability rating: Helping Investors Evaluate the Sustainability of Portfolios. 2017. Available online: https://www.morningstar.com/company/esg-investing (accessed on 12 May 2020).
- Ernst & Young. Sustainable Investing: The Millennial Investor. 2017. Available online: https://www.ey.com/Publication/vwLUAssets/ey-sustainable-investing-the-millennial-investor-gl/$FILE/ey-sustainable-investing-the-millennial-investor.pdf (accessed on 12 June 2020).
- Dunn, J.; Hernandez, M.; Palazzolo, C. Clearing the Air: Responsible Investment. J. Portf. Manag. Ethical Investig. 2020, 46, 36–41. [Google Scholar] [CrossRef]
- Urwin, R.; Worldwide, W.W.; Woods, C. Sustainable Investing Principles: Model for Institutional Investors; Oxford University Press: Oxford, UK, 2009. [Google Scholar]
- Gu, J.M.; Umar, S.; Soran, X.-G.Y. Exacerbating effect of energy prices on resource curse: Can research and development be a mitigating factor? Resour. Policy 2020, 67, 101689. [Google Scholar] [CrossRef]
- Kurtz, L. Three Pillars of Modern Responsible Investment. J. Investig. 2020, 29, 21–32. [Google Scholar] [CrossRef]
- Talan, G.; Sharma, G.D. Doing Well by Doing Good: A Systematic Review and Research Agenda for Sustainable Investment. Sustainability 2019, 11, 353. [Google Scholar] [CrossRef]
- Chambers, D.; Dimson, E.; Quigley, E. To Divest or to Engage? A Case Study of Investor Responses to Climate Activism. J. Investig. 2020, 29, 10–20. [Google Scholar] [CrossRef]
- Rodríguez, J.; Romero, H. Exchange-Traded Funds as an International Diversification Tool for Socially Responsible Investors. J. Wealth Manag. 2019, 22, 98–102. [Google Scholar] [CrossRef]
- Presler, G. Sustainable Funds U.S. Landscape Report 2018. Morningstar. 19 February 2019. Available online: https://www.morningstar.com/blog/2019/02/19/esg-landscape.htmlGoogleScholar (accessed on 12 June 2020).
- Fritz, T.M.; von Schnurbein, G. Beyond Socially Responsible Investing: Effects of Mission-Driven Portfolio Selection. Sustainability 2019, 11, 6812. [Google Scholar] [CrossRef]
- United Nations Principles for Responsible Investment (UN PRI). December 2018. Available online: https://www.unpri.org (accessed on 12 June 2020).
- Kreander, N.; Gray, R.H.; Power, D.M.; Sinclair, C.D. Evaluating the performance of Ethical and Non-Ethical Funds: A Matched Pair Analysis. J. Bus. Financ. Account. 2005, 32, 1465–1493. [Google Scholar] [CrossRef]
- Mallin, C.A.; Saadouni, B.; Briston, R.J. The Financial Performance of Ethical Investment Funds. J. Bus. Financ. Account. 1995, 22, 483–496. [Google Scholar] [CrossRef]
- Mill, G.A. The Financial Performance of a Socially responsible Investment Over Time and a Possible Link with Corporate Social Responsibility. J. Bus. Ethics 2006, 63, 131–148. [Google Scholar] [CrossRef]
- Serafeim, G. Public Sentiment and the Price of Corporate Sustainability. Financ. Anal. J. 2020, 76, 26–46. [Google Scholar] [CrossRef]
- Giese, G.; Lee, L.E.; Melas, D.; Nagy, Z.; Nishikawa, L. Consistent ESG through ESG Benchmarks. J. Index Investig. Fall 2019, 10, 24–42. [Google Scholar] [CrossRef]
- Atta-Darkua, V.; Chambers, D.; Dimson, E.; Ran, Z.; Yu, T. Strategies for Responsible Investing: Emerging Academic Evidence. J. Portf. Manag. Ethical Investig. 2020, 31, 26–35. [Google Scholar] [CrossRef]
- Walkshäusl, C. Dissecting the Performance of Socially Responsible Firms. J. Investig. 2018, 27, 29–40. [Google Scholar] [CrossRef]
- Chen, M.; Mussalli, G. An Integrated Approach to Quantitative ESG Investing. J. Portf. Manag. 2020, 46, 65–74. [Google Scholar] [CrossRef]
- Peylo, B.T. A Synthesis of Modern Portfolio Theory and Sustainable Investment. J. Investig. 2012, 21, 33–46. [Google Scholar]
- De Franco, C. ESG Controversies and Their Impact on Performance. J. Investig. 2020, 29, 33–45. [Google Scholar] [CrossRef]
- Gordon, B.P. Sustainable Investment Withdrawals Article. J. Portf. Manag. 2000, 26, 73–83. [Google Scholar] [CrossRef]
- Shao, X.-F.; Gouliamos, K.; Luo, B.-F.; Hamori, S.; Satchell, S.; Yue, X.-G.; Qiu, J. Diversification and Desynchronicity: An Organizational Portfolio Perspective on Corporate Risk Reduction. Risks 2020, 8, 51. [Google Scholar] [CrossRef]
- Renneboog, L.; Horst, J.T.; Zhang, C. Is ethical money financially smart? Nonfinancial attributes and money flows of socially responsible investment funds. J. Financ. Intermediation 2011, 20, 562–588. [Google Scholar] [CrossRef]
- Chiromba, C. Responsible Investment and Its Impact on Investment Decisions: Zimbabwe Scenario. J. Investig. 2020, 29, 98–109. [Google Scholar] [CrossRef]
- Nofsinger, J.; Varma, A. Socially responsible funds and market crisis. J. Bank. Financ. 2014, 48, 180–193. [Google Scholar] [CrossRef]
- Becchetti, L.; Ciciretti, R.; Dalò, A.; Herzel, S. Socially responsible and conventional investment funds: Performance comparison and the global financial crisis. Appl. Econ. 2015, 47, 2541–2562. [Google Scholar] [CrossRef]
- Richey, G.M. Sin is in an Alternative to Socially Responsible Investing? J. Investig. Summer 2016, 25, 136–143. [Google Scholar] [CrossRef]
- Madhavan, A.; Sobczyk, A. On the Factor Implications of Sustainable Investing in Fixed-Income Active Funds Article. J. Portf. Manag. 2020, 46, 141–152. [Google Scholar] [CrossRef]
- Gerard, B. ESG and Socially Responsible Investment: A Critical Review. Scand. J. Bus. Res. Beta 2019, 33, 61–83. [Google Scholar] [CrossRef]
- Jegadeesh, N.; Titman, S. Returns to Buying Winners and Selling Losers: Implications for Stock Market Efficiency First published: March 1993. J. Financ. 1993, 48, 65–91. [Google Scholar] [CrossRef]
- Harper, H. One Institutional Investor’s Approach to Integrating ESG in the Investment Process. J. Portf. Manag. 2020, 46, 110–123. [Google Scholar] [CrossRef]
- Houweling, P.; van Zundert, J. Factor Investing in the Corporate Bond Market. Financ. Anal. J. 2017, 73, 100–115. [Google Scholar] [CrossRef]
- Alina, B.J. Sustainable stock market indices: A comparative assessment of performance. J. Res. Emerg. Mark. JREM 2020, 2, 7–14. [Google Scholar]
- Ielasi, F.; Rossolini, M. Responsible or Thematic? The True Nature of Sustainability-Themed Mutual Funds. Sustainability 2019, 11, 3304. [Google Scholar] [CrossRef]
- Durán-Santomil, P.; Otero-González, L.; Correia-Domingues, R.H.; Reboredo, J.C. Does Sustainability Score Impact Mutual Fund Performance? Sustainability 2019, 11, 2972. [Google Scholar] [CrossRef]
- Arribas, I.; Espinós-Vañó, M.D.; García, F.; Morales-Bañuelos, P.B. The Inclusion of Socially Irresponsible Companies in Sustainable Stock Indices. Sustainability 2019, 11, 2047. [Google Scholar] [CrossRef]
- Tseng, M.-L.; Tan, P.A.; Jeng, S.-Y.; Lin, C.-W.R.; Negash, Y.T.; Darsono, S.N.A.C. Sustainable Investment: Interrelated among Corporate Governance, Economic Performance and Market Risks Using Investor Preference Approach. Sustainability 2019, 11, 2108. [Google Scholar] [CrossRef]
- Dobrovolskienė, N.; Tamošiūnienė, R. Sustainability-Oriented Financial Resource Allocation in a Project Portfolio through Multi-Criteria Decision-Making. Sustainability 2016, 8, 485. [Google Scholar] [CrossRef]
- MSCI: Does Your Portfolio Reflect Europe? 2018. Available online: https://www.msci.com/documents/1296102/1362201/MSCI-MIS-Europe-May-2018.pdf/194c1d84-0b87-dd23-97c4-b68a5a20eb1f (accessed on 2 August 2020).
- Fama, E.F.; French, K.R. Multifactor Explanations of Asset Pricing Anomalies. J. Financ. 1996, 31, 55–84. [Google Scholar] [CrossRef]
- Sharpe, W.F. Capital Asset Prices: A Theory of Market Equilibrium under Conditions of Risk. J. Financ. 1964, 19, 425–442. [Google Scholar]
- Sharpe, W.F. Mutual Fund Performance. J. Bus. 1966, 39, 119–138. [Google Scholar] [CrossRef]
- Jondeau, E.; Poon, S.H.; Rockinger, M. Financial Modeling under Non-Gaussian Distributions; Springer: London, UK, 2007. [Google Scholar]
- Carhart, M.M. On Persistence in Mutual Fund Performance. J. Financ. 1997, 52, 57–82. [Google Scholar] [CrossRef]
- Renneboog, L.; Horst, J.T.; Zhang, C. Socially responsible investments: Institutional aspects, performance, and investor behavior. J. Bank. Financ. 2008, 32, 1723–1742. [Google Scholar] [CrossRef]
- Lintner, J. Security Prices, Risk and Maximal Gains from Diversification. J. Financ. 1965, 20, 587–615. [Google Scholar]
- Fama, E.; French, K. Luck versus Skill in the Cross-Section of Mutual Fund Returns. J. Financ. 2010, 65, 1915–1947. [Google Scholar] [CrossRef]


© 2020 by the authors. Licensee MDPI, Basel, Switzerland. This article is an open access article distributed under the terms and conditions of the Creative Commons Attribution (CC BY) license (http://creativecommons.org/licenses/by/4.0/).