Physiologic and Metabolic Changes in Crepidiastrum denticulatum According to Different Energy Levels of UV-B Radiation


Abstract
:1. Introduction
2. Results
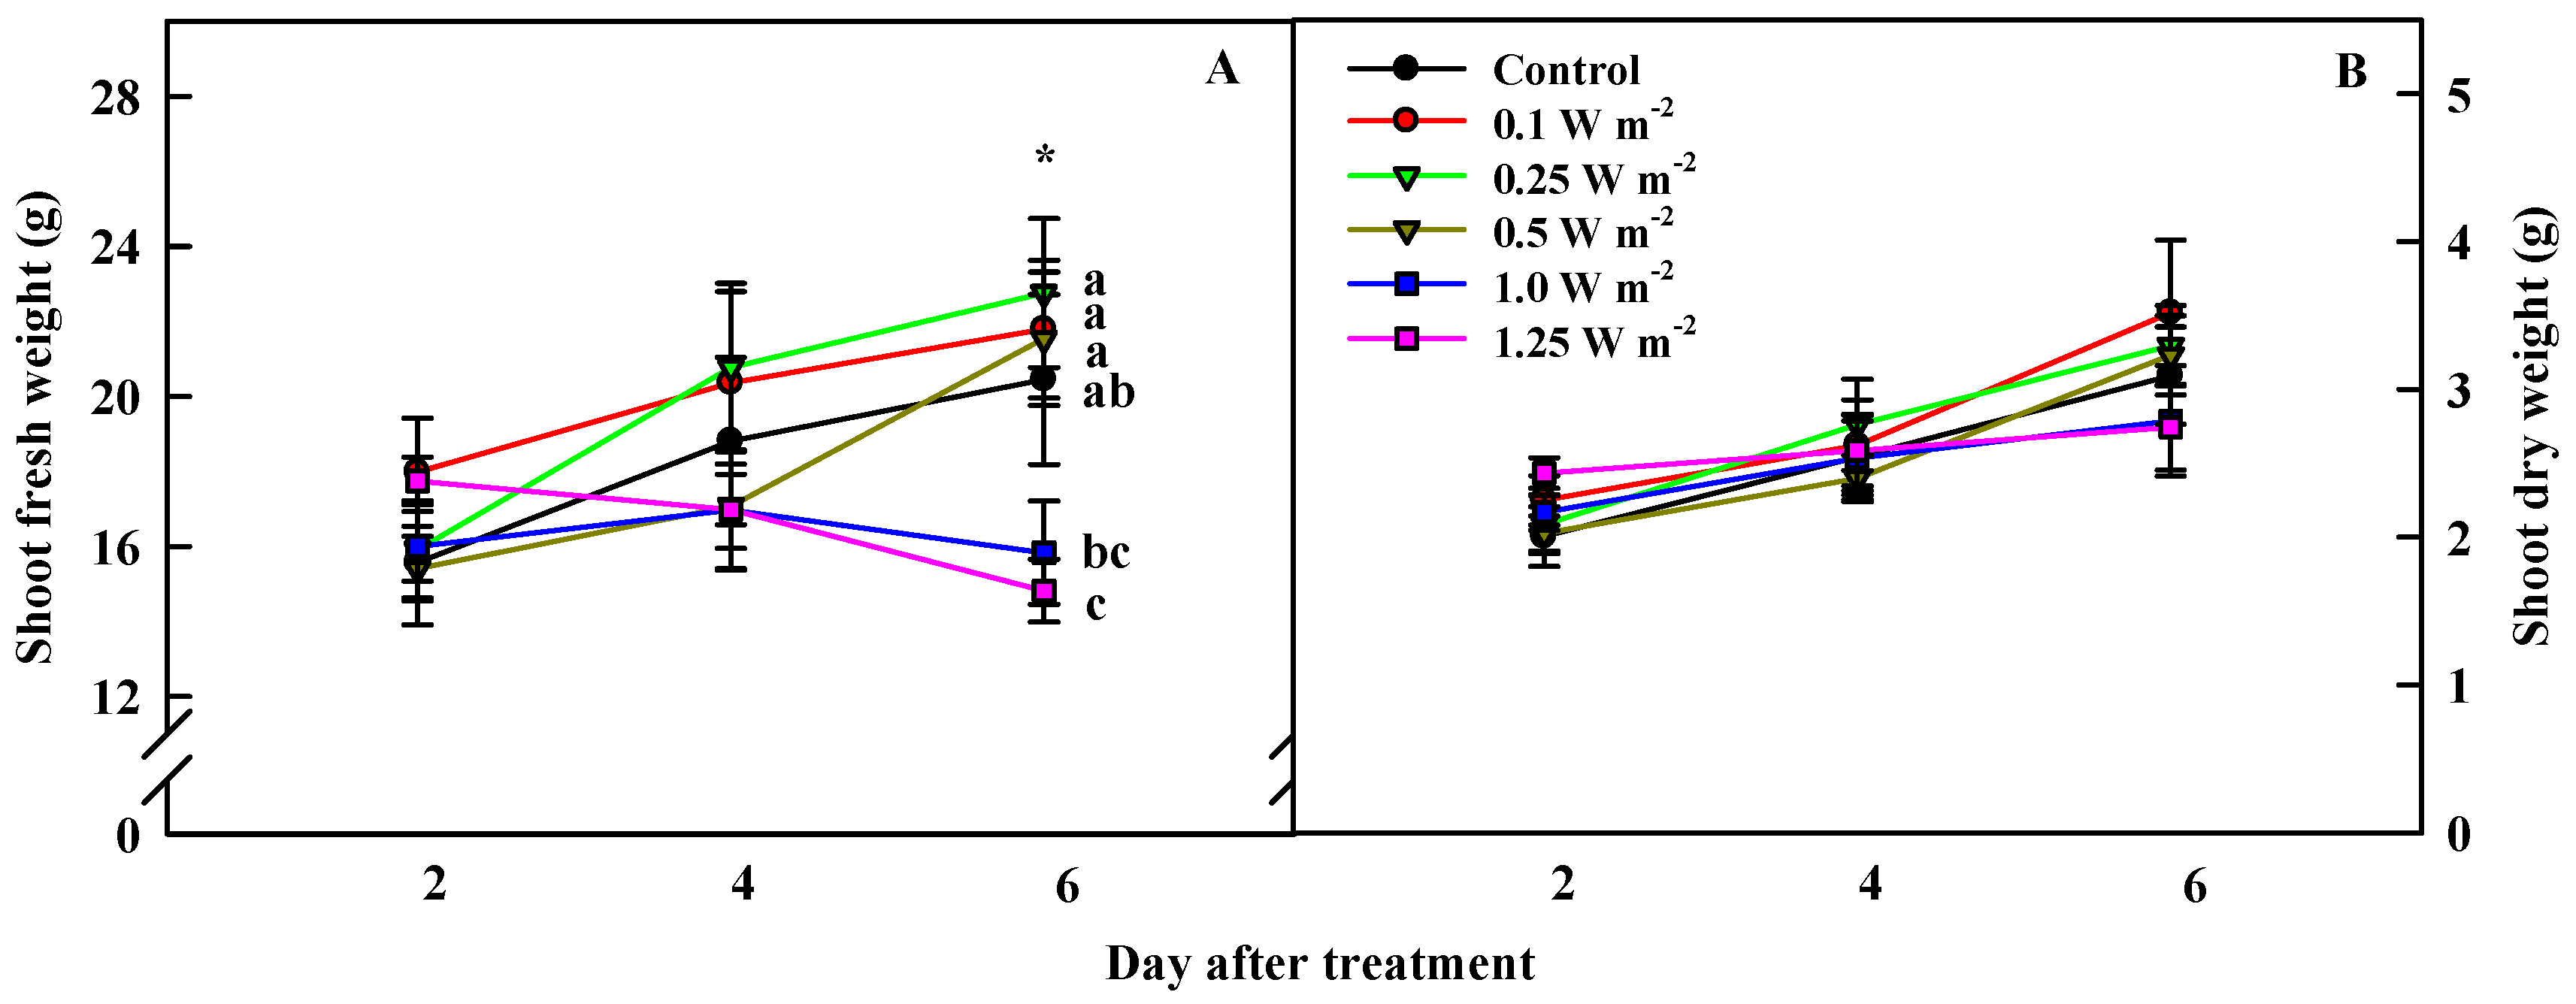
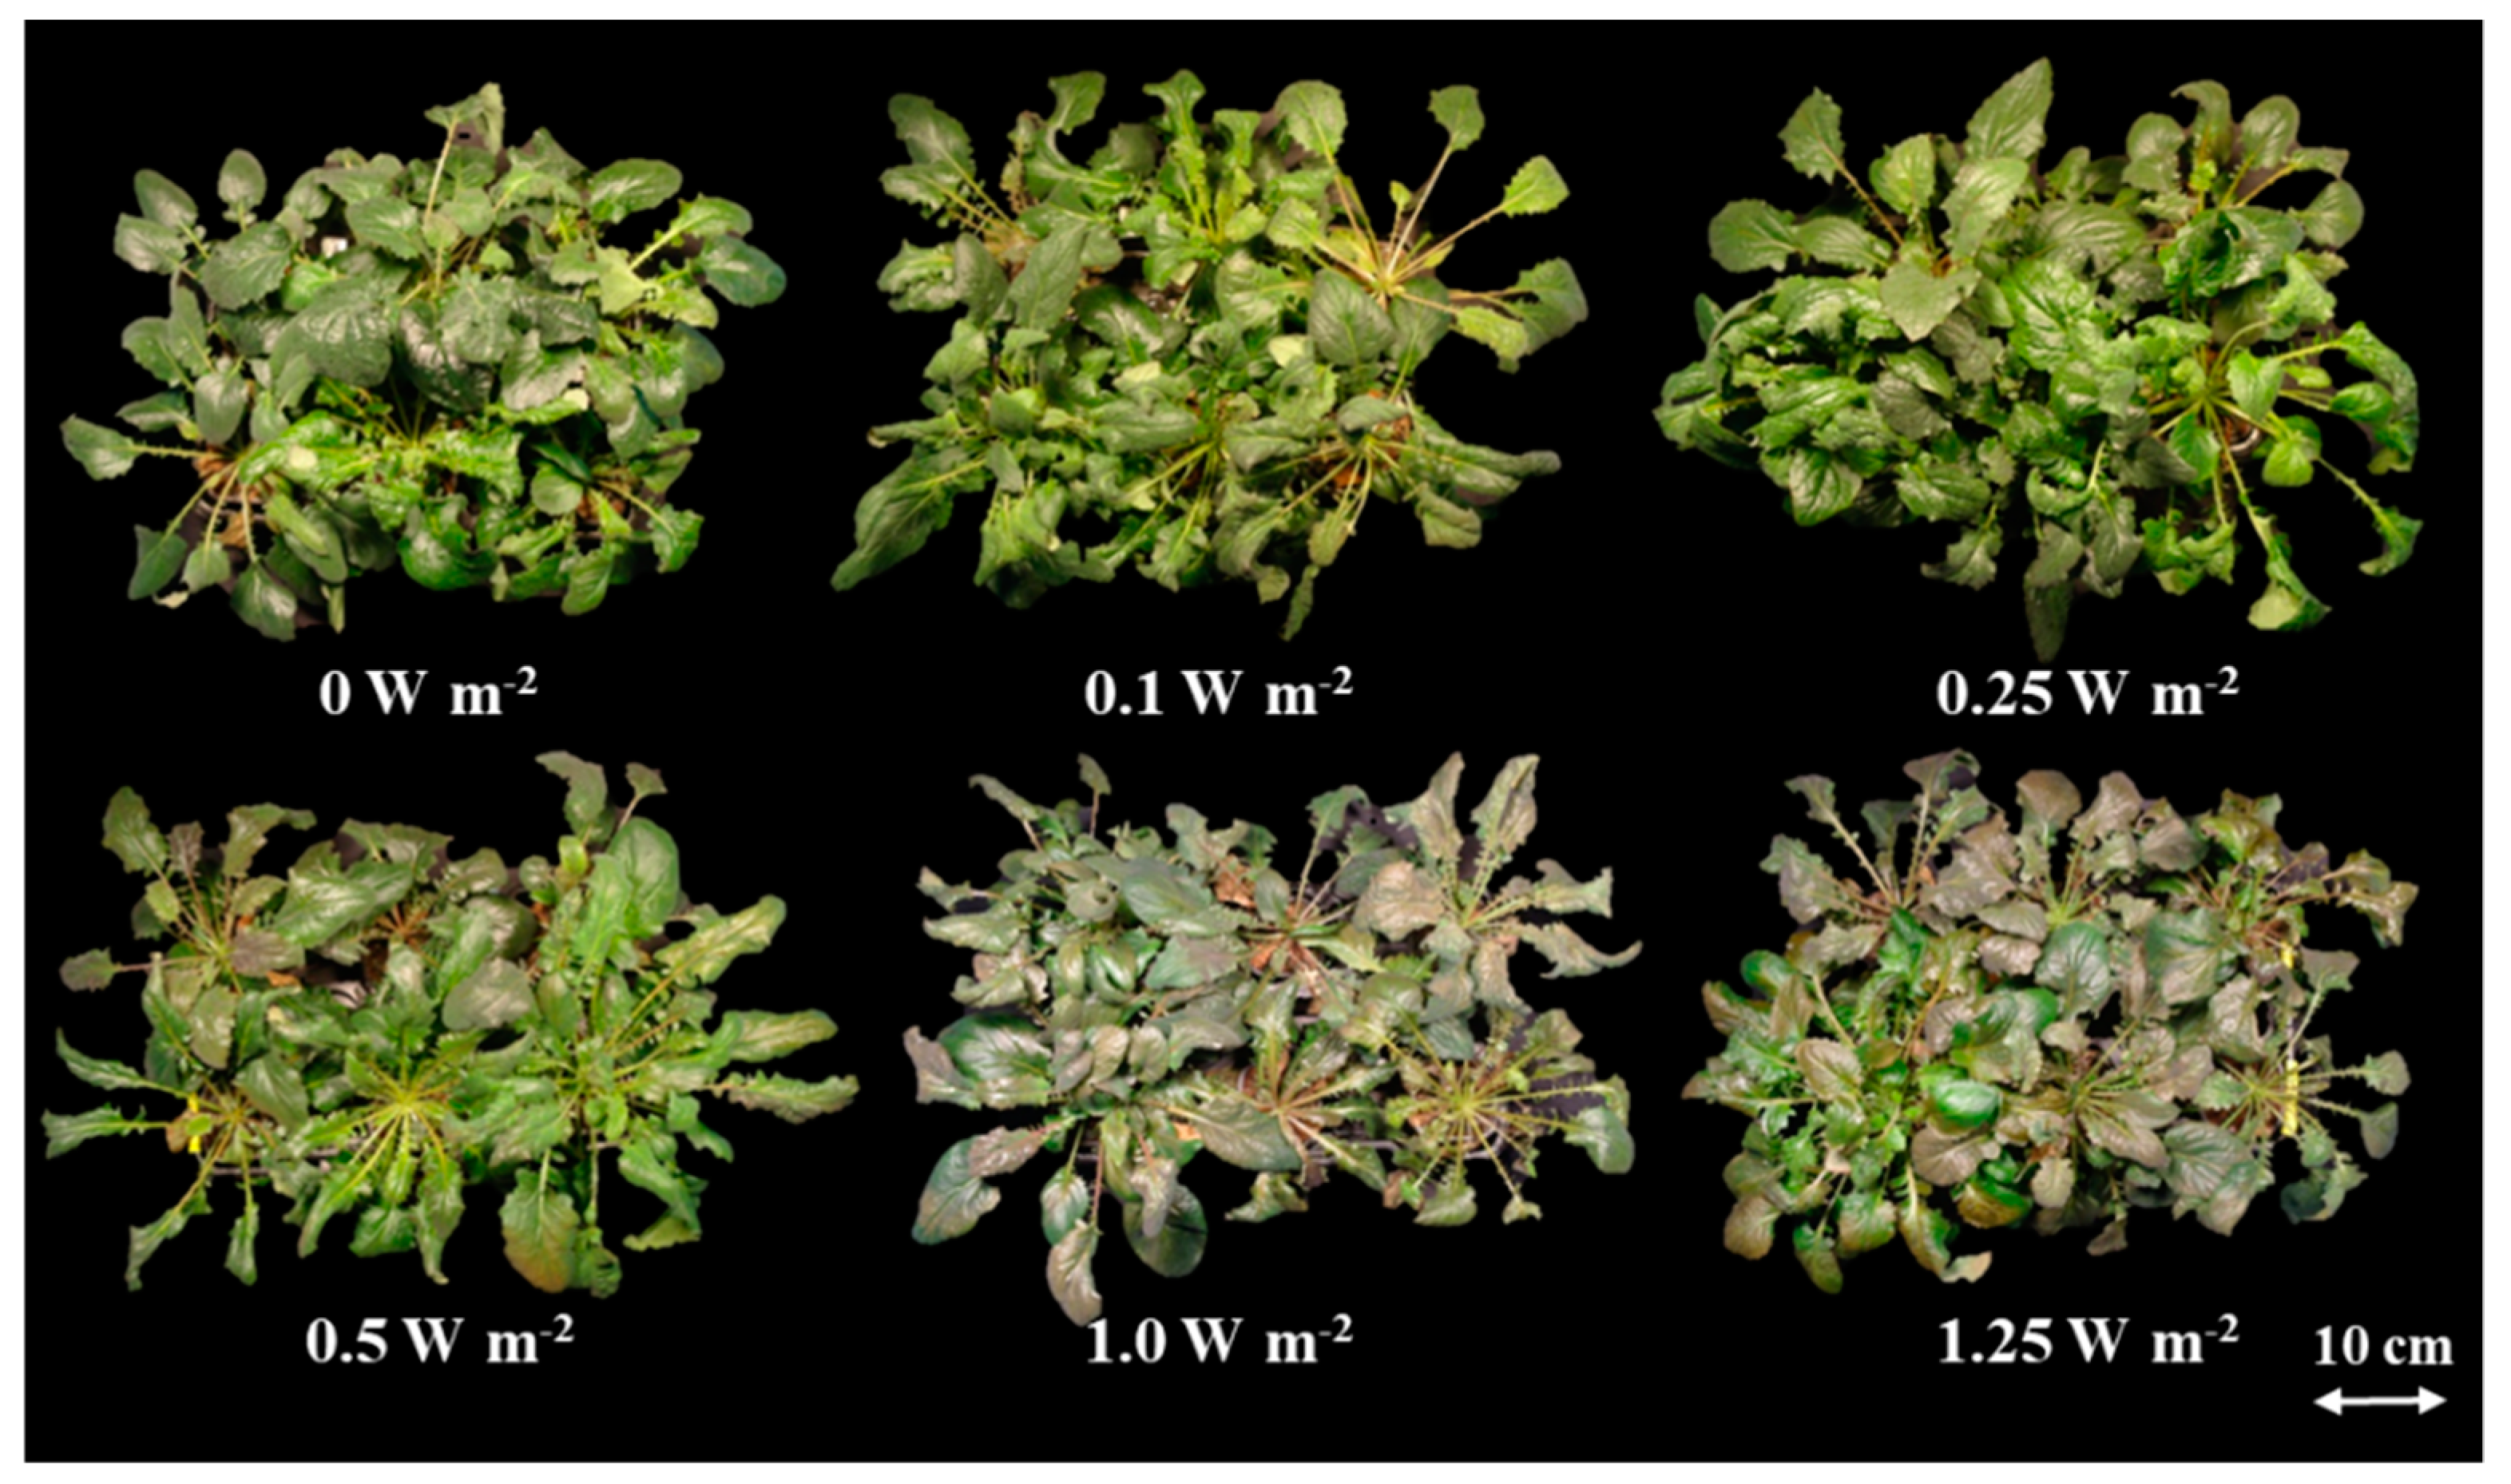
2.1. Shoot Biomass
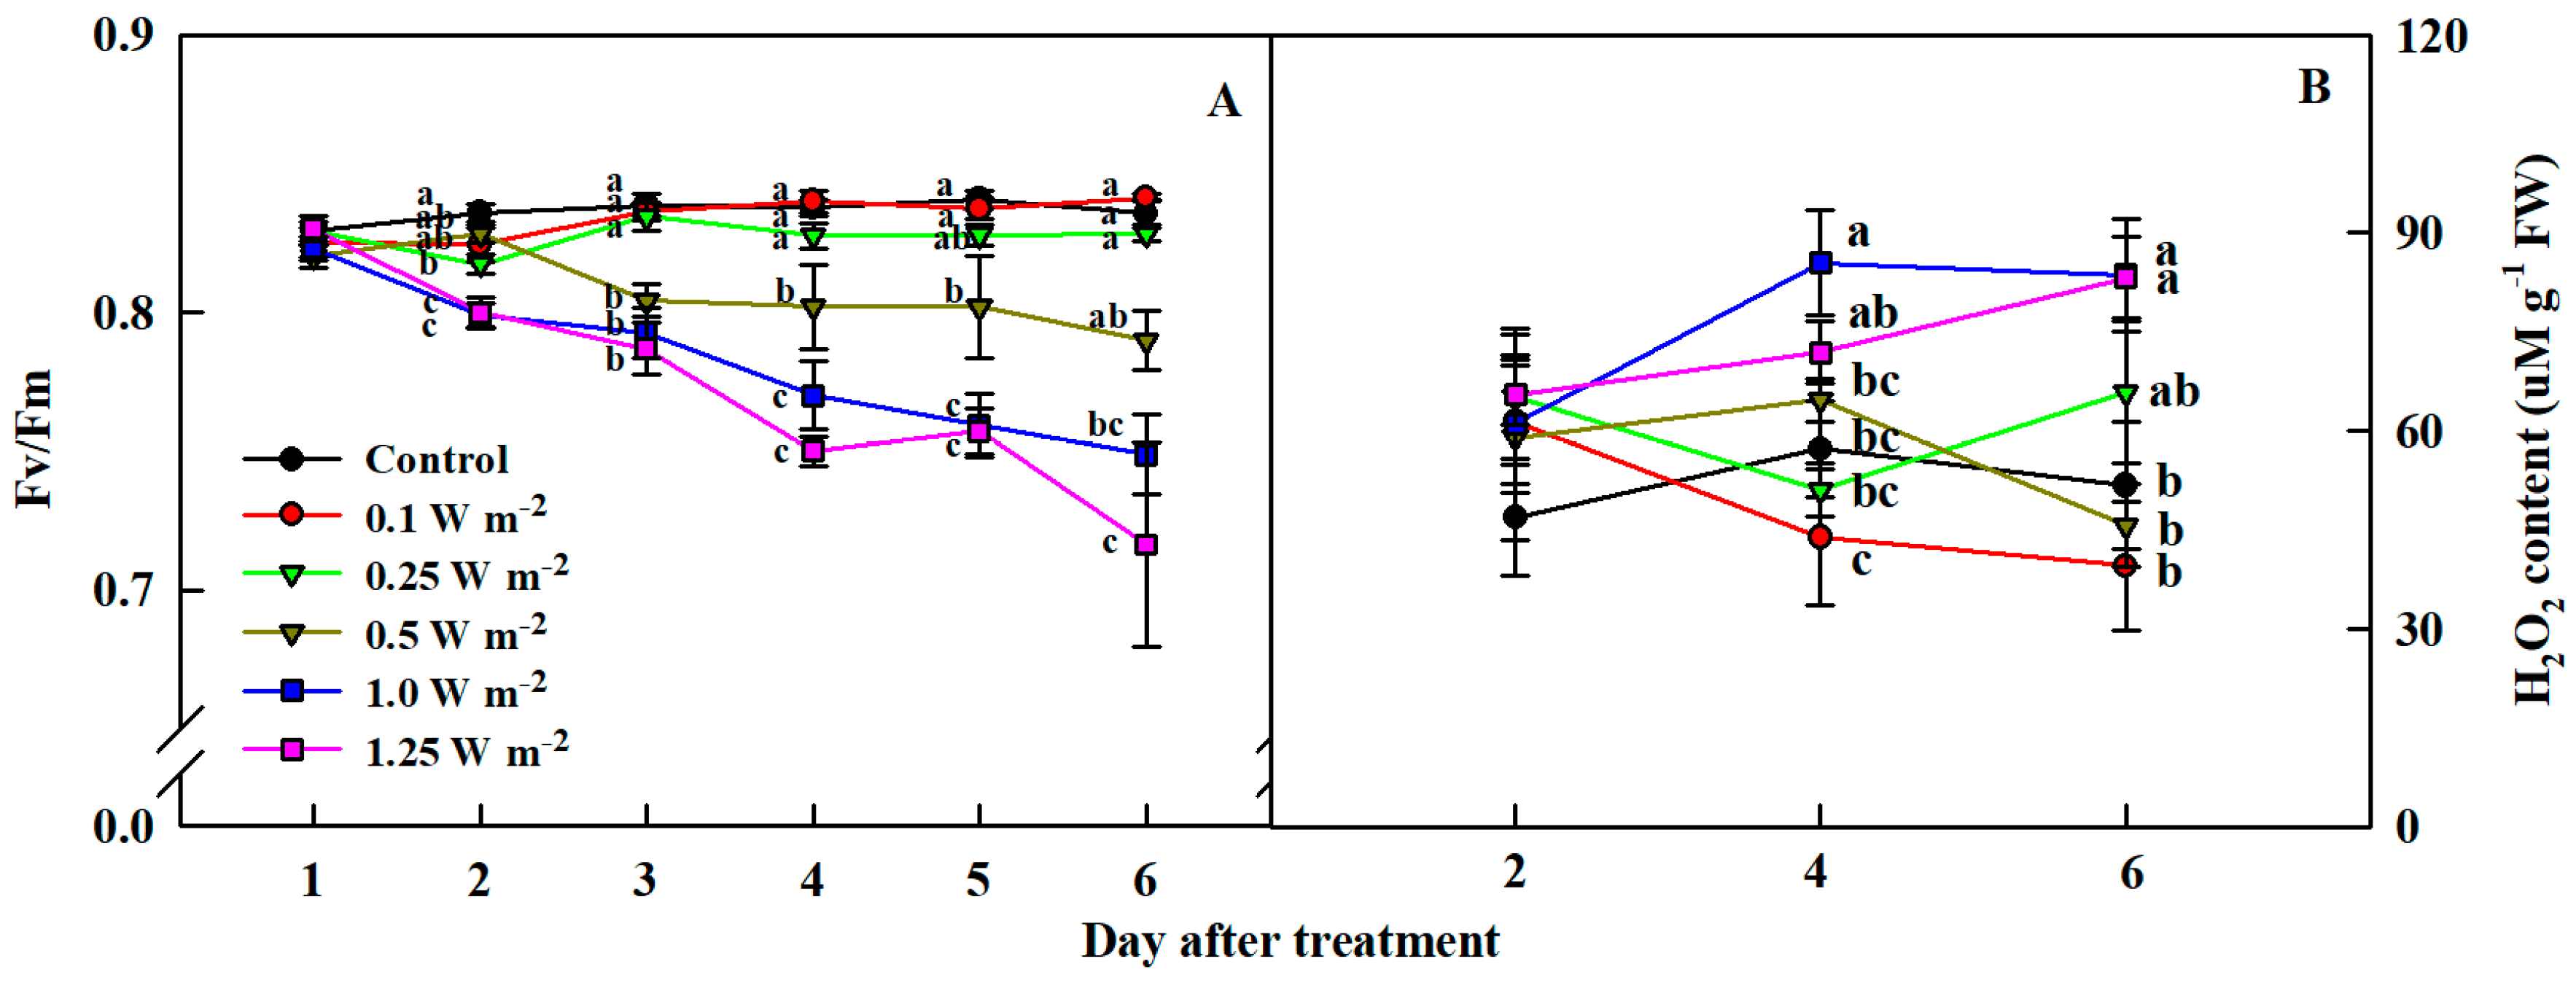
2.2. Maximum Quantum Yield of Photosystem II and H2O2 Content
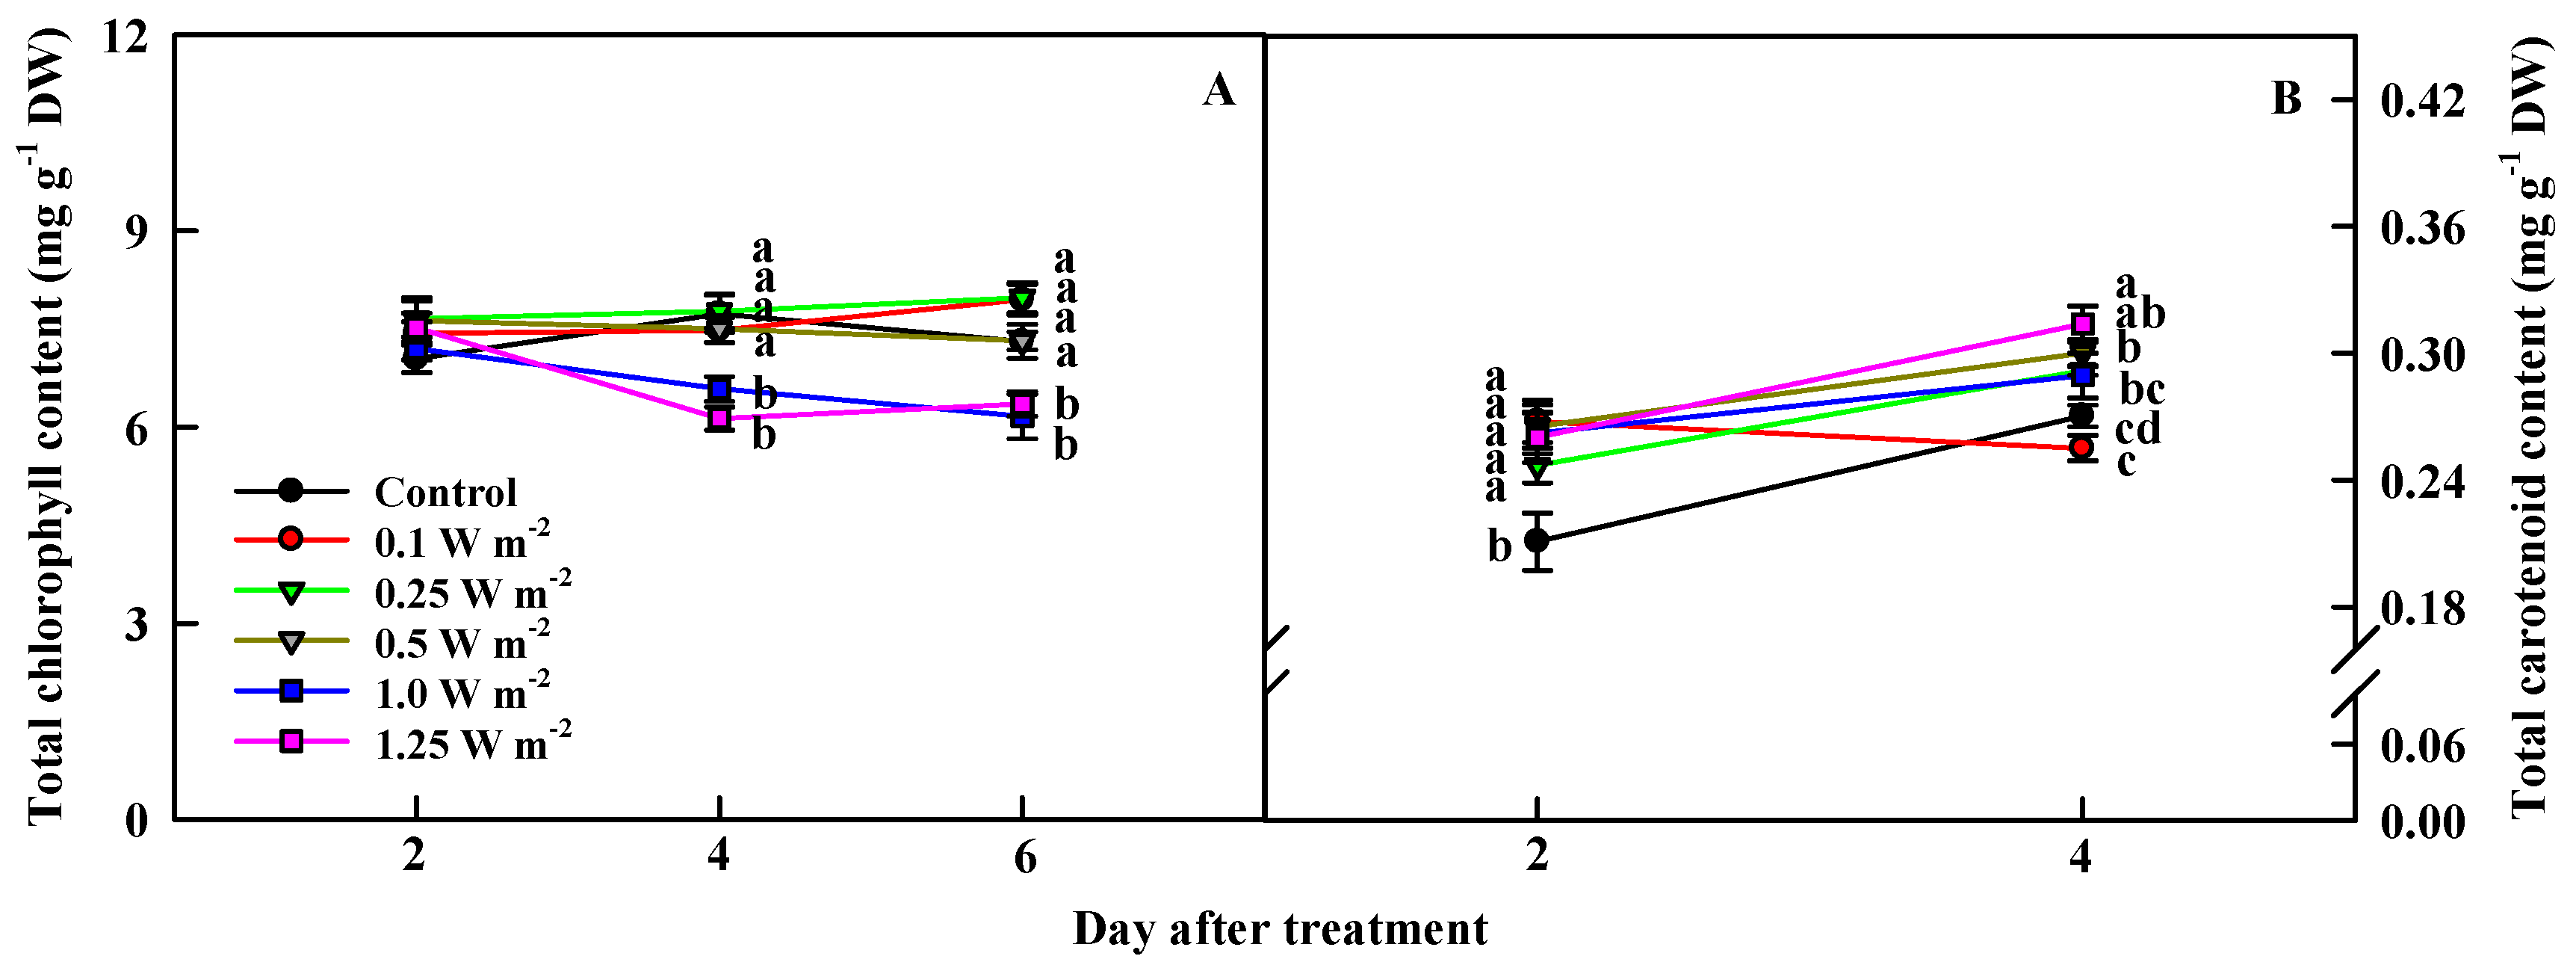
2.3. Total Chlorophyll and Carotenoid Contents
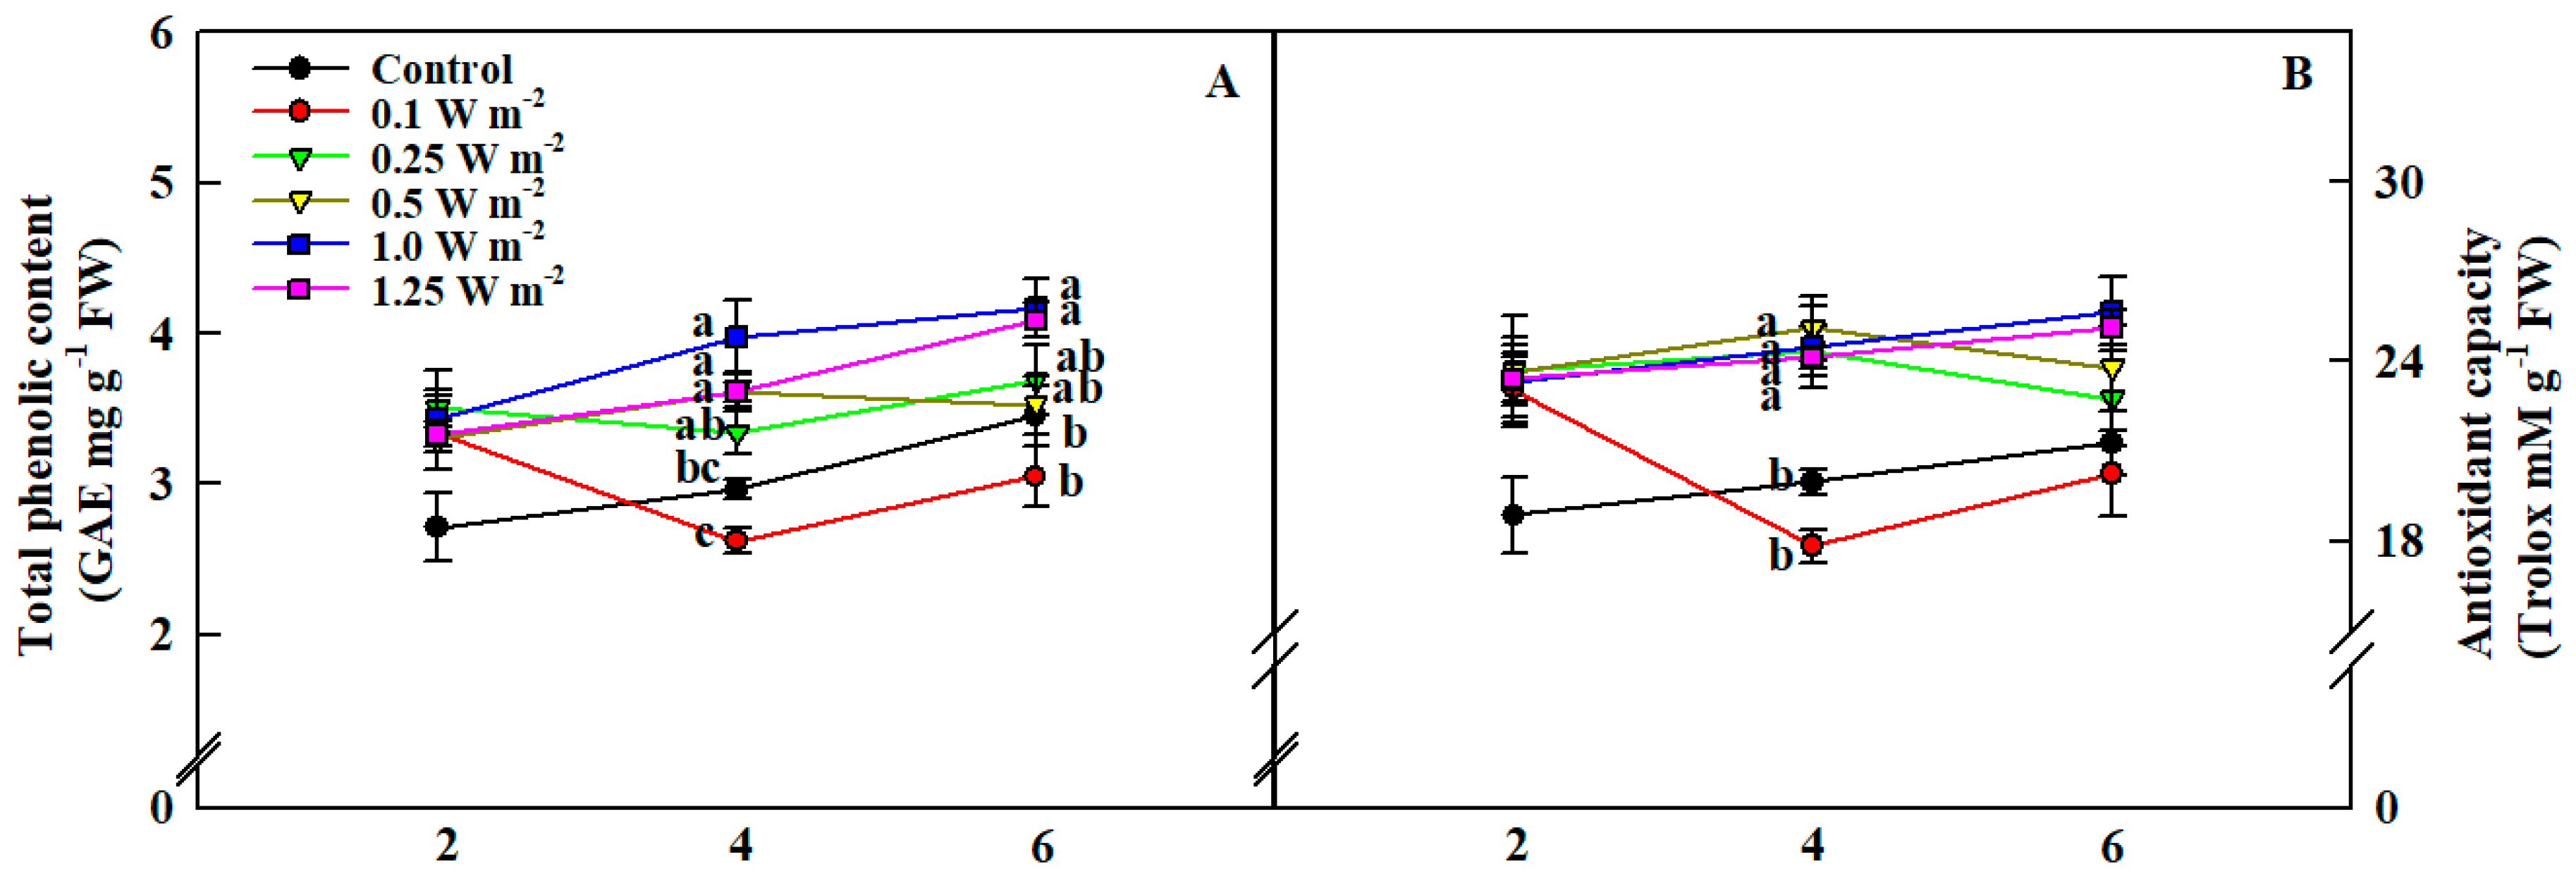
2.4. Total Phenolic Content and Antioxidant Capacity
2.5. Hydroxycinnamic Acids (HCAs)
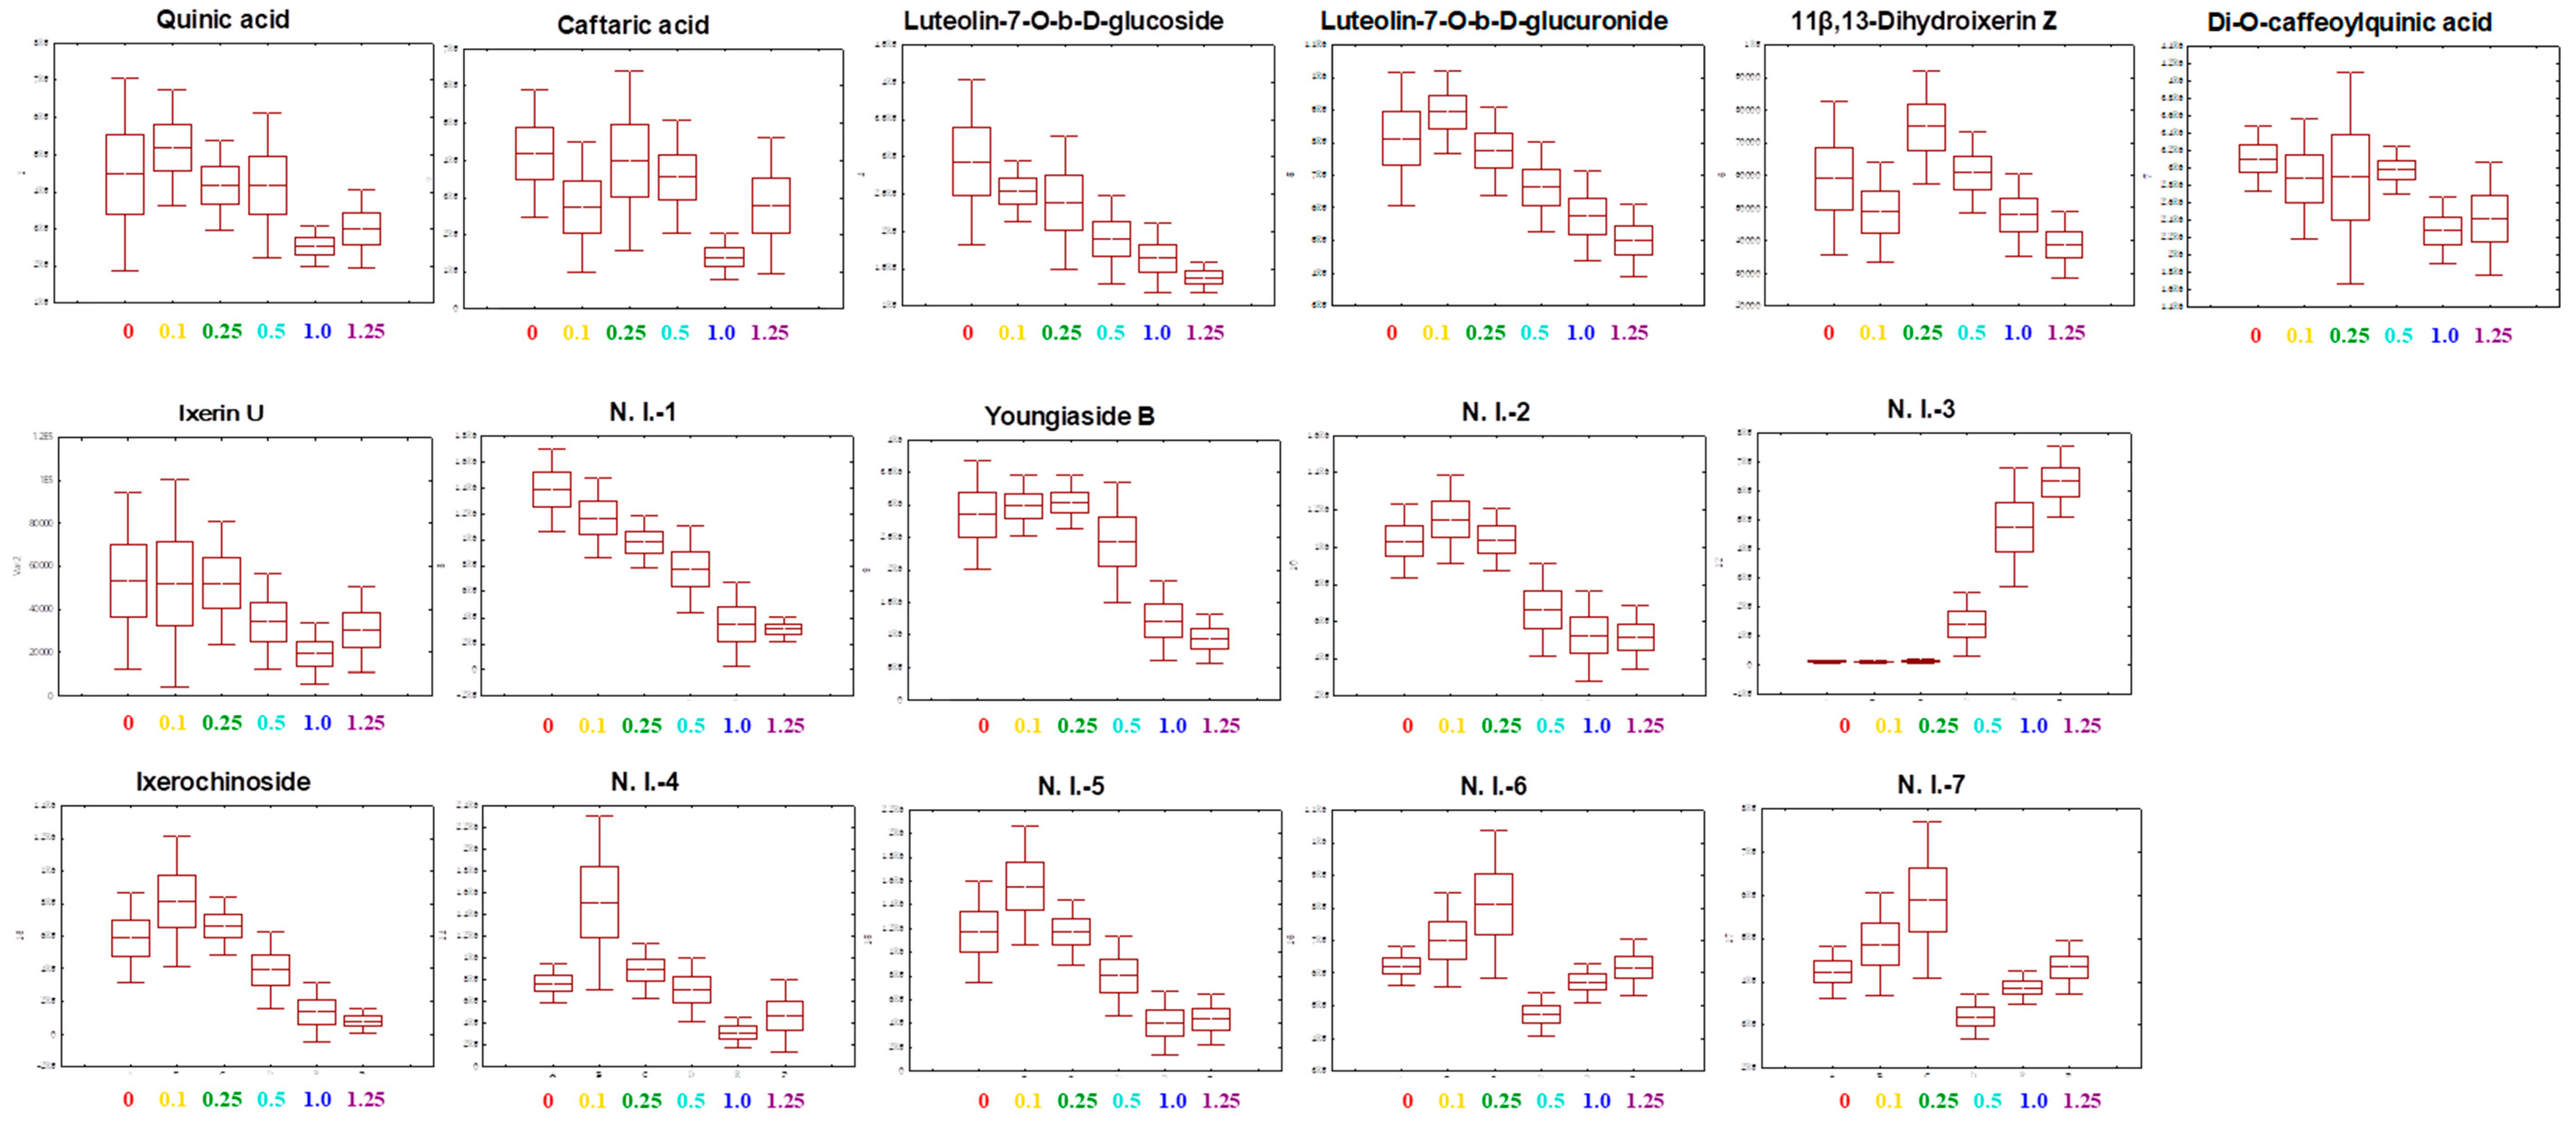
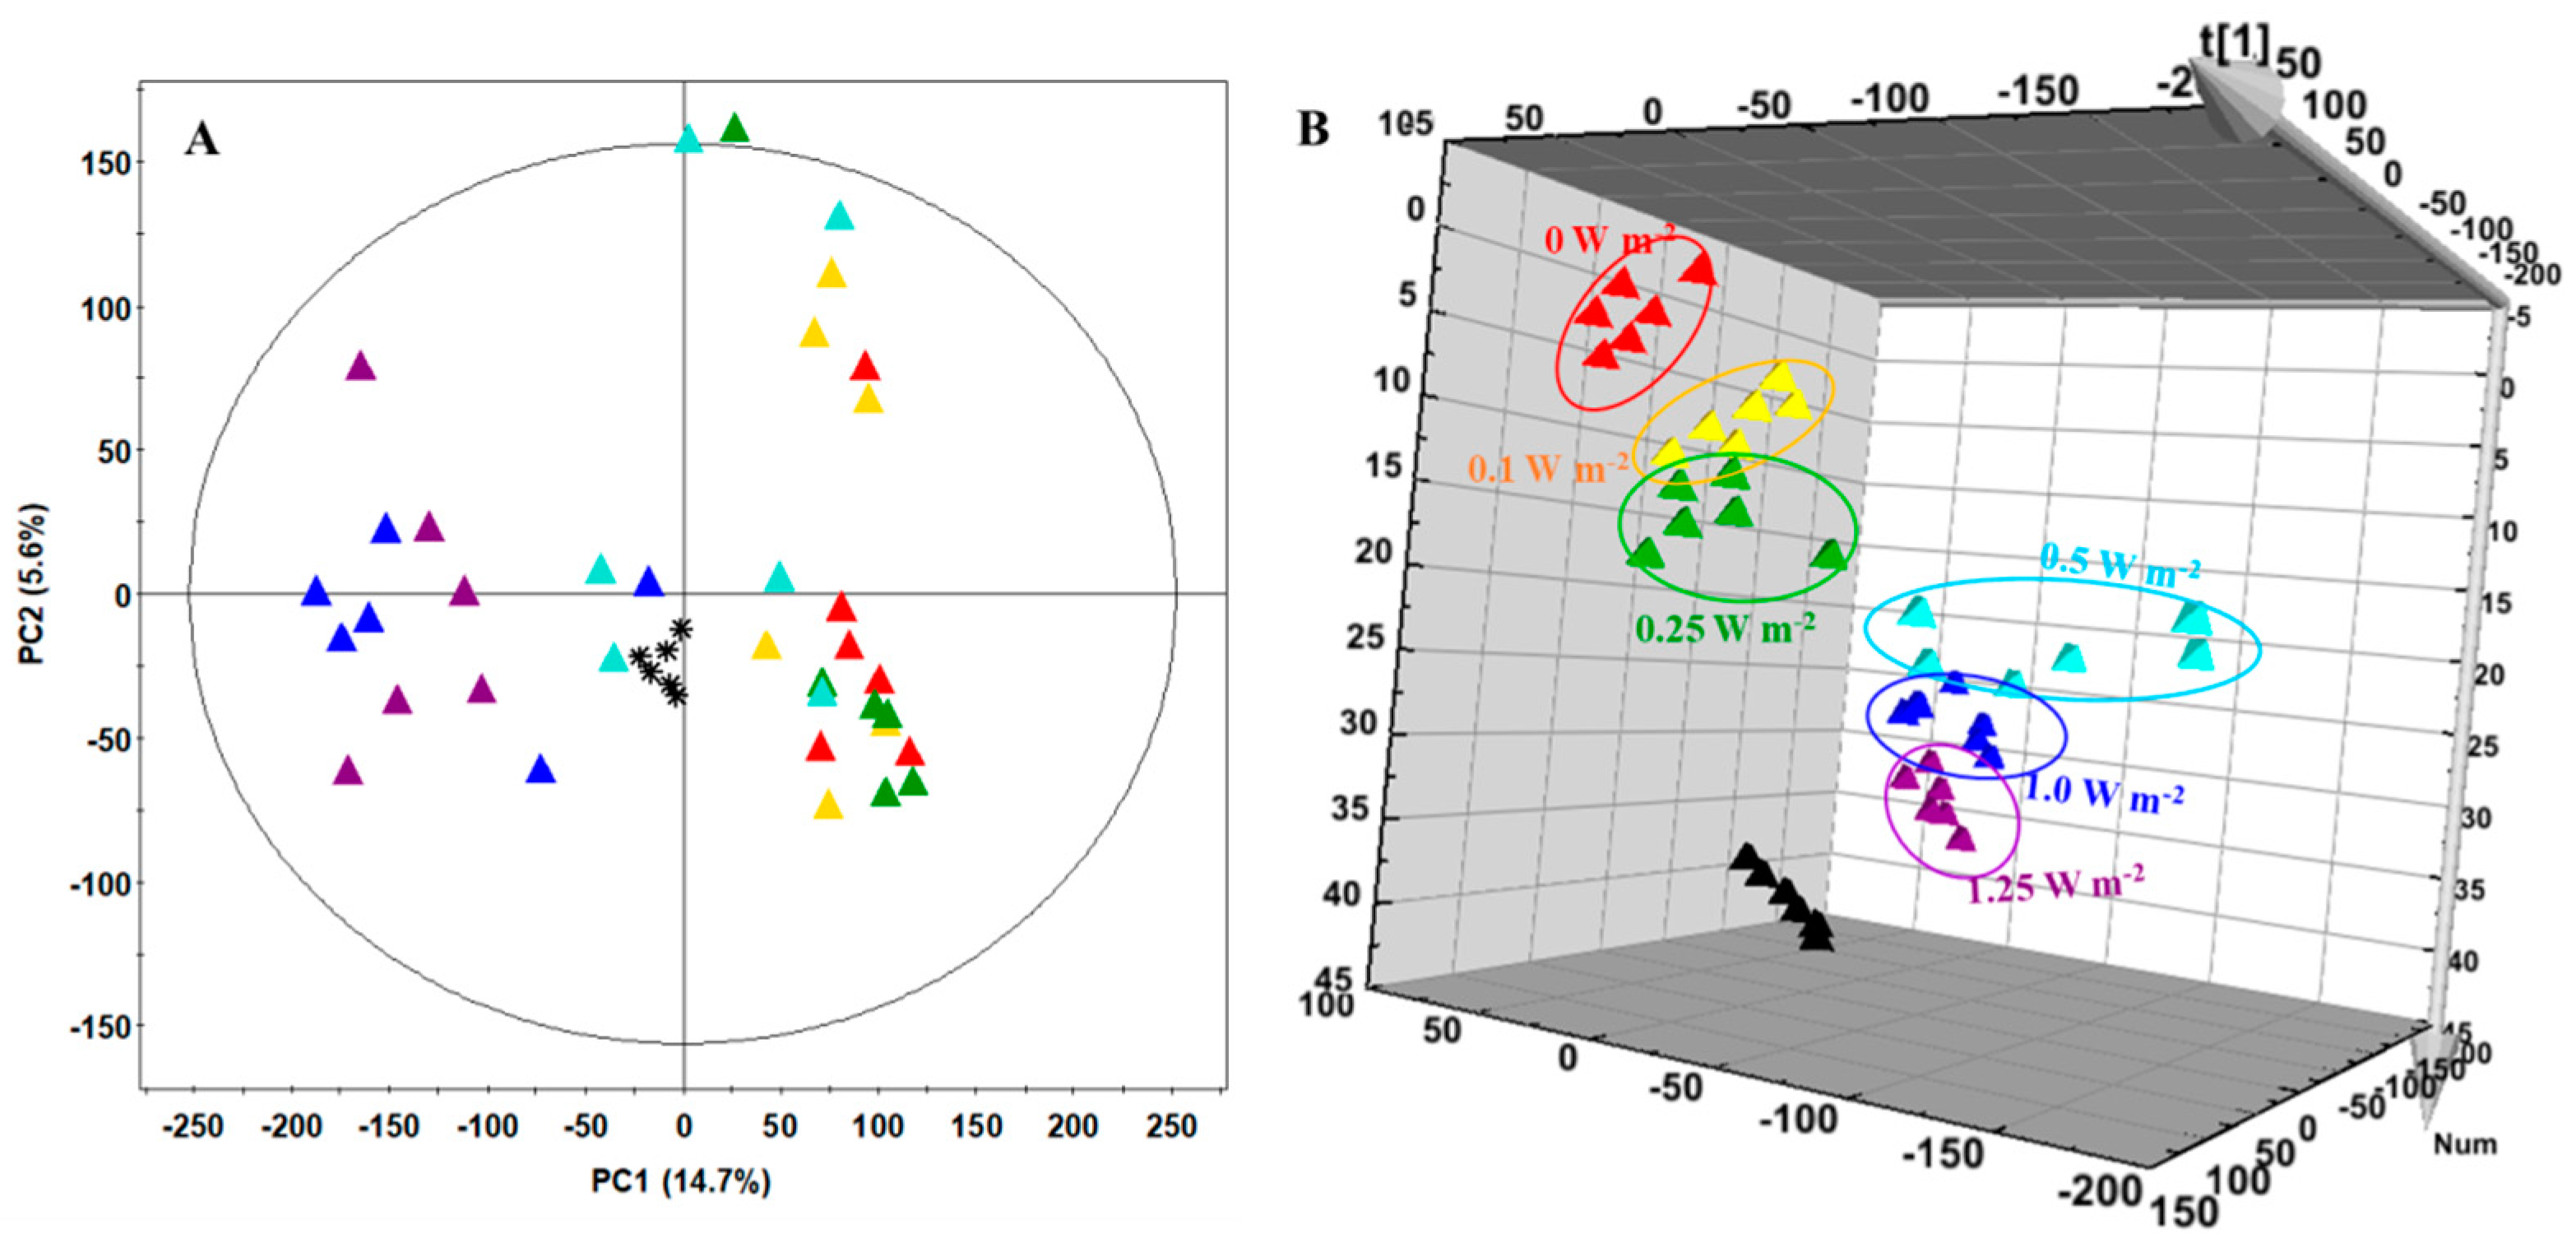
2.6. Metabolite Profiling
3. Discussion
4. Materials and Methods
4.1. Plant Materials and Growth Conditions
4.2. UV-B Treatment
4.3. Shoot Biomass
4.4. Maximum Quantum Yield of Photosystem II (Fv/Fm)
4.5. H2O2 Content
4.6. Total Chlorophyll and Carotenoid Contents
4.7. Total Phenolic Content and Antioxidant Capacity
4.8. Hydroxycinnamic Acids (HCAs)
4.9. Metabolite Extraction
4.10. UHPLC-LTQ-Orbitrap-MS Analysis and Data Processing
4.11. Statistical Analysis
Supplementary Materials
Author Contributions
Funding
Conflicts of Interest
Abbreviations
| HCAs | Total hydroxycinnamic acids |
| PLS-DA | Partial least squares discrimination analysis |
| Fv/Fm | Maximum quantum yield of PSII |
| ROS | Reactive oxygen species |
| UVR8 | UV resistance locus8 |
| C. denticulatum | Crepidiastrum denticulatum |
| PFALs | Plant factories with artificial lighting |
| PSII | Photosystem II |
| 3,5-DCQA | 3,5-di-O-caffeoylquinic acid |
| UHPLC-LTQ-Orbitrap-MS | Ultra high performance liquid chromatography-linear ion trap-Orbitrap mass spectrometer |
| PCA | Principal component analysis |
| MS | Mass spectrometry |
| QC | Quality control |
| NPQ | Non-photochemical quenching |
| QA | Quinone |
| COP1 | CONSTITUTIVELY PHOTOMORPHOGENIC1 |
| HY5 | ELONGATED HYPOCOTYL5 |
| HCTs | Hydroxycinnamoyl transferases |
| PPFD | Photosynthetic photon flux density |
| NSC | Nutrient solution for Crepidiastrum denticulatum |
| Fm | Maximum fluorescence |
| Fo | Minimum fluorescence |
| ANOVA | Analysis of variance |
| TPS | Terpene synthase activity |
References
- Dias, M.C.; Pinto, D.C.; Correia, C.; Moutinho-Pereira, J.; Oliveira, H.; Freitas, H.; Silva, A.M.; Santos, C. UV-B radiation modulates physiology and lipophilic metabolite profile in Olea europaea. J. Plant Physiol. 2018, 222, 39–50. [Google Scholar] [CrossRef]
- Heijde, M.; Ulm, R. UV-B photoreceptor-mediated signalling in plants. Trends Plant Sci. 2012, 17, 1360–1385. [Google Scholar] [CrossRef] [PubMed]
- Sen, J.; Jiang, C.Q.; Yan, Y.E.; Liu, B.R.; Zu, C.L. Effect of increased UV-B radiation on carotenoid accumulation and total antioxidant capacity in tobacco (Nicotiana tabacum L.) leaves. Genet. Mol. Res. 2017, 16, 16018438. [Google Scholar]
- Takshak, S.; Agrawal, S. Defense potential of secondary metabolites in medicinal plants under UV-B stress. J. Photochem. Photobiol. B 2019, 193, 51–88. [Google Scholar] [CrossRef] [PubMed]
- Ana, L.E.; Silva, F.M.D.O.; Acevedo, P.; Nunes-Nesi, A.; Alberdi, M.; Reyes-Díaz, M. Different levels of UV-B resistance in Vaccinium corymbosum cultivars reveal distinct backgrounds of phenylpropanoid metabolites. Plant Physiol. Biochem. 2017, 118, 541–550. [Google Scholar]
- Hamidi-Moghadda, A.; Arouiee, H.; Moshtaghi, N.; Azizi, M.; Shoor, M.; Sefidkon, F. Visual quality and morphological responses of rosemary plants to UV-B radiation and salinity stress. J. Ecol. Eng. 2019, 20, 34–43. [Google Scholar] [CrossRef]
- Morales, L.O.; Brosche, M.; Vainonen, J.P.; Sipart, N.; Lindfors, A.V.; Strid, A.; Aphalo, P.J. Are solar UV-B- and UV-A-dependent gene expression and metabolite accumulation in Arabidopsis mediated by the stress response regulator RADICAL-INDUCED CELL DEATH1? Plant Cell Environ. 2015, 38, 878–891. [Google Scholar] [CrossRef]
- Choudhury, F.K.; Rivero, R.M.; Blumwald, E.; Mittler, R. Reactive oxygen species, abiotic stress and stress combination. Plant J. 2017, 90, 856–867. [Google Scholar] [CrossRef]
- Hideg, E.; Jansen, M.A.K.; Strid, A. UV-B exposure, ROS, and stress: Inseparable companions or loosely linked associates? Trends Plant Sci. 2013, 18, 1360–1385. [Google Scholar] [CrossRef] [Green Version]
- Höll, J.; Linder, S.; Walter, H.; Joshi, D.; Poshcet, G.; Pfleger, S.; Ziegler, T.; Hell, R.; Bogs, J.; Rauch, T. Impact of pulsed UV-B stress exposure on plant performance: How recovery periods stimulate secondary metabolism while reducing adaptive growth attenuation. Plant Cell Environ. 2019, 42, 801–814. [Google Scholar] [CrossRef]
- Calvenzani, V.; Castagna, A.; Ranieri, A.; Tonelli, C. Hydroxycinnamic acids and UV-B depletion: Profiling and biosynthetic gene expression in flesh and peel of wild-type and hp-1. J. Plant Physiol. 2015, 181, 75–82. [Google Scholar] [CrossRef] [PubMed]
- Kumari, R.; Prasad, M.N.V. Medicinal plant active compounds produced by UV-B exposure. In Sustainable Agriculture Reviews; Lichtfouse, E., Ed.; Springer: Dordrecht, The Netherlands, 2013; Volume 12, pp. 225–254. [Google Scholar]
- Takshak, S.; Agrawal, S. Defence strategies adopted by the medicinal plant Coleus forskohlii against supplemental ultraviolet-B radiation: Augmentation of secondary metabolites and antioxidants. Plant Physiol. Biochem. 2015, 97, 124–138. [Google Scholar] [CrossRef] [PubMed]
- Brechner, M.L.; Albright, L.D.; Weston, L.A. Effects of UV-B on secondary metabolites of St. John’s wort (Hypericum perforatum L.) grown in controlled environments. Photochem. Photobiol. 2011, 87, 680–684. [Google Scholar] [CrossRef]
- Manukyan, A. Effects of PAR and UV-B radiation on herbal yield, bioactive compounds and their antioxidant capacity of some medicinal plants under controlled environmental conditions. Photochem. Photobiol. 2013, 89, 406–414. [Google Scholar] [CrossRef] [PubMed]
- Pandey, N.; Pandey-Rai, S. Short term UV-B radiation-mediated transcriptional responses and altered secondary metabolism of in vitro propagated plantlets of Artemisia annua L. Plant Cell Tissue Organ Cult. 2014, 116, 371–385. [Google Scholar] [CrossRef]
- Sakalauskaitė, J.; Viskelis, P.; Dambrauskienė, E.; Sakalauskienė, S.; Samuolienė, G.; Brazaitytė, A.; Duchovskis, P.; Urbonavičienė, D. The effects of different UV-B radiation intensities on morphological and biochemical characteristics in Ocimum basilicum L. J. Sci. Food Agric. 2013, 93, 1266–1271. [Google Scholar] [CrossRef]
- Mocan, A.; Zengin, G.; Simirgiotis, M.; Schafberg, M.; Mollica, A.; Vodnar, D.C.; Crişan, G.; Rohn, S. Functional constituents of wild and cultivated Goji (L. barbarum L.) leaves: Phytochemical characterization, biological profile, and computational studies. J. Enzym. Inhib. Med. Chem. 2017, 32, 153–168. [Google Scholar] [CrossRef] [Green Version]
- Lubbe, A.; Verpoorte, R. Cultivation of medicinal and aromatic plants for specialty industrial materials. Ind. Crop Prod. 2011, 34, 785–801. [Google Scholar] [CrossRef]
- Patil, K.D.; Bagade, S.B.; Sharma, S.R.; Hatware, K.V. Potential of herbal constituents as new natural leads against helminthiasis: A neglected tropical disease. Asian Pac. J. Trop. Med. 2019, 12, 291–299. [Google Scholar]
- Market Research Future. Herbal Medicine Market Research Report Forecast to 2023. Available online: www.marketresearchfuture.com/reports/herbal-medicine-market-3250 (accessed on 22 June 2020).
- Ahn, H.R.; Lee, H.J.; Kim, K.; Kim, C.Y.; Nho, C.W.; Jang, H.; Pan, C.; Lee, C.Y.; Jung, S.H. Hydroxycinnamic acids in Crepidiastrum denticulatum protect oxidative stress-induced retinal damage. J. Agric. Food Chem. 2014, 62, 1310–1323. [Google Scholar] [CrossRef]
- Lee, H.J.; Cha, K.H.; Kim, C.Y.; Nho, C.W.; Pan, C. Bioavailability of hydroxycinnamic acids from Crepidiastrum denticulatum using simulated digestion and Caco-2 intestinal cells. J. Agric. Food Chem. 2014, 62, 5290–5295. [Google Scholar] [CrossRef]
- Park, S.Y.; Oh, S.B.; Kim, S.M.; Cho, Y.Y.; Oh, M.M. Evaluating the effects of a newly developed nutrient solution on growth, antioxidants, and chicoric acid contents in Crepidiastrum denticulatum. Hortic. Environ. Biotechnol. 2016, 57, 478–486. [Google Scholar] [CrossRef]
- Yoo, J.; Kang, K.; Yun, J.H.; Kim, M.A.; Nho, C.W. Crepidiastrum denticulatum extract protects the liver against chronic alcohol-induced damage and fat accumulation in rats. J. Med. Food 2014, 17, 432–438. [Google Scholar] [CrossRef] [PubMed] [Green Version]
- Das, M.; Jain, V.; Malhotra, S.K. Impact of climate change on medicinal and aromatic plants: Review. Indian J. Agric. Sci. 2016, 86, 1375–1382. [Google Scholar]
- Gairola, S.; Shariff, N.M.; Bhatt, A.; Kala, C.P. Influence of climate change on production of secondary chemicals in high altitude medicinal plants: Issues needs immediate attention. J. Med. Plants Res. 2010, 4, 1825–1829. [Google Scholar]
- Reddy, K.R.; Patro, H.; Lokhande, S.; Bellaloui, N.; Gao, W. Ultraviolet-B radiation alters soybean growth and seed quality. Food Nutr. Sci. 2016, 7, 55–66. [Google Scholar] [CrossRef] [Green Version]
- Karvansara, P.R.; Razavi, S.M. Physiological and biochemical responses of sugar beet (Beta vulgaris L) to ultraviolet-B radiation. Peer J. 2019, 7, e6790. [Google Scholar] [CrossRef]
- Mosadegh, H.; Trivellini, A.; Ferrante, A.; Lucchesini, M.; Vernieri, P.; Mensuali, A. Applications of UV-B lighting to enhance phenolic accumulation of sweet basil. Sci. Hortic. 2018, 229, 107–116. [Google Scholar] [CrossRef]
- Reyes, T.H.; Scartazza, A.; Pompeiano, A.; Guglielminetti, L. Physiological responses of Lepidium meyenii plants to ultraviolet-B radiation challenge. BMC Plant Biol. 2019, 19, 186. [Google Scholar]
- Vandenbussche, F.; Yu, N.; Li, W.; Vanhaelewyn, L.; Hamshou, M.; Straeten, D.V.D.; Smagghe, G. An ultraviolet B condition that affects growth and defense in Arabidopsis. Plant Sci. 2018, 268, 54–63. [Google Scholar] [CrossRef]
- Yadav, G.; Srivastava, P.K.; Parihar, P.; Tiwari, S.; Prasad, S.M. Oxygen toxicity and antioxidative responses in arsenic stressed Helianthus annuus L. seedlings against UV-B. J. Photochem. Photobiol. B Biol. 2016, 165, 58–70. [Google Scholar] [CrossRef] [PubMed]
- Santos, I.; Fidalgo, F.; Almeida, J.M.; Salema, R. Biochemical and ultrastructural changes in leaves of potato plants grown under supplementary UV-B radiation. Plant Sci. 2004, 167, 925–935. [Google Scholar] [CrossRef]
- Burchard, P.; Bilger, W.; Weissenbock, G. Contribution of hydroxycinnamates and flavonoids to epidermal shielding of UV-A and UV-B radiation in developing rye primary leaves as assessed by ultraviolet-induced chlorophyll fluorescence measurements. Plant Cell Environ. 2000, 23, 1373–1380. [Google Scholar] [CrossRef]
- Smith, J.L.; Burritt, D.J.; Bannister, P. Shoot dry weight, chlorophyll and UV-B-absorbing compounds as indicators of a plant’s sensitivity to UV-B radiation. Ann. Bot. 2000, 86, 1057–1063. [Google Scholar] [CrossRef]
- Zlatev, Z.S.; Lidon, F.J.C.; Kaimakanova, M. Plant physiological responses to UV-B radiation. Emir. J. Food Agric. 2012, 24, 481–501. [Google Scholar] [CrossRef]
- Neugart, S.; Fiol, M.; Schreiner, M.; Rohn, S.; Zrenner, R.; Kroh, L.W.; Krumbein, A. Interaction of moderate UV-B exposure and temperature on the formation of structurally different flavonol glycosides and hydroxycinnamic acid derivatives in kale (Brassica oleracea var. sabellica). J. Agric. Food Chem. 2014, 62, 4054–4062. [Google Scholar] [CrossRef]
- Gangappa, S.N.; Botto, J.F. The multifaceted roles of HY5 in plant growth and development. Mol. Plant 2016, 9, 1353–1365. [Google Scholar] [CrossRef] [Green Version]
- Liu, H.; Cao, X.; Liu, X.; Xin, R.; Wang, J.; Gao, J.; Wu, B.; Gao, L.; Xu, C.; Zhang, B.; et al. UV-B irradiation differentially regulates terpene synthases and terpene content of peach. Plant Cell Environ. 2017, 40, 2261–2275. [Google Scholar] [CrossRef]
- Gil, M.; Pontin, M.; Berli, F.; Bottini, R.; Piccoli, P. Metabolism of terpenes in the response of grape (Vitis vinifera L.) leaf tissues to UV-B radiation. Phytochemistry 2012, 77, 89–98. [Google Scholar] [CrossRef]
- Calogirou, A.; Larsen, B.R.; Kotzia, D. Gas-phase terpene oxidation products: A review. Atmos. Environ. 1999, 33, 1423–1439. [Google Scholar] [CrossRef]
- Porra, R.J.; Thompson, W.A.; Kriedemann, P.E. Determination of accurate extinction coefficients and simultaneous equations for assaying chlorophylls a and b extracted with four different solvents: Verification of the concentration of chlorophyll standards by atomic absorption spectroscopy. Biochim. Biophys. Acta Bioenerg. 1989, 975, 384–394. [Google Scholar] [CrossRef]
- Sumanta, N.; Haque, C.I.; Nishika, J.; Suprakash, R. Spectrophotometric analysis of chlorophylls and carotenoids from commonly grown fern species by using various extracting solvents. Res. J. Chem. Sci. 2014, 4, 63–69. [Google Scholar]
- Ainsworth, E.A.; Gillespie, K.M. Estimation of total phenolic content and other oxidation substrates in plant tissues using Folin-Ciocalteu reagent. Nat. Protoc. 2007, 2, 875–877. [Google Scholar] [CrossRef] [PubMed]
- Miller, N.J.; Rice-Evans, C.A. Spectrophotometric determination of antioxidant activity. Redox Rep. 1996, 2, 161–171. [Google Scholar] [CrossRef] [PubMed]
- Park, S.A.; Son, S.Y.; Lee, A.Y.; Park, H.G.; Lee, W.L.; Lee, C.H. Metabolite profiling revealed that a gardening activity program improves cognitive ability correlated with BDNF levels and serotonin metabolism in the elderly. Int. J. Environ. Res. Public Health 2020, 17, 541. [Google Scholar] [CrossRef] [Green Version]


| Day of Treatment | UV-B Treatment (W m−2) | Caftaric Acid | Chicoric Acid | 3,5-DCQA | Chlorogenic Acid | Caffeic Acid | Total HCAs |
|---|---|---|---|---|---|---|---|
| mg shoot−1 | |||||||
| 2 | 0 | 94 | 27.3 | 24.8 | 10.9 | 0.16 c 1 | 157 b |
| 0.1 | 100 | 29.8 | 23.0 | 12.7 | 0.26 bc | 166 b | |
| 0.25 | 94 | 27.1 | 23.1 | 11.0 | 0.29 ab | 156 b | |
| 0.5 | 89 | 26.3 | 23.5 | 11.8 | 0.21 bc | 151 b | |
| 1.0 | 123 | 36.4 | 28.8 | 15.0 | 0.39 a | 216 a | |
| 1.25 | 112 | 29.9 | 24.9 | 13.4 | 0.30 ab | 181 ab | |
| 4 | 0 | 129 b | 31.3 b | 23.8 | 13.4 | 0.18 c | 198 b |
| 0.1 | 128 b | 31.8 b | 22.2 | 11.8 | 0.22 c | 194 b | |
| 0.25 | 213 a | 49.8 a | 33.3 | 17.5 | 0.52 a | 314 a | |
| 0.5 | 138 b | 35.9 b | 27.4 | 15.1 | 0.33 abc | 216 b | |
| 1.0 | 147 b | 35.7 b | 23.9 | 14.0 | 0.44 ab | 221 b | |
| 1.25 | 168 ab | 41.0 ab | 28.2 | 14.1 | 0.32 bc | 251 ab | |
| Significance 2 | Day | *** | *** | NS | NS | * | *** |
| Energy | * | NS | NS | NS | *** | * | |
| D*E | * | * | NS | NS | NS | * | |
| UV-B Treatment | Measured Value | Daily Radiant Energy (kJ d−1) | Total Radiant Energy (kJ) |
|---|---|---|---|
| (W m−2) | |||
| 0.1 | 0.11 1 | 2.4 | 149.7 2 |
| 0.25 | 0.24 | 5.2 | 326.6 |
| 0.5 | 0.5 | 10.8 | 680.4 |
| 1.0 | 1.01 | 21.8 | 1374.4 |
| 1.25 | 1.26 | 27.2 | 1714.6 |
| Measured Parameters | Shoot Fresh Weight | Shoot Dry Weight | Total Chlorophyll Content | Total Carotenoid Content | Fv/Fm | H2O2 Content | Total Phenolic Content | Antioxidant Capacity | Total HCAs |
|---|---|---|---|---|---|---|---|---|---|
| Shoot fresh weight | 1.0 | ||||||||
| Shoot dry weight | 0.96 *** | 1.0 | |||||||
| p < 0.0001 | |||||||||
| Total chlorophyll content | 0.17 | 0.04 | 1.0 | ||||||
| p < 0.1626 | p < 0.7625 | ||||||||
| Total carotenoid content | −0.16 | −0.10 | −0.16 | 1.0 | |||||
| p < 0.1794 | p < 0.3910 | p < 0.1761 | |||||||
| Fv/Fm | 0.20 | 0.02 | 0.39 * | −0.52 ** | 1.0 | ||||
| p < 0.2853 | p < 0.9027 | p <0.0345 | p < 0.0032 | ||||||
| H2O2 content | −0.05 | 0.13 | −0.28 | 0.24 | −0.56 ** | 1.0 | |||
| p < 0.7823 | p < 0.4648 | p < 0.0922 | p < 0.1632 | p < 0.0013 | |||||
| Total phenolic content | −0.16 | 0.02 | −0.51 ** | 0.34 * | −0.47 ** | 0.58 *** | 1.0 | ||
| p < 0.3438 | p < 0.0947 | p < 0.0016 | p < 0.0445 | p < 0.01 | p < 0.0003 | ||||
| Antioxidant capacity | −0.17 | −0.001 | −0.42 * | 0.40 * | −0.41 * | 0.44 ** | 0.90 *** | 1.0 | |
| p < 0.3320 | p < 0.9925 | p < 0.0113 | p < 0.0152 | p < 0.0256 | p < 0.0075 | p < 0.0001 | |||
| Total HCAs | −0.17 | −0.13 | −0.22 | 0.47 *** | −0.27 | 0.06 | 0.47 ** | 0.57 *** | 1.0 |
| p < 0.1469 | p < 0.2726 | p < 0.0596 | p < 0.0001 | p < 0.1479 | p < 0.7427 | p < 0.004 | p < 0.0003 |
© 2020 by the authors. Licensee MDPI, Basel, Switzerland. This article is an open access article distributed under the terms and conditions of the Creative Commons Attribution (CC BY) license (http://creativecommons.org/licenses/by/4.0/).
Share and Cite
Park, S.-Y.; Lee, M.-Y.; Lee, C.-H.; Oh, M.-M. Physiologic and Metabolic Changes in Crepidiastrum denticulatum According to Different Energy Levels of UV-B Radiation. Int. J. Mol. Sci. 2020, 21, 7134. https://doi.org/10.3390/ijms21197134
Park S-Y, Lee M-Y, Lee C-H, Oh M-M. Physiologic and Metabolic Changes in Crepidiastrum denticulatum According to Different Energy Levels of UV-B Radiation. International Journal of Molecular Sciences. 2020; 21(19):7134. https://doi.org/10.3390/ijms21197134
Chicago/Turabian StylePark, Song-Yi, Mee-Youn Lee, Choong-Hwan Lee, and Myung-Min Oh. 2020. "Physiologic and Metabolic Changes in Crepidiastrum denticulatum According to Different Energy Levels of UV-B Radiation" International Journal of Molecular Sciences 21, no. 19: 7134. https://doi.org/10.3390/ijms21197134