Numerical and Experimental Analysis of Matched Filter Interrogation of FBG Sensors with Large Side Lobes


Abstract
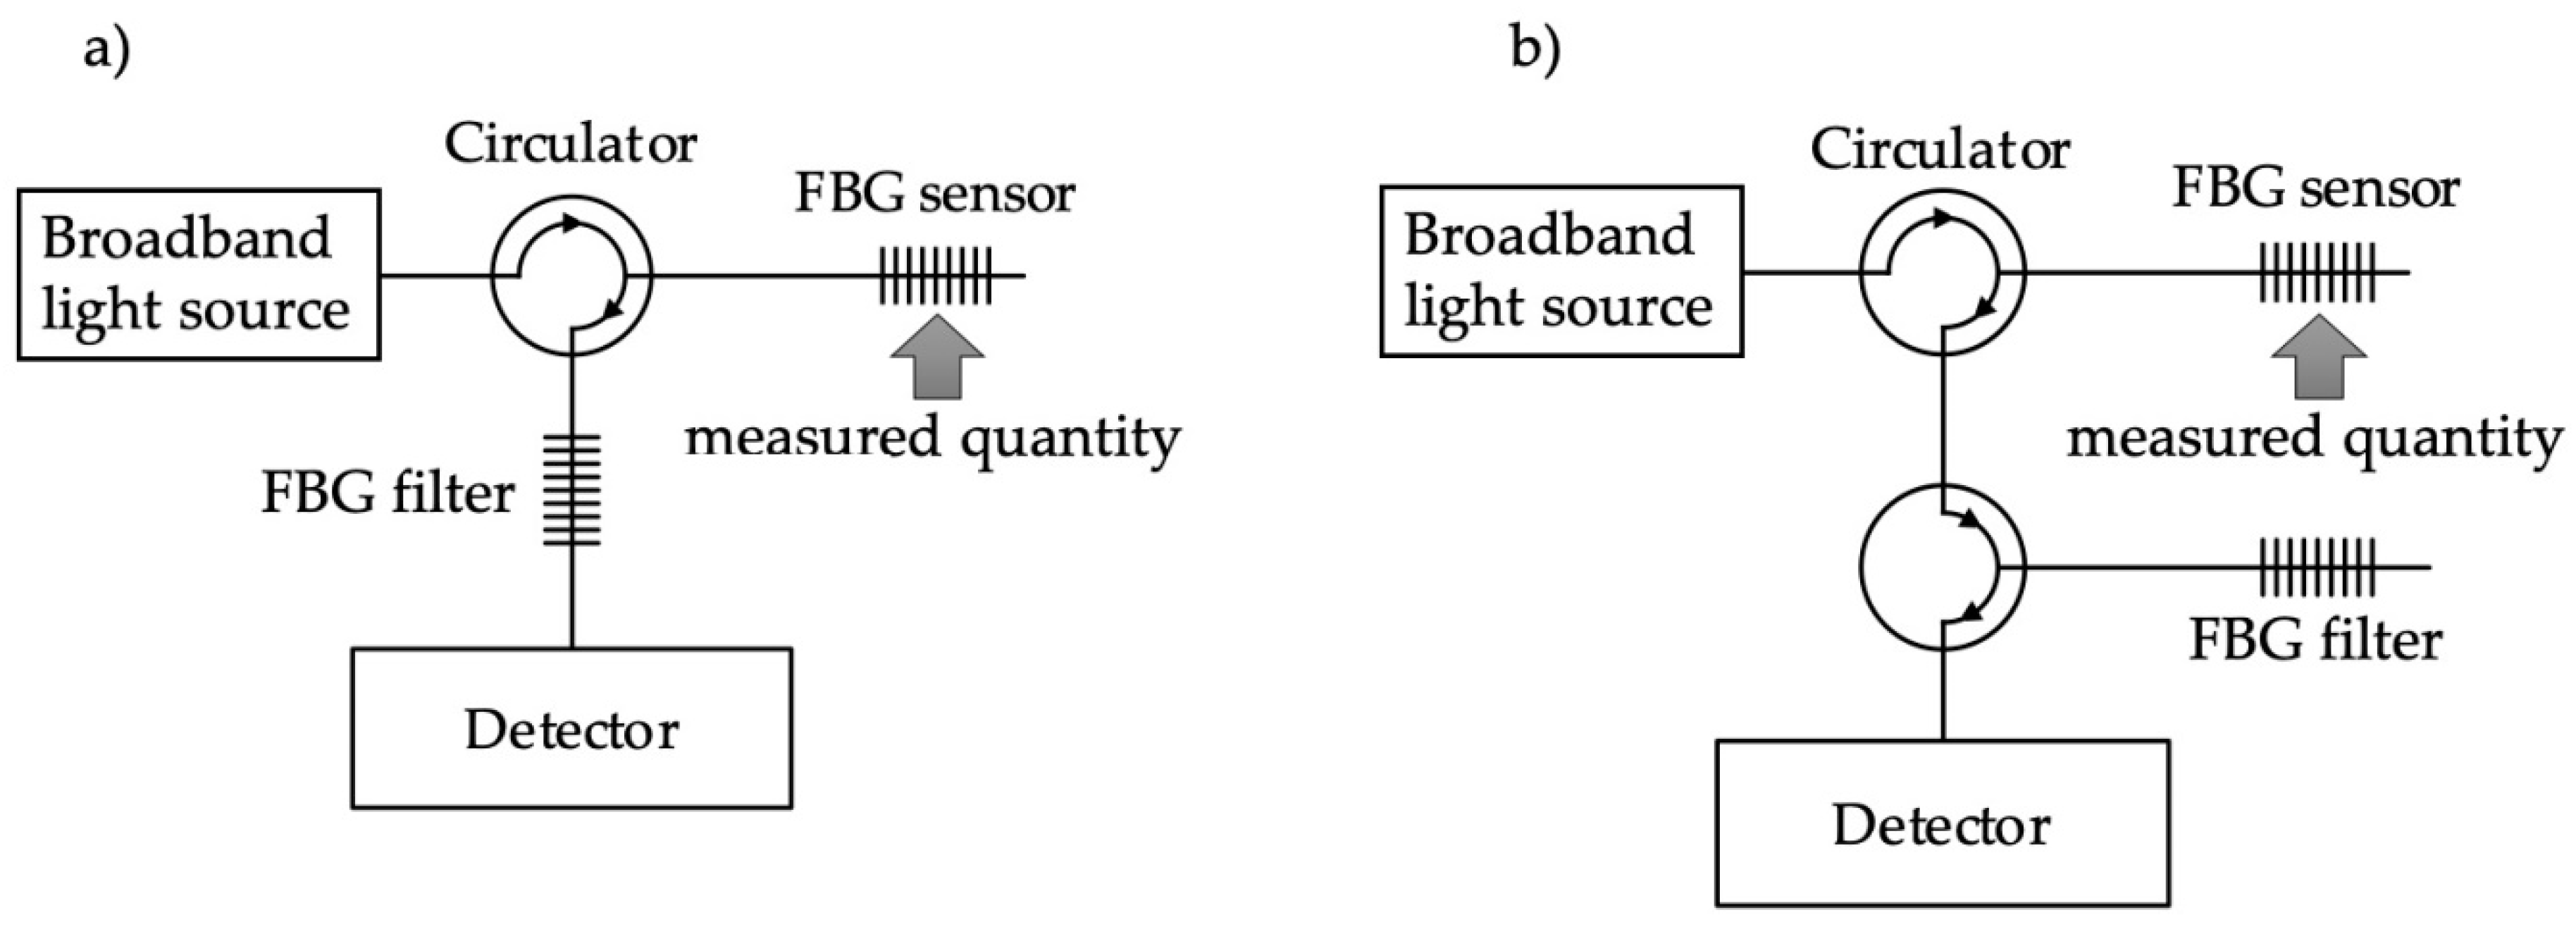
1. Introduction
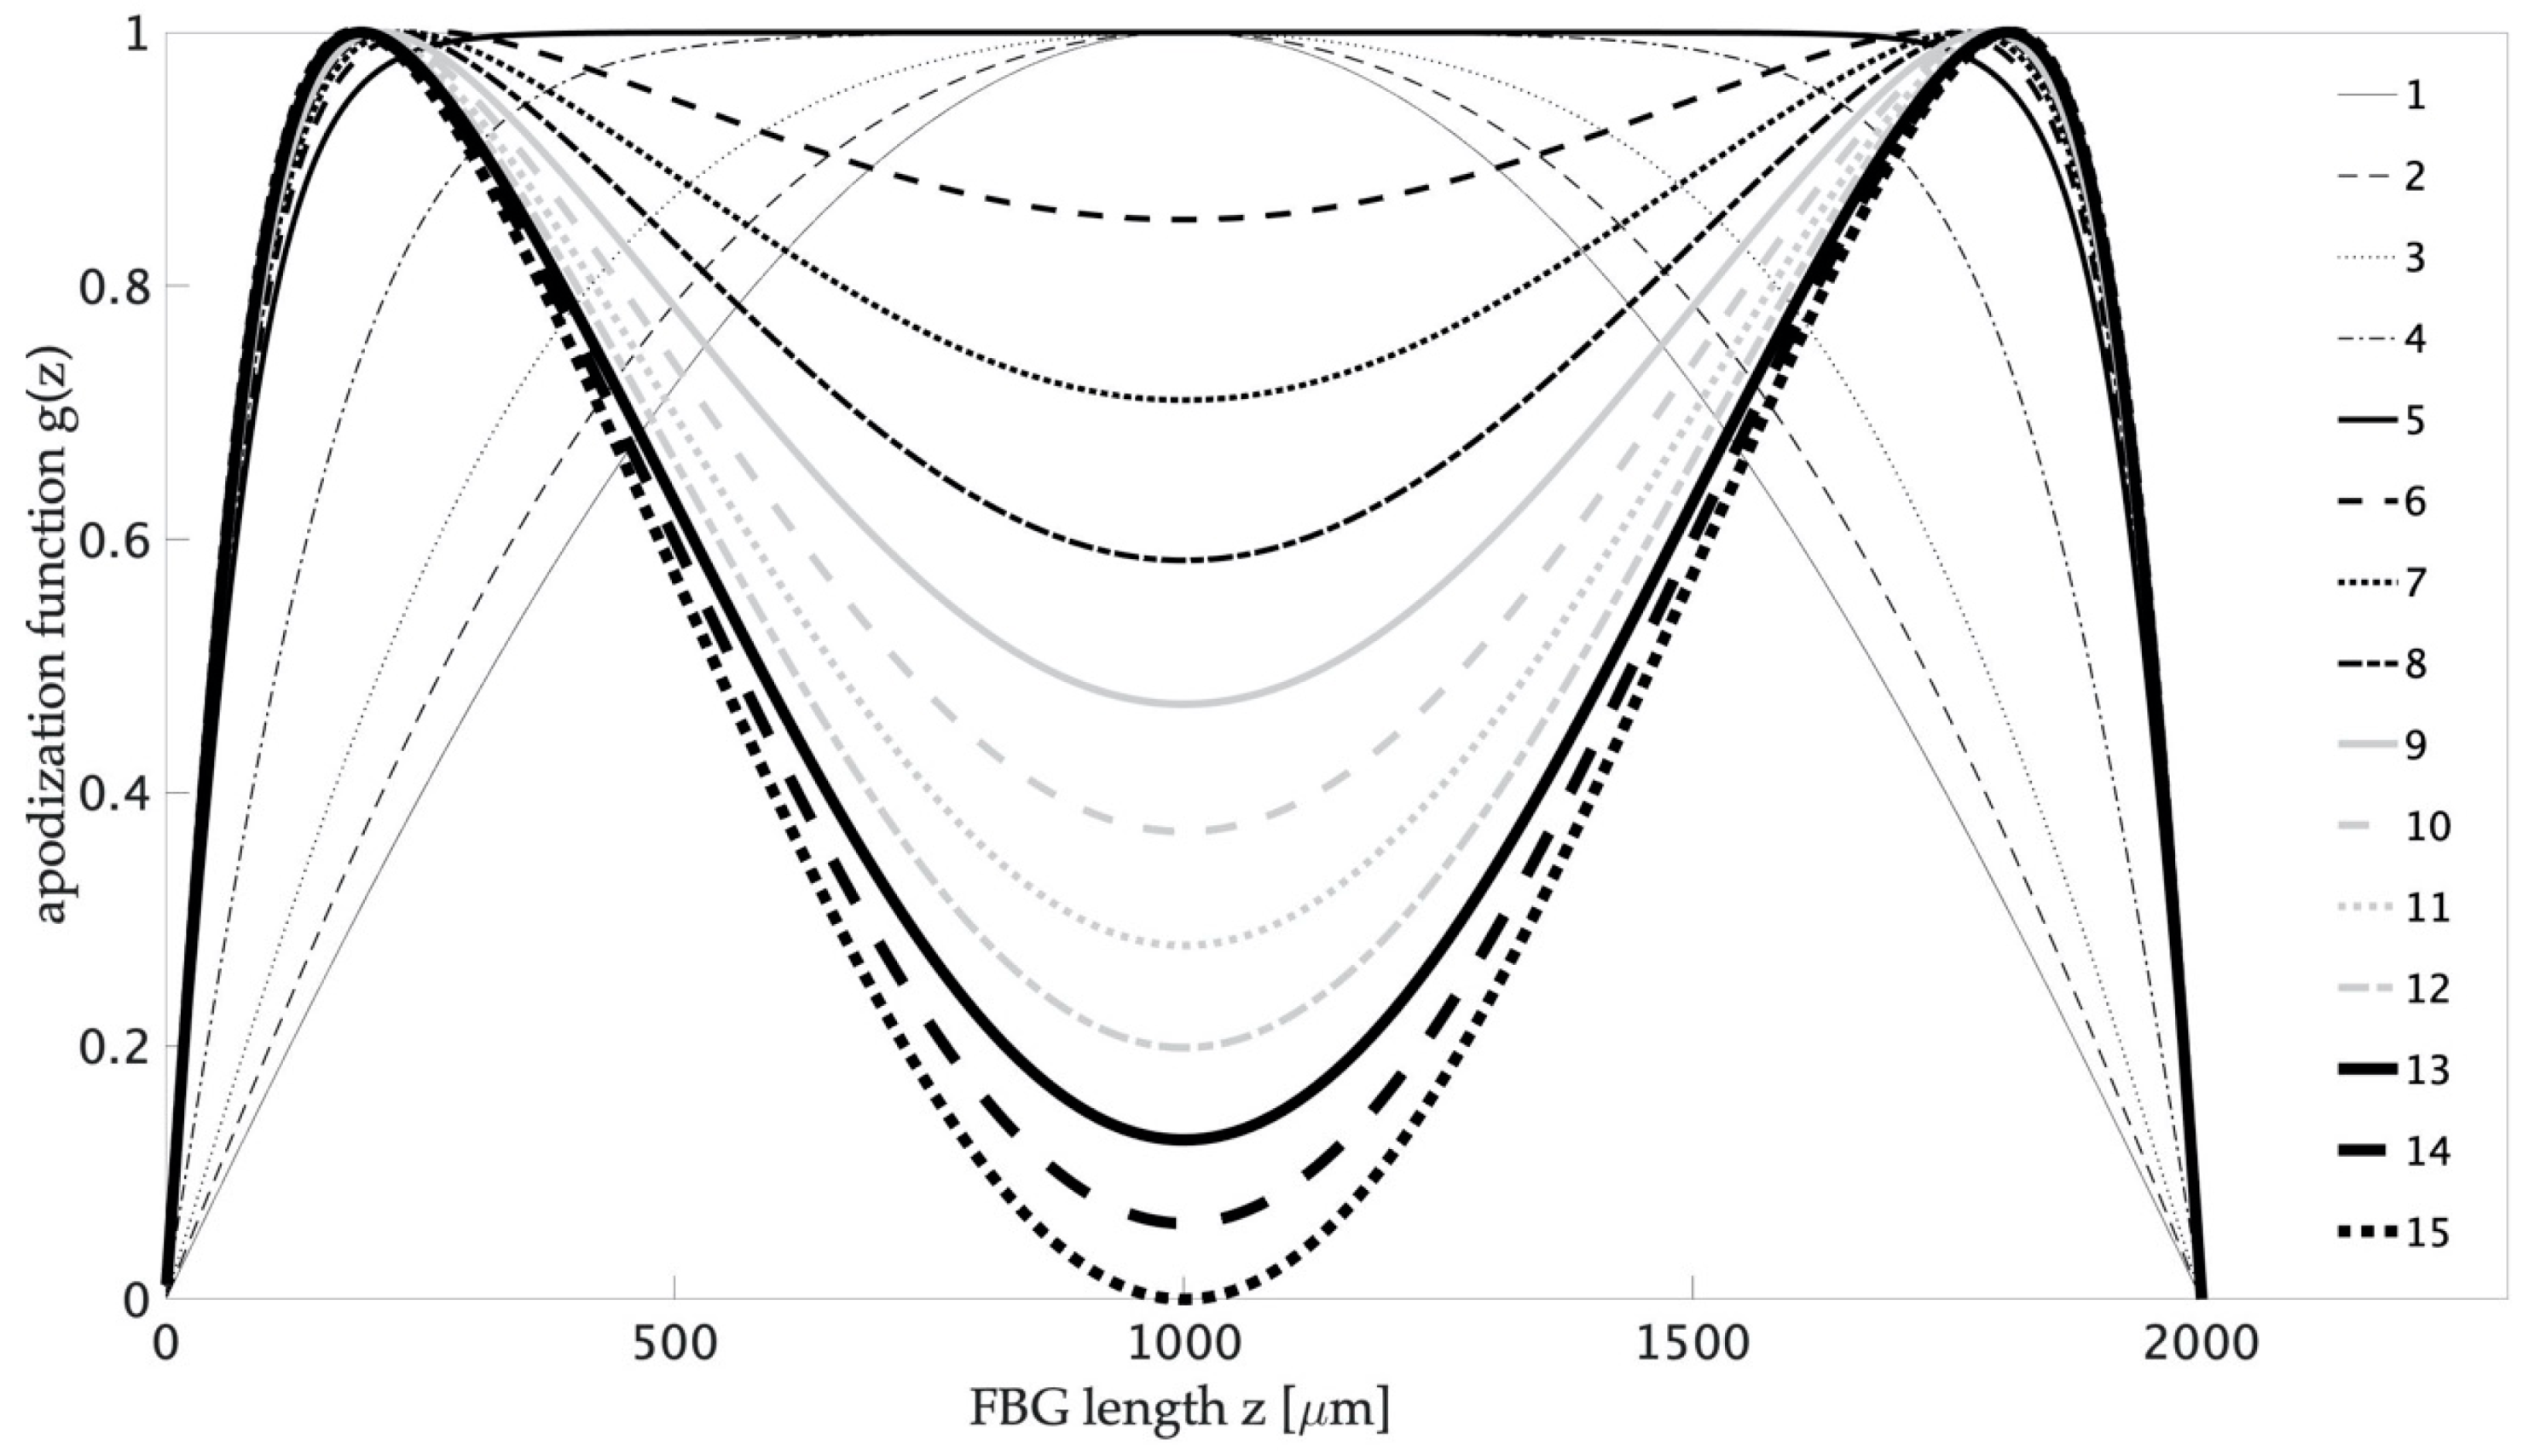
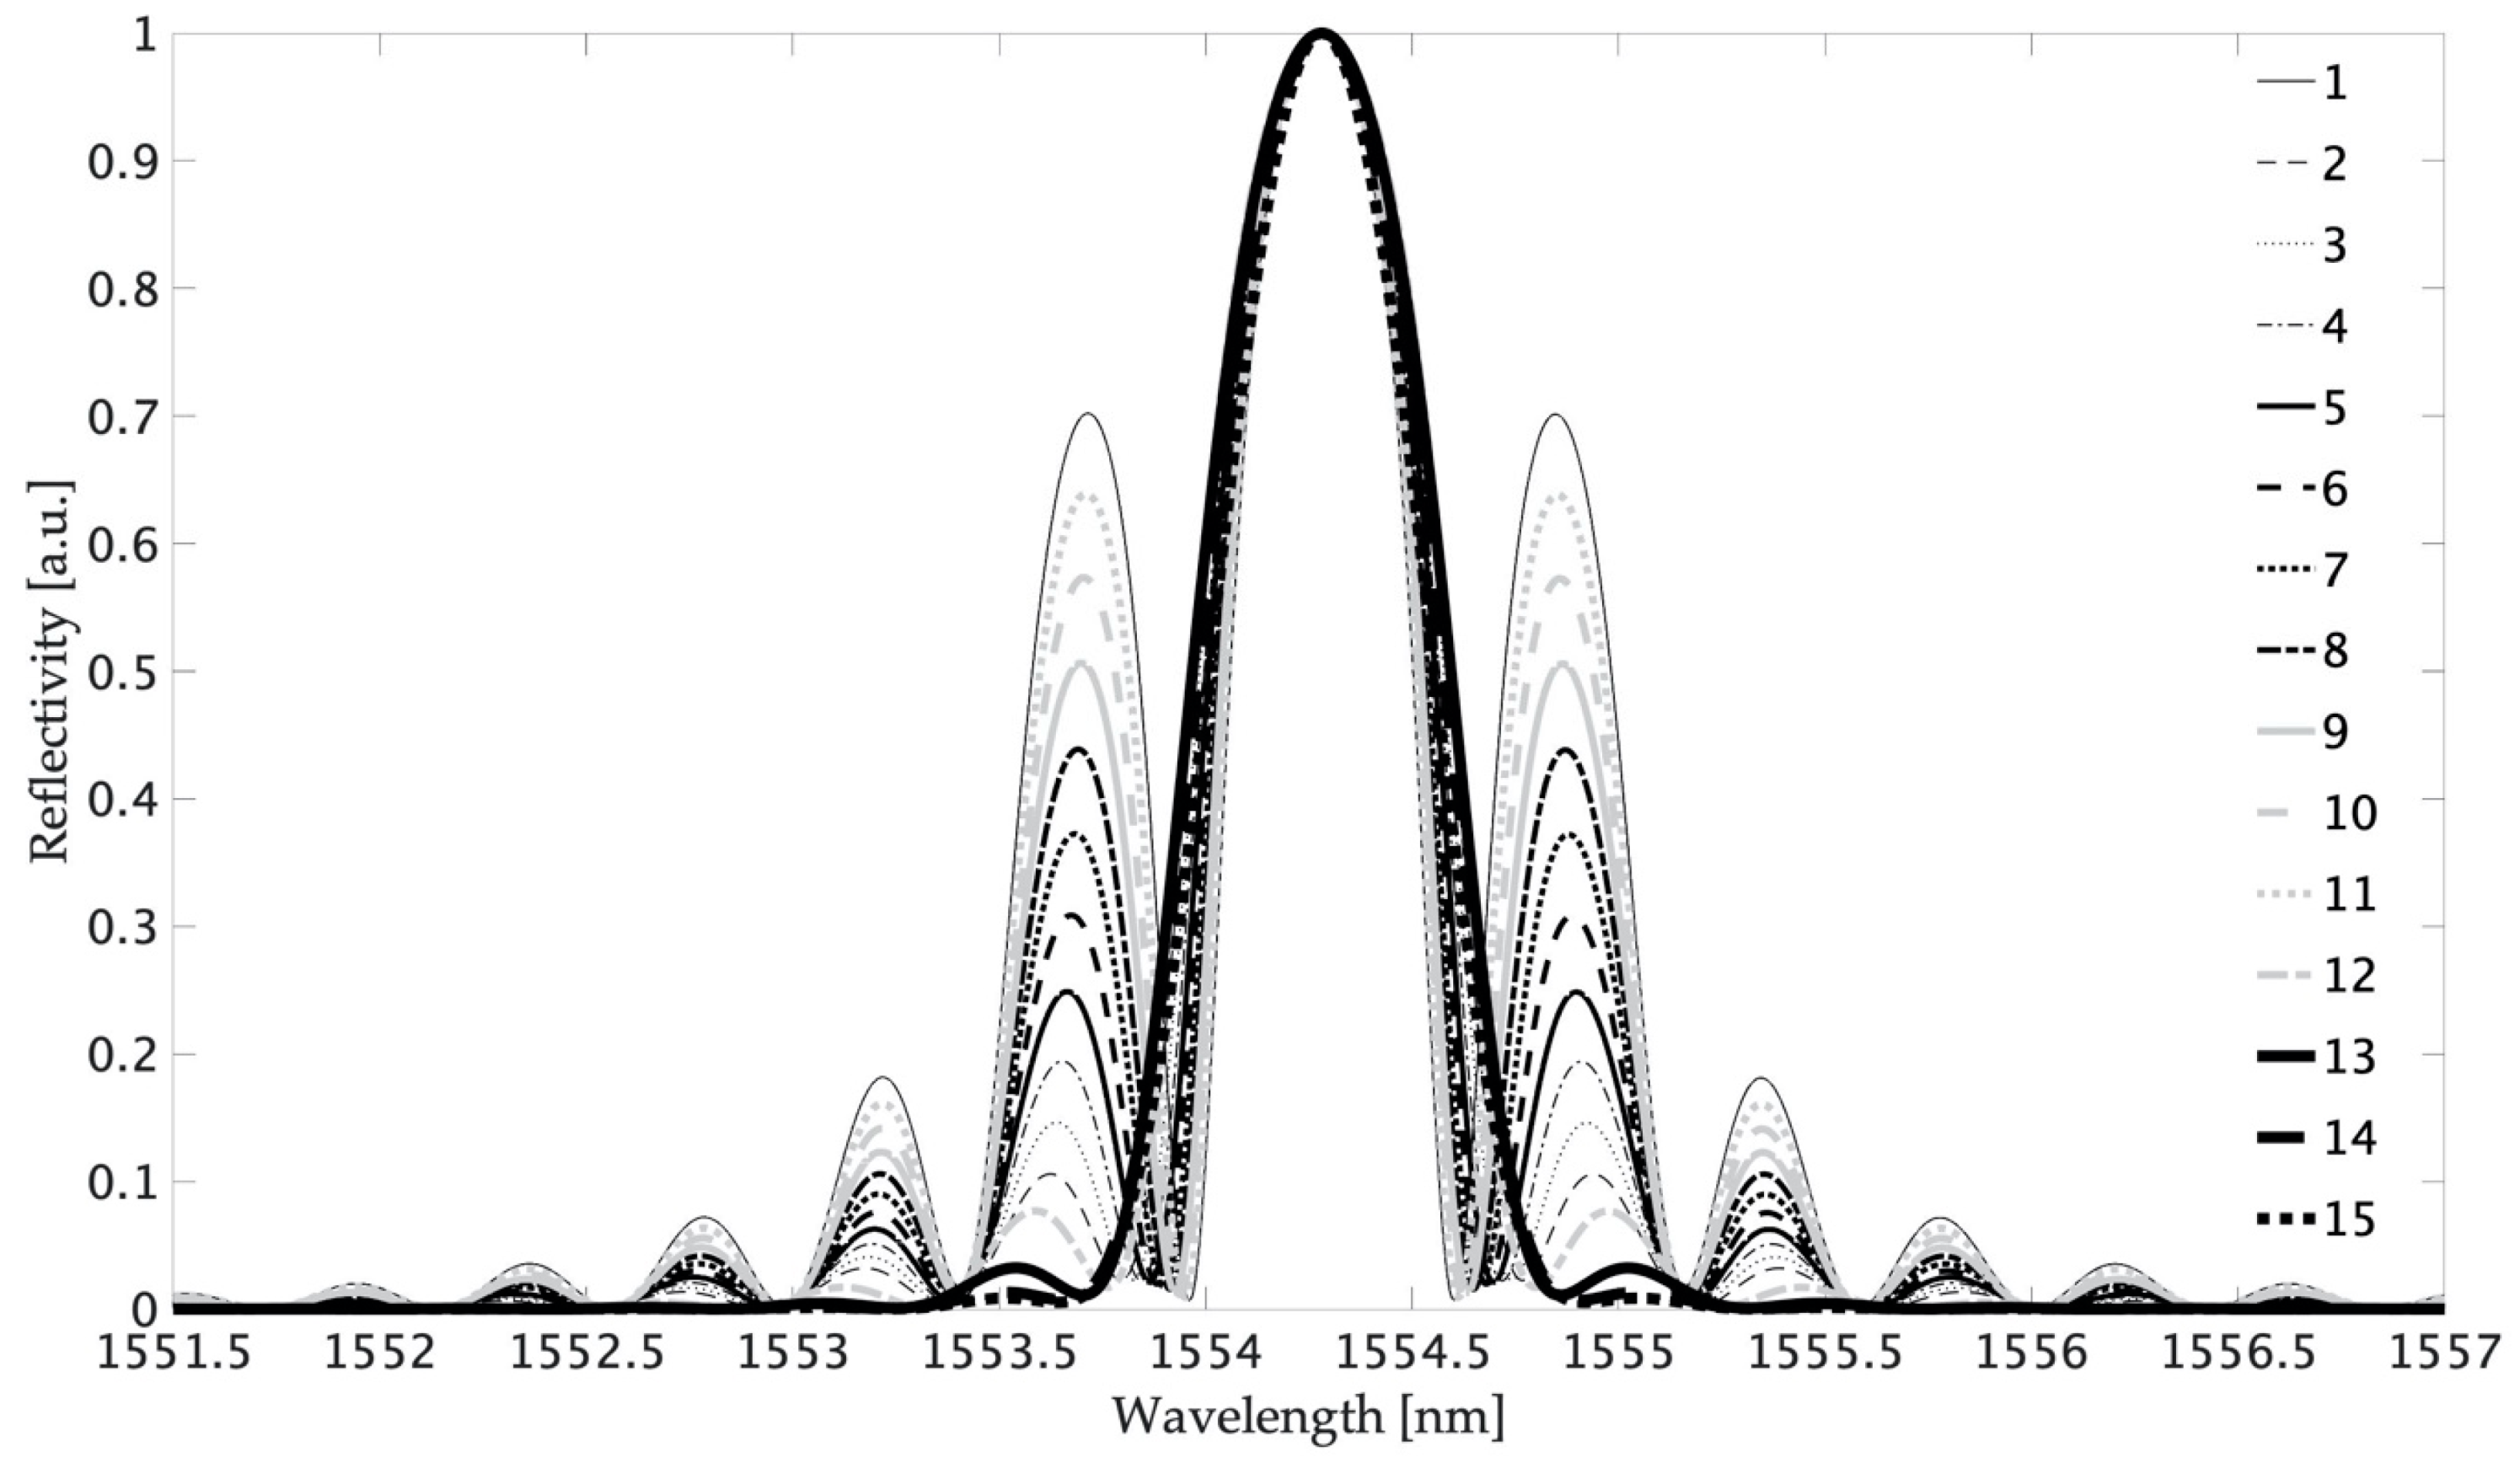
2. Modeling Spectra of Fiber Bragg Gratings with High-Reflectivity Side Lobes
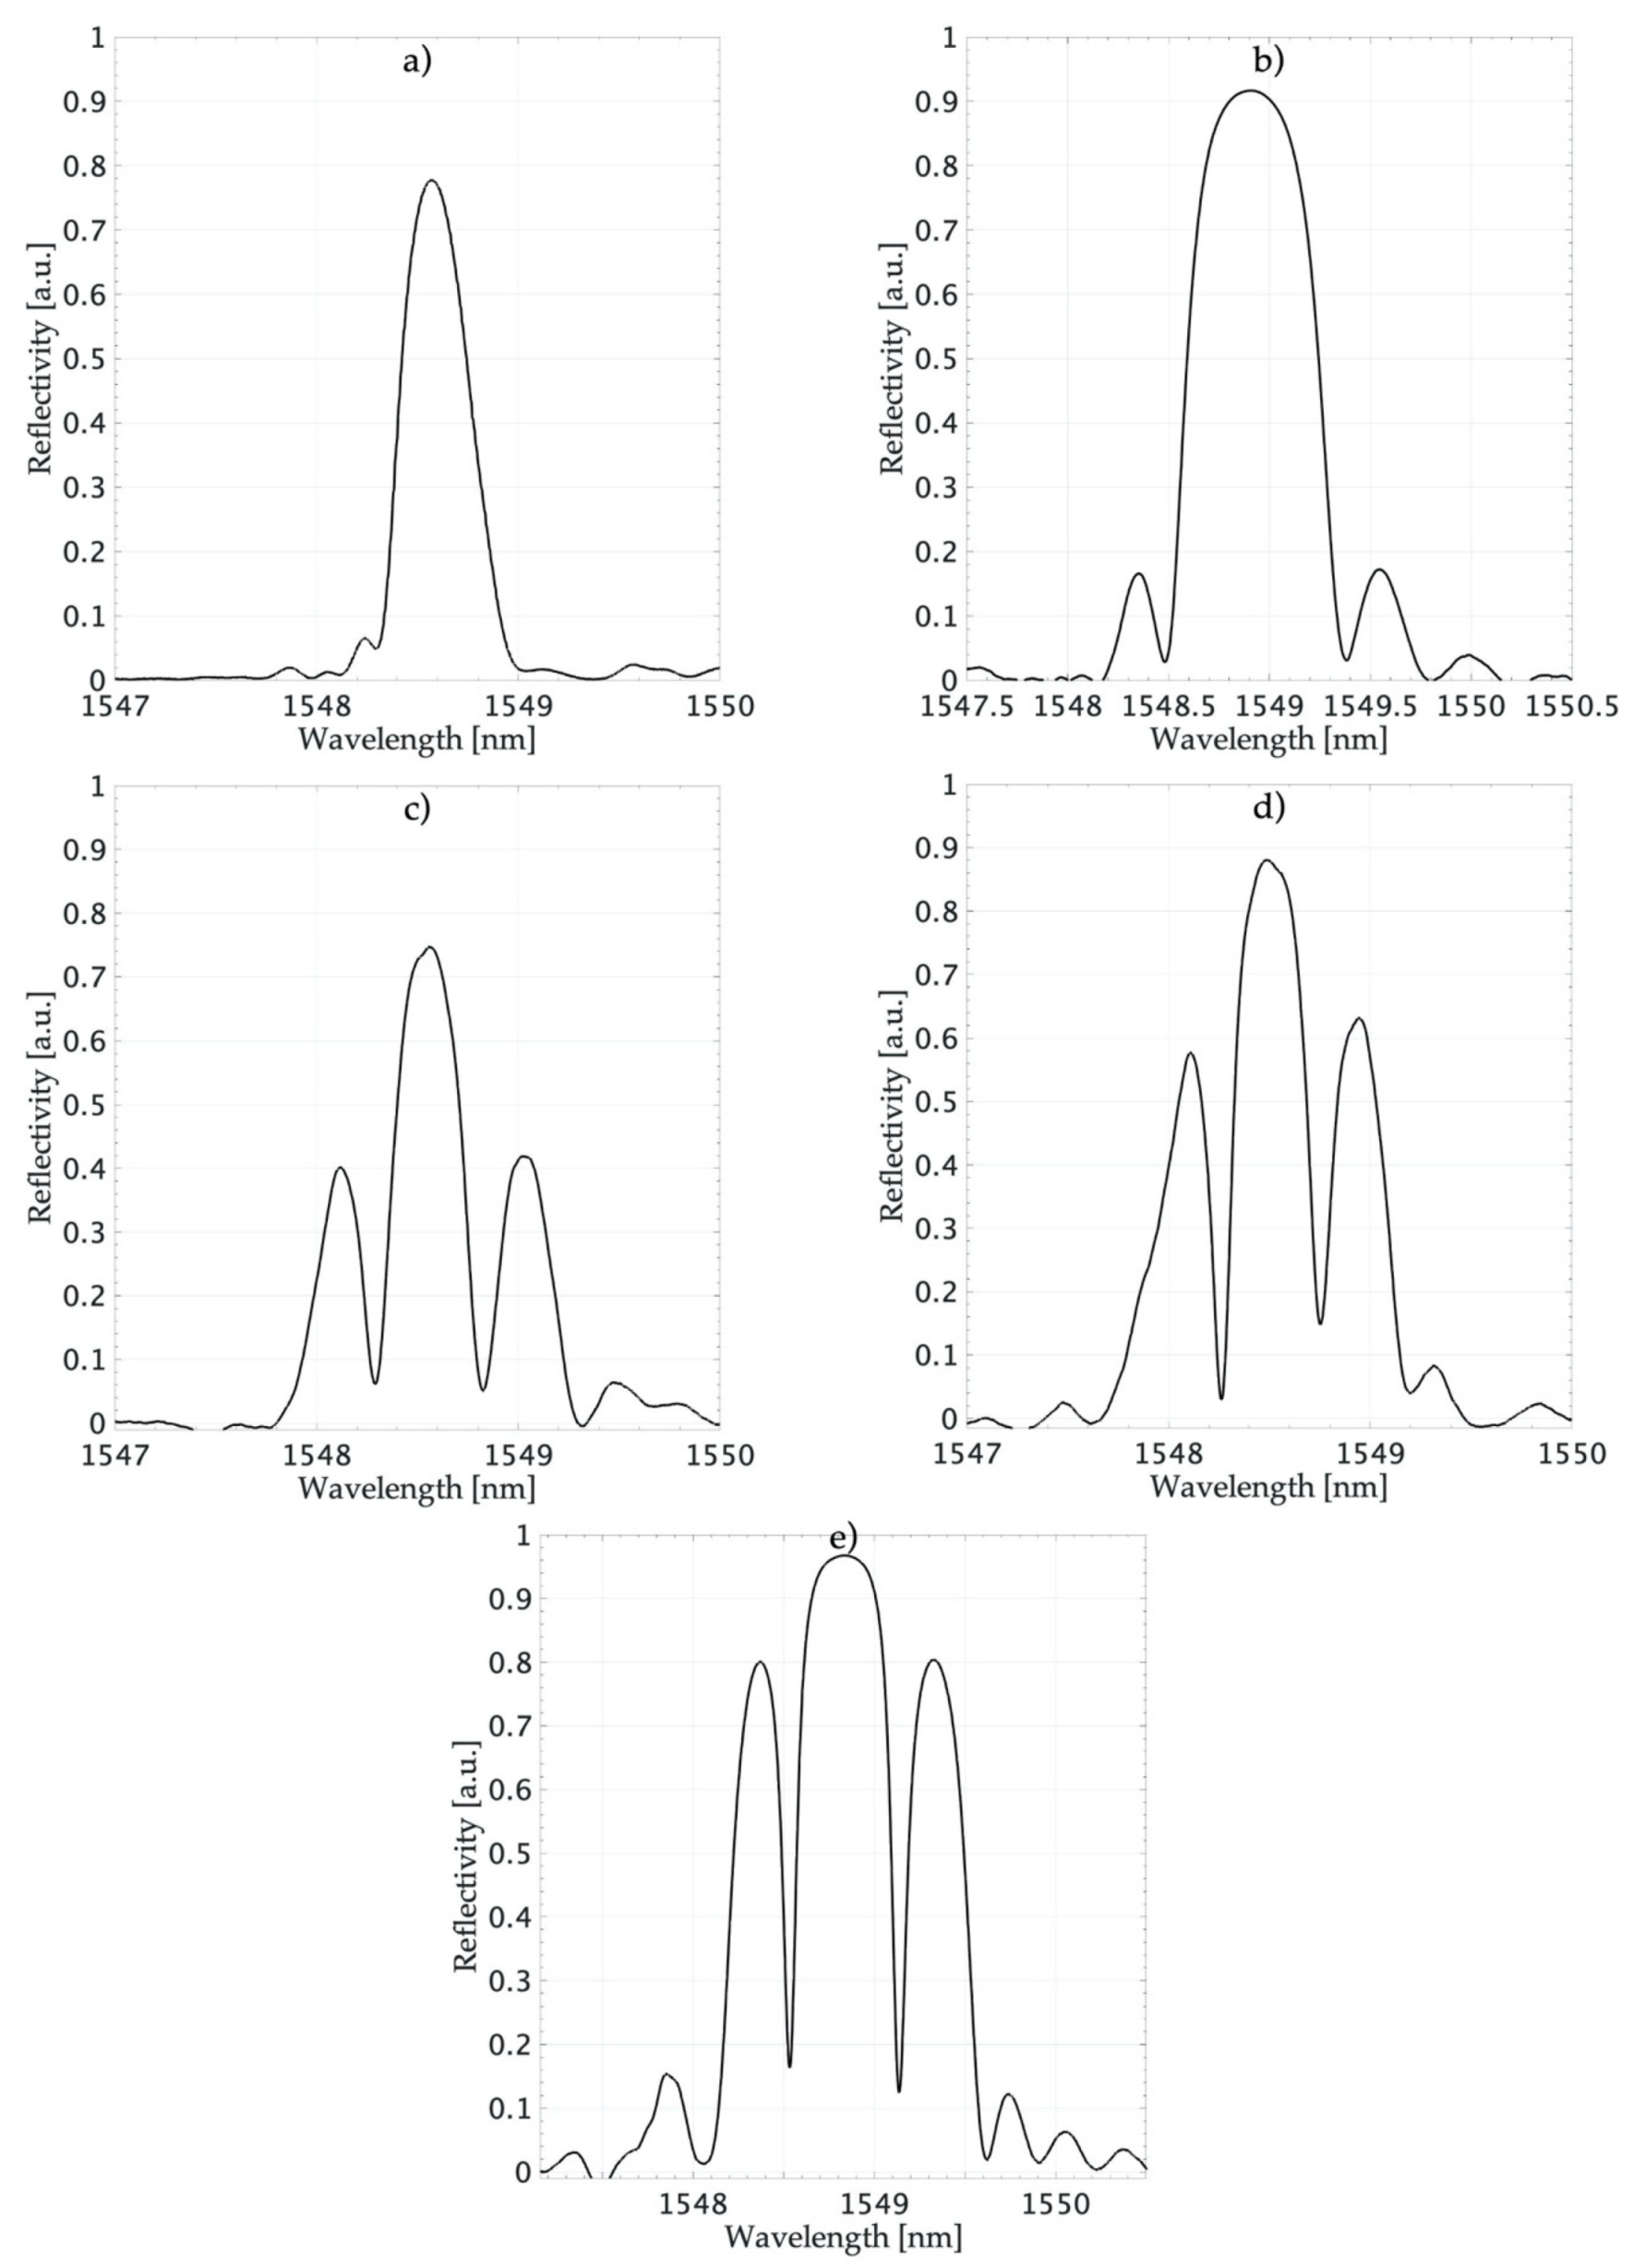
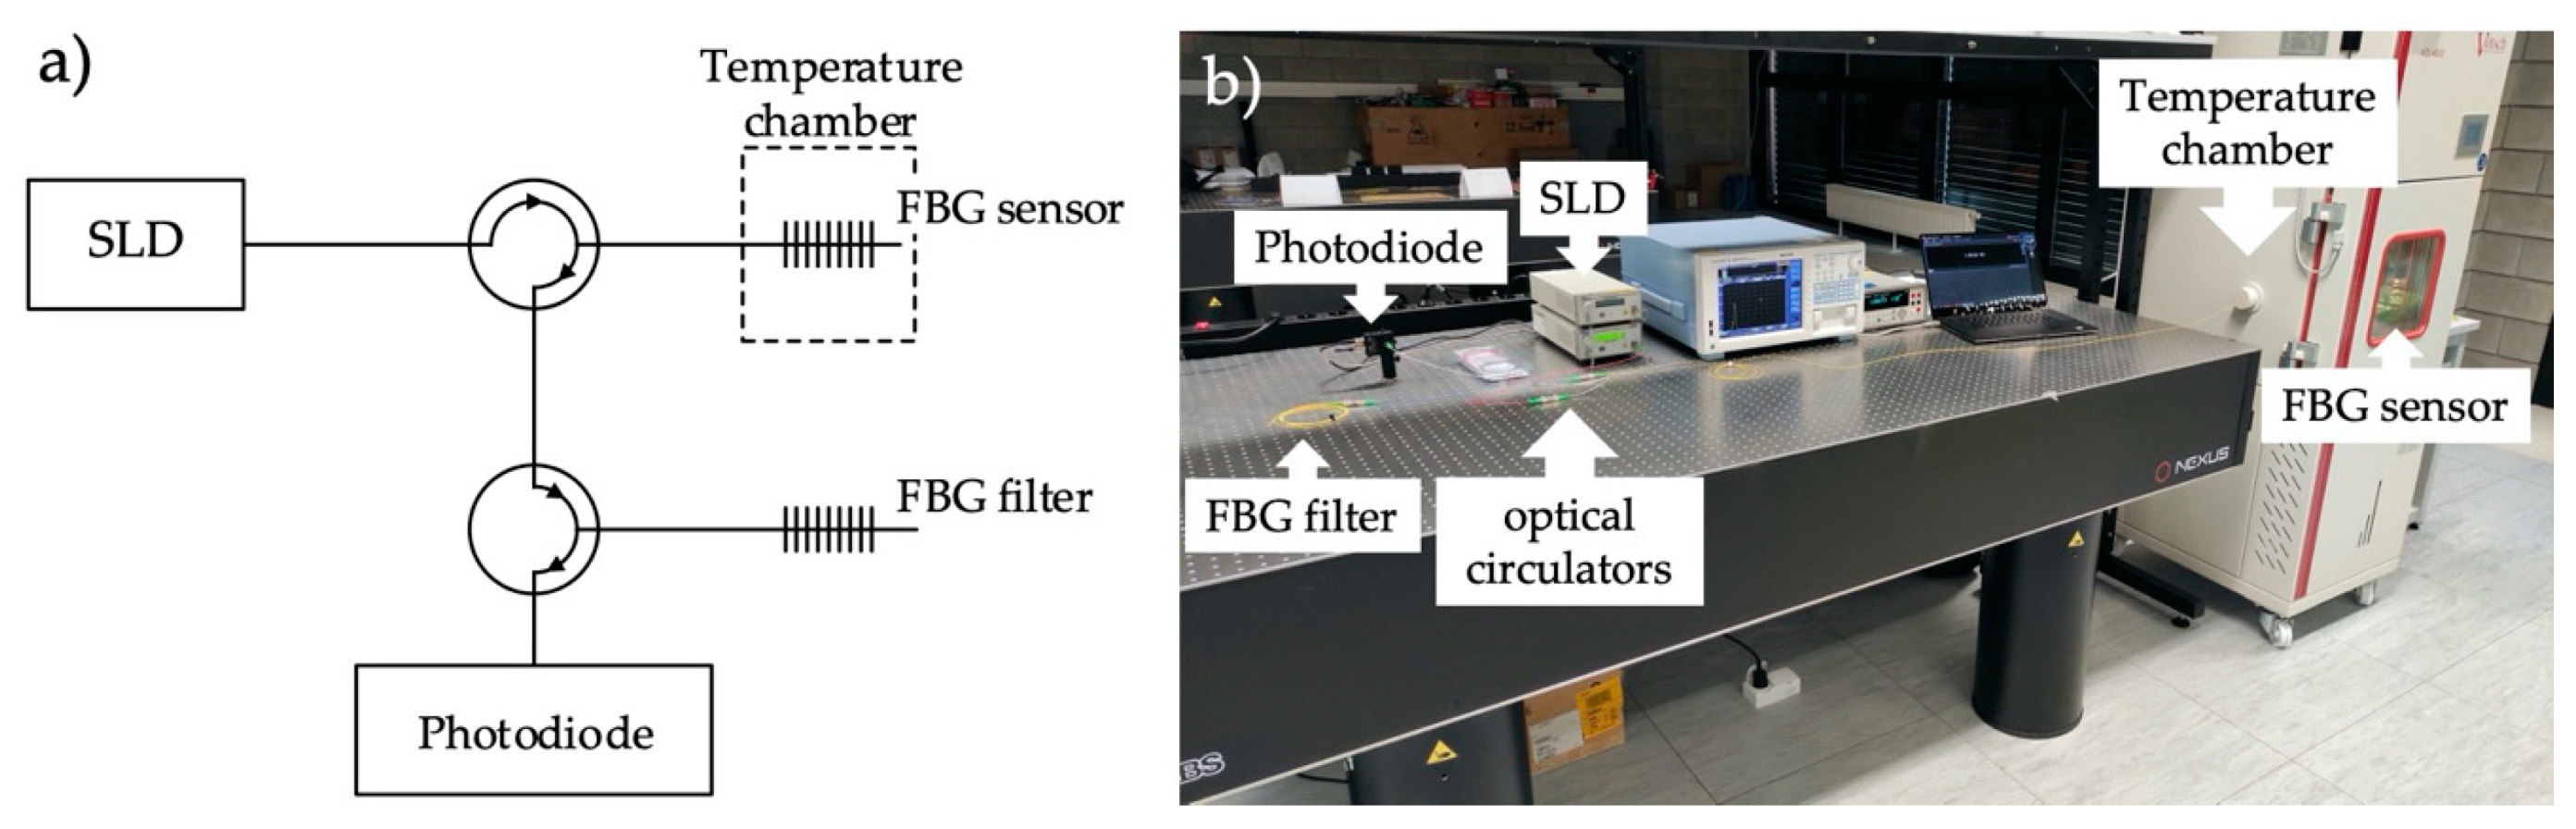
3. Experimental Verification
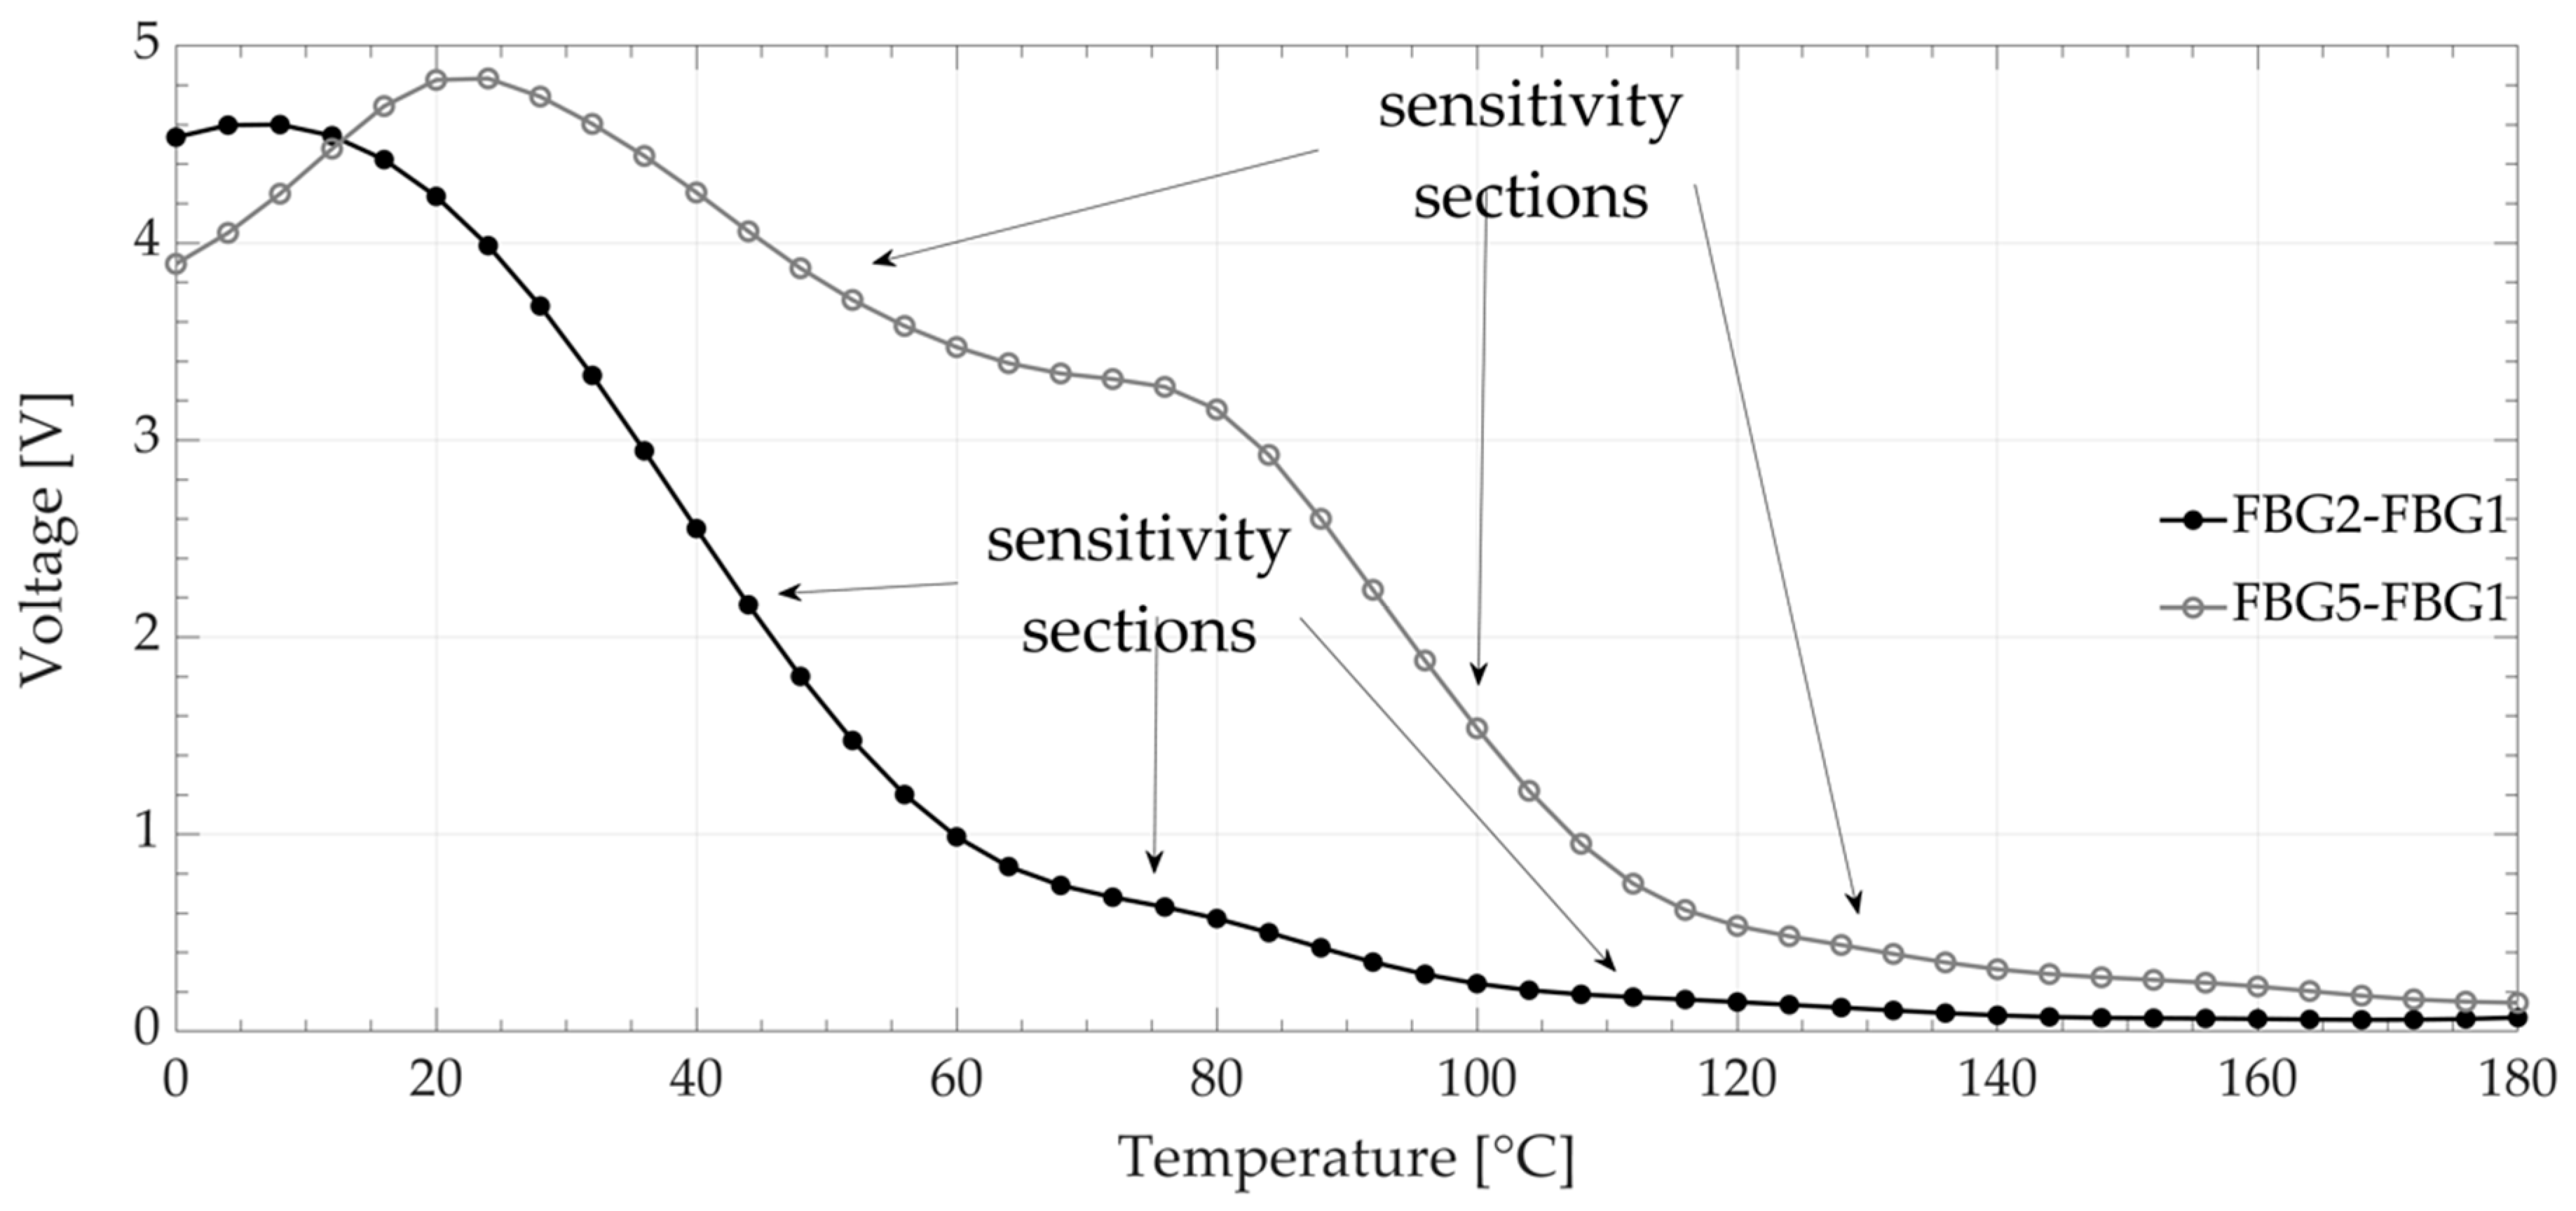
4. Analysis of the Obtained Results and Discussion
5. Conclusions
Author Contributions
Funding
Conflicts of Interest
References
- Khalid, K.S.; Zafrullah, M.; Bilal, S.M.; Mirza, M.A. Simulation and analysis of Gaussian apodized fiber Bragg grating strain sensor. J. Opt. Technol. 2012, 79, 667–673. [Google Scholar] [CrossRef]
- Liu, Z.; Zheng, D.; Madrigal, J.; Villatoro, J.; Antonio-Lopez, E.; Schulzgen, A.; Amezcua-Correa, R.; Zou, X.; Pan, W. Strongly coupled multicore fiber with FBGs for multipoint and multiparameter sensing. Opt. Fiber Technol. 2020, 58, 102315. [Google Scholar] [CrossRef]
- Melo, L.; Rodrigues, J.; Farinha, A.F.; Marques, C.; Bilro, L.; Alberto, N.; Tomé, J.P.; Nogueira, R.N. Concentration sensor based on a tilted fiber Bragg grating for anions monitoring. Opt. Fiber Technol. 2014, 20, 422–427. [Google Scholar] [CrossRef]
- Sahota, J.K.; Gupta, N.; Dhawan, D. Fiber Bragg grating sensors for monitoring of physical parameters: A comprehensive review. Opt. Eng. 2020, 59, 060901. [Google Scholar] [CrossRef]
- Udd, E. Review of multi-parameter fiber grating sensors. In Proceedings of the Fiber Optic Sensors and Applications V, Boston, MA, USA, 10–12 September 2007. [Google Scholar]
- Wild, G.; Richardson, S. Analytical modeling of power detection-based interrogation methods for fiber Bragg grating sensors for system optimization. Opt. Eng. 2015, 54, 097109. [Google Scholar] [CrossRef]
- Yuksel, K.; Kinet, D.; Chah, K.; Caucheteur, C. Implementation of a Mobile Platform Based on Fiber Bragg Grating Sensors for Automotive Traffic Monitoring. Sensors 2020, 20, 1567. [Google Scholar] [CrossRef] [PubMed]
- Campanella, C.E.; Cuccovillo, A.; Campanella, C.; Yurt, A.; Passaro, V. Fibre Bragg grating based strain sensors: Review of technology and applications. Sensors 2018, 18, 3115. [Google Scholar] [CrossRef]
- Díaz, C.A.R.; Marques, C.A.F.; Domingues, M.F.F.; Ribeiro, M.R.N.; Frizera-Neto, A.; Pontes, P.S.; Antunes, P.F.C. A cost-effective edge-filter based FBG interrogator using catastrophic fuse effect micro-cavity interferometers. Measurement 2018, 124, 486–493. [Google Scholar] [CrossRef]
- Díaz, C.A.R.; Leal-Junior, A.G.; Avellar, L.M.; Antunes, P.F.C.; Pontes, M.J.; Marques, C.A.; Frizera, A.; Ribeiro, M.R.N. Perrogator: A Portable Energy-Efficient Interrogator for Dynamic Monitoring of Wavelength-Based Sensors in Wearable Applications. Sensors 2019, 19, 2962. [Google Scholar] [CrossRef] [PubMed]
- Neto, P.X.; Carneiro, A.C.; López-Barbero, A.P.; Silva, V.N.H.; Ribeiro, R.M.; dos Santos, A.B. A Mathematical Model for the Interrogation of LPG Fiber Optical Sensors Based on Electrical Harmonic Analysis. IEEE Sens. J. 2020, 20, 4237–4244. [Google Scholar] [CrossRef]
- Chen, H.; Liang, Y. Analysis of the tunable asymmetric fiber FP cavity for fiber strain sensor edge-filter demodulation. Photonic Sens. 2014, 4, 338–343. [Google Scholar] [CrossRef]
- Bandyopadhyay, S.; Biswas, P.; Pal, A.; Bhadra, S.K.; Dasgupta, K. Empirical relations for design of linear edge filters using apodized linearly chirped fiber Bragg grating. J. Lightwave Technol. 2008, 26, 3853–3859. [Google Scholar] [CrossRef]
- Chuang, K.C.; Ma, C.C.; Wang, C.H. Performance analysis of a fiber Bragg grating filter-based strain/temperature sensing system based on a modified Gaussian function approximation method. Appl. Opt. 2011, 50, 5243–5255. [Google Scholar] [CrossRef] [PubMed]
- Wade, S.A.; Attard, D.P.; Stoddart, P.R. Analysis of transmission mode of a matched fiber Bragg grating interrogation scheme. Appl. Opt. 2010, 49, 4498–4505. [Google Scholar] [CrossRef] [PubMed]
- Cui, J.; Hu, Y.; Feng, K.; Li, J.; Tan, J. FBG Interrogation Method with High Resolution and Response Speed Based on a Reflective-Matched FBG Scheme. Sensors 2015, 15, 16516–16535. [Google Scholar] [CrossRef]
- Wang, Z.F.; Sui, Q.M.; Wang, J.; Chang, J.; Peng, G.D.; Song, H.Y. Experimental and technical research on fiber Bragg grating vibration measuring based on two matching gratings demodulation. In Proceedings of the Third Asia Pacific Optical Sensors Conference, Sydney, Australia, 31 January–3 February 2012. [Google Scholar]
- Zhan, Y.; Yu, M.; Pei, J.; Yang, X.; Xiang, S. A linearity interrogation technique with enlarged dynamic range for fiber Bragg grating sensing. Opt. Commun. 2010, 283, 3428–3433. [Google Scholar] [CrossRef]
- Jiang, B.; Zhao, J.; Qin, C.; Huang, Z.; Fan, F. An optimized strain demodulation method based on dynamic double matched fiber Bragg grating filtering. Opt. Lasers Eng. 2011, 49, 415–418. [Google Scholar] [CrossRef]
- Zhang, H.; Jiang, J.; Liu, S.; Chen, H.; Zheng, X.; Qiu, Y. Overlap Spectrum Fiber Bragg Grating Sensor Based on Light Power Demodulation. Sensors 2018, 18, 1597. [Google Scholar] [CrossRef]
- Wu, Q.; Farrell, G.; Semenova, Y. Simple design technique for a triangular FBG filter based on a linearly chirped grating. Opt. Commun. 2010, 283, 985–992. [Google Scholar] [CrossRef]
- Lin, B.; Tjin, S.C.; Ngo, N.Q.; Song, Y.; Liang, S.; Xia, L.; Jiang, M. Analysis of inverse-Gaussian apodized fiber Bragg grating. Appl. Opt. 2010, 49, 4715–4722. [Google Scholar] [CrossRef]
- Lin, B.; Zhang, H.; Tjin, S.C.; Tang, D.; Hao, J.; Tay, C.M.; Liang, S. Inverse-Gaussian apodized fiber Bragg grating for dual-wavelength lasing. Appl. Opt. 2010, 49, 1373–1377. [Google Scholar] [CrossRef] [PubMed]
- Erdogan, T. Fiber grating spectra. J. Lightwave Technol. 1997, 15, 1277–1294. [Google Scholar] [CrossRef]
- Liu, Q.; Li, Q.; Sun, Y.; Chai, Q.; Zhang, B.; Liu, C.; Sun, T.; Liu, W.; Sun, J.; Ren, Z.; et al. Transfer matrix method for simulation of the fiber Bragg grating in polarization maintaining fiber. Opt. Commun. 2019, 452, 185–188. [Google Scholar] [CrossRef]
- Ali, T.A.; Shehata, M.I.; Mohamed, N.A. Design and performance investigation of a highly accurate apodized fiber Bragg grating-based strain sensor in single and quasi-distributed systems. Appl. Opt. 2015, 54, 5243–5251. [Google Scholar] [CrossRef]
- Jiao, K.; Shu, J.; Shen, H.; Guan, Z.; Yang, F.; Zhu, R. Fabrication of kW-level chirped and tilted fiber Bragg gratings and filtering of stimulated Raman scattering in high-power CW oscillators. High Power Laser Sci. Eng. 2019, 7, E31. [Google Scholar] [CrossRef]
- Min, R.; Ortega, B.; Broadway, C.; Caucheteur, C.; Woyessa, G.; Bang, O.; Antunes, P.; Marques, C. Hot water-assisted fabrication of chirped polymer optical fiber Bragg gratings. Opt. Express 2018, 26, 34655–34664. [Google Scholar] [CrossRef]
- Leal-Junior, A.; Theodosiou, A.; Díaz, C.; Marques, C.; Pontes, M.J.; Kalli, K.; Frizera-Neto, A. Polymer Optical Fiber Bragg Gratings in CYTOP Fibers for Angle Measurement with Dynamic Compensation. Polymers 2018, 10, 674. [Google Scholar] [CrossRef]
- De Miguel, J.L.; Galindo-Santos, J.; Pulido de Torres, C.; Salgado, P.; Velasco, A.V.; Corredera, P. Experimental Demonstration of Low-Uncertainty Calibration Methods for Bragg Grating Interrogators. Sensors 2018, 18, 1895. [Google Scholar] [CrossRef] [PubMed]
- Skorupski, K.; Harasim, D.; Panas, P.; Cięszczyk, S.; Kisała, P.; Kacejko, P.; Mroczka, J.; Wydra, M. Overhead Transmission Line Sag Estimation Using the Simple Opto-Mechanical System with Fiber Bragg Gratings—Part 2: Interrogation System. Sensors 2020, 20, 2652. [Google Scholar] [CrossRef]
- Sano, Y.; Yoshino, T. Fast optical wavelength interrogator employing arrayed waveguide grating for distributed fiber Bragg grating sensors. J. Lightwave Technol. 2003, 21, 132. [Google Scholar] [CrossRef]


| Structure Number | a Coefficient | b Coefficient |
|---|---|---|
| 1 | 2 | 0 |
| 2 | 3 | 0 |
| 3 | 5 | 0 |
| 4 | 10 | 0 |
| 5 | 20 | 0 |
| 6 | 20 | 0.1 |
| 7 | 20 | 0.2 |
| 8 | 20 | 0.3 |
| 9 | 20 | 0.4 |
| 10 | 20 | 0.5 |
| 11 | 20 | 0.6 |
| 12 | 20 | 0.7 |
| 13 | 20 | 0.8 |
| 14 | 20 | 0.9 |
| 15 | 20 | 1 |
| K [0..1] | Reflection [0..1] | FWHM [nm] | |
|---|---|---|---|
| FBG1 | 0.0217 | 0.775 | 0.380 |
| FBG2 | 0.1882 | 0.9165 | 0.664 |
| FBG3 | 0.5615 | 0.5615 | 0.360 |
| FBG4 | 0.7178 | 0.7178 | 0.372 |
| FBG5 | 0.8260 | 0.8260 | 0.520 |
© 2020 by the authors. Licensee MDPI, Basel, Switzerland. This article is an open access article distributed under the terms and conditions of the Creative Commons Attribution (CC BY) license (http://creativecommons.org/licenses/by/4.0/).
Share and Cite
Skorupski, K.; Cięszczyk, S.; Panas, P.; Kisała, P. Numerical and Experimental Analysis of Matched Filter Interrogation of FBG Sensors with Large Side Lobes. Sensors 2020, 20, 5522. https://doi.org/10.3390/s20195522
Skorupski K, Cięszczyk S, Panas P, Kisała P. Numerical and Experimental Analysis of Matched Filter Interrogation of FBG Sensors with Large Side Lobes. Sensors. 2020; 20(19):5522. https://doi.org/10.3390/s20195522
Chicago/Turabian StyleSkorupski, Krzysztof, Sławomir Cięszczyk, Patryk Panas, and Piotr Kisała. 2020. "Numerical and Experimental Analysis of Matched Filter Interrogation of FBG Sensors with Large Side Lobes" Sensors 20, no. 19: 5522. https://doi.org/10.3390/s20195522
APA StyleSkorupski, K., Cięszczyk, S., Panas, P., & Kisała, P. (2020). Numerical and Experimental Analysis of Matched Filter Interrogation of FBG Sensors with Large Side Lobes. Sensors, 20(19), 5522. https://doi.org/10.3390/s20195522