Temporal and Spatial Variations of Precipitation Change from Southeast to Northwest China during the Period 1961–2017


Abstract
:1. Introduction
2. Materials and Methods
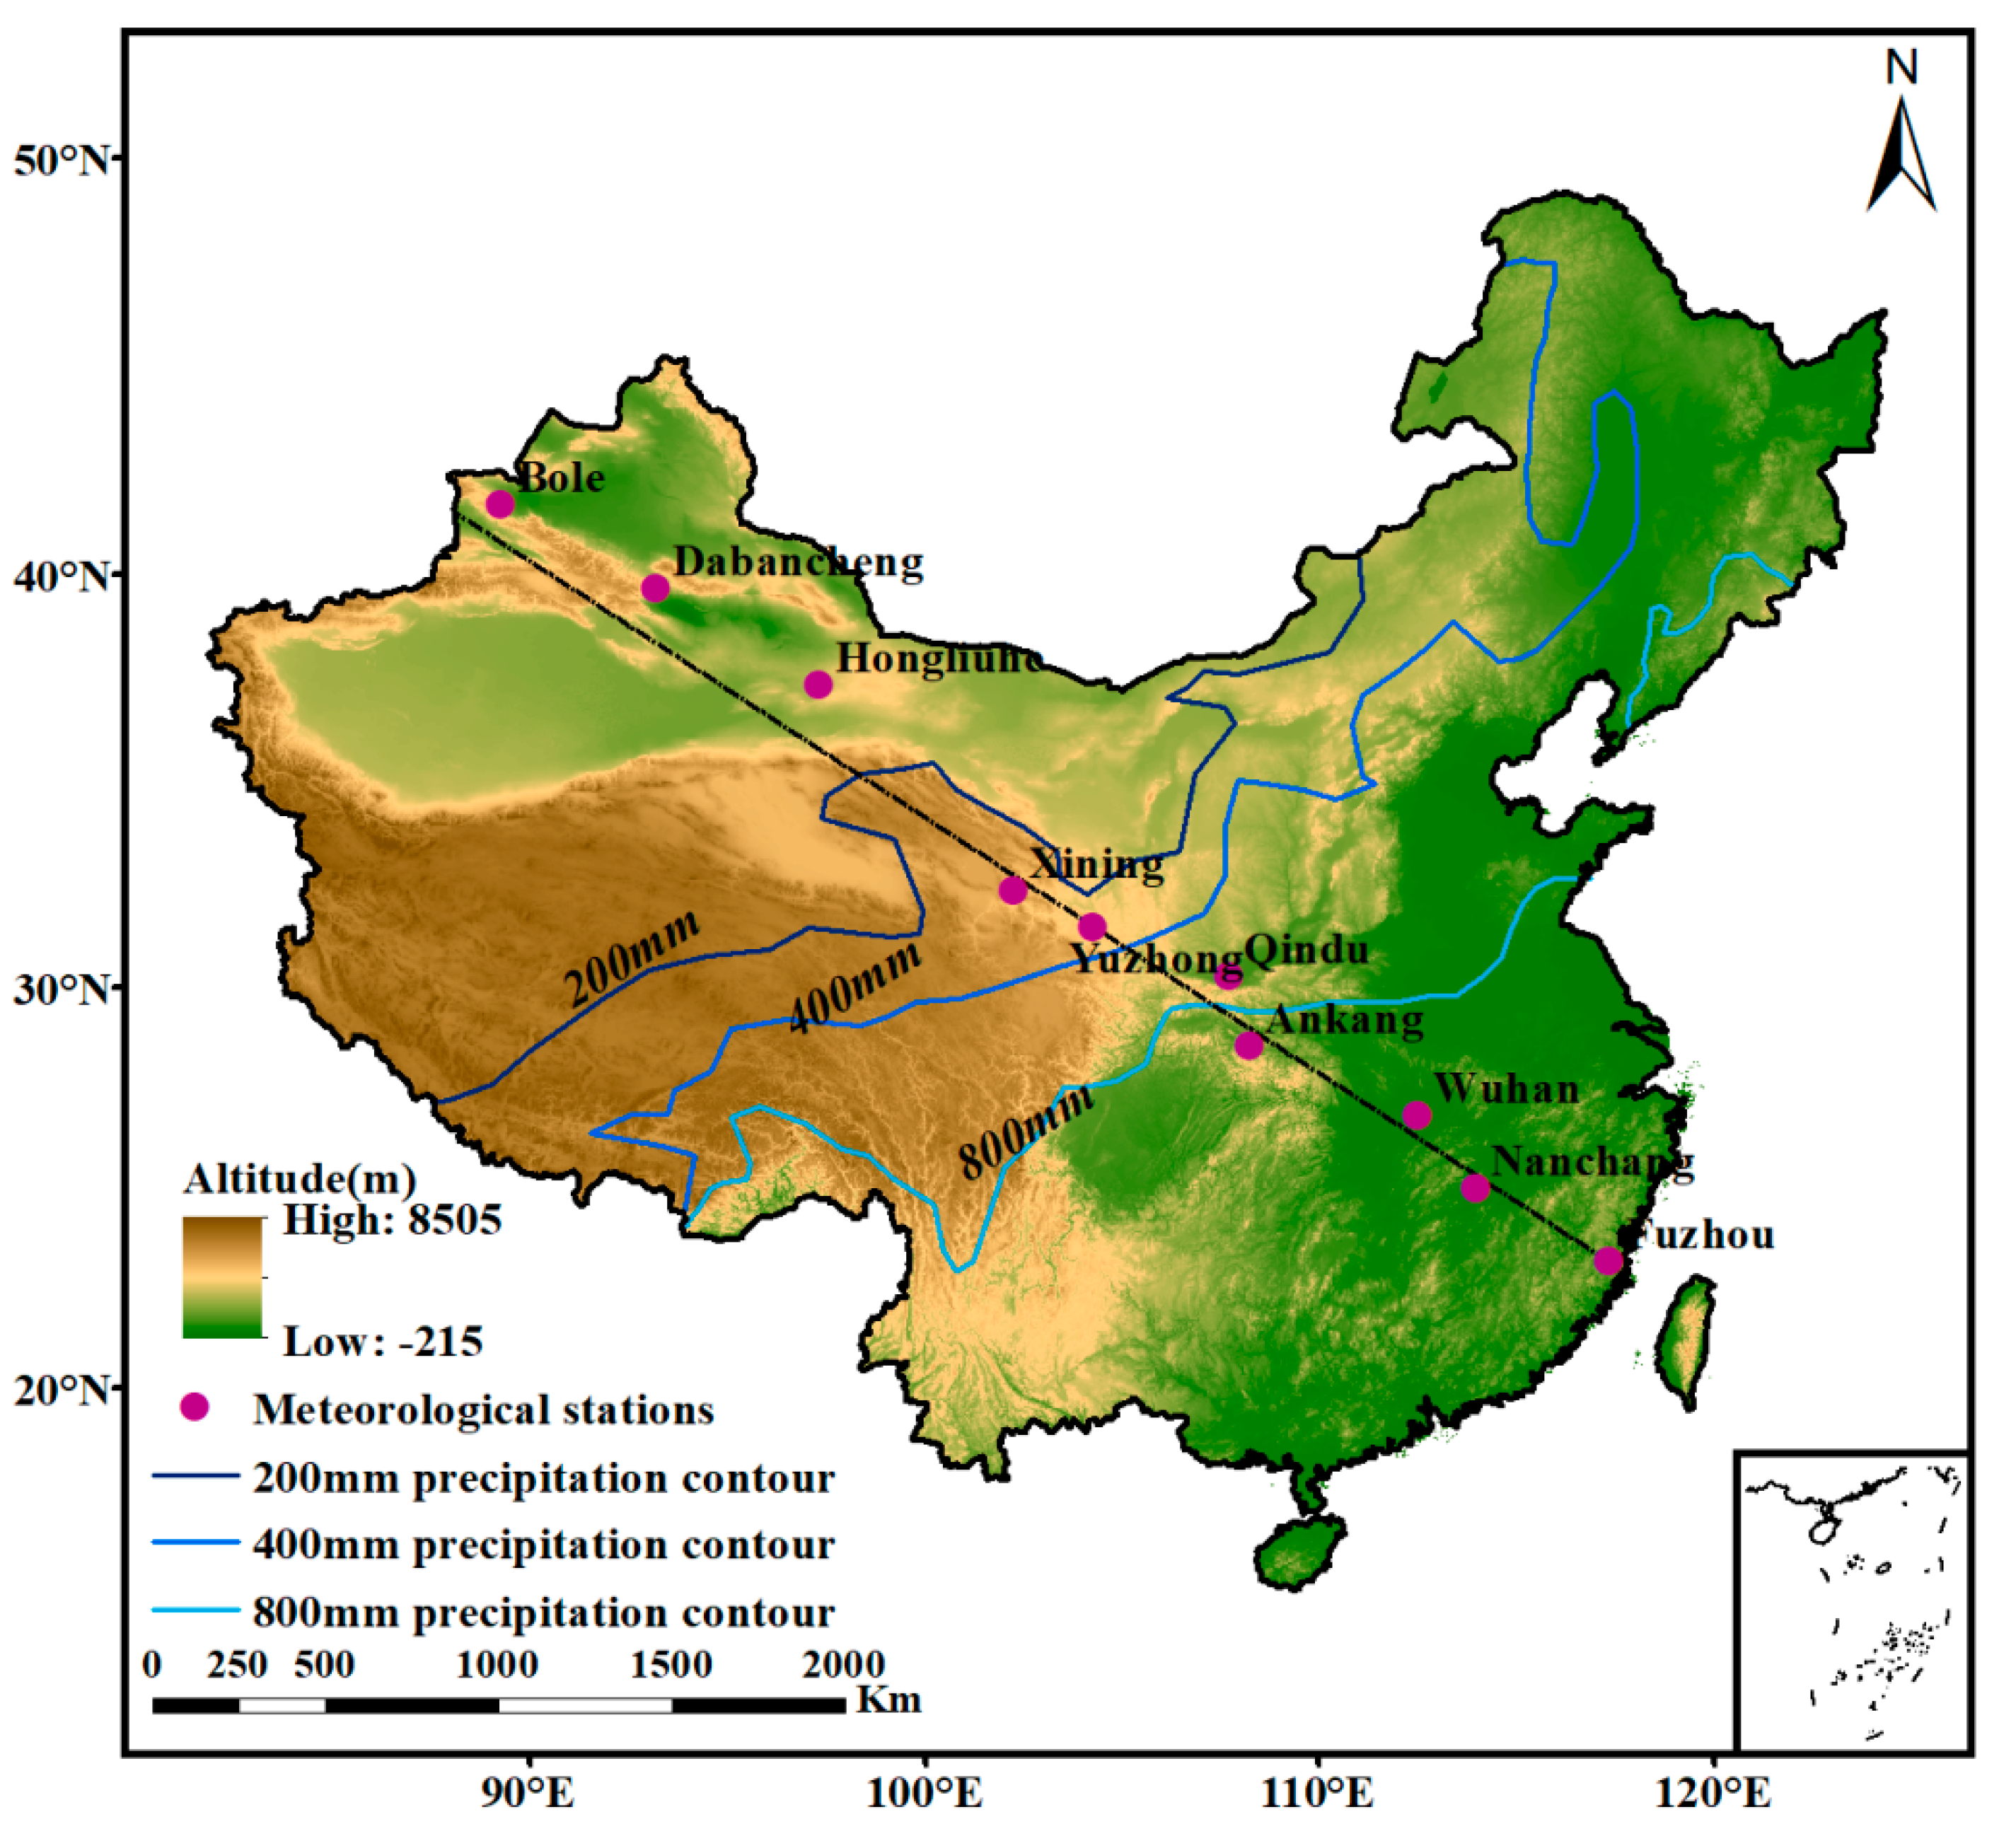
2.1. Weather Stations and Data Collection
2.2. Data Preprocessing
2.2.1. Selection of Precipitation Indices
2.2.2. Computation of Precipitation Indices
2.3. Data Analysis
3. Results
3.1. Temporal Change of Precipitation from Southeast to the Northwest China
3.1.1. Interannual Trend Changes of Annual Precipitation Indices
3.1.2. Interannual Trend Changes of Seasonal Precipitation Indices
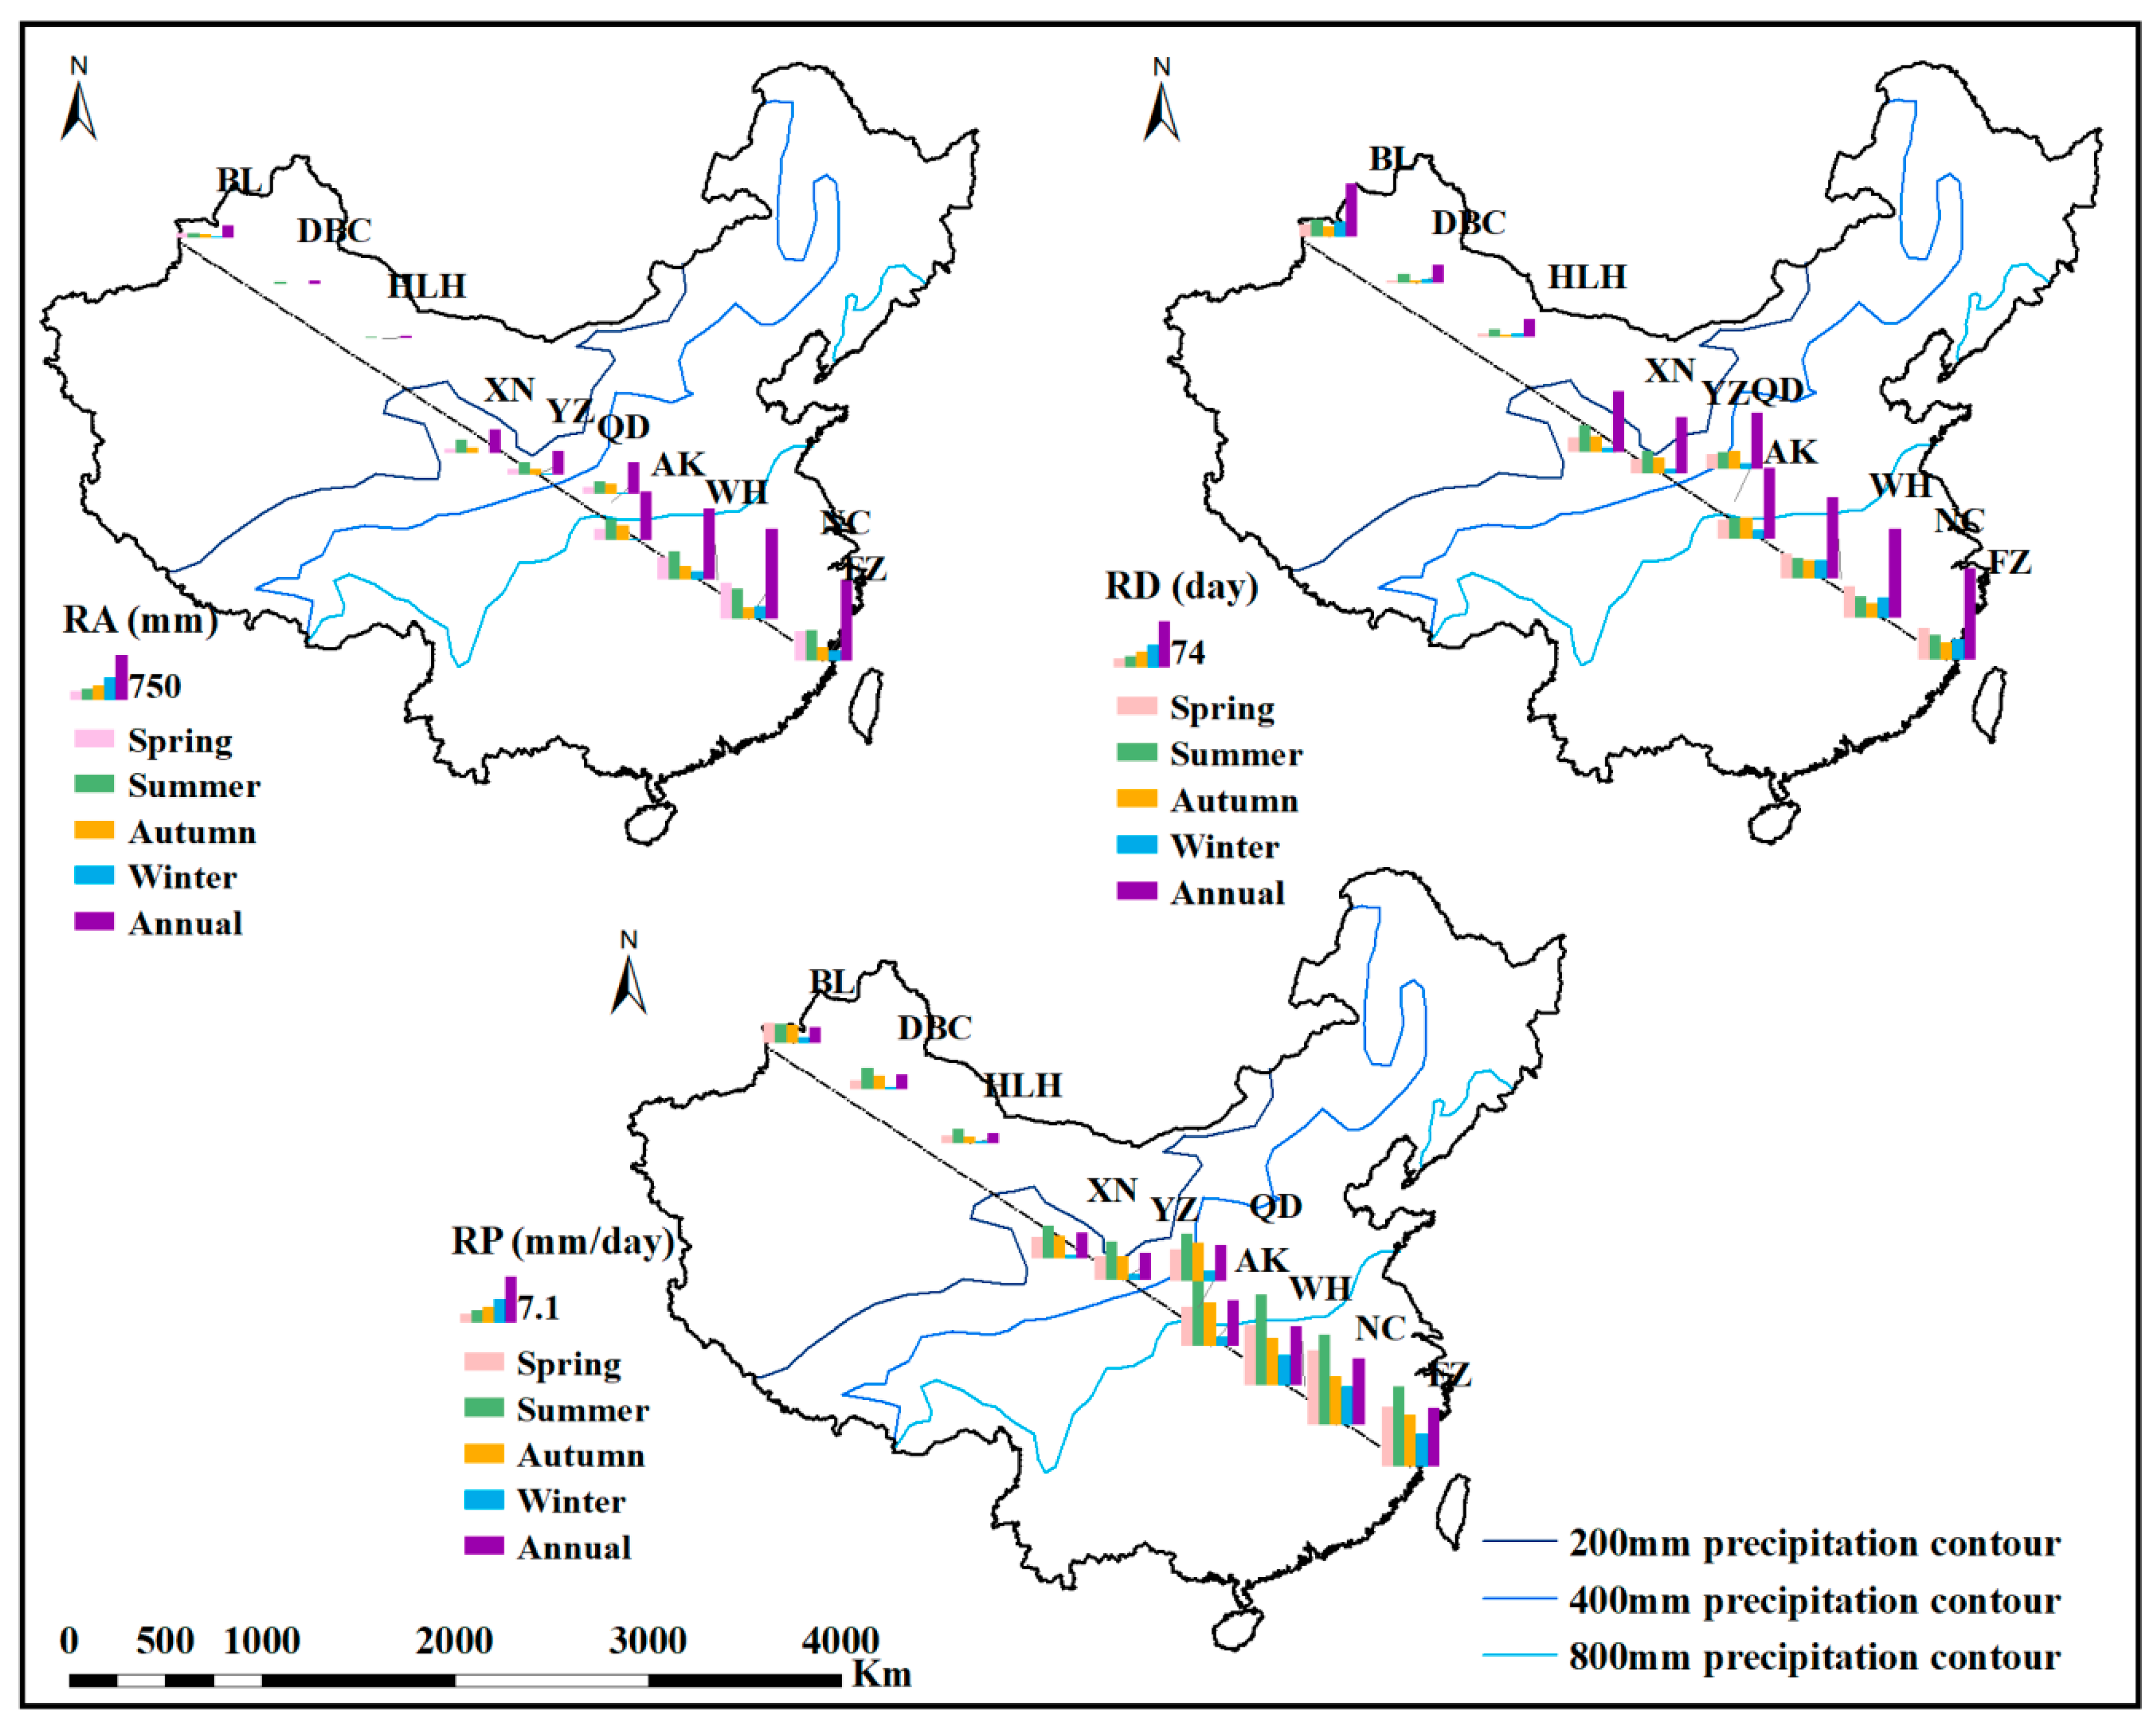
3.2. Spatial Variation of Precipitation Indices from Southeast to the Northwest China
3.2.1. Spatial Variation of Precipitation Indices from 1961 to 2017
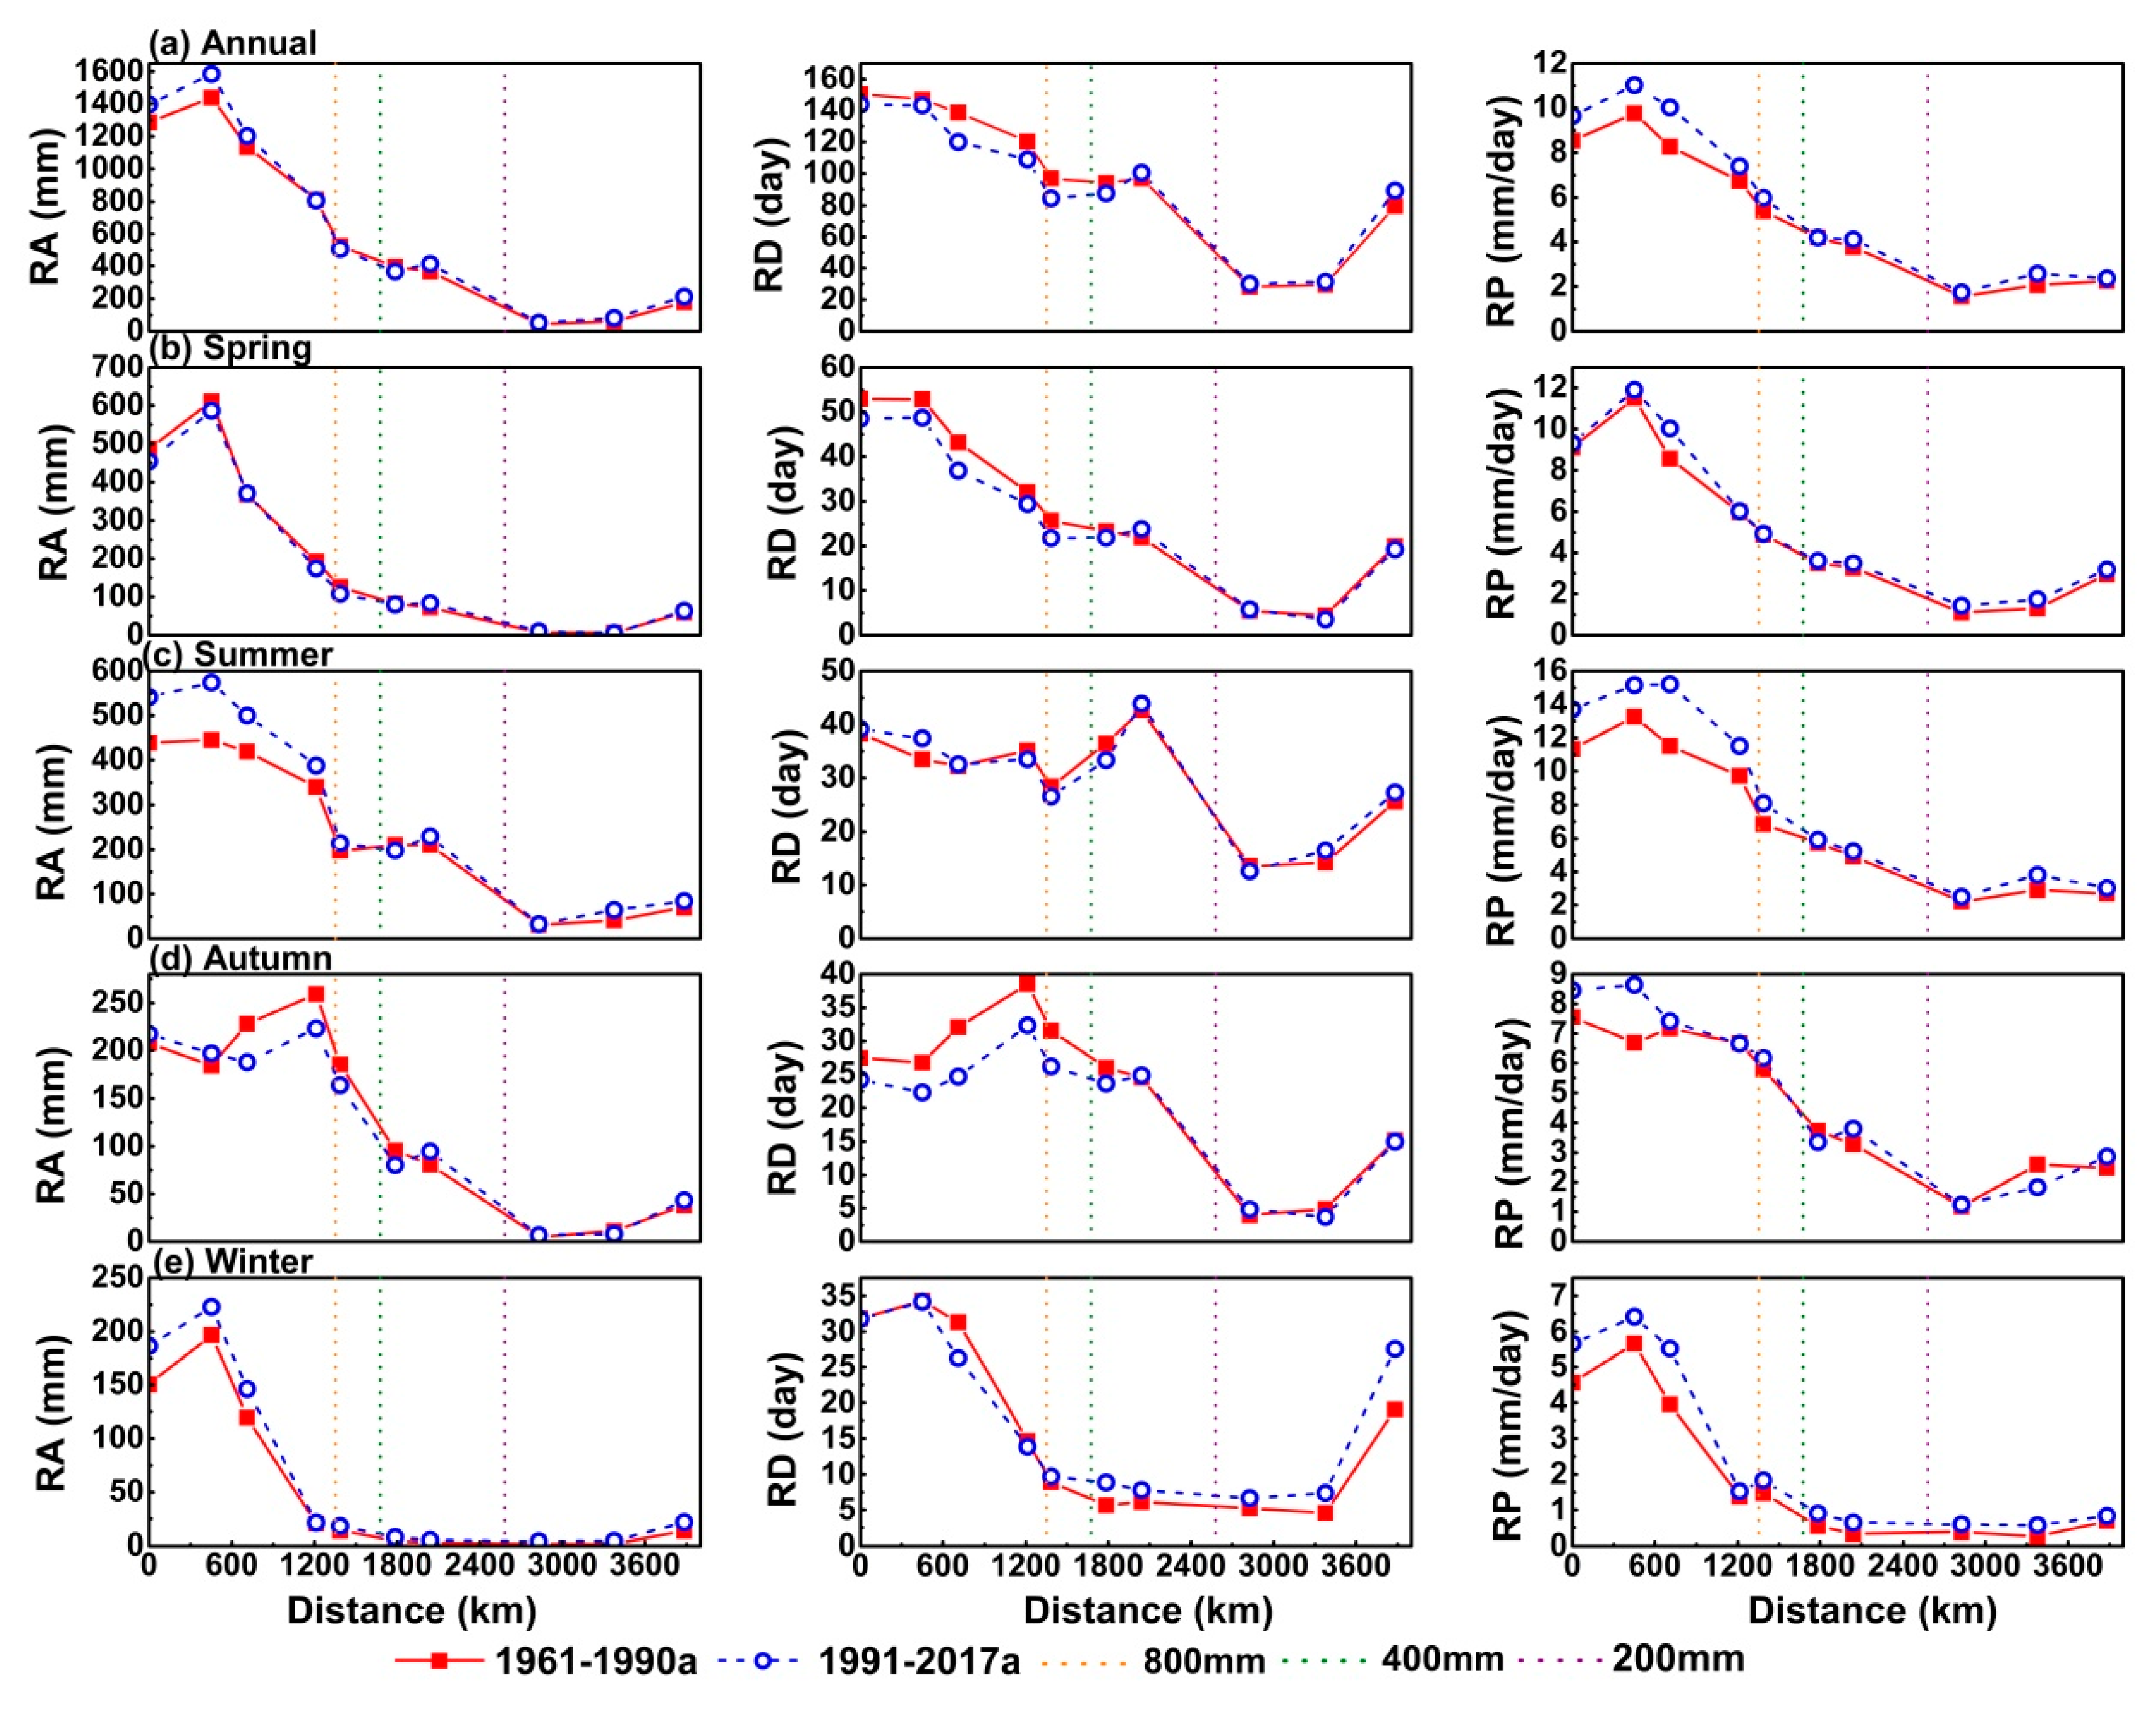
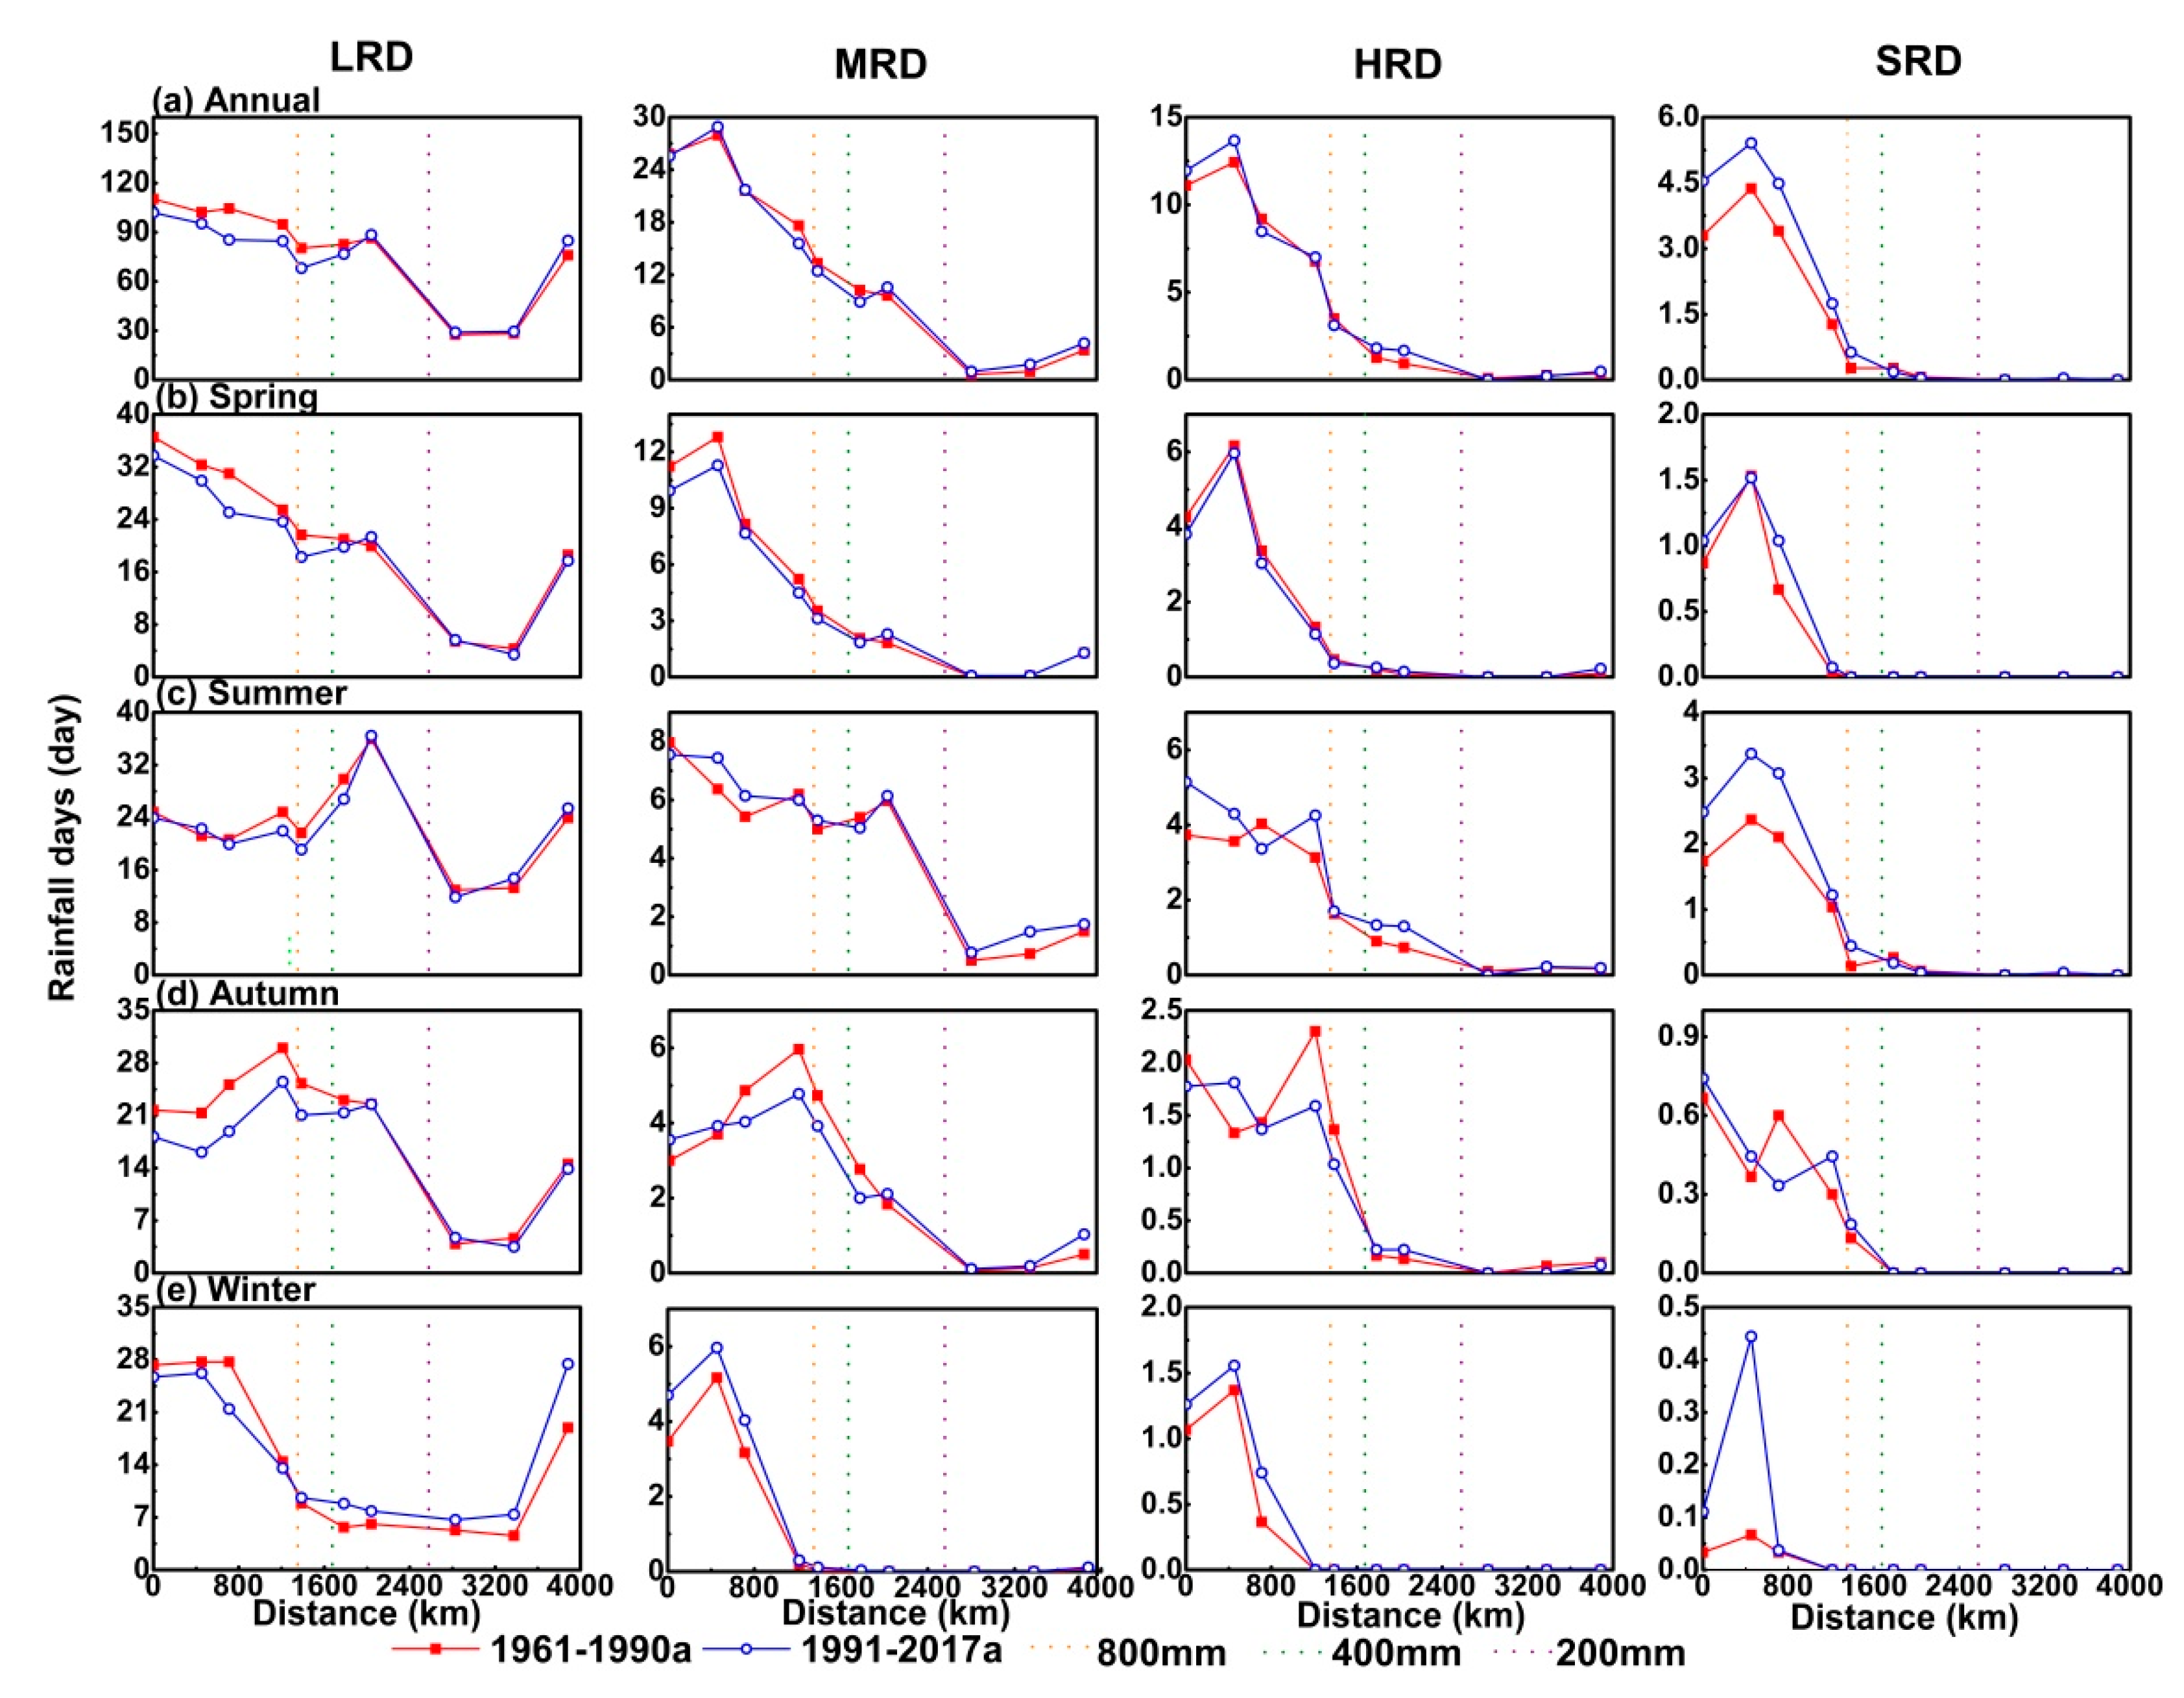
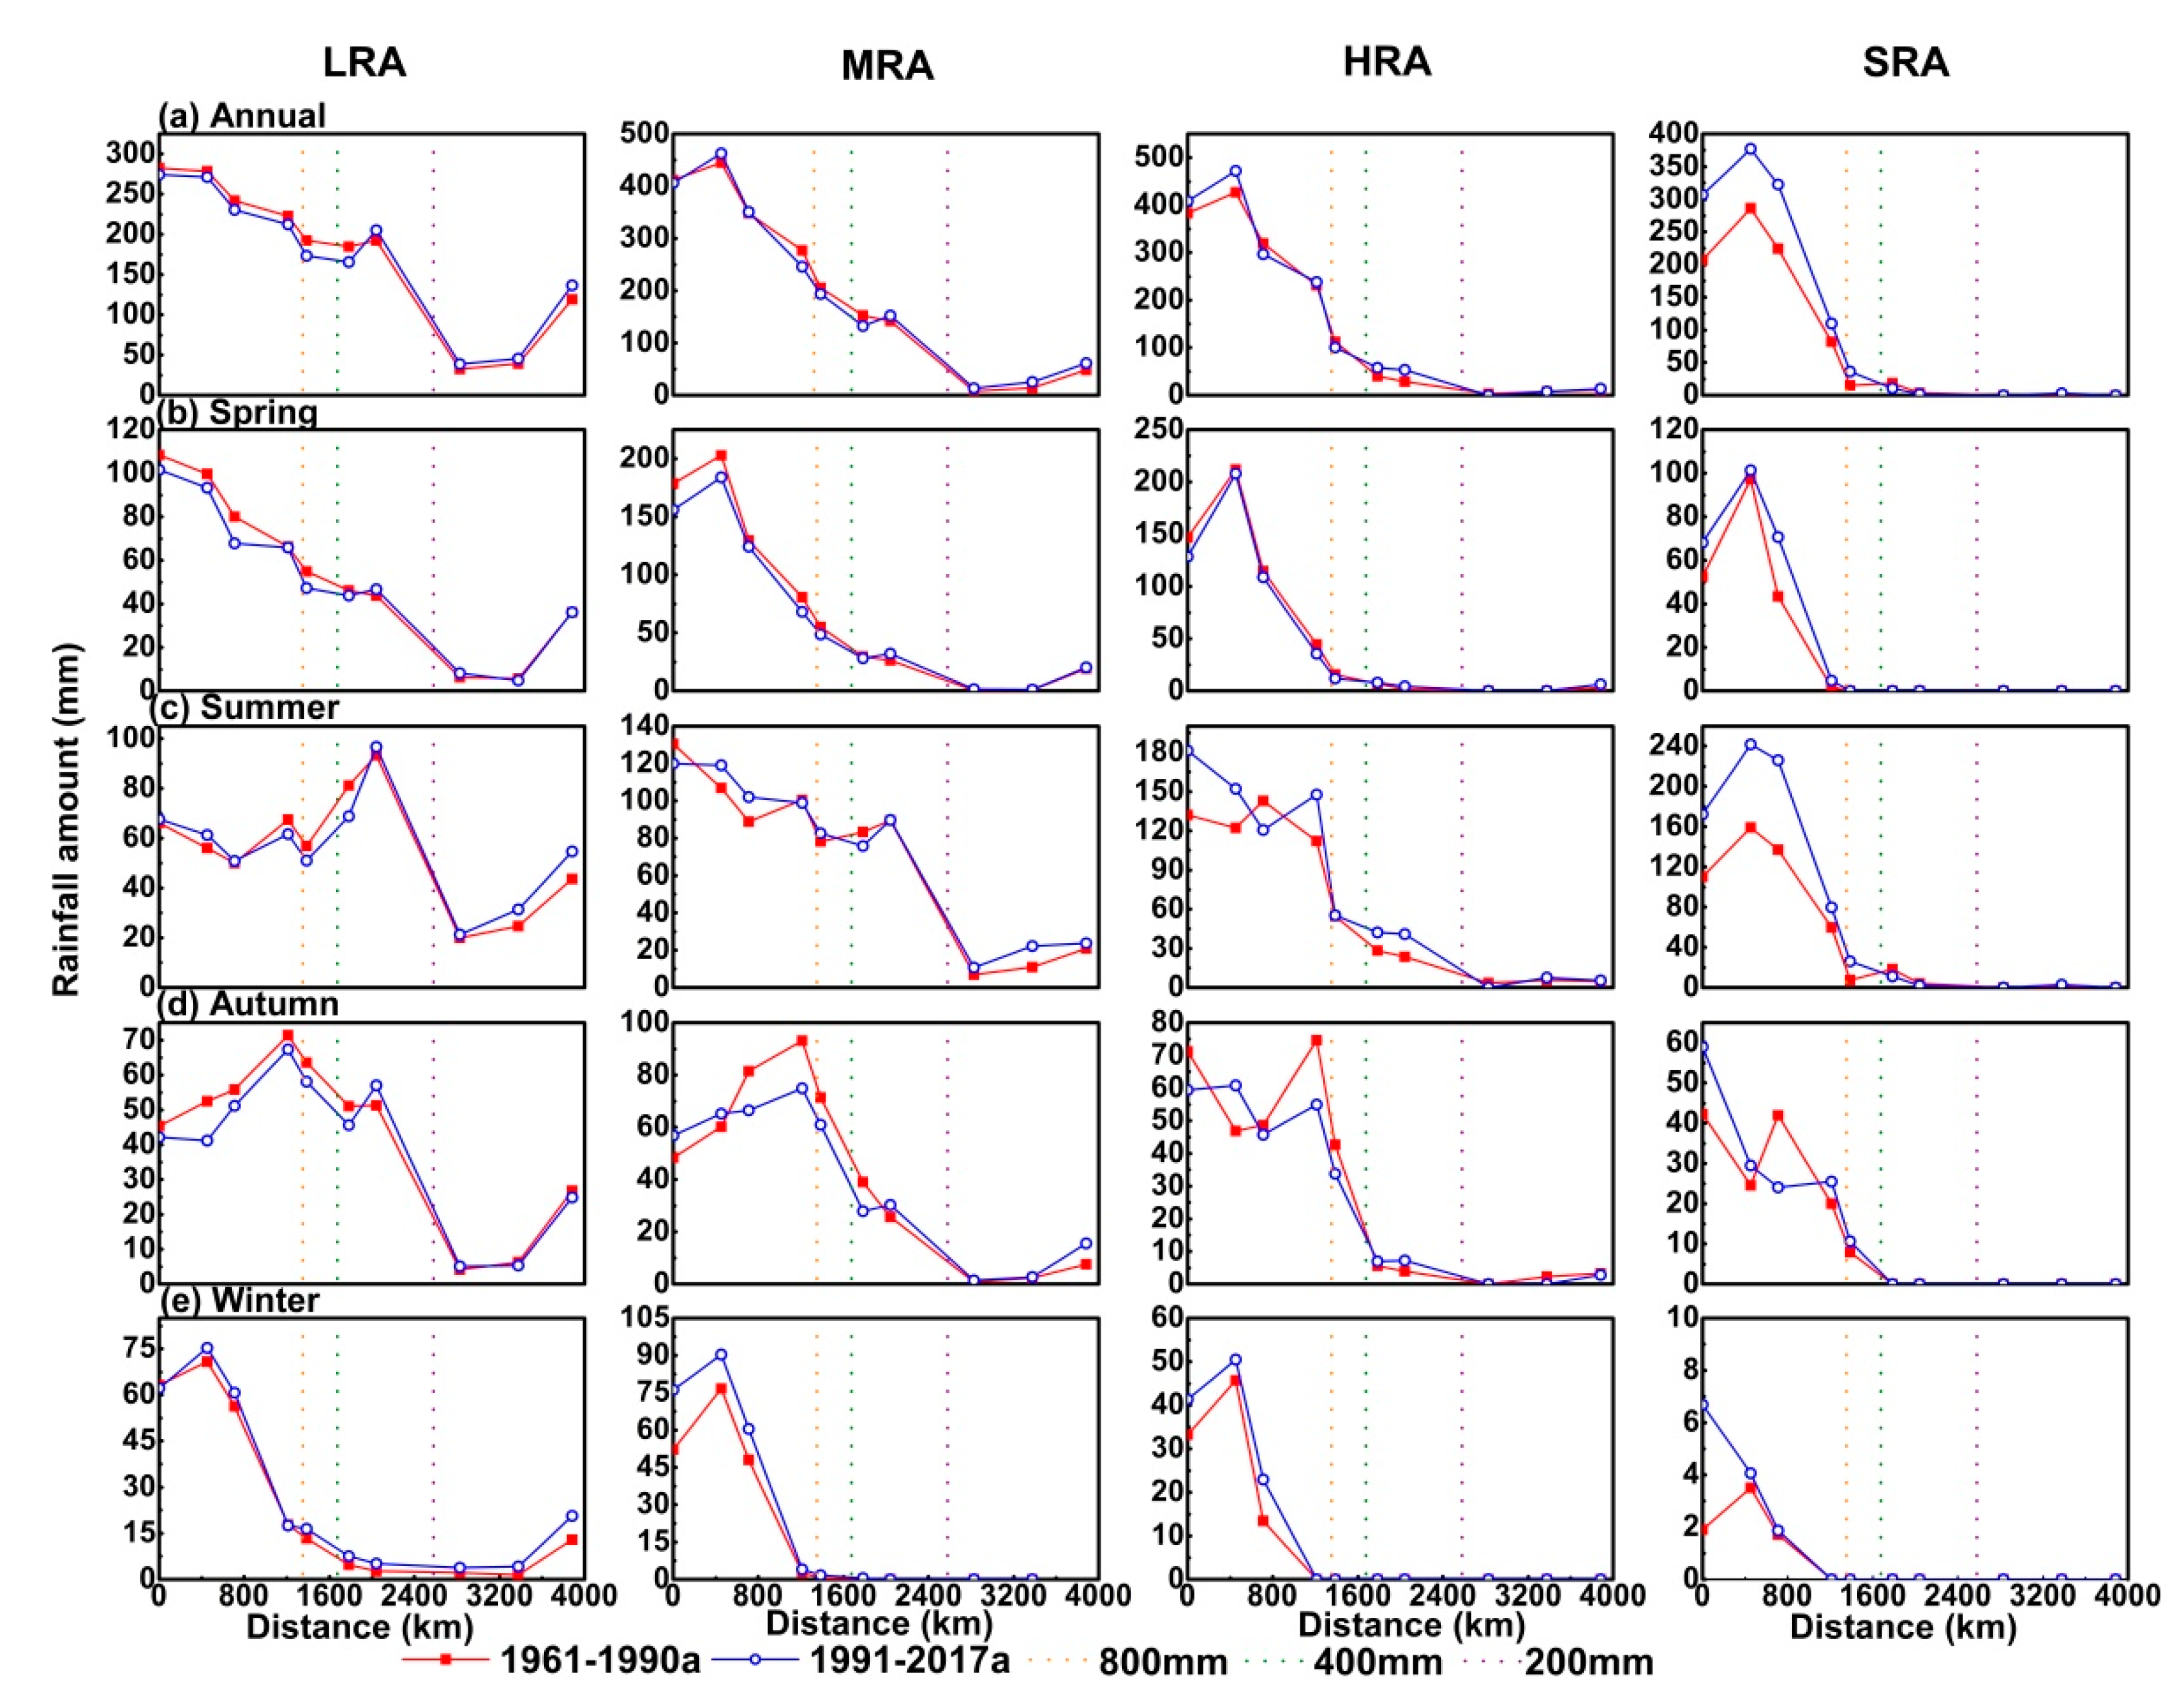
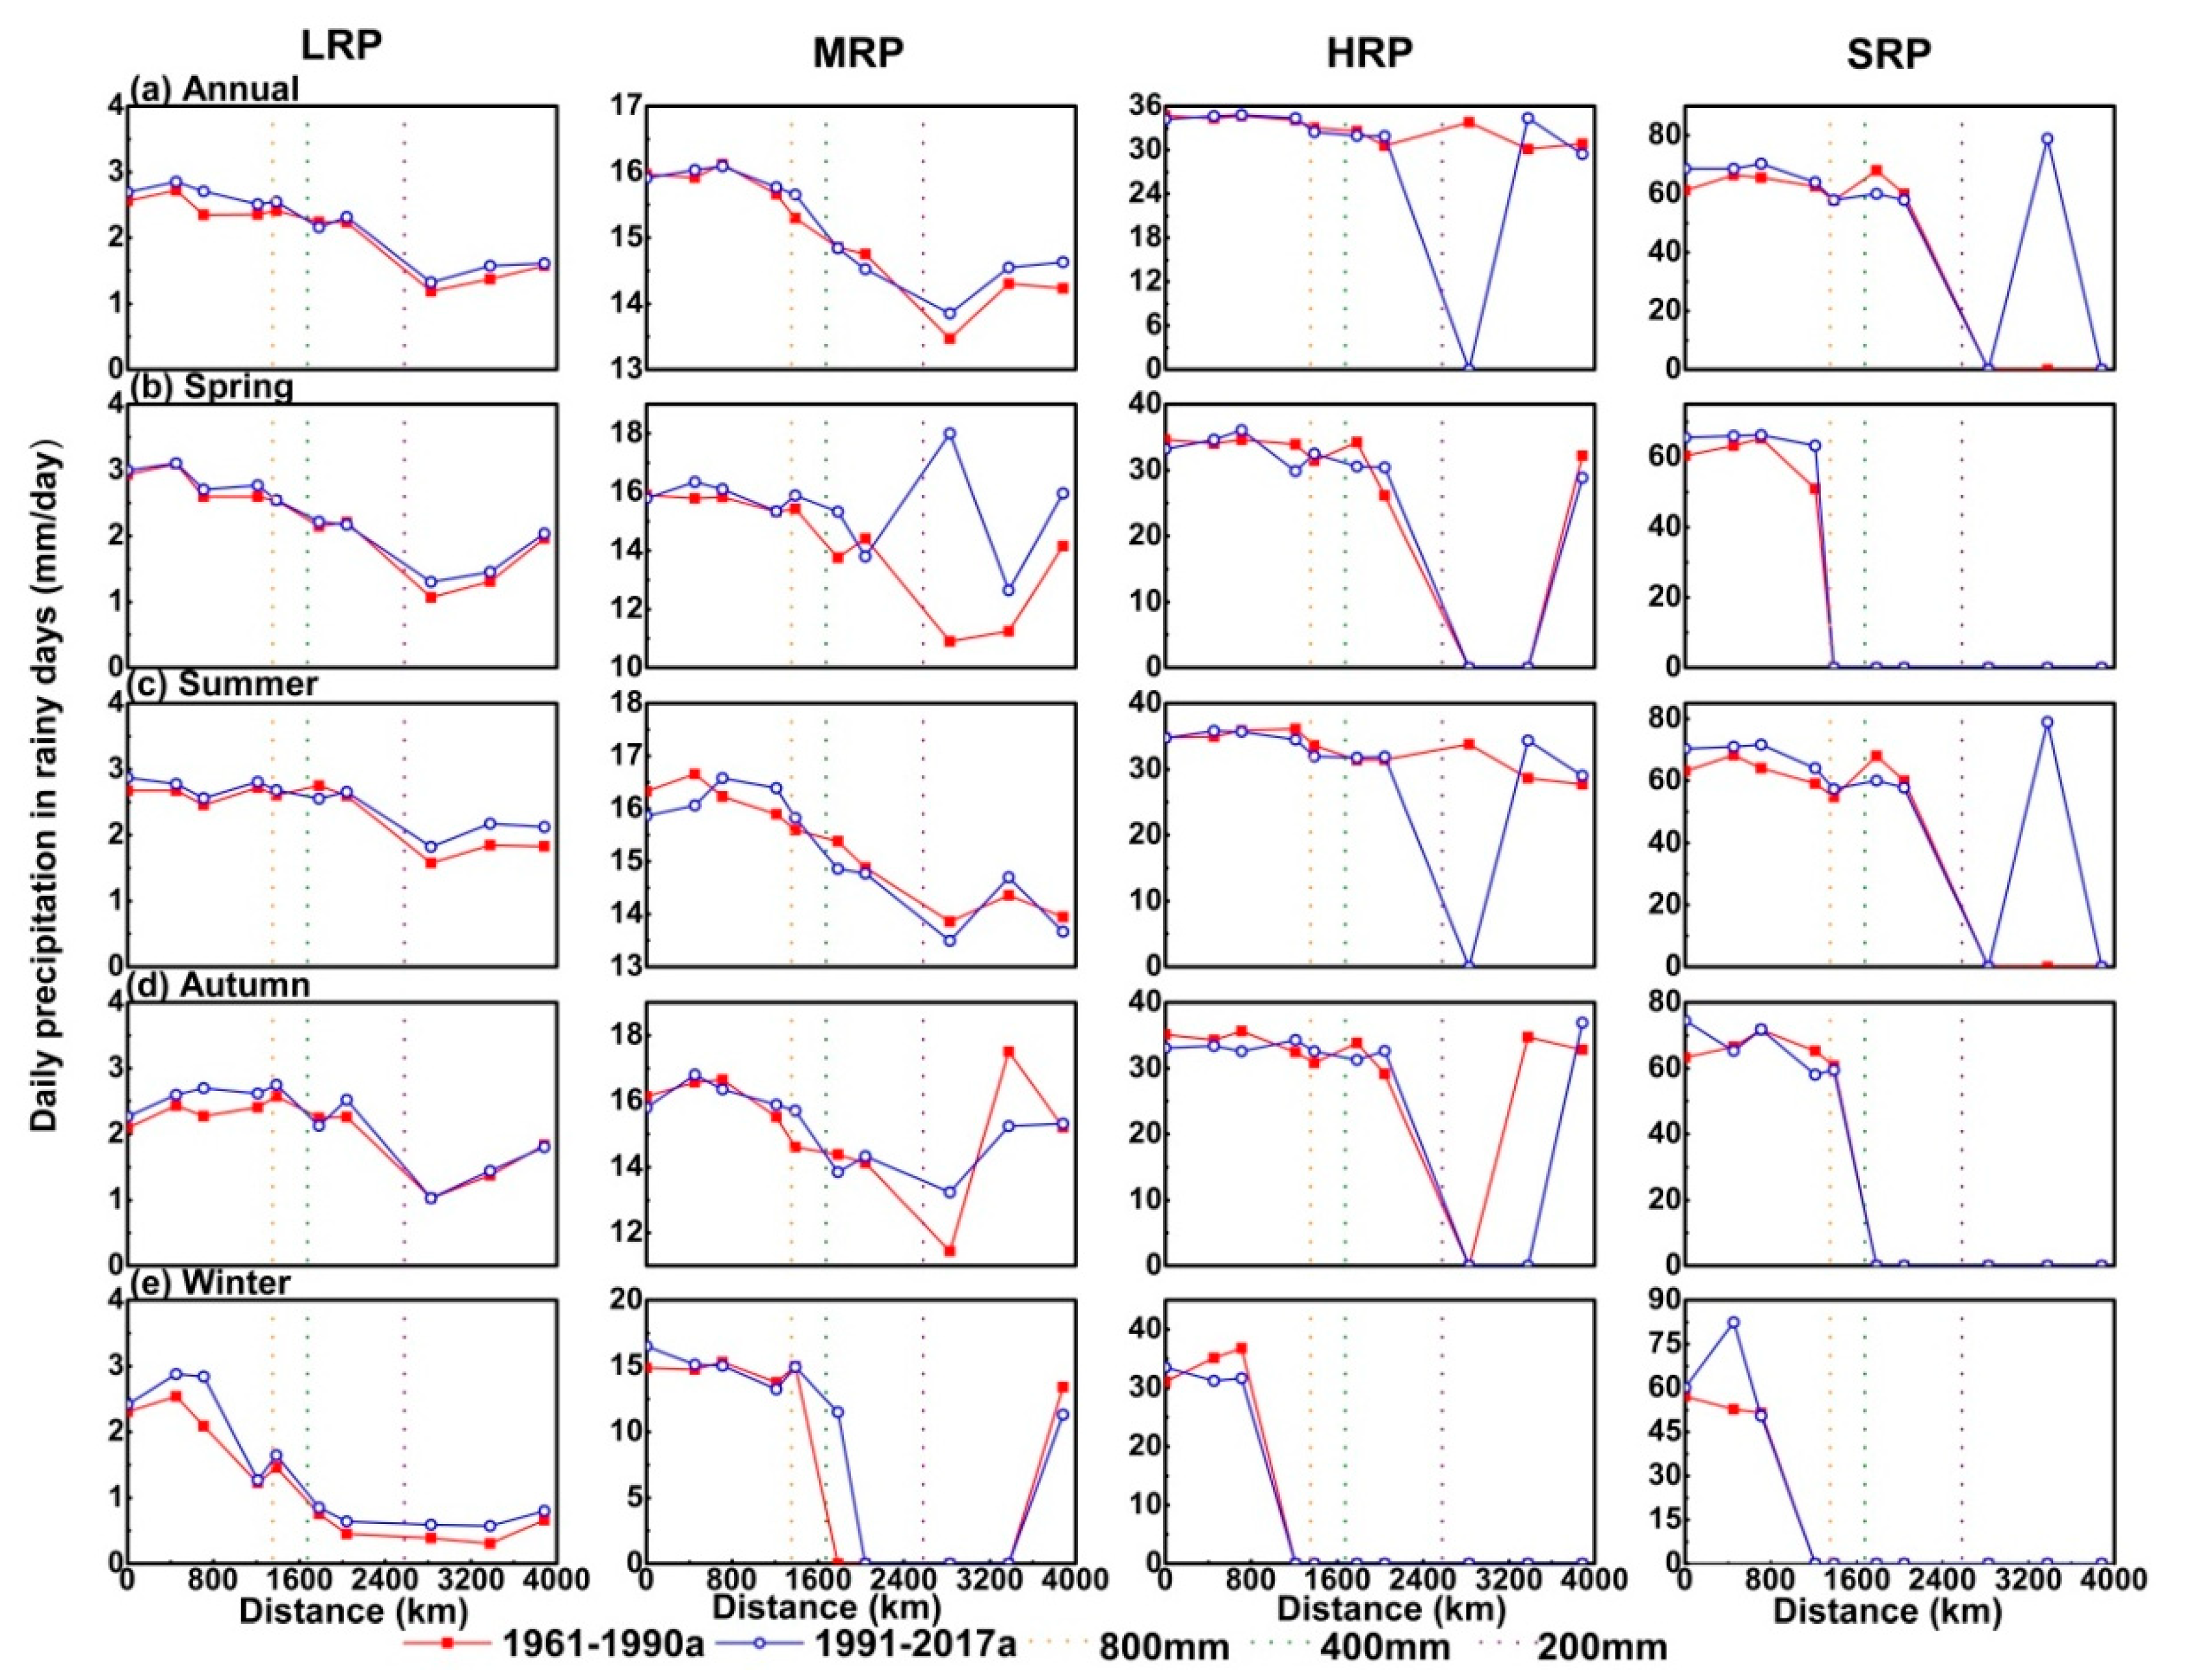
3.2.2. Comparison of Precipitation Indices between 1961–1990 and 1991–2017
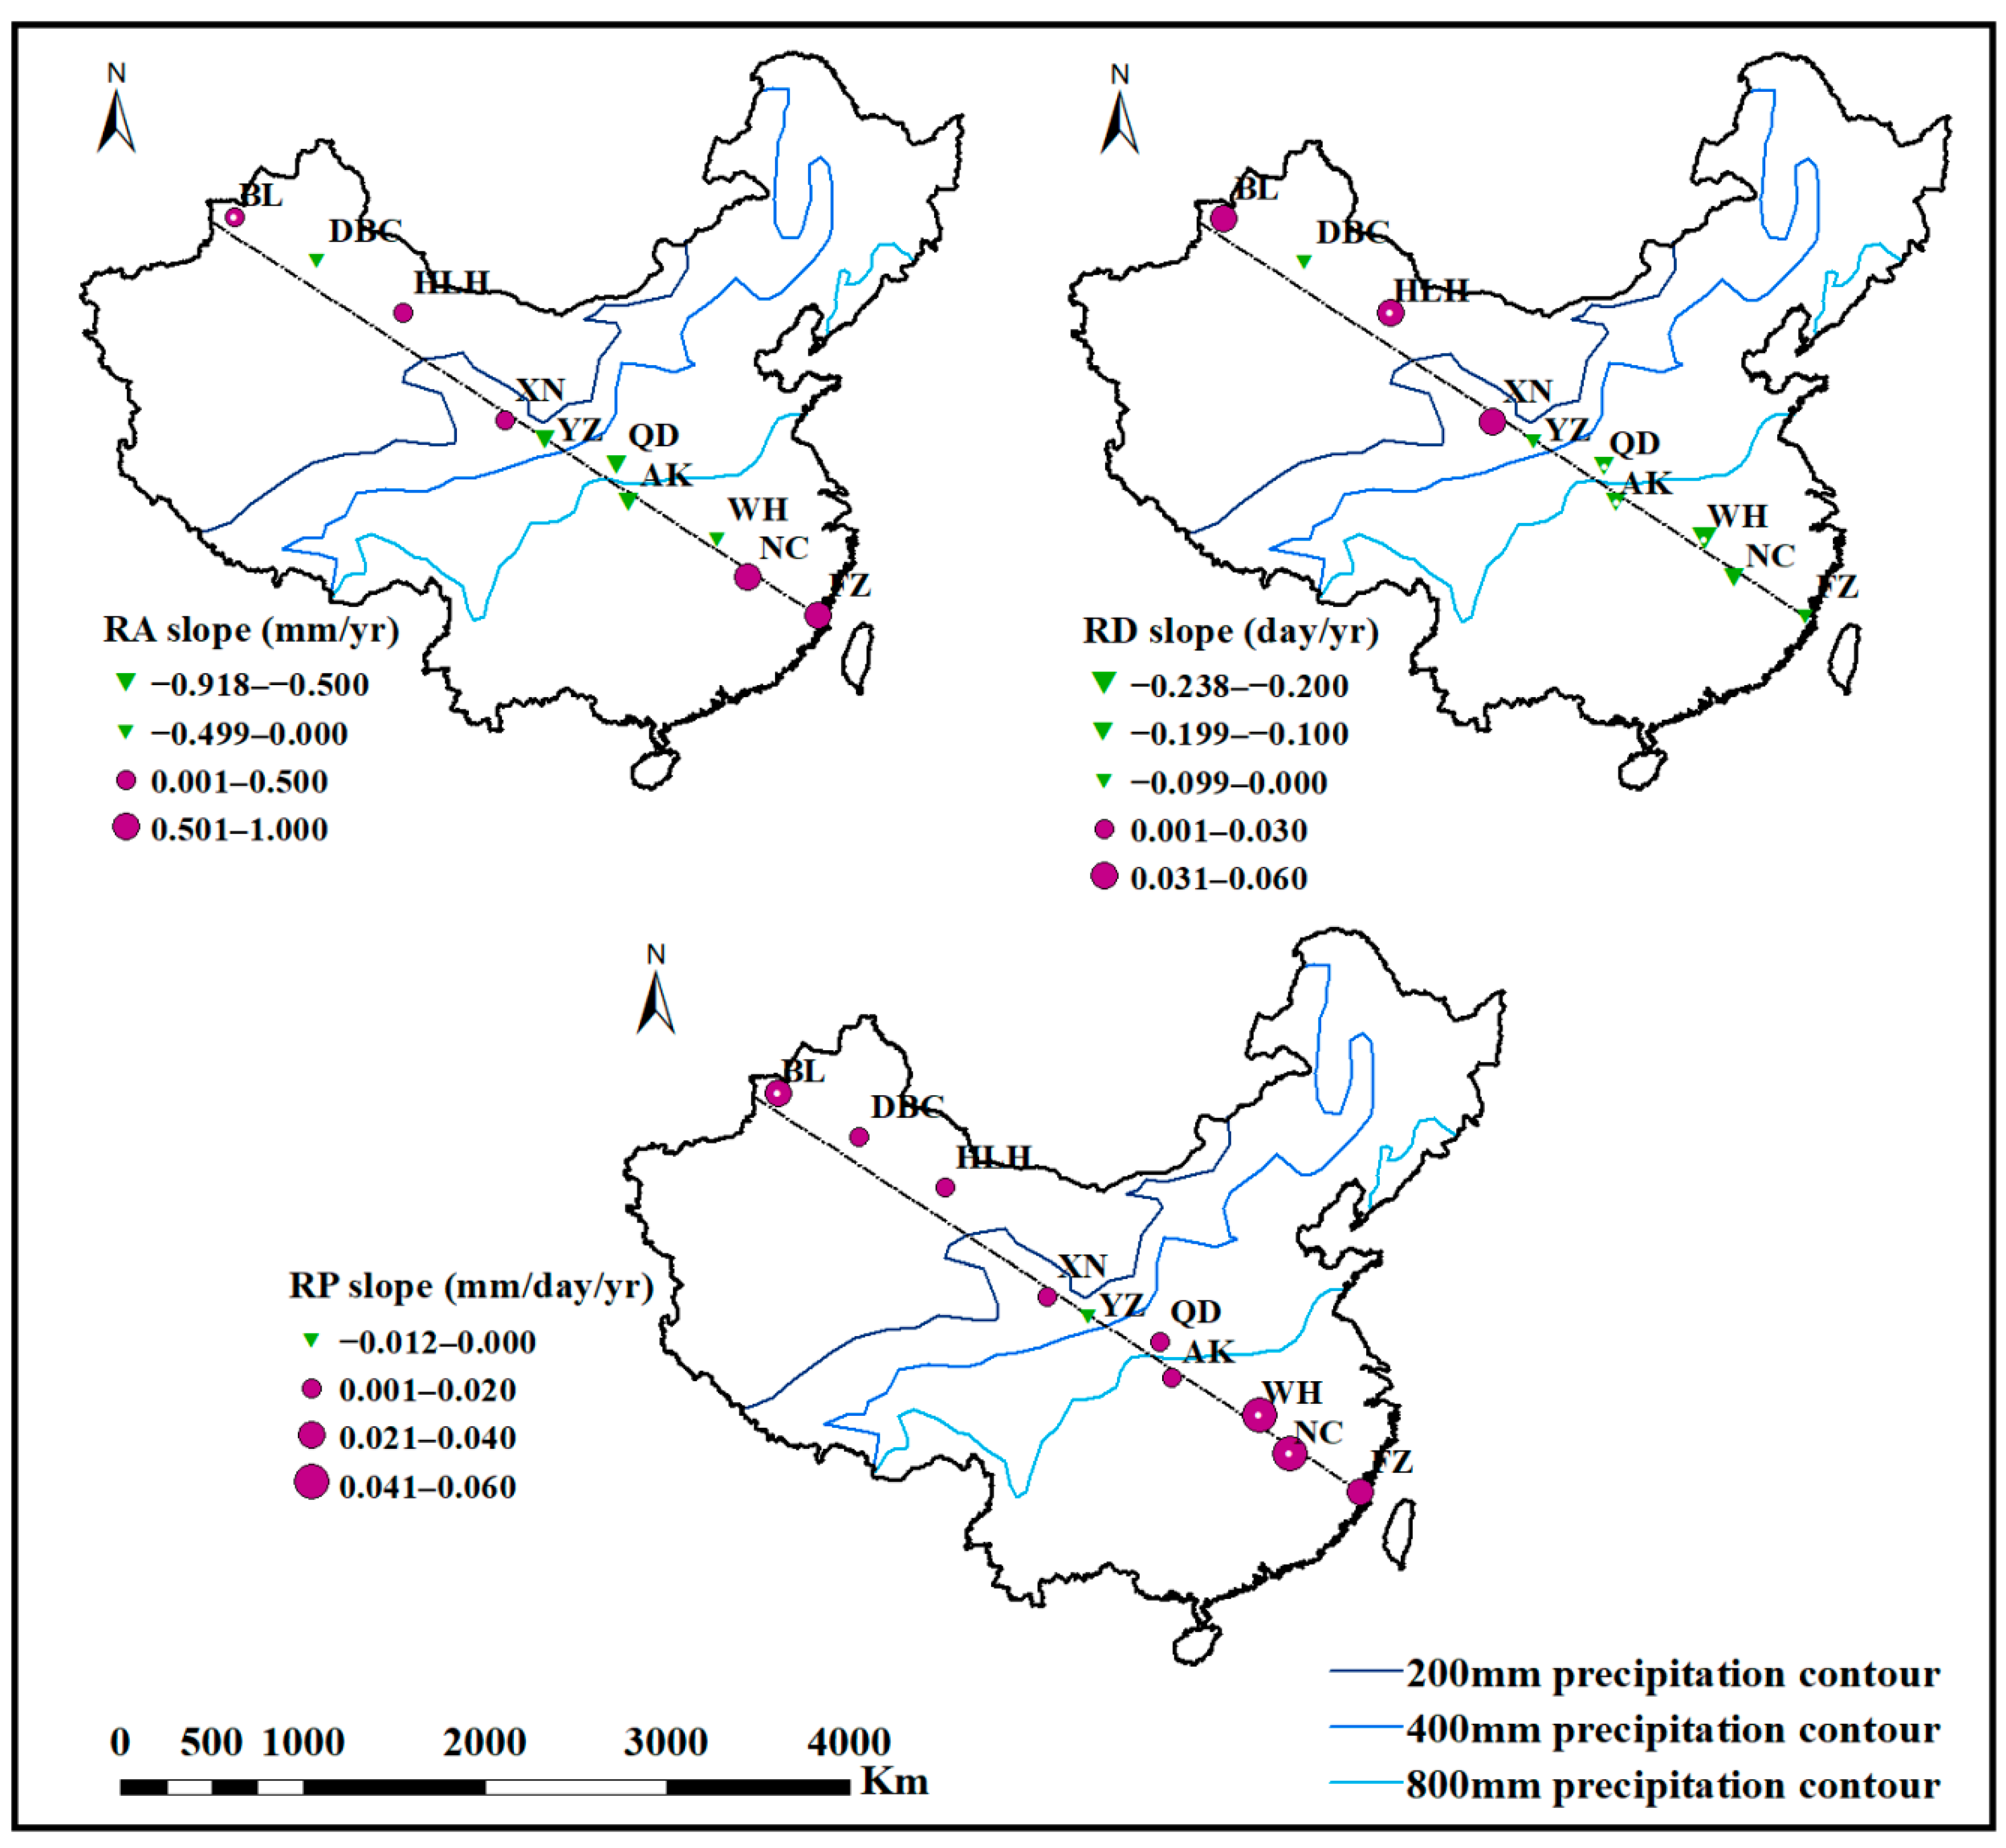
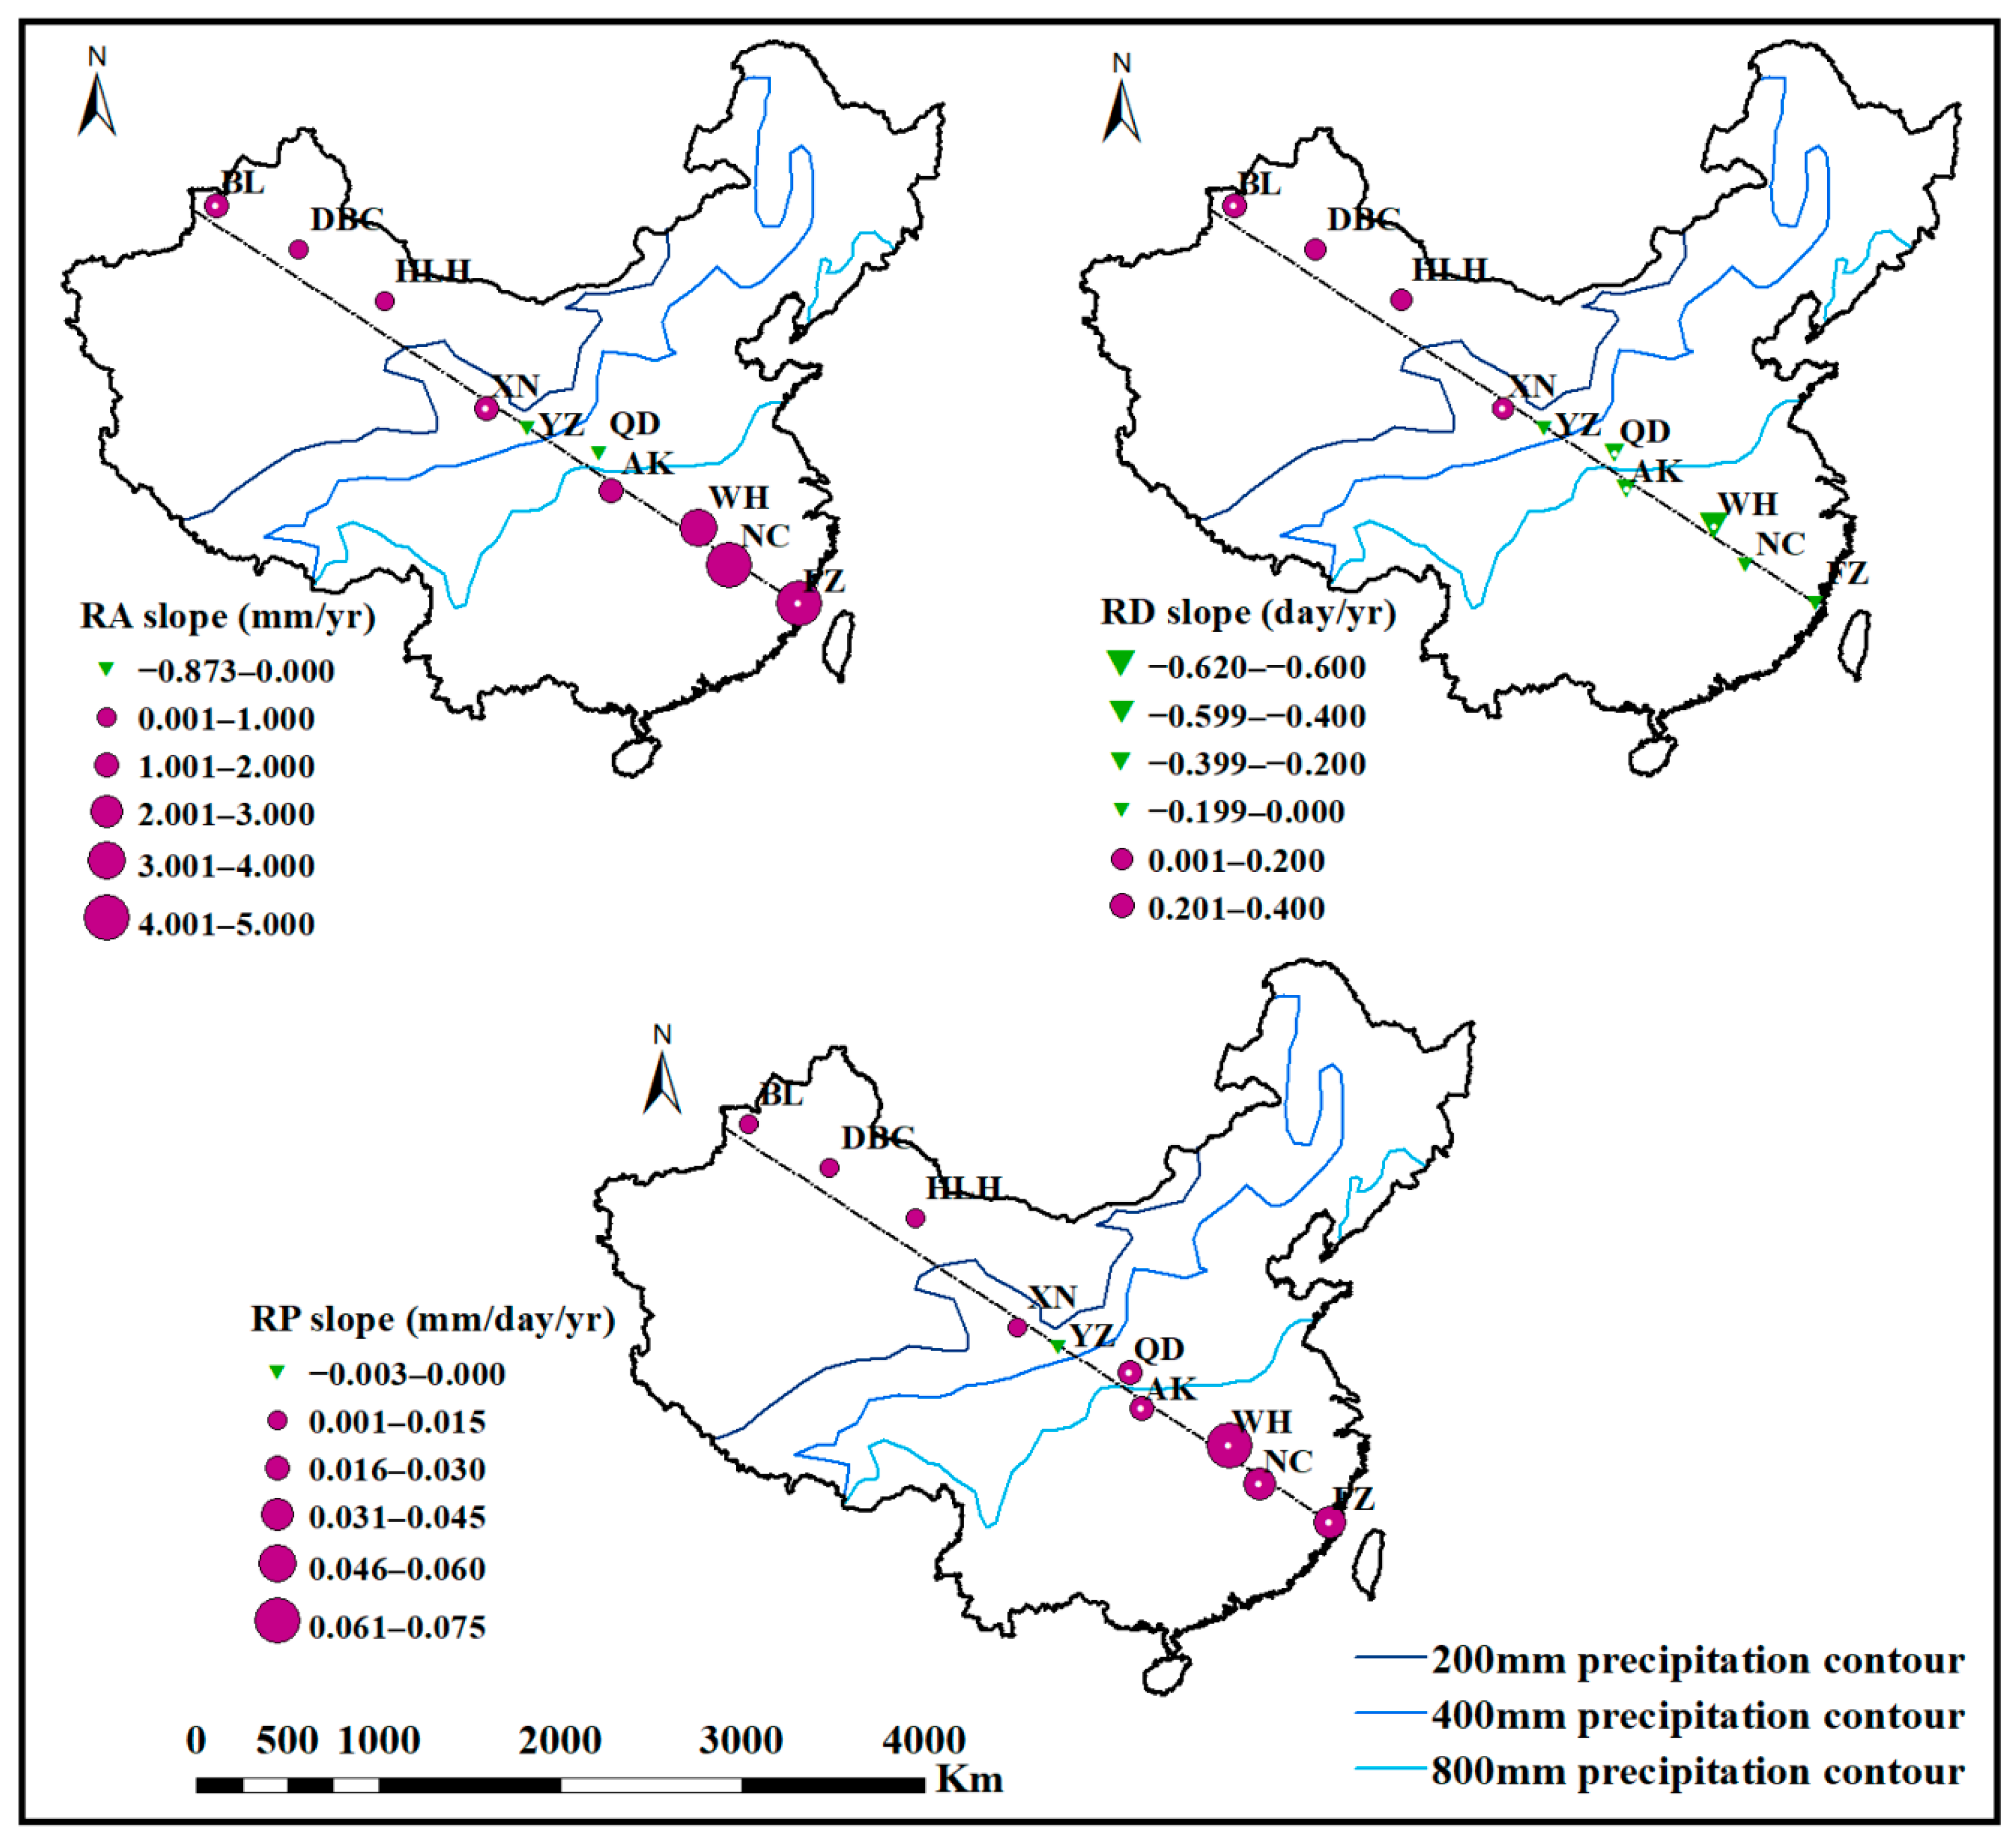
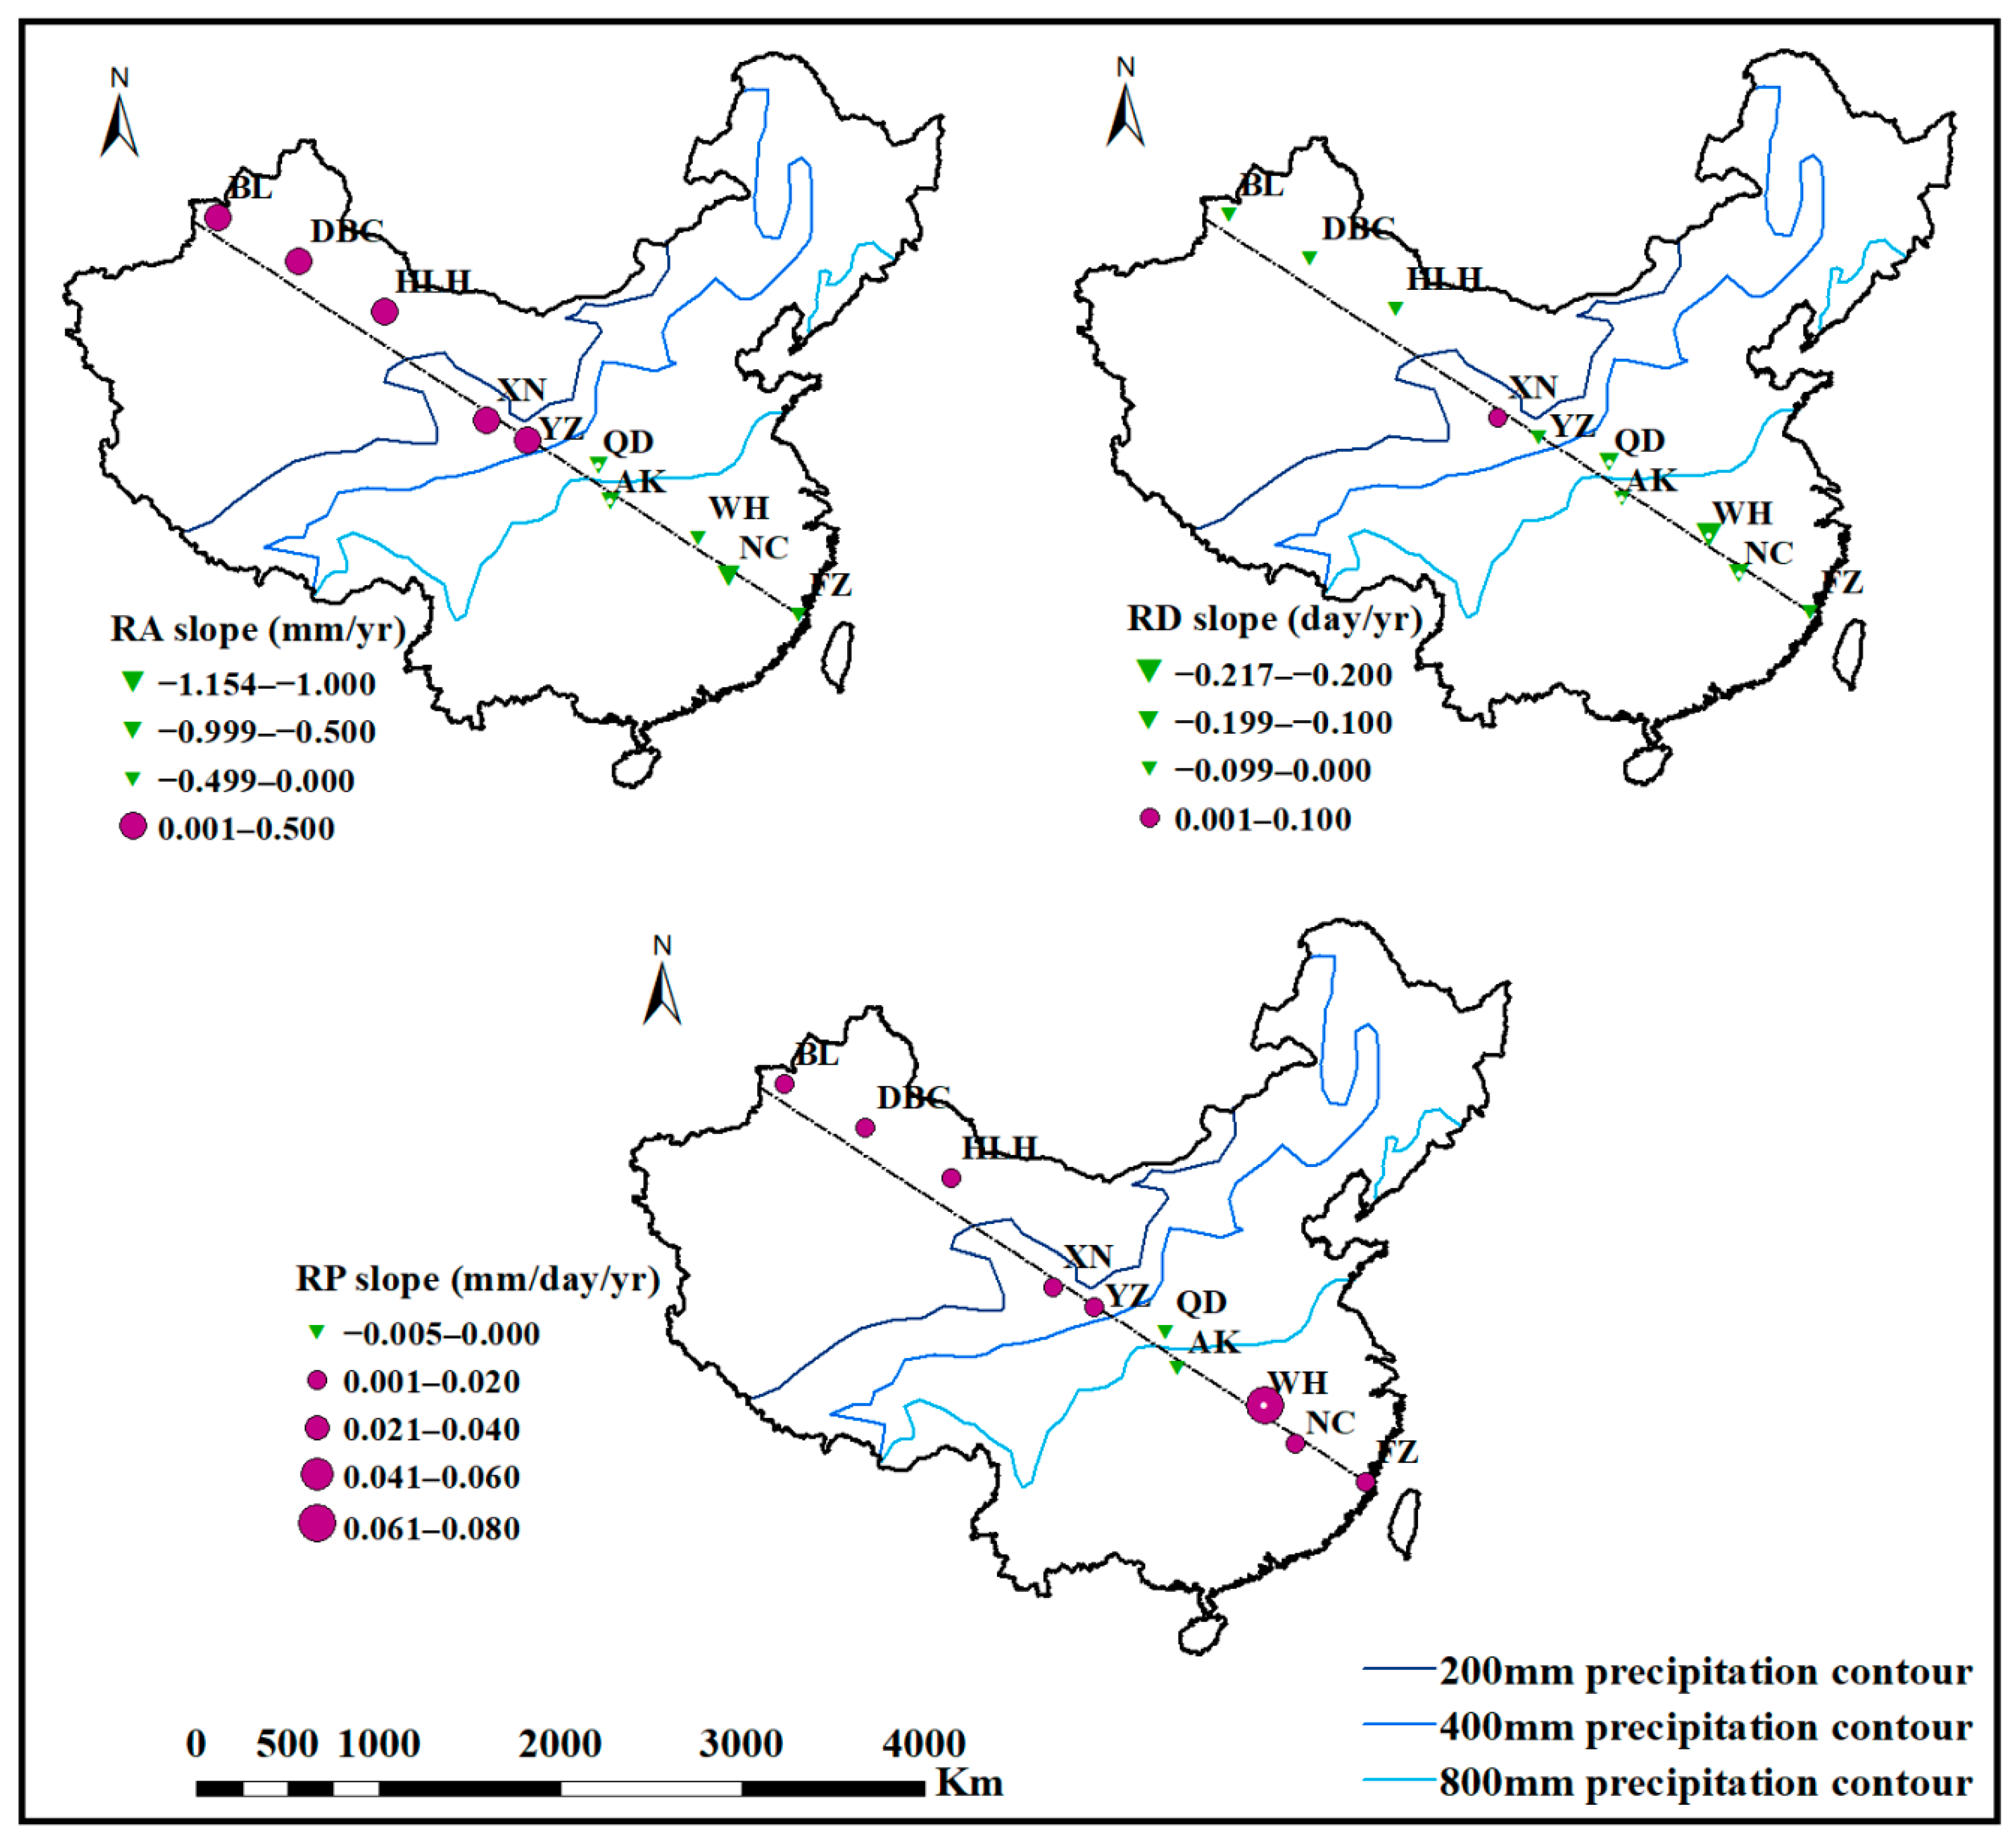
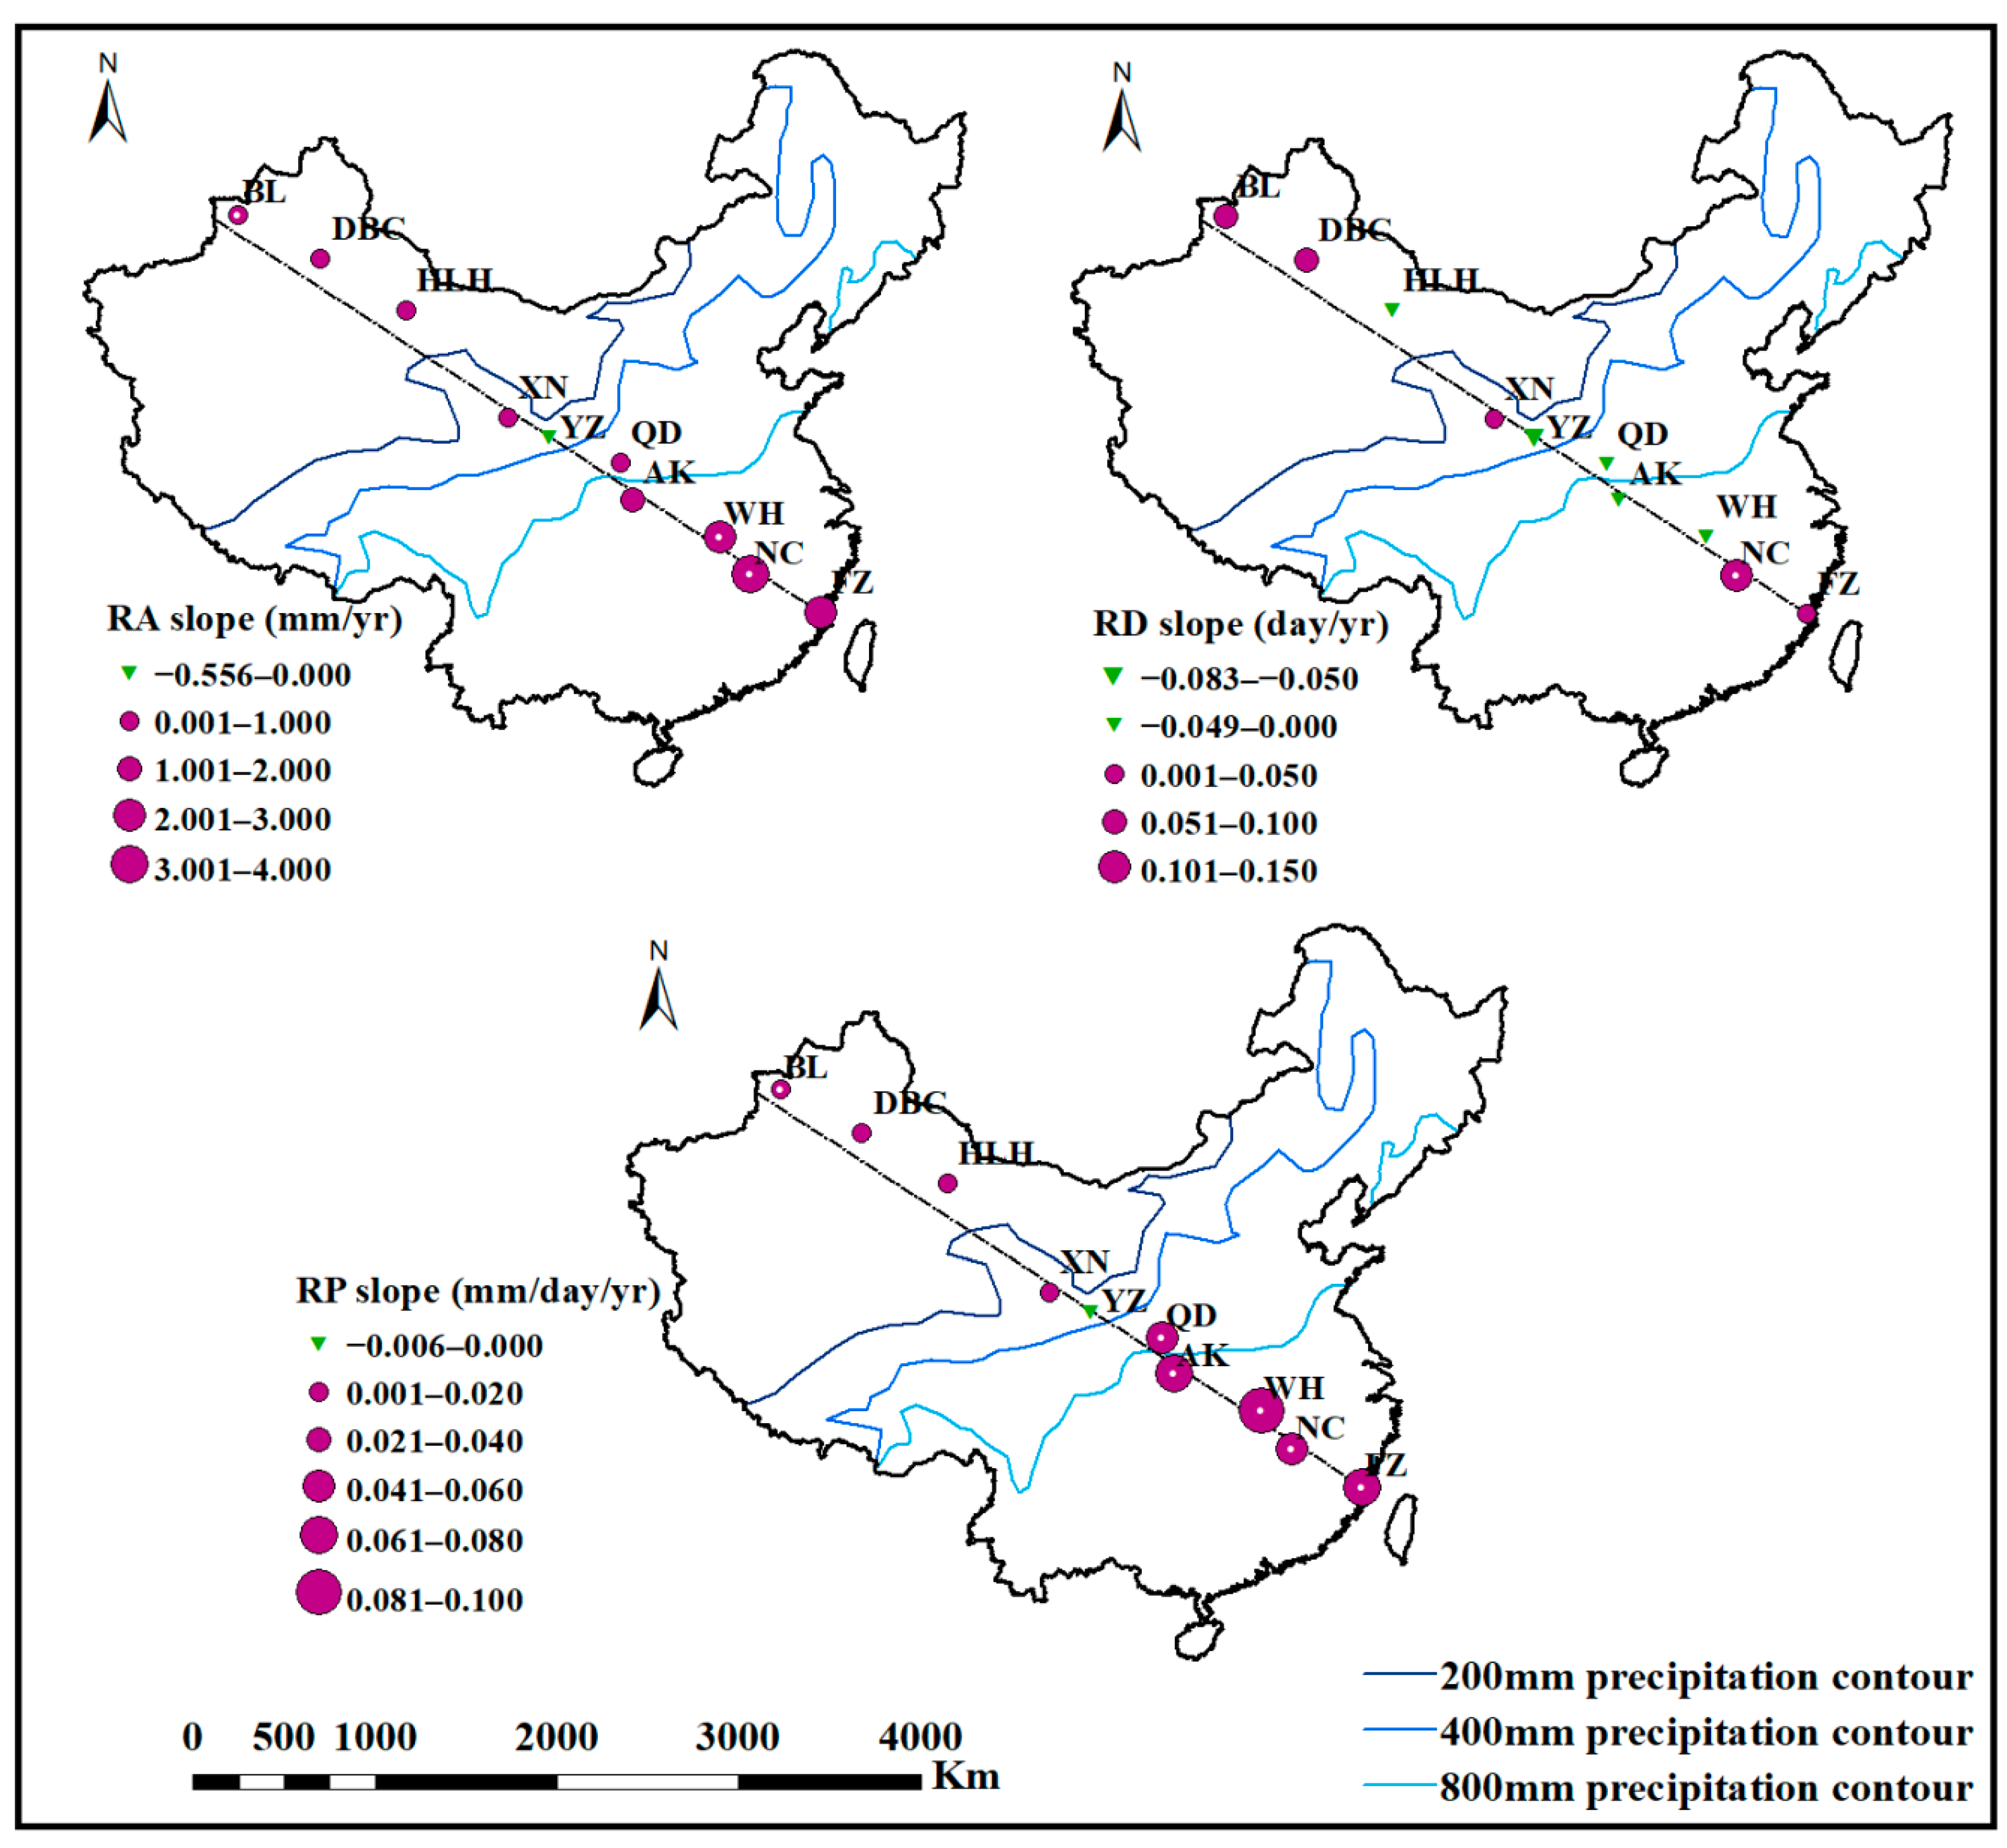
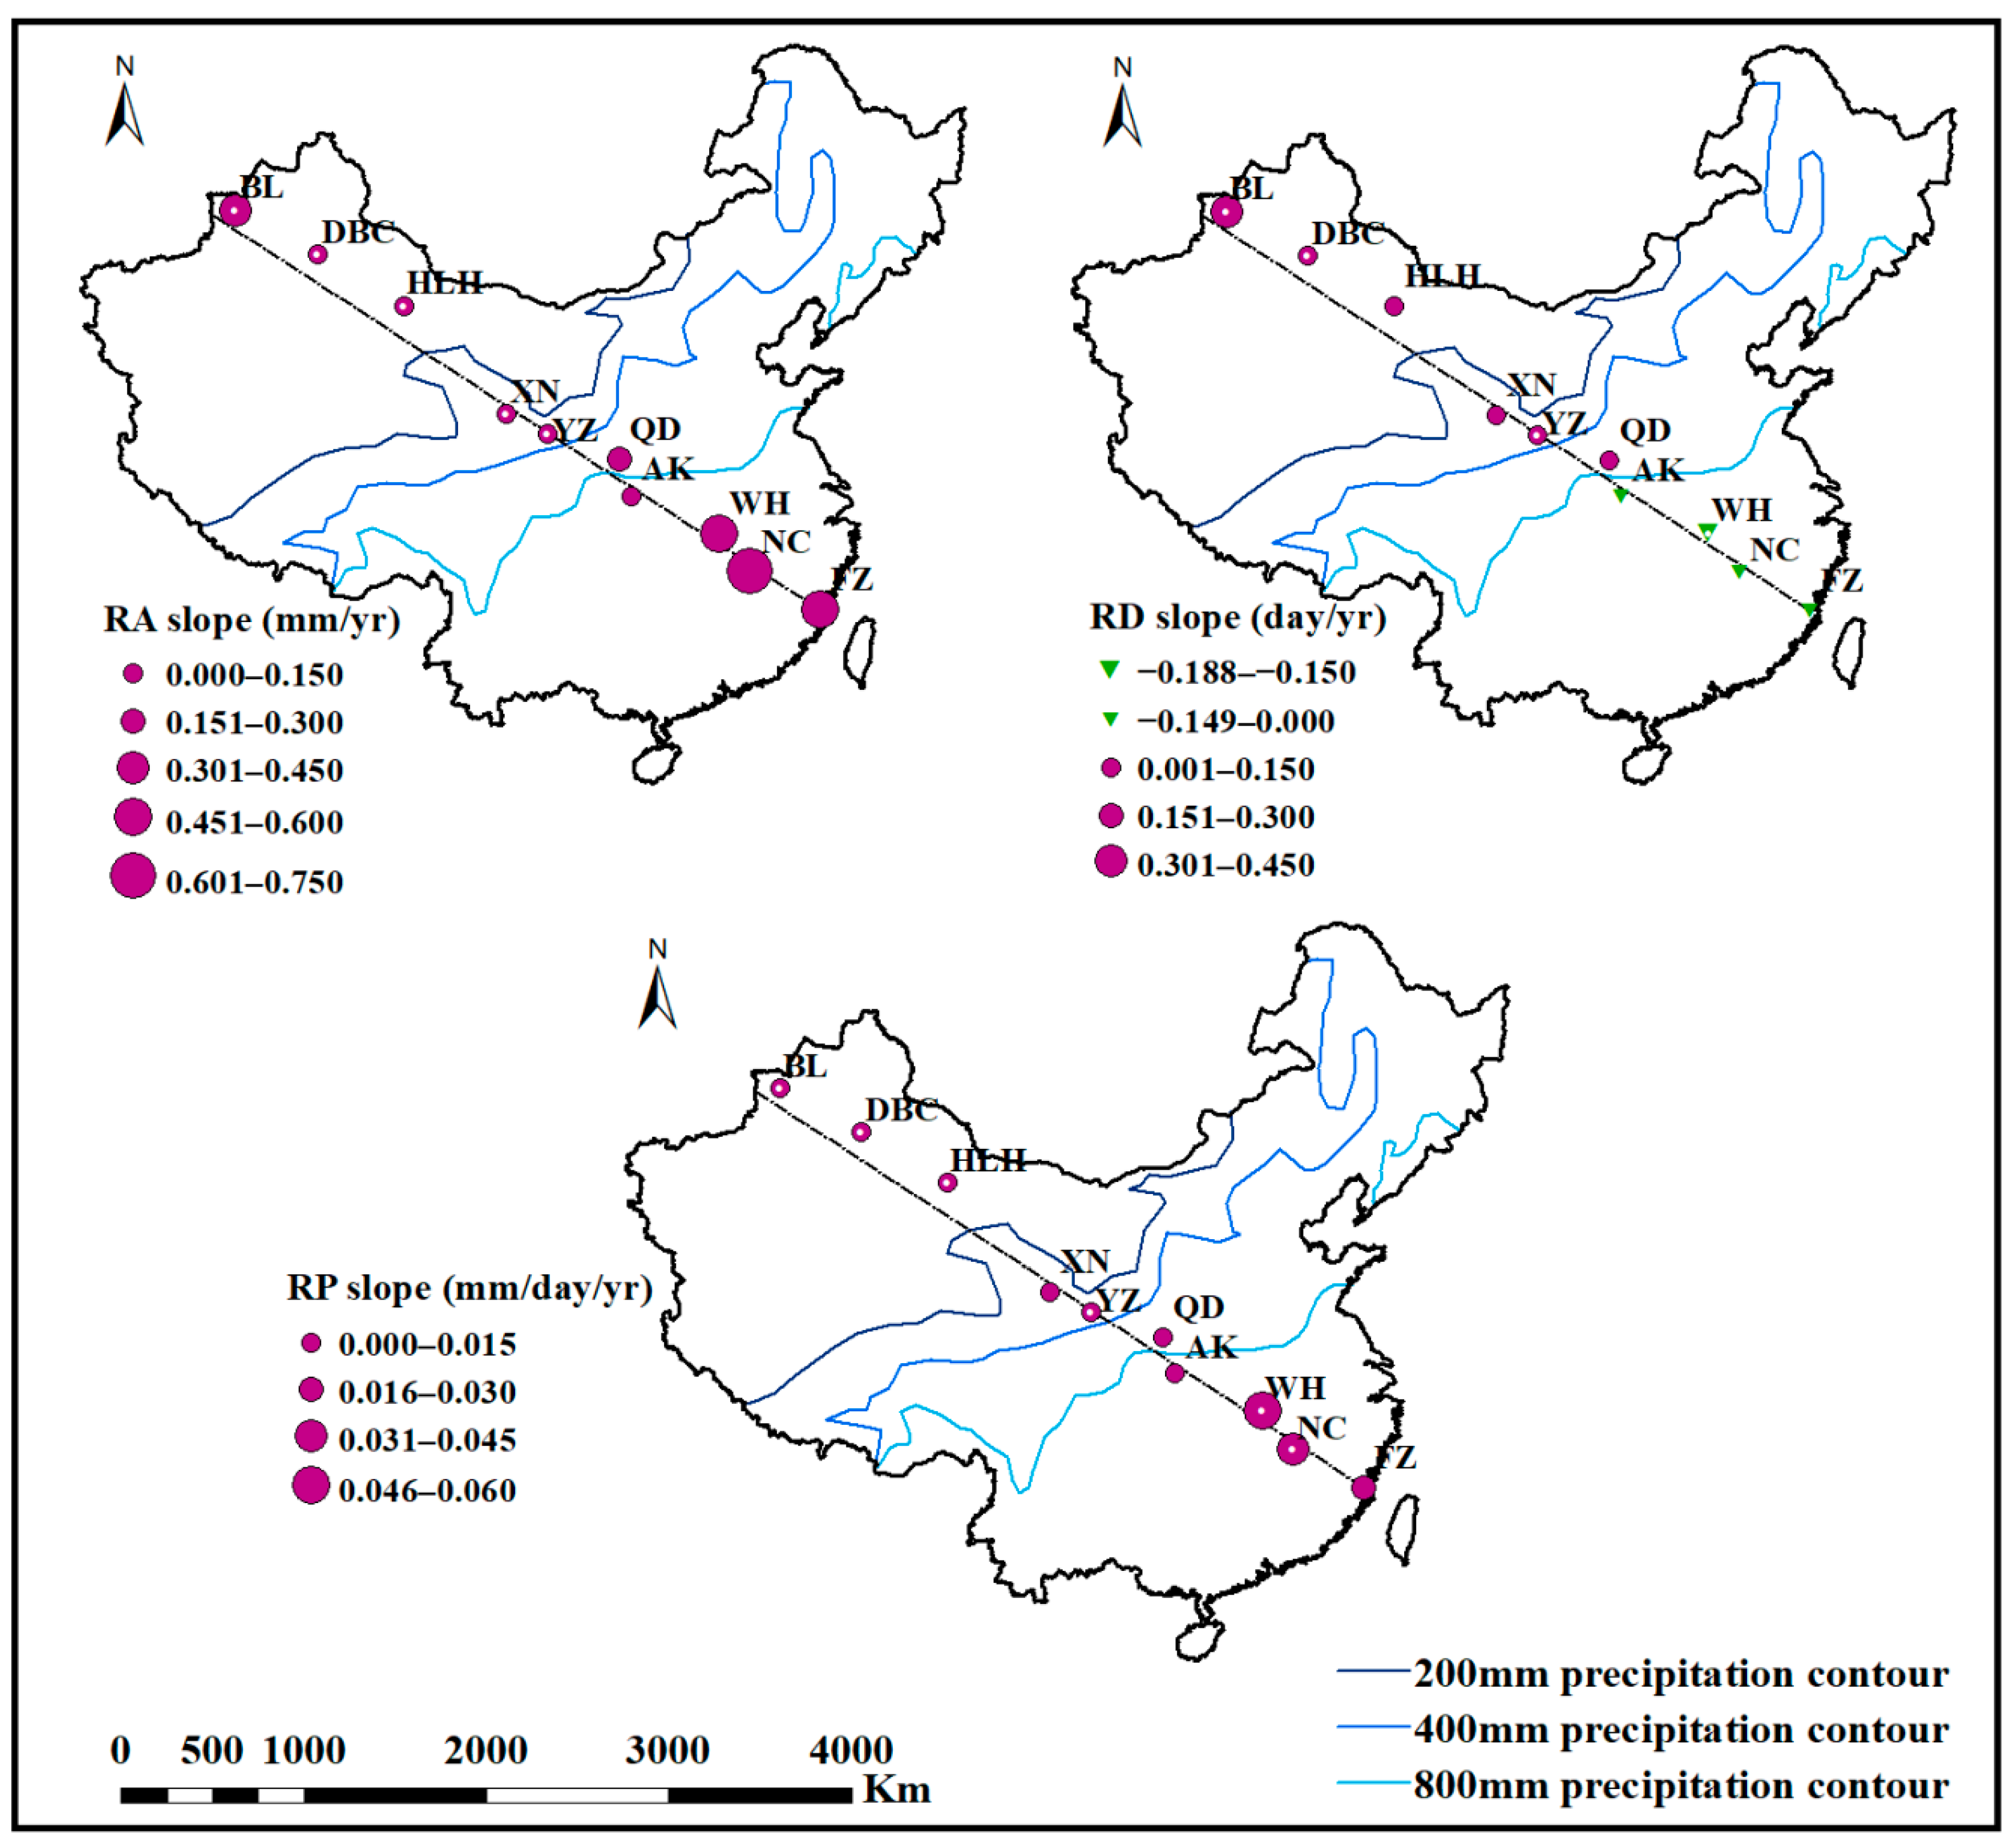
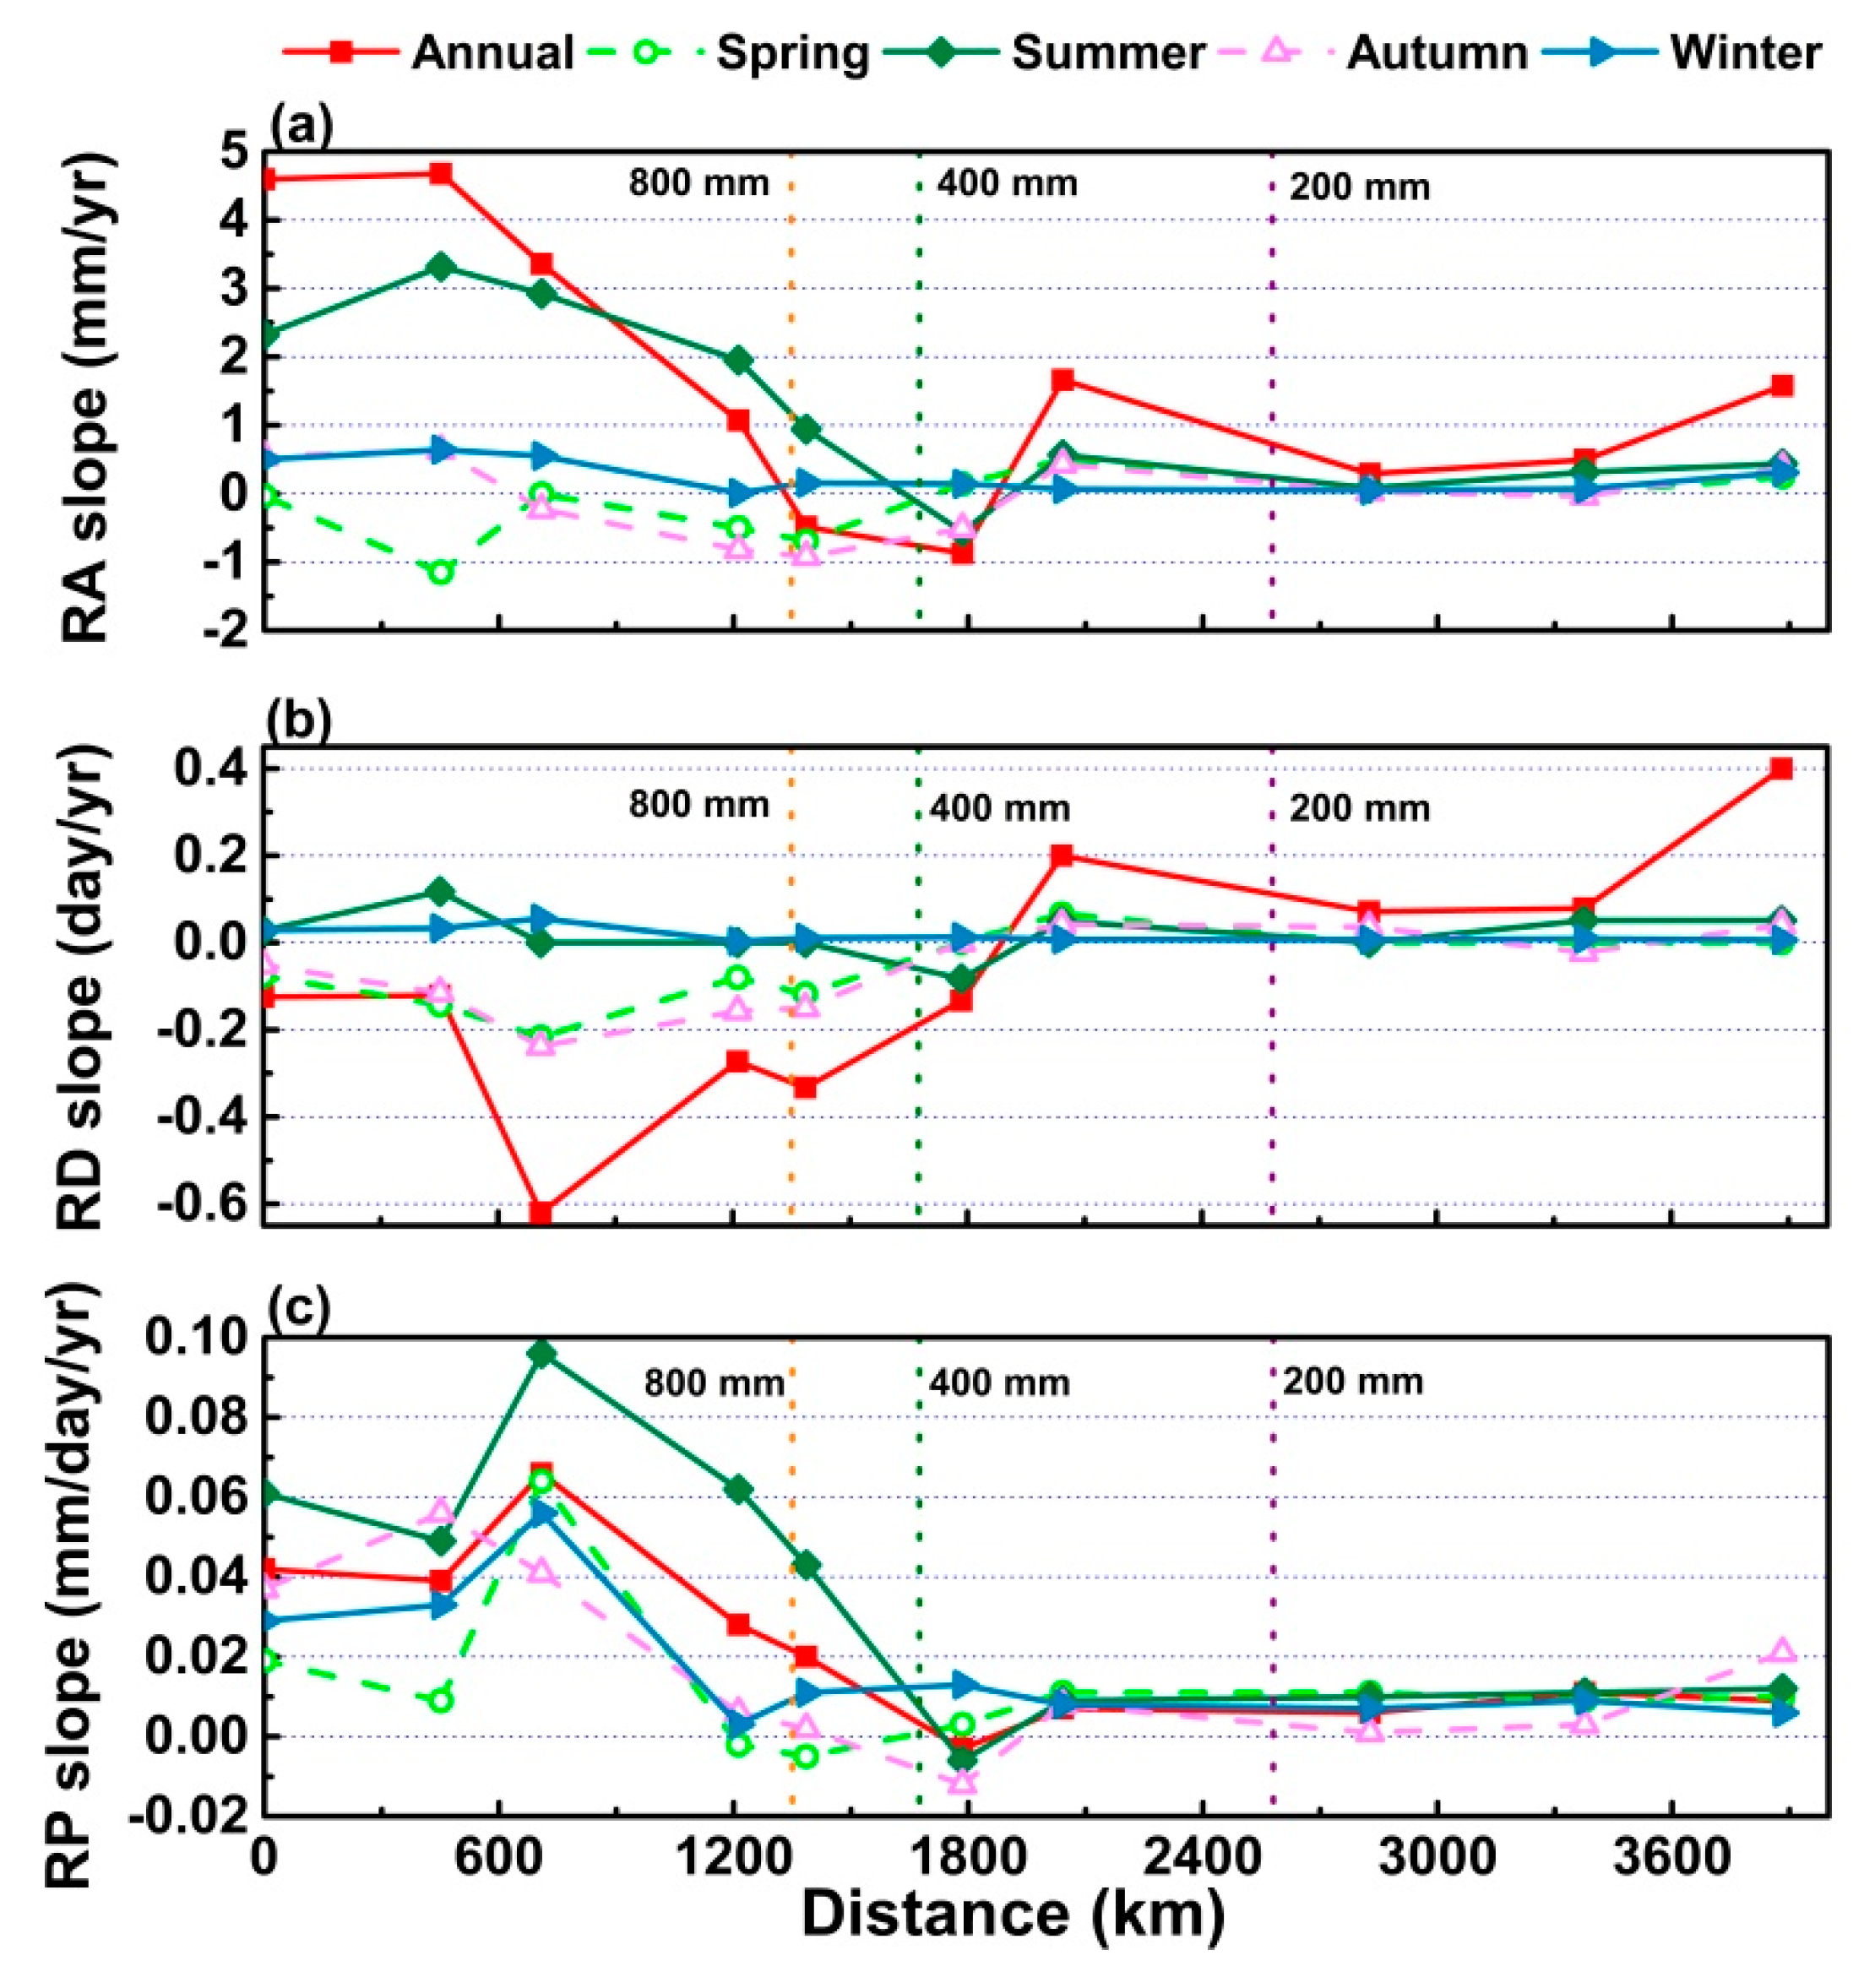
3.2.3. Spatial Variation of Precipitation Index Change Trends from 1961 to 2017
4. Discussion
4.1. Comparison of These Research Results with Those of Other Studies
4.2. Effect of Climate Change on Spatiotemporal Variations of Precipitation
4.3. Effects of Terrain on Precipitation Change
5. Conclusions
- (1)
- From 1961 to 2013, the temporal changes of precipitation exhibited increasing trends, and precipitation changes mainly occurred in summer and winter. The annual precipitation change was similar to the changes in summer and winter: the RA and RP generally increased. The RD in arid and semi-arid areas increased noticeably, and decreased obviously in humid and semi-humid regions. The RD decreased significantly in spring, and the autumn RA and RD decreased in most areas.
- (2)
- On the whole, RA, RD, and RP decreased with the increase of distance from the sea; the RA and RP increased from the FZ to NC stations and decreased sharply at QD. The precipitation indices showed an upward trend from HLH to BL. Compared with the standard climate period of 1961–1990, the precipitation changed significantly from 1991 to 2017: the obvious RD reductions caused annual, spring, and winter RP increases; the RA increase led to the RP increase in summer; the RD reduction that was greater than the RA decrease led to the increased RP in autumn. The spatial variation of the change trends of the precipitation indices also displayed some regularity. The heavy or strong precipitation increased in southeastern and central China, while the weak precipitation increased in northwestern China.
- (3)
- Climate change affected the precipitation change. First, the higher temperatures led to increased precipitation. Second, the strengthening of the summer monsoon caused summer extreme precipitation to increase, while the weakening of the winter monsoon led to an increase in wintertime light precipitation. Third, the change of climate or monsoon altered the rates of precipitation decrease with distance from the sea: RA and RP decreased faster, compared with 1961–1990, the annual decline rate of RA and RP increased to 6% and 13.6%, respectively; RD decrease slower, the rates of the annual, summer, and winter RA decreases were faster, while the spring and autumn rates were slower, and compared with 1961–1990, the annual decline rate of RD decreased to 17.2%. Finally, terrain also exhibits a pronounced impact on precipitation in China.
Author Contributions
Funding
Acknowledgments
Conflicts of Interest
References
- Allen, M.R.; Ingram, W.J. Constraints on future changes in climate and the hydrologic cycle. Nature 2002, 419, 224–232. [Google Scholar] [CrossRef] [PubMed]
- Stocker, T.F.; Raible, C.C. Water cycle shifts gear. Nature 2005, 434, 830–833. [Google Scholar] [CrossRef] [PubMed]
- Ziegler, A.D.; Sheffield, J.; Maurer, E.P.; Nijssen, B.; Wood, E.F.; Lettenmaier, D.P. Detection of intensification in global- and continental-scale hydrological cycles: Temporal scale of evaluation. J. Clim. 2003, 16, 535–547. [Google Scholar] [CrossRef] [Green Version]
- Zhang, Q.; Li, J.; Singh, V.P.; Xiao, M. Spatio-temporal relations between temperature and precipitation regimes: Implications for temperature-induced changes in the hydrological cycle. Glob. Planet. Chang. 2013, 111, 57–76. [Google Scholar] [CrossRef]
- Kunkel, K.E. North American trends in extreme precipitation. Nat. Hazards 2003, 29, 291–305. [Google Scholar] [CrossRef]
- IPCC. Summary for Policy makers. In Climate Change 2013: The Physical Science Basis. Contribution of Working Group I to the Fifth Assessment Report of the Intergovernmental Panel on Climate Change; Cambridge University Press: Cambridge, UK; New York, NY, USA, 2013. [Google Scholar]
- Mirza, M.M.Q. Global warming and changes in the probability of occurrence of floods in Bangladesh and implications. Glob. Environ. Chang. 2002, 12, 127–138. [Google Scholar] [CrossRef]
- Schmidhuber, J.; Tubiello, N.F. Global food security under climate change. Proc. Natl. Acad. Sci. USA 2007, 104, 19703–19708. [Google Scholar] [CrossRef] [Green Version]
- Min, S.K.; Zhang, X.; Zwiers, F.W.; Hegerl, G.C. Human contribution to more-intense precipitation extremes. Nature 2011, 470, 378–381. [Google Scholar] [CrossRef]
- Liu, L.; Xu, Z.X. Regionalization of precipitation and the spatiotemporal distribution of extreme precipitation in Southwestern China. Nat. Hazards 2016, 80, 1195–1211. [Google Scholar] [CrossRef]
- Allan, R.P.; Soden, B.J. Atmospheric Warming and the Amplification of Precipitation Extremes. Science 2008, 321, 1481–1484. [Google Scholar] [CrossRef] [Green Version]
- Giorgi, F.; Raffaele, F.; Coppola, E. The response of precipitation characteristics to global warming from climate projections. Earth Syst. Dynam. 2019, 10, 73–89. [Google Scholar] [CrossRef] [Green Version]
- Myhre, G.; Alterskjær, K.; Stjern, C.W.; Hodnebrog, Ø.; Marelle, L.; Samset, B.H.; Sillmann, J.; Schaller, N.; Fischer, E.; Schulz, M.; et al. Frequency of extreme precipitation increases extensively with event rareness under global warming. Sci. Rep. 2019. [Google Scholar] [CrossRef] [PubMed] [Green Version]
- Zhang, X.; Vincent, L.A.; Hogg, W.D.; Niitsoo, A. Temperature and precipitation trends in Canada during the 20th century. Atmos. Ocean. 2000, 38, 395–429. [Google Scholar] [CrossRef]
- Mekis, É.; Vincent, L.A. An overview of the second generation adjusted daily precipitation dataset for trend analysis in Canada. Atmos. Ocean. 2011, 49, 163–177. [Google Scholar] [CrossRef] [Green Version]
- Vincent, L.A.; Zhang, X.; Mekis, E.; Wan, H.; Bush, E.J. Changes in Canada’s climate: Trends in indices based on daily temperature and precipitation data. Atmos. Ocean. 2018, 56, 332–349. [Google Scholar] [CrossRef] [Green Version]
- Karl, T.R.; Knight, R.W. Secular trends of precipitation amount, frequency, and intensity in the United States. Bull. Am. Meteorol. Soc. 1998, 79, 231–241. [Google Scholar] [CrossRef]
- Raghavendra, A.; Dai, A.; Milrad, S.M.; Cloutier-Bisbee, S.R. Floridian heatwaves and extreme precipitation: Future climate projections. Clim. Dynam. 2018, 52, 495–508. [Google Scholar] [CrossRef]
- Swain, D.L.; Langenbrunner, B.; Neelin, J.D.; Hall, A. Increasing precipitation volatility in twenty-first-century California. Nat. Clim. Chang. 2018, 8, 427–433. [Google Scholar] [CrossRef]
- Wang, H.; Fu, R. Cross-equatorial flow and seasonal cycle of precipitation over South America. J. Clim. 2002, 15, 1591–1608. [Google Scholar] [CrossRef]
- Liebmann, B.; Vera, C.S.; Carvalho, L.M.V.; Camilloni, I.A.; Hoerling, M.P.; Allured, D.; Barroset, V.; Báez, J.; Bidegain, M. An observed trend in central South American precipitation. J. Clim. 2004, 17, 4357–4367. [Google Scholar] [CrossRef] [Green Version]
- Zolina, O.; Simmer, C.; Gulev, S.K.; Kollet, S. Changing structure of European precipitation: Longer wet periods leasing to more abundant rainfalls. Geophys. Res. Lett. 2010, 37, 460–472. [Google Scholar] [CrossRef]
- Madsen, H.; Lawrence, D.; Lang, M.; Martinkova, M.; Kjeldsen, T.R. Review of trend analysis and climate change projections of extreme precipitation and floods in Europe. J. Hydrol. 2014, 519, 3634–3650. [Google Scholar] [CrossRef] [Green Version]
- Kruger, A.C. Observed trends in daily precipitation indices in South Africa: 1910–2004. Int. J. Climatol. 2006, 26, 2275–2285. [Google Scholar] [CrossRef]
- Shongwe, M.; Van Oldenborgh, G.J.; Hurk, B.; De Boer, B.; Coelho, S.; Aalst, M. Projected changes in mean and extreme precipitation in Africa under global warming. part i: Southern Africa. J. Clim. 2009, 22, 3819–3837. [Google Scholar] [CrossRef]
- Roy, S.S.; Balling, R.C., Jr. Trends in extreme daily precipitation indices in India. Int. J. Climatol. 2004, 24, 457–466. [Google Scholar]
- Endo, N.; Matsumoto, J.; Lwin, T. Trends in precipitation extremes over Southeast Asia. Sola 2009, 5, 168–171. [Google Scholar] [CrossRef] [Green Version]
- Limsakul, A.; Singhruck, P. Long-term trends and variability of total and extreme precipitation in Thailand. Atmos. Res. 2016, 169, 301–317. [Google Scholar] [CrossRef]
- Yang, T.; Li, Q.; Chen, X.; Maeyer, P.D.; Yan, X.; Liu, Y.; Zhao, T.; Li, L. Spatiotemporal variability of the precipitation concentration and diversity in Central Asia. Atmos. Res. 2019. [Google Scholar] [CrossRef]
- Partal, T.; Kahya, E. Trend analysis in Turkish precipitation data. Hydrol. Process. 2006, 20, 2011–2026. [Google Scholar] [CrossRef]
- Rahimzadeh, F.; Asgari, A.; Fattahi, E. Variability of extreme temperature and precipitation in Iran during recent decades. Int. J. Climatol. 2009, 29, 329–343. [Google Scholar] [CrossRef]
- Tabari, H.; Talaee, P.H. Temporal variability of precipitation over Iran: 1966–2005. J. Hydrol. 2011, 396, 313–320. [Google Scholar] [CrossRef]
- Sun, Y.; Ding, Y.H. A projection of future changes in summer precipitation and monsoon in East Asia. Sci. China Earth Sci. 2010, 53, 284–300. (In Chinese) [Google Scholar] [CrossRef]
- Zhai, P.M.; Zhang, X.B.; Wan, H.; Pan, X.H. Trends in Total Precipitation and Frequency of Daily Precipitation Extremes over China. J. Clim. 2005, 18, 1096–1108. [Google Scholar] [CrossRef]
- Li, B.; Chen, Y.; Chen, Z.; Xiong, H.; Lian, L. Why does precipitation in northwest China show a significant increasing trend from 1960 to 2010? Atmos. Res. 2016, 167, 275–284. [Google Scholar] [CrossRef]
- Yang, P.; Xia, J.; Zhang, Y.; Hong, S. Temporal and spatial variations of precipitation in Northwest China during 1960–2013. Atmos. Res. 2017, 183, 283–295. [Google Scholar] [CrossRef]
- Tan, L.; Cai, Y.; An, Z.; Cheng, H.; Shen, C.C.; Gao, Y.; Edwards, R.L. Decreasing monsoon precipitation in Southwest China during the last 240 years associated with the warming of Tropical Ocean. Clim. Dynam. 2016, 48, 1769–1778. [Google Scholar] [CrossRef]
- Gu, W.; Wang, L.; Hu, Z.Z.; Hu, K.; Li, Y. Interannual Variations of the First Rainy Season Precipitation over South China. J. Clim. 2018, 31, 623–640. [Google Scholar] [CrossRef]
- Zhang, Q.; Zheng, Y.; Singh, V.P.; Luo, M.; Xie, Z. Summer extreme precipitation in Eastern China: Mechanisms and impacts. J. Geophys. Res. Atmos. 2017, 122, 2766–2778. [Google Scholar] [CrossRef]
- Ding, Y.; Ren, G.; Zhao, Z.; Xu, Y.; Luo, Y.; Li, Q.; Zhang, J. Detection, causes and projection of climate change over China: An over view of recent progress. Adv. Atmos. Sci. 2007, 24, 954–971. [Google Scholar] [CrossRef]
- Gong, D.Y.; Shi, P.J.; Wang, J.A. Daily precipitation changes in the semi-arid region over northern china. J. Arid. Environ. 2004, 59, 771–784. [Google Scholar] [CrossRef]
- Zhang, Q.; Peng, J.T.; Singh, V.P.; Li, J.F.; Chen, Y.D. Spatio-temporal variations of precipitation in arid and semiarid regions of China: The Yellow River basin as a case study. Glob. Planet. Chang. 2014, 114, 38–49. [Google Scholar] [CrossRef]
- Mosmann, V.; Castro, A.; Fraile, R.; Dessens, J.; Sánchez, J.L. Detection of statistically significant trends in the summer precipitation of mainland Spain. Atmos. Res. 2004, 70, 43–53. [Google Scholar] [CrossRef]
- Mann, H.B. Nonparametric tests against trend. Econometrica 1945, 13, 245–259. [Google Scholar] [CrossRef]
- Kendall, M.G. Rank Correlation Methods; Griffin: London, UK, 1955. [Google Scholar]
- Mitchell, J.M.; Dzerdzeevskii, B.; Flohn, H.; Hofmeyr, W.L.; Lamb, H.H.; Rao, K.N.; Wallén, C.C. Climate Change; WMO Technical Note No.79; World Meteorological Organization: Geneva, Switzerland, 1966; p. 79. [Google Scholar]
- von Storch, H. Misuses of Statistical Analysis in Climate Research. In Analysis of Climate Variability: Applications of Statistical Techniques; Springer: New York, NY, USA, 1995; pp. 11–26. [Google Scholar] [CrossRef]
- Douglas, E.M.; Vogel, R.M.; Kroll, C.N. Trends in floods and low flows in the United States: Impact of spatial correlation. J. Hydrol. 2000, 240, 90–105. [Google Scholar] [CrossRef]
- Zhang, X.; Harvey, K.D.; Hogg, W.D.; Yuzyk, T.R. Trends in Canadian streamflow. Water. Resour. Res. 2001, 37, 987–998. [Google Scholar] [CrossRef]
- Bayazit, M.; Önöz, B. To prewhiten or not to prewhiten in trend analysis? Hydrolog. Sci. J. 2007, 52, 611–624. [Google Scholar] [CrossRef]
- Theil, H. A rank-invariant method of linear and polynomial regression analysis, III. Proc. Ned. Akad. Wet. 1950, 53, 1397–1412. [Google Scholar]
- Sen, P.K. Estimates of the Regression Coefficient Based on Kendall’s Tau. J. Am. Stat. Assoc. 1968, 63, 1379–1389. [Google Scholar] [CrossRef]
- Wang, R.; Zhang, J.Q.; Guo, E.L.; Zhao, C.L.; Cao, T.H. Spatial and temporal variations of precipitation concentration and their relationships with large-scale atmospheric circulations across Northeast China. Atmos. Res. 2019, 222, 62–73. [Google Scholar] [CrossRef]
- Zhao, Z.C.; Luo, Y.; Wang, S.W.; Huang, J.B. Science issues on global warming. J. Meteorol. Environ. 2015, 31, 1–5. (In Chinese) [Google Scholar]
- Liu, B.; Xu, M.; Henderson, M.; Qi, Y. Observed trends of precipitation amount, frequency, and intensity in China, 1960–2000. J. Geophys. Res. Atmos. 2005. [Google Scholar] [CrossRef]
- Zhang, Q.; Xu, C.Y.; Zhang, Z.; Chen, Y.D.; Liu, C.L. Spatial and temporal variability of precipitation over China, 1951–2005. Theor. Appl. Climatol. 2009, 95, 53–68. [Google Scholar] [CrossRef]
- Su, Y.; Zhao, C.; Wang, Y.; Ma, Z. Spatiotemporal Variations of Precipitation in China Using Surface Gauge Observations from 1961 to 2016. Atmosphere 2020, 11, 303. [Google Scholar] [CrossRef] [Green Version]
- Zhang, Q.; Singh, V.P.; Sun, P.; Chen, X.; Zhang, Z.; Li, J. Precipitation and streamflow changes in China: Changing patterns, causes and implications. J. Hydrol. 2011, 410, 204–216. [Google Scholar] [CrossRef]
- Feng, Y.; Zhao, X. Changes in spatiotemporal pattern of precipitation over China during 1980–2012. Environ. Earth. Sci. 2015, 73, 1649–1662. [Google Scholar] [CrossRef]
- Li, J.; Yu, R.; Yuan, W.; Chen, H. Changes in duration-related characteristics of late-summer precipitation over eastern China in the past 40 years. J. Clim. 2011, 24, 5683–5690. [Google Scholar] [CrossRef]
- Tao, S.Y.; Chen, L.X. A review of recent research of the East Asian summer monsoon in China. In Monsoon Meteorology; Chang, C.P., Krishnamurti, T.N., Eds.; Oxford University Press: New York, NY, USA, 1987; pp. 60–92. [Google Scholar]
- Gao, Z.H. Analysis of the characteristics of China precipitation changes during 1961–2011. Clim. Chang. Res. Lett. 2013, 2, 147–152. (In Chinese) [Google Scholar]
- Zhang, Q.; Xu, C.Y.; Chen, X.; Zhang, Z. Statistical behaviours of precipitation regimes in China and their links with atmospheric circulation 1960–2005. Int. J. Climatol. 2011, 31, 1665–1678. [Google Scholar] [CrossRef]
- Trenberth, K.E. Changes in precipitation with climate change. Clim. Res. 2011, 47, 123–138. [Google Scholar] [CrossRef] [Green Version]
- Chou, C.; Lan, C. Changes in the annual range of precipitation under global warming. J. Clim. 2012, 25, 222–235. [Google Scholar] [CrossRef] [Green Version]
- Qin, D.; Tao, S.; Dong, S.; Luo, Y. Climate, Environmental, and Socioeconomic Characteristics of China. In Climate and Environmental Change in China: 1951–2012; Qin, D., Ding, Y., Mu, M., Eds.; Springer: Berlin/Heidelberg, Germany, 2016. [Google Scholar]
- Wang, H.; Chen, H. Climate control for southeastern China moisture and precipitation: Indian or East Asian monsoon? J. Geophys. Res. 2012. [Google Scholar] [CrossRef]
- Lin, Z.; Wang, B. Northern East Asian low and its impact on the interannual variation of East Asian summer rainfall. Clim. Dynam. 2016, 46, 83–97. [Google Scholar] [CrossRef]
- Lu, R.; Li, Y.; Ryu, C.S. Relationship between the zonal displacement of the western Pacific subtropical high and the dominant modes of low-tropospheric circulation in summer. Prog. Nat. Sci. 2008, 18, 161–165. [Google Scholar]
- Wang, S.W.; Wen, X.Y.; Huang, J.B. East Asian winter monsoon. Clim. Chang. Res. 2013, 9, 154–156. (In Chinese) [Google Scholar] [CrossRef]
- Ha, K.-I.; Heo, K.Y.; Lee, S.S.; Yun, K.S.; Jhun, J.G. Variability in the East Asian Monsoon: A review. Meteorol. Appl. 2012, 19, 200–215. [Google Scholar] [CrossRef]
- Wang, L.; Chen, W. How well do existing indices measure the strength of the East Asian winter monsoon? Adv. Atmos. Sci. 2010, 27, 855–870. [Google Scholar] [CrossRef]
- Dirmeyer, P.A. Land-sea geometry and its effect on monsoon circulations. J. Geophys. Res. 1998, 103, 11555–11572. [Google Scholar] [CrossRef]
- Fu, B. The influence of topography and altitude on precipitation. Acta Geogr. Sin. 1992, 4, 302–314. (In Chinese) [Google Scholar]


| Station | Longitude (°E) | Latitude (°N) | Altitude (m) |
|---|---|---|---|
| Fuzhou (FZ) | 119.17 | 26.05 | 84.00 |
| Nanchang (NC) | 115.55 | 28.36 | 46.90 |
| Wuhan (WH) | 114.03 | 30.36 | 23.60 |
| Ankang(AK) | 109.02 | 32.43 | 290.8 |
| Qindu (QD) | 108.43 | 34.24 | 472.80 |
| Yuzhong (YZ) | 104.09 | 35.52 | 1874.40 |
| Xining (XN) | 101.45 | 36.44 | 2295.20 |
| Hongliuhe(HLH) | 94.4 | 41.32 | 1573.8 |
| Dabancheng (DBC) | 88.19 | 43.21 | 1103.50 |
| Bole(BL) | 82.04 | 44.54 | 531.9 |
| Index | Sub-Index | Unit |
|---|---|---|
| Rainfall amount (RA) | Light rainfall amount (LRA) | mm |
| Moderate rainfall amount (MRA) | mm | |
| Heavy rainfall amount (HRA) | mm | |
| Storm amount (SRA) | mm | |
| Rainfall days (RD) | Light rainfall days (LRD) | day |
| Moderate rainfall days (MRD) | day | |
| Heavy rainfall days (HRD) | day | |
| Storm days (SRD) | day | |
| Daily precipitation on rainy days (RP) | Daily precipitation on light rainfall days (LRP) | mm/day |
| Daily precipitation on moderate rainfall days (MRP) | mm/day | |
| Daily precipitation on heavy rainfall days (HRP) | mm/day | |
| Daily precipitation on stormy days (SRP) | mm/day |
| Slope | Years | Annual | Spring | Summer | Autumn | Winter |
|---|---|---|---|---|---|---|
| RA (mm/km) | 1961–1990 | −0.3664 | −0.1392 | −0.1198 | −0.0638 | −0.0431 |
| 1991–2017 | −0.3884 | −0.1313 | −0.1469 | −0.0605 | −0.0502 | |
| Comparison | −0.0220 | 0.0079 | −0.0270 | 0.0033 | −0.0071 | |
| RD (day/km) | 1961–1990 | −0.0297 | −0.0119 | −0.0049 | −0.0068 | −0.0062 |
| 1991–2017 | −0.0246 | −0.0105 | −0.0048 | −0.0052 | −0.0041 | |
| Comparison | 0.0051 | 0.0014 | 0.0001 | 0.0016 | 0.0021 | |
| RP (mm/day/km) | 1961–1990 | −0.0022 | −0.0024 | −0.0030 | −0.0016 | −0.0013 |
| 1991–2017 | −0.0025 | −0.0025 | −0.0036 | −0.0020 | −0.0015 | |
| Comparison | −0.0003 | −0.0001 | −0.0006 | −0.0004 | −0.0002 |
| Stations | Indices | Spring | Summer | Autumn | Winter | Annual |
|---|---|---|---|---|---|---|
| FZ | RA | −0.48 * | −0.24 | −0.02 | 0.12 | 0.19 |
| RD | −0.63 * | −0.44 * | −0.15 | 0.02 | −0.22 | |
| RP | −0.22 | −0.10 | −0.01 | 0.16 | 0.37 * | |
| NC | RA | −0.42 * | −0.50 * | −0.15 | −0.05 | 0.00 |
| RD | −0.59 * | −0.62 * | −0.35 * | −0.20 | −0.39 * | |
| RP | −0.18 | −0.18 | 0.14 | 0.06 | 0.27 * | |
| WH | RA | −0.18 | −0.32 * | −0.30 * | 0.31 * | −0.01 |
| RD | −0.59 * | −0.58 * | −0.51 * | −0.11 | −0.53 * | |
| RP | 0.22 | −0.03 | 0.01 | 0.36 * | 0.31 * | |
| AK | RA | −0.24 | −0.57 * | −0.35 * | 0.12 | −0.40 * |
| RD | −0.40 * | −0.67 * | −0.34 * | 0.01 | −0.56 * | |
| RP | 0.04 | −0.24 | −0.29 * | 0.17 | −0.04 | |
| QD | RA | −0.34 * | −0.47 * | −0.25 | −0.03 | −0.26 * |
| RD | −0.54 * | −0.66 * | −0.33 * | −0.15 | −0.48 * | |
| RP | 0.03 | −0.12 | −0.14 | 0.16 | 0.07 | |
| YZ | RA | −0.08 | −0.47 * | −0.24 | 0.05 | −0.32 * |
| RD | −0.31 * | −0.53 * | −0.16 | −0.02 | −0.42 * | |
| RP | 0.18 | −0.29 * | −0.15 | 0.27 * | −0.09 | |
| XN | RA | 0.15 | −0.23 | −0.09 | 0.00 | −0.14 |
| RD | −0.02 | −0.44 * | −0.25 | −0.12 | −0.25 | |
| RP | 0.23 | −0.02 | 0.12 | 0.08 | 0.01 | |
| HLH | RA | −0.08 | −0.25 | 0.15 | −0.19 | 0.02 |
| RD | −0.17 | −0.47 * | 0.10 | −0.32 * | −0.03 | |
| RP | −0.05 | −0.03 | 0.13 | 0.17 | 0.04 | |
| DBC | RA | −0.13 | −0.05 | 0.07 | 0.02 | 0.05 |
| RD | −0.25 | −0.14 | −0.22 | 0.00 | 0.00 | |
| RP | 0.09 | −0.03 | 0.11 | 0.15 | 0.07 | |
| BL | RA | −0.12 | 0.02 | 0.18 | 0.19 | 0.24 |
| RD | −0.28 * | −0.03 | −0.07 | 0.08 | 0.22 | |
| RP | 0.06 | 0.04 | 0.25 | 0.19 | 0.15 |
© 2020 by the authors. Licensee MDPI, Basel, Switzerland. This article is an open access article distributed under the terms and conditions of the Creative Commons Attribution (CC BY) license (http://creativecommons.org/licenses/by/4.0/).
Share and Cite
Li, Z.; Liu, H. Temporal and Spatial Variations of Precipitation Change from Southeast to Northwest China during the Period 1961–2017. Water 2020, 12, 2622. https://doi.org/10.3390/w12092622
Li Z, Liu H. Temporal and Spatial Variations of Precipitation Change from Southeast to Northwest China during the Period 1961–2017. Water. 2020; 12(9):2622. https://doi.org/10.3390/w12092622
Chicago/Turabian StyleLi, Zhu, and Honghu Liu. 2020. "Temporal and Spatial Variations of Precipitation Change from Southeast to Northwest China during the Period 1961–2017" Water 12, no. 9: 2622. https://doi.org/10.3390/w12092622
APA StyleLi, Z., & Liu, H. (2020). Temporal and Spatial Variations of Precipitation Change from Southeast to Northwest China during the Period 1961–2017. Water, 12(9), 2622. https://doi.org/10.3390/w12092622