Article

Identification of Antitumor Constituents in Toad Venom by Spectrum-Effect Relationship Analysis and Investigation on Its Pharmacologic Mechanism

College of Pharmaceutical Sciences, Zhejiang University, Hangzhou 310058, China
*
Author to whom correspondence should be addressed.
Molecules 2020, 25(18), 4269; https://doi.org/10.3390/molecules25184269
Submission received: 11 August 2020 / Revised: 10 September 2020 / Accepted: 14 September 2020 / Published: 18 September 2020

Abstract

:
(1) Background: Toad venom (Bufonis Venenum, known as ‘Chansu’ in Chinese), the secretion of the ear-side gland and skin gland of Bufo gargarizans cantor or Duttaphrynus melanostictus Schneider, has been utilized to treat several diseases in China for thousands of years. However, due to the chemical variability of the components, systematic chemical composition and the key pharmacophores in toad venom have not yet fully understood. Besides, it contains a variety of effective compounds with different physiological activity and chemotypes, mainly including alkaloids, bufogenins, bufotoxins, and so on. The recent pharmacological researches have demonstrated that several bufogenins have remarkable pharmacological effects, such as anti-inflammatory, analgesic effects, and anti-tumor effects. Aim of the study: To identify the bioactive compounds and pharmacophores originating from toad venom based on analyzing spectrum-effect relationship by chemometrics and to explore the anti-cancer mechanism primarily. (2) Materials and methods: Fingerprint of the 21 batches of samples was established using HPLC (High Performance Liquid Chromatography). The anti-tumor activity of extracts were determined by in-vitro assays. Chemometric analysis was used to establish the spectrum-effect model and screen for active ingredients. Pharmacodynamic tests for the screened active compound monomers were conducted with in-vitro assays. Further anti-tumor mechanisms were investigated using western blot and flow cytometry. (3) Results: The established spectrum-effect model has satisfactory fitting effect and predicting accuracy. The inhibitory effect of major screened compounds on lung carcinoma cells A549 were validated in vitro, demonstrating that arenobufagin, telocinobufogenin, and cinobufotalin had significant anti-tumor effects. Through further investigation of the mechanism by western blotting and flow cytometry, we elucidated that arenobufagin induces apoptosis in A549 cells with the enhanced expression of cleaved PARP (poly (ADP-ribose) polymerase). These results may provide valuable information for further structural modification of bufadienolides to treat lung cancer and a method for discovery of anti-tumor active compounds. Conclusions: Our research offers a more scientific method for screening the principal ingredients dominating the pharmacodynamic function. These screened compounds (arenobufagin, etc.) were proven to induce apoptosis by overactivation of the PARP-pathway, which may be utilized to make BRCA (breast cancer susceptibility gene) mutant cancer cells more vulnerable to DNA damaging agents and kill them.

Graphical Abstract

1. Introduction

Lung cancer is one of the most common cancers in humans with high incidence and mortality rate. Non-Small Cell Lung Carcinoma (NSCLC), the most common form of lung cancer, comprises of approximately 85% of all cases of lung cancer [1,2]. Natural medicines have shown attractive potential for preventing and treating diseases for centuries and have contributed to the development of modern medicine [3]. Toad venom, the dried white secretion from the postauricular and skin glands of Bufo gargarizans cantor, is well known for treating many kinds of cancer [4]. According to traditional records, the main efficacy of toad venom is in detoxification, as an analgesic, etc. [5]. The medicine currently used in clinical practice in China are mainly complexes that have originated from toad venom [6,7,8]. Modern medicines composed of toad venom include Huachansu injection, and Shexiang Baoxin Pills, among others. Huachansu injection, prepared from a water extract of dried toad venom, has long been used to treat various cancers of the digestive system [9,10]. It has also shown a reversal effect on multi-drug resistance (MDR) of acute myeloid leukemia cells [11]. In combination with chemotherapy, Huachansu injection enhances curative effects and diminishes the side-effects of chemotherapy [12]. Shexiang Baoxin Pills, which are composed of Moschus, Bufonis Venenum, etc., have been commonly used for cardiovascular diseases, like unstable angina pectoris [13,14]. Because of the complexity of toad venom, both of these medicines have shown drug-related adverse effects, including cardiac toxicity, hematologic toxicities, mucocutaneous toxicities, and gastrointestinal toxicities, thus limiting their use [15]. There is, therefore, a great need to distinguish the active ingredients in toad venom and further study its underlying molecular mechanism.
Bufogenin and bufotoxin, as major components of toad venom, are considered to be the main bioactive constituents, which exert various pharmacological effects with different mechanisms. Ma [16] reported that arenobufagin has anticancer influences on several non-small-cell lung cancer (NSCLC) cells through activation of Noxa (the pro-apoptosis protein)-related signaling pathways and promotes apoptotic cell death in human NSCLC cells. Kai [17] held that cinobufotalin showed obvious inhibitory effects against lung cancer cells without inducing significant cell apoptosis, and Zhang [18] discovered that arenobufagin induced apoptosis and autophagy in human hepatoma carcinoma cells through PI3K/AKt/mTOR pathway inhibition. As shown by these studies, different bufadienolides conducted antitumor functions by regulating different cell signaling pathways. As a result, different bufadienolides have distinct inhibitory effects on diverse kinds of cancer, which awaits further exploration and utilization. It is thus urgent to identify the active ingredients in toad venom.
Spectrum-effect relationship analysis is an effective method to clarify active components in complex mixtures. By combining the characteristic fingerprint and pharmacodynamics information processed by chemometric methods, effective components can be screened.
Chromatographic fingerprint is an effective method to evaluate the consistency and quality of traditional Chinese medicines (TCMs), which could reveal the chemical characteristics of samples to a certain extent [19]. Multiple techniques including HPLC, gas chromatography (GC), etc. have been used to construct specific fingerprints for recognition of complex compounds of TCMs. Among them, HPLC is a broadly applied method owing to its high sensitivity and accessibility [20]. HPLC-MS is an analytical technique mainly used for identification of chemical structures.
While fingerprint analysis is a useful method for chemical analysis of complex matrices [21], it does not involve the identification of components that play leading roles in pharmacology activity. In this paper, with the aim to research the correlation between the biological activity of toad venom and the fingerprint, multivariate chemometrics techniques (including orthogonal partial least squares (OPLS), canonical correlation analysis (CCA), and gray relationship analysis (GRA)) were employed.
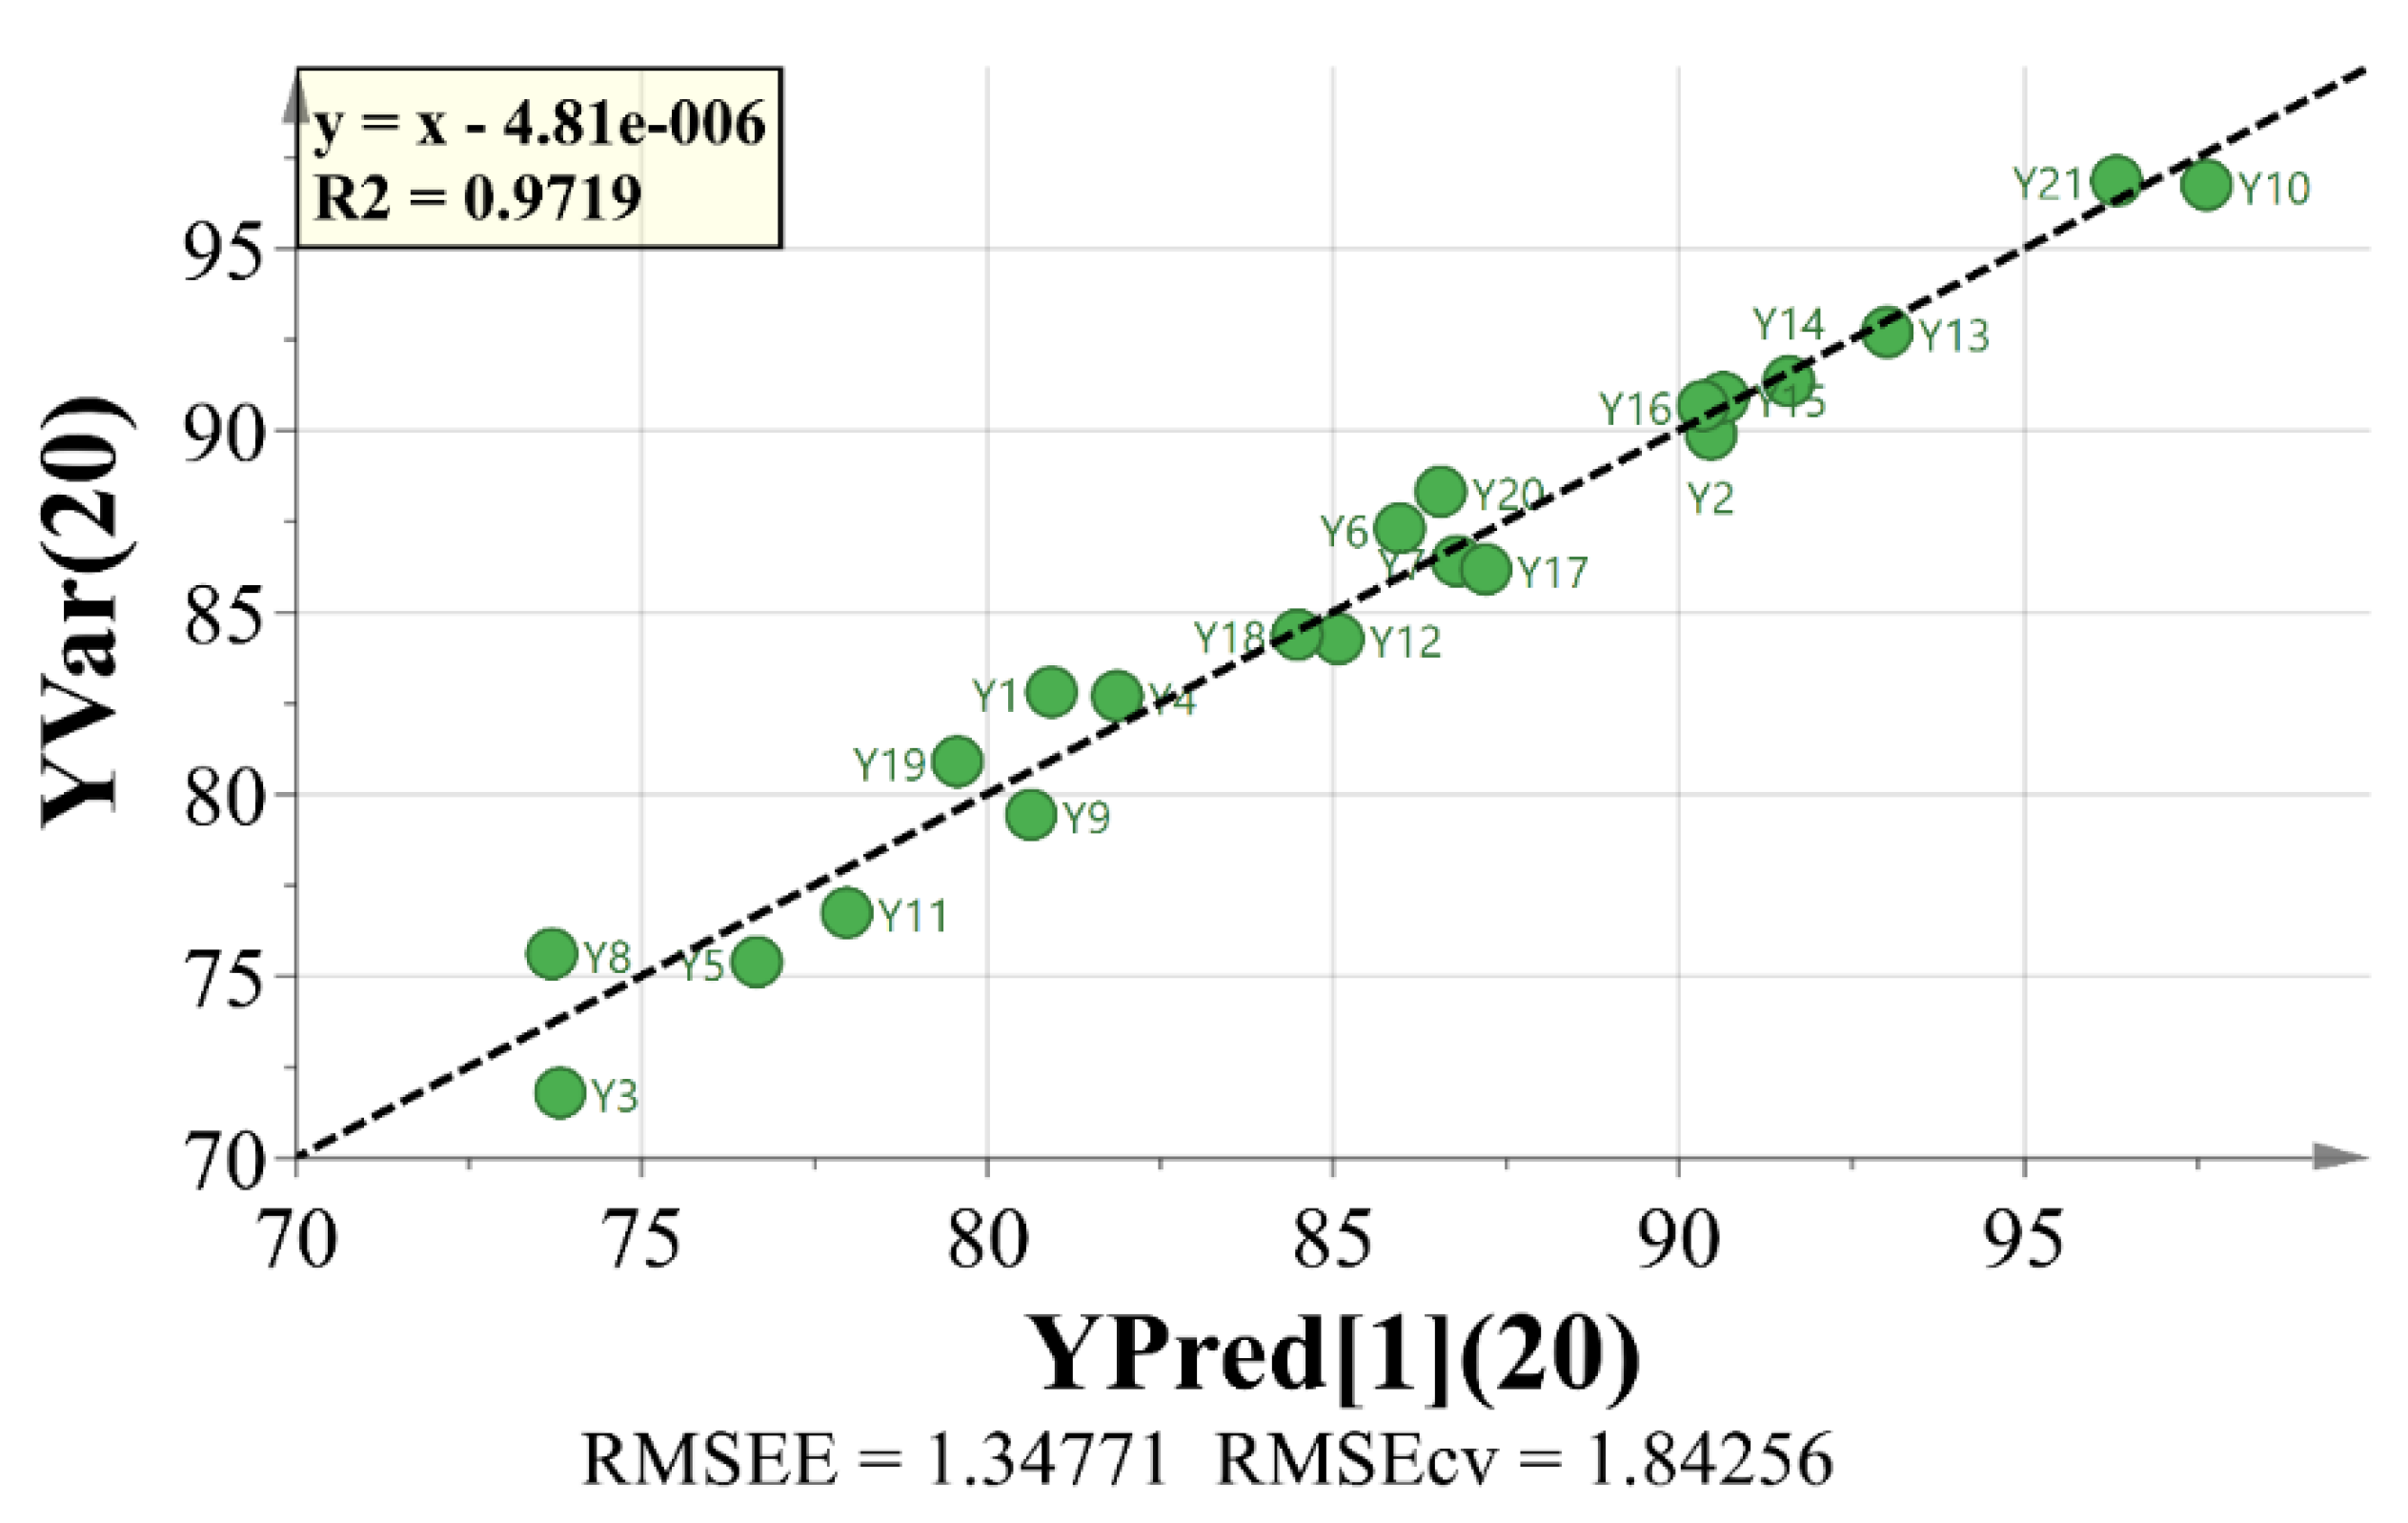
PCA is a method to analyze and simplify data set by reducing its dimensionality, and keeping the largest contribution to the variance of the data set [22,23]. OPLS is a generic method to build a model of the observed data in order to analyze the relationship between two groups of variables and selecting the key variables [
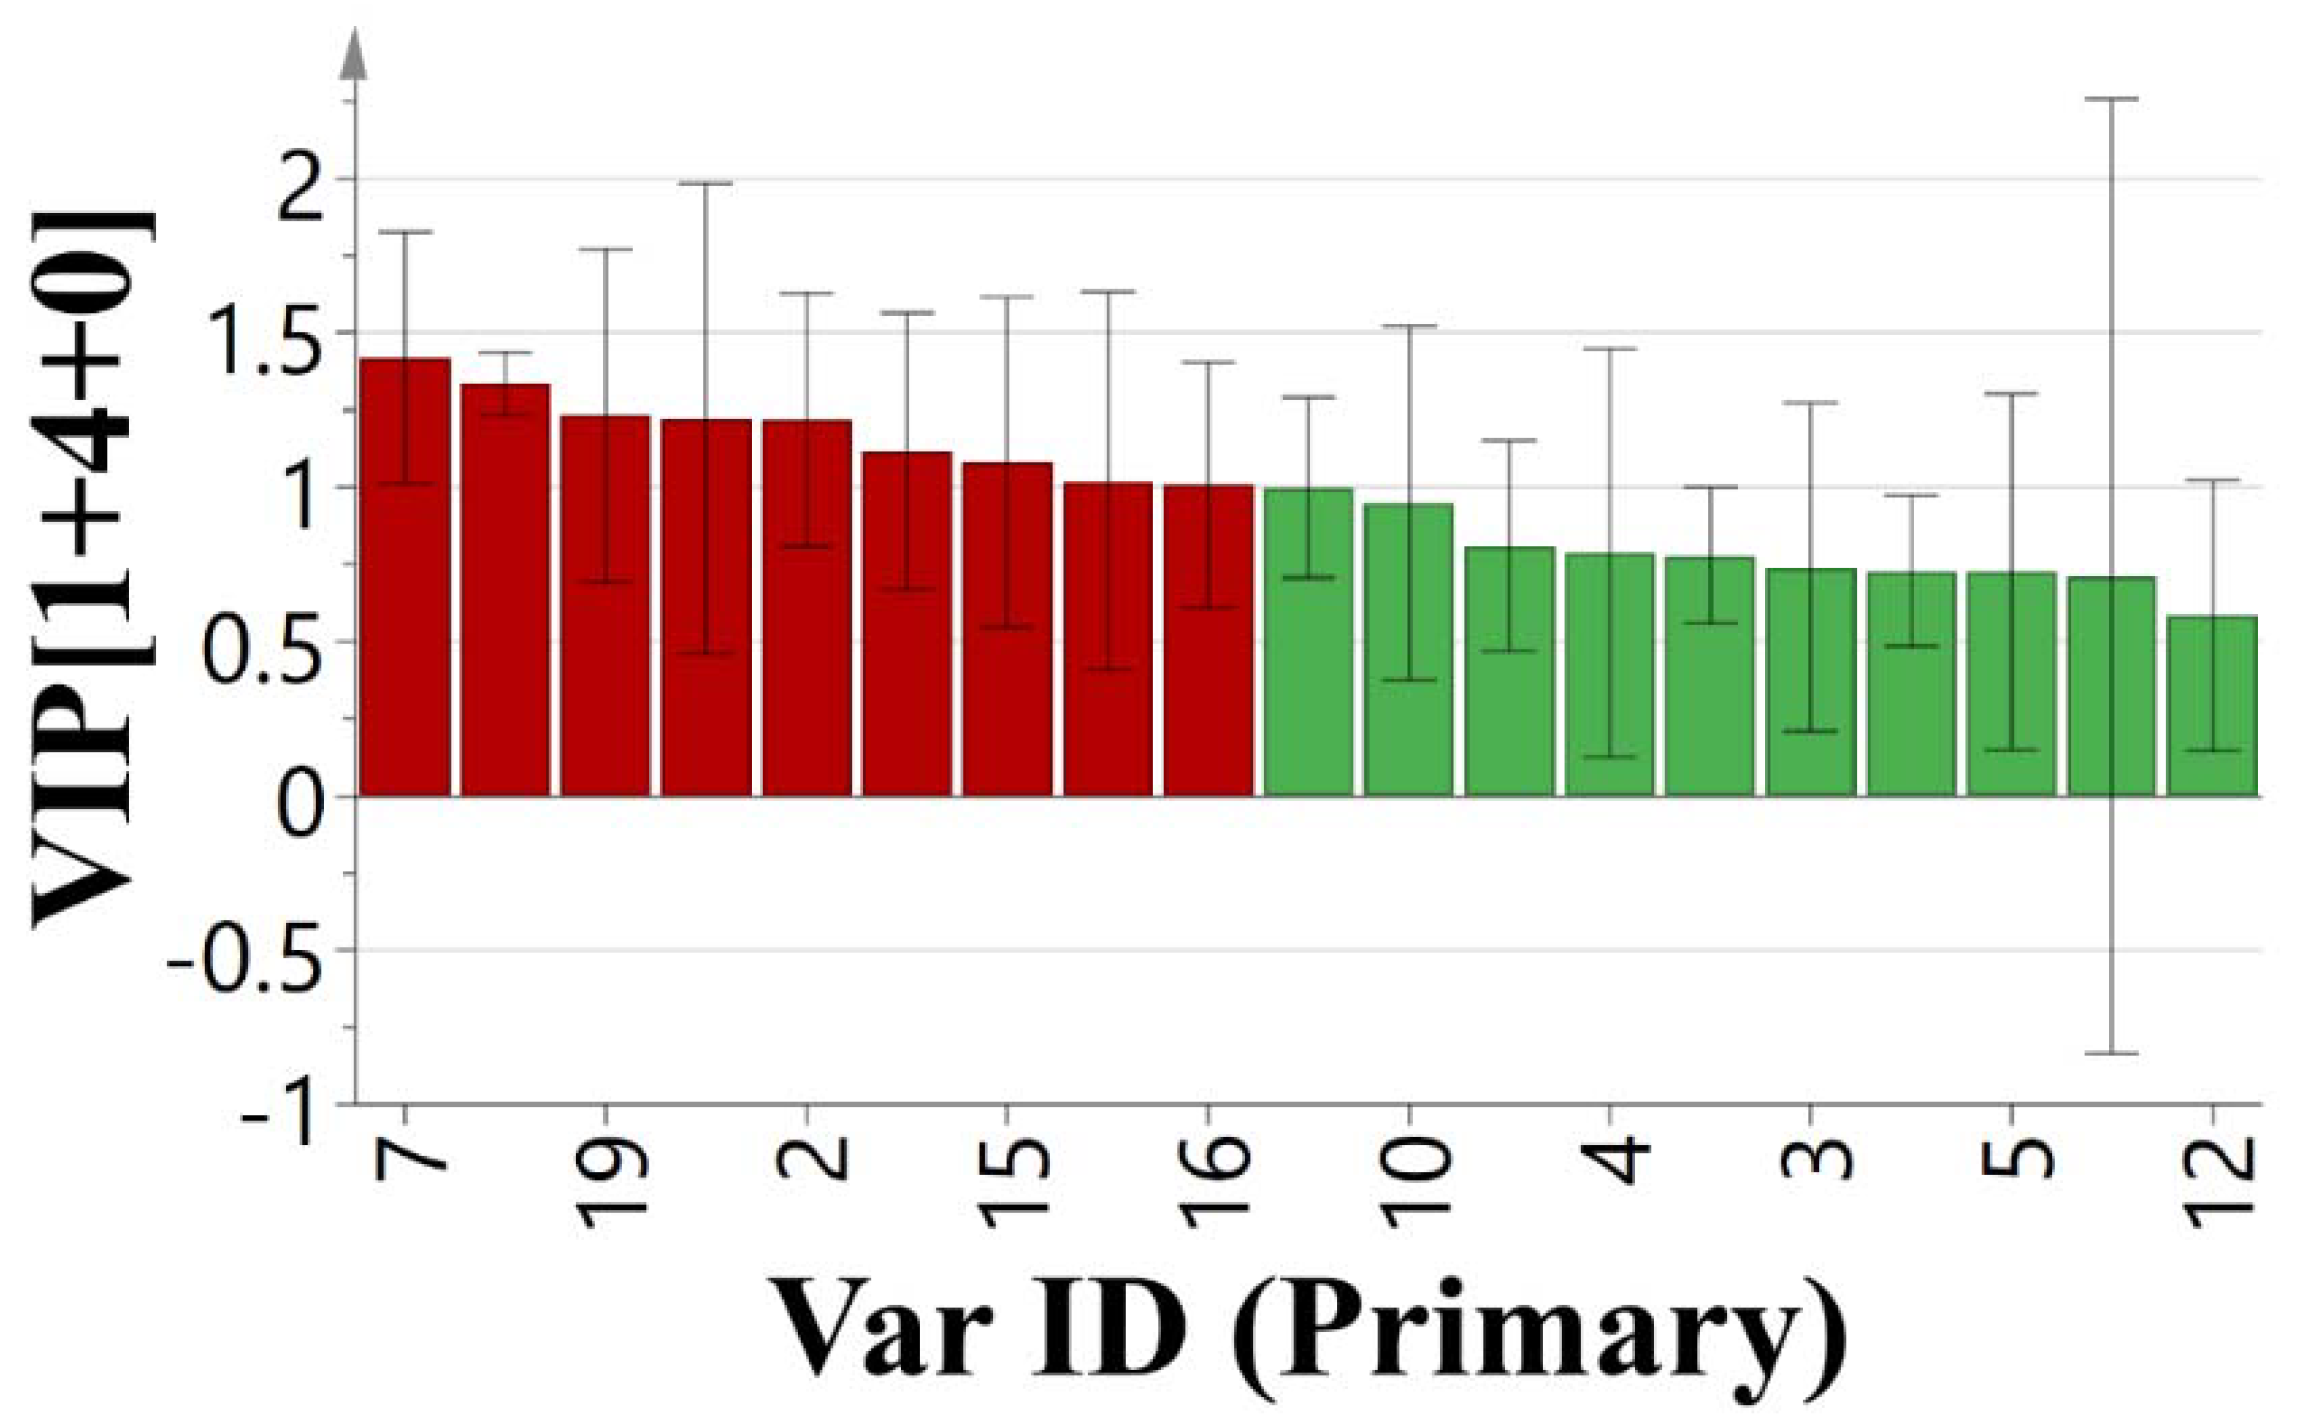
24]. Processed by OPLS, variable importance in projection (VIP) reflects the loading weights of each independent variable to the dependent variable. When VIP > 1, the independent variable is a significant factor in interpreting the dependent variable [24]. GRA, which originated from the grey system theory proposed by Deng [25] in the 1980s, is suitable for manipulating complex interrelationships between multiple factors and variables. GRA results can be provided as a ranking sequence that reflects the order of correlation among dependent and independent factors [26]. Correlation analysis is a statistic analytical method to research the linear relation between variables; the correlation coefficients are used to measure the degree of correlation of the variables [19].
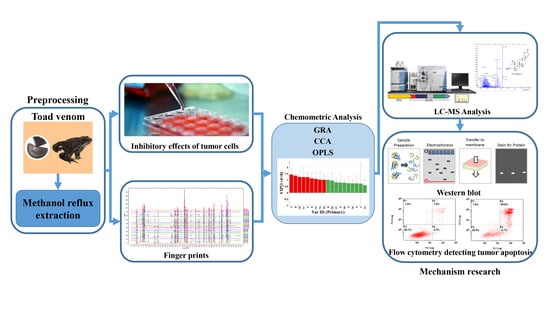
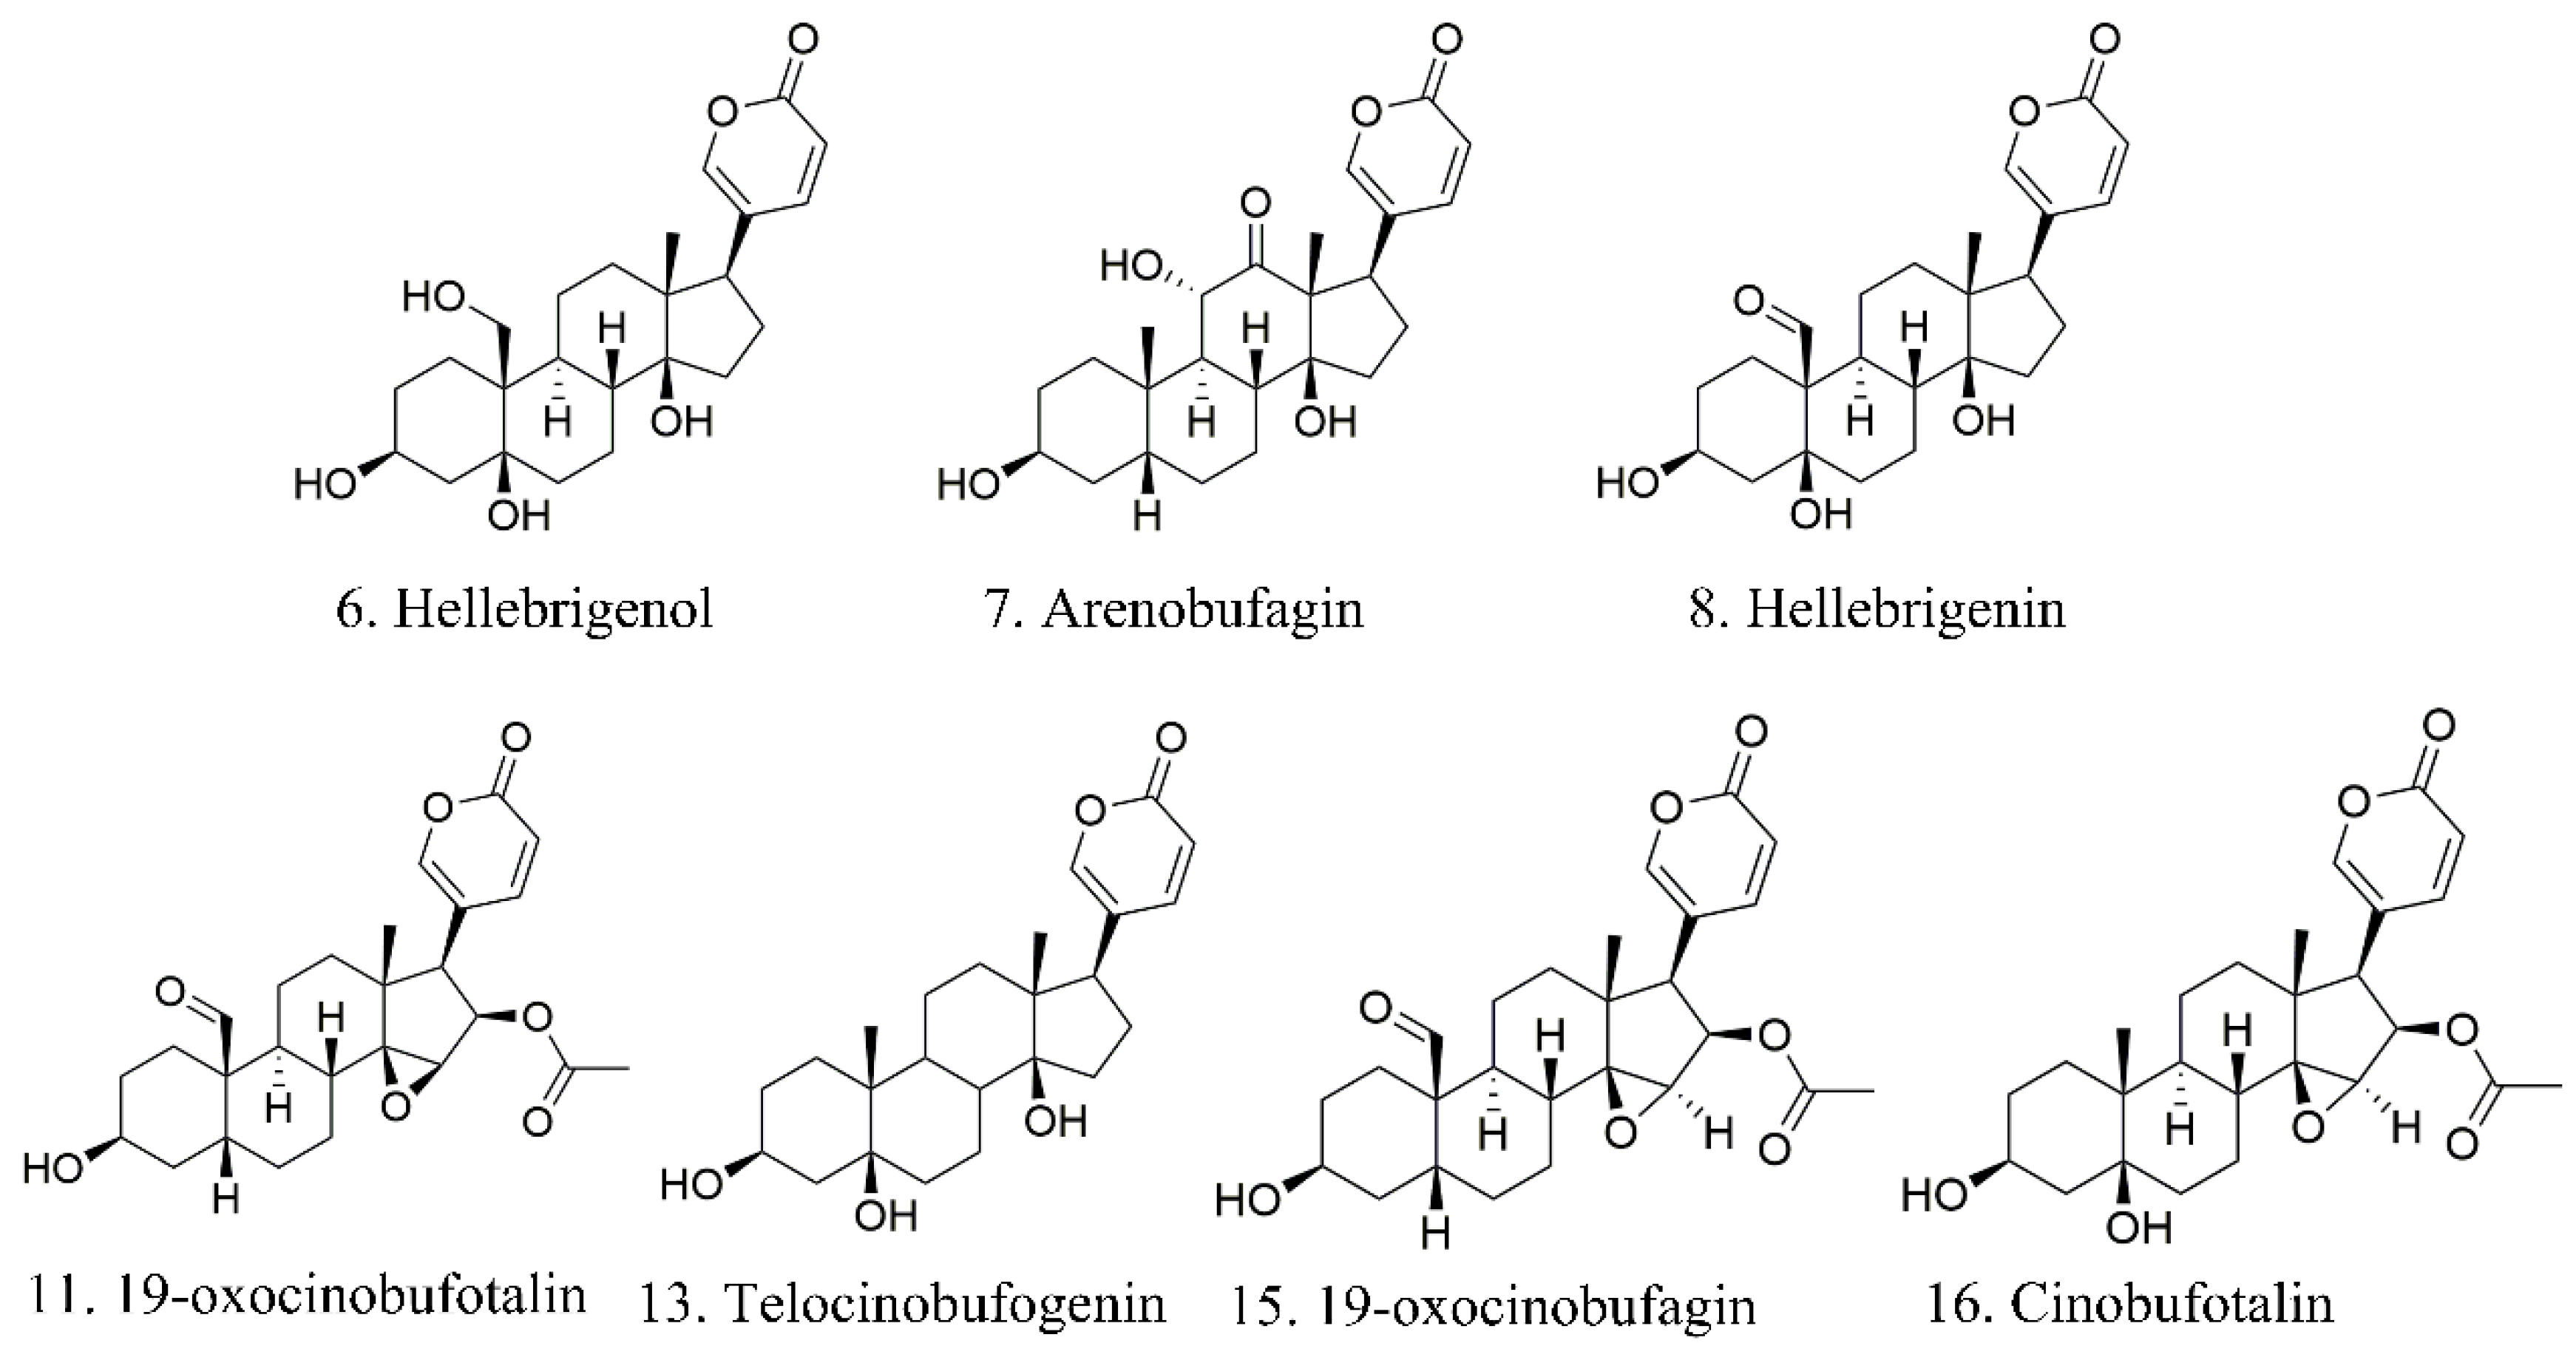
These analysis methods were used to establish the spectrum-effect relationship between the peak area of the fingerprint and the results of anti-cancer activity study, respectively. We isolated seven bufadienolides (hellebrigenol, arenobufagin, hellebrigenin, 19-oxo-cinobufotalin, telocinobufogenin, 19-oxo-cinobufagin, cinobufotalin) and evaluated the inhibitory effect of the compounds with relatively high content on two non-small cell lung cancer cells in vitro. Herein, we found out the key pharmacophores of bufadienolides and further investigated the possible mechanism of arenobufagin, which is most significant correlated with antitumor activity.

2. Results and Discussion

2.1. HPLC Fingerprints and Similarities Analysis

2.1.1. Establishment of the Fingerprint of Toad Venom

The HPLC fingerprints for 21 batches of toad venom samples are shown in Figure 1, which was matched by the Similarity Evaluation System for Chromatographic Fingerprints (version 2012.130723). Peaks with good separation and relatively large areas were determined as common peaks. Therefore, 19 peaks were matched by comparing their peak shape and HPLC retention time, which account for more than 90% of the total chromatographic peak area (Figure 2). The areas of 21 batches of toad venom extracts samples are listed in Table 1. The peak area for peaks lacking in chromatograms was defined as “0”. The RSDs of the RPAs and RRTs were determined for the 19 characteristic chromatographic peaks within a run time of 90 min. As seen from the table, the same ingredients from different batches of samples have different contents, showing quality differences between the extracts.

2.1.2. Similarity Analysis of the HPLC Fingerprints

To verify quality differences between the samples, similarities between the entire chromatographic profile of the 21 batches of toad venom and the reference chromatogram were analyzed by the Similarity Evaluation System for Chromatographic Fingerprints (version 2012.130723). The similarity range between each batch of toad venom and the standard was 0.771–0.984, indicating certain differences among the 21 batches (Table 2).

2.1.3. PCA Results

In view of the complex composition of toad venom, we used principal component analysis, a dimension reduction method, to transform complex multivariables to a few comprehensive indices. The factor extract and factor rotation for each variable are shown in Table 3 The eigenvalue of the first six principal components in the PCA of the toad venom extracts was large (average > 1). According to the principal determining number of the components, the contribution rate of more than 85% was set as the principal component extract standard; the first six principal components were extracted for analysis. The first five components account for 89.575% information of the overall index (Table 4).
The aboriginal data represented by six principal components were Y1, Y2, Y3, Y4, and Y5. The quality appraise model of toad venom was established as the comprehensive evaluation function of toad venom:
Y = (Y1 × 40.507 + Y2 × 18.942 + Y3 × 14.137 + Y4 × 8.943 + Y5 × 7.047)/89.575
The quality of toad venom from different batches was assessed by calculating the comprehensive scores using the expression above. The higher the comprehensive score, the better the quality of the products is.

2.2. Anti-Tumor Activity

Cell proliferation assay was applied to distinguish the pharmacodynamics and in vitro cytotoxicity of the toad venom extracts on A549 cells. As shown in Figure 3 and Table 5, the lowest ratio was 71.752% (sample 3), and the highest ratio was 96.811% (sample 21). The test results showed a significant difference in the pharmacodynamics of these extracts. These data provide a basis to study the screen of the main active ingredients.

2.3. Identification of Active Constituents

2.3.1. GRA (Grey Relation Analysis) Results

To identify the active components, firstly, we used the pharmacodynamic indexes as the reference series, and the 19 common peaks as the compared series. After the normalization of the original data by “Z-SCORE”, the gray relational coefficients for each common peak were obtained. As shown in Table 6, the contribution of the components of toad venom on the pharmacodynamics are sorted from high to low: 7 > 8 > 6 > 11 > 15 > 9 > 13 > 1 > 16 > 14 > 4 > 12 > 5 > 3 > 17 > 18 > 10 > 2 > 19. The relational grade of components 7 and 8 was greater than 0.8, which means that they had a significant correlation with the pharmacodynamic activity. Components 6, 11, 15, 9, 13, 1, and 16 had correlation coefficients between 0.7 and 0.8, which means a close correlations to cancer cell proliferation activity. The correlation degree of the remaining components, except for component 19, was between 0.6 and 0.7. It can be derived from Table 1 and Table 2 that the samples with relatively higher areas of peaks of 7, 8, 6, 11, 15, 9, 13, 1 and 16 show better pharmacodynamic activity. These results agree that these ingredients contribute to pharmacological effects with different degrees.

2.3.2. CCA (Canonical Correlation Analysis)

Secondly, CCA was applied to assess the relationship between the areas of 19 peaks in fingerprints and the proliferation inhibition rate. The Pearson correlation of the two groups of variables was calculated using canonical correlation analysis by SPSS software. The results are shown in Table 7. A positive correlation coefficient suggests a positive correlation with the antitumor activity, while a negative correlation coefficient indicate that it is negatively correlated with the antitumor activity. As a result, compounds 6, 7, 8, 11, 13, 15, 16, and 14 had a strong correlation with the inhibition rate. In conclusion, these components might be the main components inhibiting the proliferation of A549. Here, we noticed that the coefficient of some components were negative, such as 19 peak, which was resibufogenin. However, according to known references [27], resibufogenin also shows some antitumor effects on A549 cells with IC50 of about 25 nM [28], which means that resibufogenin also has some degree of antitumor activity. To explain this result, we analyzed the relationship between the peak areas of 6, 7, 8, 11, 13, 15, and 16, the most significant peaks according to our analysis, and peak 19 with CCA. The results showed that the coefficients between them are −0.709; −0.704; −0.742; −0.466; −0.692; −0.447; −0.471, respectively, which means that they had a significant negative correlation. According to the presented reference [16], the IC50 value of arenobufagin in A549 is less than 10 nM, which indicates a much higher antitumor activity than resibufogenin. Thus, when resibufogenin content is higher, the contents of the seven components mentioned above are lower, which lead to a reduction in antitumor effects and a negative coefficient between them.

2.3.3. OPLS (Orthogonal Partial Least Squares) Analysis

Thirdly, the spectrum-effect relationship between the peak area of the fingerprint and the inhibition rate of A549 cells was analyzed by OPLS. The data of the peak area and the pharmacological test were transferred into the Microsoft program Simca-p 14.1 (Demo version). All variables were preprocessed by unit variance scaling before analysis. The calibration model presented in Figure 4 showed a good concordance between the predicted values and the actual values. The OPLS model with five principal components exhibited satisfactory fitting capacity (R2 = 0.972) and predictive ability (Q2 = 0.927), with a root mean square error of estimation (RMSEE) of 1.35 and a root mean square error from cross-validation (RMSECV) of 1.84. Using the variable importance in projection (VIP) plot, variables with a greater VIP score (larger than 1) are selected as the main active components with significant influence on anti-tumor activity. As presented in Figure 5, the main chemical components with greater VIP scores (marked by red bars), in descending order, were peaks 7, 8, 19, 11, 2, 6, 15, 13, and 16.
The characteristic components integrated by the above chemometric analysis were generally consistent. The intersections of OPLS, the correlation analysis, and gray correlation analysis results were components of 7, 8, 6, 11, 15, 13, and 16, which should be the main active components in toad venom that inhibit the proliferation of A549 cells.

2.4. Structural Identification by HPLC-TOF-MS

HPLC-ESI-Q-TOF-MS/MS with positive ion mode of ESI was used to qualitatively assign the structures of the above compounds. The MS data of seven identified active compounds are shown in Table 8, The fragmentation pathways and the typical MS/MS spectrums of the screened compounds are shown in the Supplementary Materials. The structural identification of the correlated peaks showed that 6 was hellebrigenol, 7 was arenobufagin, 8 was hellebrigenin, 11 was 19-oxo-cinobufotalin, 13 was telocinobufogenin, 15 was 19-oxo-cinobufagin, and 16 was cinobufotalin, respectively. The structures of the seven components are shown in Figure 6. Previous reports have shown that the basic bufadienolide skeleton of a steroidal A/B cis and C/D cis structure with a α- pyrone ring at position C17 is crucial to maintain the activity; the 5 β- hydroxy substituent increased the activity. According to the results, all of the characteristic peaks have minor groups at the C-1 position, the minor electron-donating group, hydrogen acceptor or donor substituent at the C-3site, which would exhibit a higher antitumor activity. Compound 7 with 11α-hydroxyl and 12-carbonyl groups exhibited the strongest inhibitory effects, illustrating that such structural character would contribute to cytotoxic activity, which is consistent with a related report [3]. The hydroxymethyl (electron-donating) at the C-10 position of compound 6 and aldehyde (hydrogen donor) at the C-10 position of compounds 8, 11, and 15 as the electron-donating group would enhance antitumor activity [3].

2.5. Confirmation of Effectiveness and Mechanism Research

To further verify the analysis results, the inhibitory effects of the screened compounds on the viability of the NSCLC cell lines (A549, H157) were detected by MTT assay. The results were represented as IC50 values (shown in Table 9 and Figure 7). All the bufadienolides tested showed a significant inhibiting effect on the proliferation of A549, H157 in a dose-dependent manner, illustrating that these compounds have an excellent anti-NSCLC effect. To explore the underlying mechanism, arenobufagin was selected to induce apoptosis in A549 cells. By staining cells with fluorescein annexin V-FITC and PI, it was further proved that arenobufagin treatment increased the frequency of apoptotic (annexin positive) cells in a dose-dependent manner (Figure 8a). Western blot analysis showed that the expression of the cleaved PARP was significantly enhanced after arenobufagin treatment. PARP is a group of nuclear enzymes that catalyze the transfer of ADP-ribose to target proteins [29]. It plays a significant role in many cellular processes, including regulation of chromatin structure, transcription, replication, recombination, and DNA repair [29]. The cleavage of PARP has been used as a marker of apoptosis in western blot analysis; our experimental results showed that arenobufagin induced the cleavage of PARP in a concentration-dependent manner (Figure 8b). In general, the cytotoxicity of bufadienolides in NSCLC may be associated with apoptosis, which means that arenobufagin has the potential to become a candidate for PARP inhibition.

3. Materials and Methods

3.1. Materials and Reagents

Twenty-one batches of toad venom derived from Bufo gargarizans Cantor were collected from Jiangsu China. The reference substances, including arenobufagin, telocinobufogenin, and cinobufotalin were provided by Yuanye Bio-Technology Co, Ltd. (Shanghai, China). The purity of all the substances was detected to be higher than 98% by HPLC-DAD. HPLC grade acetonitrile, formid acid, and ammonium formate were obtained from Aladdin Bio-Chem Technology Co, Ltd. (Shanghai, China). Ultra water was prepared by using a Milli-Q plus system (Millipore, Billerica, MA, USA).

3.2. Cell Culture

Human No-Small Cell Lung Cancer cell lines were obtained from Cobioer Biosciences (Nanjing, China). Cell lines A549 and H157 was cultured in RPMI-1640 supplemented with 10% foetal bovine serum in an incubator with 5% CO2 at 37°C. Cell lines were authenticated by short-tandem repeat genotyping performed by the Shanghai Bio Wing Applied Biotechnology Company (Shanghai, China), displaying identical morphology as cells provided by ATCC.

3.3. Preparation of Extracts and Standard Solutions

Each batch of toad venom was ground to 40 mesh, and precisely measured powder (5 g) was immersed in methanol (50 mL) and then extracted thrice by reflux for 1 h. The extract was filtered, combined, and concentrated in a rotary evaporator by evaporation and vacuum (60 °C water bath) and then dried in a vacuum freeze-drying machine. For the HPLC analysis, the precisely measured final filtrate was diluted with methanol to 25 mL, and then the mixture was filtered through a 0.22 μm filter before HPLC analysis. The final concentration was 2 mg/mL.

3.4. Instrumentation and Analysis Conditions

3.4.1. HPLC Conditions

In our previous works, the HPLC analysis method with satisfactory selectivity and efficiency was established [30]. The HPLC analysis was performed with the Agilent 1200 system (Agilent Technologies, Tokyo, Japan) with an X Bridge reverse phase C18 column (4.6 × 250 mm, 5μm). The mobile phase was composed of 0.3% Acetic Acid-10mmol ammonium acetate water (A) and acetonitrile (B). The gradient program was 97–95% A for 0-7 min, 95–95% A for 7–11 min, 95–85% A for 11–13, 85–85% A for 13–25 min, 85–76% A for 25–27 min, 76–72% A for 24–45 min, 72-68% A for 45–60 min, 68–50% A for 60–75 min, and 50–97% A for 75–90 min. The flow rate was 0.7 mL/min with a sample injection volume of 10 μL. Temperature was maintained at 30 °C and detection wavelength was set at 296 nm.

3.4.2. HPLC-MS Conditions

HPLC-MS analysis was conducted by AB Triple TOF 5600 plus Mass spectrometer (AB SCIEX, Framingham, USA) in positive electrospray ionization (ESI) mode with the liquid chromatography system (Waters Corp., Milford, MA, USA). Specific experimental methods and conditions were conducted as we reported previously [30]. The accurate mass and compounds’ structure was calculated by Peak View Software (AB SCIEX, version 1.2.0.3).

3.4.3. Flow-Cytometric Analysis

Apoptosis degree was measured by Annexin V staining (Biosharp Biotechnology (Shanghai, China)). Firstly, A549 cells were incubated with the tested compound (arenobufagin) for 48 h, then collected from six-well plates, washed once with cold PBS (4C), and centrifuged (2000 rpm for 5 min) before being suspended with a 300 μL binding buffer. Annexin V-FITC (6 μL) was then added and the cells were stained in the dark for 15 min before adding 6 μL propidium iodide and 300 μL binding buffer. Apoptosis quantification was counted by flow cytometry (FC 500MCL, Beckman Coulter, Indianapolis, IN, USA).

3.4.4. Western Blot Analysis

The cell samples were treated with arenobufagin (0, 5, 10, 25 ng) for 48 h. After incubation, the cells were suspended in lysis buffer (Tris-HCl, NaCl, EDTA, EGTA, NP-40 and PMSF) (Beyotime Institute of Biotechnology) on ice for 30 min and vortexed for 60 s, then centrifuged at 16,000 rpm at 4 °C for 20 min. Protein content was quantified by BCA assay kit (Thermo Fisher Scientific, Waltham, MA, USA). Protein samples with appropriate concentration were loaded on 10% sodium dodecyl sulfate-polyacrylamide gel electrophoresis (SDS-PAGE) gel in a 2 h run under 100 V. Subsequently, the proteins were transferred to polyvinylidene fluoride (PVDF) membranes by wet transfer electrophoresis. The membranes were blocked with skimmed milk before being incubated with the primary detection antibody PARP (Cell Signaling Technology, 1:1000), after being washed by TBS-T for 30 min. The membranes were then probed with counterpart secondary antibodies (Cell Signaling, 1:5000), and visualized by chemiluminescence (Bio-Rad, Hercules, CA, USA).

3.5. Cytotoxicity Assay

A-549 cell line were cultured in RPMI 1640 medium with 10% foetal bovine serum, 1% penicillin and streptomycin, and kept at 37 °C in an incubator with a 5% CO2 atmosphere. After being cultured for 24 h, the extracts were added and the cells were incubated for 72 h; 20 μL MTT (5 mg/mL) was then added and the cells were incubated for 4 h. 150 μL of DMSO was used to dissolve formazan crystals that were formed. Absorbance of the solution was measured with a spectrophotometer (Synergy 2, BioTek, Winooski, VT, USA) at 490 nm. The inhibition ratio was calculated by the following formula:
OD   of   negative   control -   OD   of   experimental   group OD   of   negative   control - OD   of   blank   control × 100 %

3.6. Spectrum-Effect Relationship Analysis

Based on the tested spectral and pharmacodynamic data, gray relational analysis, orthogonal partial least square (OPLS) regression, and pearson correlation analysis were applied to establish the spectrum-effect relationship and screen variables.

3.7. Statistical Analysis

Data were expressed as means ± standard error (SE). Statistical analysis was performed using Graph Pad computer software Version 7.00. The levels of significant difference were set at p < 0.05, p < 0.01.

4. Conclusions

In this study, the inhibitory effects of toad venom extracts on A549 cells were researched, and a spectrum-effect relationship analysis model was established with satisfactory fitting accuracy and forecasting precision, and utilized to screen the main bioactive components in toad venom extracts. The results showed that toad venom extracts with different proportions markedly inhibited the proliferation of non-small cell lung cancer cell (A549). Through further chemometrics and LC-MS analysis, a total of seven characteristic peaks were identified, of which arenobufagin (P7), telocinobufogenin (P13), and cinobufotalin (P16) were verified to have significant anti-cancer effects on several NSCLC cells. These constituents may have the potential to search for new compounds for cancer and other diseases. This study also revealed the putative mechanism that involves apoptosis via cleavage of PARP induced by arenobufagin in A549 cells. On account of the finding that some homologous recombination deficient tumors may depend on PARP-mediated DNA repair for survival, PARP inhibitors may increase tumor susceptibility to DNA-damaging agents. This study may provide a scientific foundation to further explore the mechanism of toad venom extracts in inhibiting the proliferation of cancer cells. Besides, it may also provide an eligible universal model for assessing the spectrum-effect relationship and screening of potential active agents in TCMs.

Supplementary Materials

Figure S1: the typical MS/MS spectrum of hellebrigenol; Figure S2: the typical MS/MS spectrum of arenobufagin; Figure S3: the typical MS/MS spectrum of hellebrigenin; Figure S4: the typical MS/MS spectrum of 19-oxo-cinobufotalin; Figure S5: the typical MS/MS spectrum of telocinobufogenin; Figure S6: the typical MS/MS spectrum of 19-oxo-cinobufagin; Figure S7: the typical MS/MS spectrum of Cinobufotalin; Figure S8: the supplementary information of WB.

Author Contributions

J.-H.W., Y.-T.C., and L.-H.W. designed the experiments. J.-H.W. performed the experiments. J.-H.W. and Y.-T.C. analyzed the data. J.-H.W. wrote the manuscript. L.-H.W. and H.-Y.P. revised the manuscript. All authors have read and agreed to the published version of the manuscript.

Funding

This work was supported by the Intelligent Manufacturing Major Project (grant number SQ2018ZX091726).

Acknowledgments

We sincerely acknowledge Hongfei Ni from Zhejiang University for writing the code of GRY.

Conflicts of Interest

The authors declared that there is no conflict of interest.

Abbreviations

BRCABreast cancer gene
CCA Canonical correlation analysis
GCGas chromatography
GRAGrey relational analysis
HPLC High performance liquid chromatography
LC-MSLiquid chromatograph-mass spectrometry
NSCLCNon-small cell lung cancer
OPLSOrthogonal partial least square
PARPPoly (ADP-ribose) polymerase
PCA Principal components analysis
RPAsRelative peak areas
RRTs Relative retention times
TCM Traditional Chinese medicines
VIP Variable importance in projection

References

  1. Lee, V.H.F.; Mok, T.; Goto, Y.; Hsue, V.; Yang, L.; Jiang, Y.; Leung, D.; Lau, K.; Tse, P. Differences Between the East and the West in Managing Advanced-Stage Non-small Cell Lung Cancer. Clin. Oncol. 2020, 32, e1–e9. [Google Scholar] [CrossRef] [PubMed] [Green Version]
  2. Zhou, X.; Zhang, Z.; Liang, X. Regulatory Network Analysis to Reveal Important miRNAs and Genes in Non-Small Cell Lung Cancer. Cell J. 2019, 21, 459–466. [Google Scholar] [PubMed]
  3. Liu, J.-S.; Deng, L.-J.; Tian, H.-Y.; Ruan, Z.-X.; Cao, H.-H.; Ye, W.-C.; Zhang, D.-M.; Yu, Z.-L. Anti-tumor effects and 3D-quantitative structure-activity relationship analysis of bufadienolides from toad venom. Fitoterapia 2019, 134, 362–371. [Google Scholar] [CrossRef] [PubMed]
  4. Rao, T.; Tan, Z.; Peng, J.; Guo, Y.; Chen, Y.; Zhou, H.; Ouyang, D. The pharmacogenetics of natural products: A pharmacokinetic and pharmacodynamic perspective. Pharmacol. Res. 2019, 146, 104283. [Google Scholar] [CrossRef] [PubMed]
  5. Zhan, X.; Wu, H.; Wu, H.; Wang, R.; Luo, C.; Gao, B.; Chen, Z.; Li, Q. Metabolites from Bufo gargarizans (Cantor, 1842): A review of traditional uses, pharmacological activity, toxicity and quality control. J. Ethnopharmacol. 2020, 246, 112178. [Google Scholar] [CrossRef] [PubMed]
  6. Chen, D.-Y.; Cui, X.-N.; Zhang, R.; Liu, Y.; Zhou, T.; Li, X.; Gao, S. Effects of cinobufacini injection on hepatocarcinoma cell proliferation, invasion and metastasis. RSC Adv. 2016, 6, 82417–82424. [Google Scholar] [CrossRef]
  7. Jiang, Y.; Liu, L.-S.; Shen, L.-P.; Han, Z.-F.; Jian, H.; Liu, J.-X.; Xu, L.; Li, H.-G.; Tian, J.-H.; Mao, Z.-J. Traditional Chinese Medicine treatment as maintenance therapy in advanced non-small-cell lung cancer: A randomized controlled trial. Complement. Ther. Med. 2016, 24, 55–62. [Google Scholar] [CrossRef]
  8. Zhang, X.; Yuan, Y.; Xi, Y.; Xu, X.; Guo, Q.; Zheng, H.; Hua, B.-J. Cinobufacini Injection Improves the Efficacy of Chemotherapy on Advanced Stage Gastric Cancer: A Systemic Review and Meta-Analysis. Evid. Based Complement. Altern. Med. 2018, 2018, 1–12. [Google Scholar] [CrossRef] [Green Version]
  9. Meng, Z.; Yang, P.; Shen, Y.; Bei, W.; Zhang, Y.; Ge, Y.; Newman, R.A.; Cohen, L.; Liu, L.; Thornton, B.; et al. Pilot study of huachansu in patients with hepatocellular carcinoma, nonsmall-cell lung cancer, or pancreatic cancer. Cancer 2009, 115, 5309–5318. [Google Scholar] [CrossRef] [Green Version]
  10. Qi, F.; Li, A.; Inagaki, Y.; Kokudo, N.; Tamura, S.; Nakata, M.; Tang, W. Antitumor activity of extracts and compounds from the skin of the toad Bufo bufo gargarizans Cantor. Int. Immunopharmacol. 2011, 11, 342–349. [Google Scholar] [CrossRef]
  11. Cai, X.; Chen, F.-Y.; Han, J.-Y.; Gu, C.-H.; Zhong, H.; Teng, Y.; Ouyang, R.-R. Reversal of multidrug resistance of HL-60 adriamycin resistant leukemia cell line by quercetin and its mechanisms. Zhonghua Zhong Liu Za Zhi Chin. J. Oncol. 2005, 27, 326–329. [Google Scholar]
  12. Qi, F.; Zhao, L.; Zhou, A.; Zhang, B.; Li, A.; Wang, Z.; Han, J. The advantages of using traditional Chinese medicine as an adjunctive therapy in the whole course of cancer treatment instead of only terminal stage of cancer. Biosci. Trends 2015, 9, 16–34. [Google Scholar] [CrossRef] [PubMed] [Green Version]
  13. Xu, M.L.; Zheng, Z.-Y.; Xia, Y.-J.; Liu, E.Y.-L.; Chan, S.K.-H.; Hu, W.-H.; Duan, R.; Dong, T.T.-X.; Zhan, C.-S.; Shang, X.-H.; et al. Shexiang Baoxin Pill, a Formulated Chinese Herbal Mixture, Induces Neuronal Differentiation of PC12 Cells: A Signaling Triggered by Activation of Protein Kinase A. Front. Pharmacol. 2019, 10, 10. [Google Scholar] [CrossRef] [PubMed]
  14. Chen, H.; Dong, Q.; Zheng, X. Efficacy of Shexiang Baoxin Pills for the treatment of unstable angina pectoris. Medicine 2019, 98, e17119. [Google Scholar] [CrossRef]
  15. Cheng, C.-S.; Wang, J.; Chen, J.; Kuo, K.T.; Tang, J.; Gao, H.; Chen, L.; Chen, Z.; Meng, Z. New therapeutic aspects of steroidal cardiac glycosides: The anticancer properties of Huachansu and its main active constituent Bufalin. Cancer Cell Int. 2019, 19, 92. [Google Scholar] [CrossRef]
  16. Ma, L.; Zhu, Y.; Fang, S.; Long, H.; Liu, Z.; Liu, Z. Arenobufagin Induces Apoptotic Cell Death in Human Non-Small-Cell Lung Cancer Cells via the Noxa-Related Pathway. Molecules 2017, 22, 1525. [Google Scholar] [CrossRef] [Green Version]
  17. Kai, S.; Lu, J.-H.; Hui, P.-P.; Zhao, H. Pre-clinical evaluation of cinobufotalin as a potential anti-lung cancer agent. Biochem. Biophys. Res. Commun. 2014, 452, 768–774. [Google Scholar] [CrossRef]
  18. Zhang, D.-M.; Liu, J.-S.; Deng, L.-J.; Chen, M.-F.; Yiu, A.; Cao, H.-H.; Tian, H.-Y.; Fung, K.-P.; Kurihara, H.; Pan, J.-X.; et al. Arenobufagin, a natural bufadienolide from toad venom, induces apoptosis and autophagy in human hepatocellular carcinoma cells through inhibition of PI3K/Akt/mTOR pathway. Carcinogenesis 2013, 34, 1331–1342. [Google Scholar] [CrossRef] [Green Version]
  19. Zhang, C.; Zheng, X.; Ni, H.; Li, P.; Li, H. Discovery of quality control markers from traditional Chinese medicines by fingerprint-efficacy modeling: Current status and future perspectives. J. Pharm. Biomed. Anal. 2018, 159, 296–304. [Google Scholar] [CrossRef]
  20. Jiao, Y.; Zuo, Y. Ultrasonic extraction and HPLC determination of anthraquinones, aloe-emodine, emodine, rheine, chrysophanol and physcione, in roots ofPolygoni multiflori. Phytochem. Anal. 2009, 20, 272–278. [Google Scholar] [CrossRef]
  21. Li, Y.; Shen, Y.; Yao, C.-L.; Guo, D.-A. Quality assessment of herbal medicines based on chemical fingerprints combined with chemometrics approach: A review. J. Pharm. Biomed. Anal. 2020, 185, 113215. [Google Scholar] [CrossRef]
  22. Giuliani, A. The application of principal component analysis to drug discovery and biomedical data. Drug Discov. Today 2017, 22, 1069–1076. [Google Scholar] [CrossRef]
  23. Sainani, K.L. Introduction to Principal Components Analysis. PM&R 2014, 6, 275–278. [Google Scholar] [CrossRef]
  24. Bylesjö, M.; Rantalainen, M.; Cloarec, O.; Nicholson, J.K.; Holmes, E.; Trygg, J. OPLS discriminant analysis: Combining the strengths of PLS-DA and SIMCA classification. J. Chemom. 2006, 20, 341–351. [Google Scholar] [CrossRef]
  25. Julong, D. Introduction to grey system theory. J. Grey Syst. 1989, 1, 1–24. [Google Scholar]
  26. Kuo, Y.; Yang, T.; Huang, G.-W. The use of grey relational analysis in solving multiple attribute decision-making problems. Comput. Ind. Eng. 2008, 55, 80–93. [Google Scholar] [CrossRef]
  27. Ichikawa, M.; Sowa, Y.; Iizumi, Y.; Aono, Y.; Sakai, T. Resibufogenin Induces G1-Phase Arrest through the Proteasomal Degradation of Cyclin D1 in Human Malignant Tumor Cells. PLoS ONE 2015, 10, e0129851. [Google Scholar] [CrossRef]
  28. Ning, J.; Yu, Z.-L.; Hu, L.-H.; Wang, C.; Huo, X.; Deng, S.; Hou, J.; Wu, J.-J.; Ge, G.-B.; Ma, X.-C.; et al. Characterization of Phase I Metabolism of Resibufogenin and Evaluation of the Metabolic Effects on Its Antitumor Activity and Toxicity. Drug Metab. Dispos. 2014, 43, 299–308. [Google Scholar] [CrossRef] [Green Version]
  29. Morales, J.C.; Li, L.; Fattah, F.J.; Dong, Y.; Bey, E.A.; Patel, M.; Gao, J.; Boothman, D.A. Review of poly (ADP-ribose) polymerase (PARP) mechanisms of action and rationale for targeting in cancer and other diseases. Crit. Rev. Eukaryot. Gene Expr. 2014, 24, 15–28. [Google Scholar] [CrossRef] [Green Version]
  30. Cao, Y.; Wu, J.; Pan, H.; Wang, L.; Wu, C.; Wang, P. Chemical Profile and Multicomponent Quantitative Analysis for the Quality Evaluation of Toad Venom from Different Origins. Molecules 2019, 24, 3595. [Google Scholar] [CrossRef] [PubMed] [Green Version]
Sample Availability: Samples of the compounds arenobufagin, telocinobufagin, cinobufatolin are available from the authors.
Figure 1. HPLC fingerprints of the 21 batches of toad venom extracts.
Molecules 25 04269 g001
Figure 2. The reference atlas of the toad venom extracts.
Molecules 25 04269 g002
Figure 3. In vitro anticancer activities of 21 batches of toad venom extracts (A549 cells were incubated with 100 ng/mL toad venom extracts for 72 h, and cell viability was examined by MTT assay). Ordinary one-way ANOVA, **** p < 0.00001 indicates a significant difference versus the control group.
Molecules 25 04269 g003
Figure 4. Graphical representation of OPLSR model—calibration model.
Molecules 25 04269 g004
Figure 5. Graphical representation of OPLSR model—VIP plot.
Molecules 25 04269 g005
Figure 6. The structure of compounds identified in toad venom extract.
Molecules 25 04269 g006
Figure 7. The inhibitory effects of arenobufagin, telocinobufagin, and cinobufotalin on A549 cells (a) and H157 cells (b) analyzed by 3-(4, 5-dimethylthiazol-2-yl)-2, 5-diphenyltetrazolium bromide (MTT) assay. ** Indicates statistical significance (p < 0.01).
Molecules 25 04269 g007
Figure 8. Arenobufagin induces apoptosis in A549 cells. A549 cells were incubated with arenobufagin for 48 h. (a) The effects of arenobufagin on apoptosis were analyzed by flow cytometry. (b) Detecting the protein expression levels of PARP by Western blotting.
Molecules 25 04269 g008aMolecules 25 04269 g008b
Table 1. The areas of 19 common peaks from 21 batches of toad venom extracts samples.
Peak No.Retention Time (min)Peak Area of Each Common Peak
Y1Y2Y3Y4Y5Y6Y7Y8Y9Y10Y11
19.37685.4721265.9321250.593974.774957.271010.413867.4021315.784567.429584.134971.966
210.3862341.5751822.8752126.6222296.9532570.1471717.8731900.8182240.3013425.94862.6562442.475
336.284193.39302.598170.118262.23279.122479.702323.213177.92188.042275.066173.418
437.971414.631263.189208.255347.673512.256300.2437.72218.988817.209391.179392.006
538.523218.009304.301157.963261.681300.614498.853236.354166.13767.652225.418174.515
640.95338.50963.92134.15143.39342.23466.91330.69547.20134.15587.1680
743.732796.322388.288644.7451231.959888.4711855.311542.317753.1091129.1934440.8831147.35
844.934336.203705.949289.553264.788264.326554.939327.15330.268324.53776.276206.247
946.0271.965158.015123.149113.56474.126157.364123.155133.01473.051224.50573.266
1046.371178.19653.935123.241123.454190.555117.82384.01114.24370.53591.672168.053
1152.959108.922127.318110.64290.33176.24392.967114.004120.60783.299192.508100.575
1256.132278.008103.34658.983137.138162.316181.121122.91744.30669.387196.867168.316
1359.667500.784638.751462.998393.104661.84667.263425.983484.238466.795791.954390.518
1463.809705.163603.384757.856620.893536.75631.009793.538804.449665.587722.991726.219
1566.0674.869137.60886.24467.82142.847118.539112.33695.84255.426194.19976.422
1667.864869.363862.359956.45818.259962.528833.387721.2041037.25964.1451261.244805.822
1774.282970.366671.157892.667814.774802.975708.759947.063943.754784.519915.178973.719
1878.4381802.4111060.7941323.2551400.6631344.4191077.2351711.7911420.9331131.5591510.6961785.779
1979.3631114.966245.6081367.134670.741953.363297.698744.9731482.981654.029253.4211032.58
Peak No.Retention Time (min)Peak Area of Each Common Peak
Y12Y13Y14Y15Y16Y17Y18Y19Y20Y21CV(%)
19.37998.21125.9081116.5971222.232885.401947.145601.786796.4561034.799517.40232.773
210.3862203.6851608.9691919.3921507.2451448.3482321.3151767.3013984.17772353.645784.15640.181
336.28465.65382.77264.76576.48491.1490597.063132.25722.805103.00179.659
437.971351.957283.128295.579240.11250.434556.838278.2111056.185518.699315.57753.743
538.52315.17689.52722.87878.50784.59927.898836.463127.61120.97832.686101.301
640.95334.93164.0962.81261.7767.033060.75930.90625.36481.6748.868
743.7321635.473586.323332.6112859.2963313.979717.5761623.3321625.0241175.5474467.31164.492
844.934375.359634.314589.977631.747692.713232.513295.089147.852230.011958.44253.793
946.0289.782132.715157.811115.53672.42440.403135.07103.15857.537220.92643.073
1046.37172.17655.59450.86473.423111.9342.77681.7227.89451.45678.42948.275
1152.959117.558155.192162.858143.066122.80191.86272.38363.942126.348276.66940.041
1256.13246.64553.16347.91955.50177.482050.56844.809090.82673.015
1359.667665.861805.232608.0211151.5741550.478478.644876.384242.865449.2811101.23449.667
1463.809789.828481.103601.599487.236426.751976.433687.474621.274849.1461023.15228.965
1566.0672.39196.853115.22782.11449.21151.28498.74686.33848.269237.90249.644
1667.8641366.0211218.544984.3371268.3171582.709988.8241173.91621.8451066.5431880.64833.838
1774.282894.732534.174647.725531.19447.471156.133624.348711.0821222.5571032.66431.124
1878.4381628.258785.547922.434665.363439.3852547.92690.1997.9352615.1881707.98545.175
1979.363780.744130.92187.112107.876229.7761226.677148.2822007.6341501.246329.41175.945
CV(%) = standard deviation/the average value of the peak area × 100%.
Table 2. Similarity of fingerprints’ chromatogram of toad venom extracts from 21 batches.
Sample NumberSimilaritySample NumberSimilarity
S10.918S110.945
S20.968S120.984
S30.908S130.906
S40.963S140.934
S50.943S150.918
S60.975S160.878
S70.978S170.892
S80.914S180.928
S90.850S190.771
S100.860S200.921
S210.865
Table 3. Score coefficient matrix of the chemical constituents.
Component
Peak No.12345
1−0.118−0.152−0.424−0.527−0.597
2−0.866−0.136−0.1920.3590.095
30.168−0.6550.6350.15−0.235
4−0.5940.146−0.0860.6980.306
50.101−0.6890.5370.134−0.224
60.908−0.1690.0230.186−0.004
70.8960.193−0.1590.230.111
80.9430.168−0.0720.0170.066
90.7810.090.3410.289−0.299
10−0.121−0.3830.478−0.5480.453
110.7590.6010.061−0.050.041
120.119−0.3320.662−0.1310.461
130.774−0.095−0.314−0.1920.313
14−0.1920.7750.474−0.019−0.188
150.7240.3340.4310.295−0.167
160.7020.386−0.197−0.1650.28
17−0.4480.7050.5−0.181−0.031
18−0.4790.6890.395−0.24−0.021
19−0.8520.264−0.0010.1810.092
Table 4. Total variance explanation of PCA.
ComponentInitial EigenvaluesExtraction Sums of Squared Loadings
Total% of VarianceCumulative %Total% of VarianceCumulative %
17.69640.50740.5077.69640.50740.507
23.59918.94259.4493.59918.94259.449
32.68614.13773.5862.68614.13773.586
41.6998.94382.5281.6998.94382.528
51.3397.04789.5751.3397.04789.575
Table 5. The inhibition rate of toad venom extracts ( x - ± s, n = 3).
Sample No.Inhibition Rate (%)
182.758 ± 1.192
289.852 ± 3.958
371.752 ± 4.590
482.715 ± 4.122
575.331 ± 11.816
687.305 ± 1.107
786.358 ± 5.267
875.634 ± 3.630
979.423 ± 9.368
1096.727 ± 2.171
1176.740 ± 7.320
1284.24 ± 10.231
1392.718 ± 4.874
1491.383 ± 3.542
1590.938 ± 7.262
1690.677 ± 6.707
1786.152 ± 4.317
1884.362 ± 4.218
1980.842 ± 6.811
2088.343 ± 6.446
2196.811 ± 0.330
Table 6. The gray relationship grade and their order between 19 peak areas and antitumor effect of toad venom extracts.
Peak NumberGray Relation GradeOrderPeak NumberGray Relation GradeOrder
10.718 8100.623 17
20.621 18110.791 4
30.633 14120.656 12
40.668 11130.734 7
50.647 13140.669 10
60.799 3150.764 5
70.827 1160.714 9
80.810 2170.624 15
90.760 6180.623 16
190.588 19
Table 7. The correlation coefficients between characteristic peaks and A549 cell proliferation inhibition rate.
Peak No.Pearson Correlation CoefficientPeak No.Pearson Correlation Coefficient
70.860 **80.793 **
2−0.677 **60.637 **
160.548 *90.524 *
12−0.0363−0.102
17−0.194−0.222
110.696 **19−0.686 **
150.579 **130.566 **
10−0.494 *14−0.02
18−0.1065−0.142
1−0.238
Notes: Pearson correlation, “r” represent the relevant strength; *, 0.5 ≤ ∣r∣ ≤ 0.8 indicates significant correlation; **, 0.8 ≤ ∣r∣ ≤ 1 indicates very significant correlation.
Table 8. MS data of 7 predicted active compounds (peaks) in toad venom.
Peak No.tR(min)MS1(m/z)MS2(m/z)FormulaError
(ppm)
Structural Identification
640.953419.2405401.2272; 371.2177;
365.2109; 353.2091; 335.1992
C24H34O6−3.4Hellebrigenol
743.732417.2254399.2151; 381.2046; 363.1945; 335.1998; 317.1893; 289.1944C24H32O6−3.0Arenobufagin
844.934417.2259399.2154; 381.2054;
363.1949; 345.1844; 335.201; 317.1893
C24H32O6−2.8Hellebrigenin
1152.959473.2153431.2061; 395.1847; 377.1739C26H32O8−3.419-oxo-cinobufotalin
1359.667403.2461385.2359; 367.2256; 349.215; 321.2201; 303.2095C24H34O5−3.0Telocinobufogenin
1566.06457.2233415.2098; 397.1992; 379.189; 361.1786; 333.1840C26H32O7−3.719-oxo-cinobufagin
1667.864459.2353417.2255; 381.2047; 363.194; 335.1995C26H34O7−4.6Cinobufotalin
Table 9. The inhibitory effects of bufadienolides on A549, H157 cells.
IC50(ng/mL)ArenobufaginTelocinobufaginCinobufatolin
A54912.530 ± 3.40627.882 ± 17.29123.082 ± 4.460
H1578.908 ± 1.25123.606 ± 7.381131.123 ± 21.009
Data was presented as mean ± S.E. The experiments were performed at least three times. IC50 is expressed as the concentration of drug inhibiting cell growth by 50%.

