Article

Copper Flash Smelting Process Balance Modeling

by
María Bacedoni
1,2,*,
Ignacio Moreno-Ventas
1,2 and
Guillermo Ríos
3
1
Department of Earth Science, University of Huelva, Avenida de las Fuerzas Armadas S/N, 21007 Huelva, Spain
2
Research Center for Sustainable Chemistry (CIQSO), University of Huelva, 21007 Huelva, Spain
3
Atlantic Copper S.L.U., Avenida Francisco Montenegro S/N, 21001 Huelva, Spain
*
Author to whom correspondence should be addressed.
Metals 2020, 10(9), 1229; https://doi.org/10.3390/met10091229
Submission received: 15 July 2020 / Revised: 28 August 2020 / Accepted: 9 September 2020 / Published: 11 September 2020

Abstract

:
Process control in flash smelting is based on mass and energy balance from which the operational parameters (oxygen coefficient, oxygen enrichment, and flux demand) are obtained to achieve matte and slag with defined compositions and at defined temperatures. Mineral compositions of copper concentrates, and their blends, have been used in order to optimize the heat process balance. The classical balance methodology has been improved by using equations for molecular ratios and distribution coefficients that have been calculated using FactSage™. This paper describes the development of balance equations and compares their theoretical (equilibrium) results with industrial data logs of the smelting process.

1. Introduction

Currently, more than 50% of the world’s primary copper is produced by Flash Smelting technology. There are two types of flash smelting: the Outotec process (~30 furnaces in operation) and the Inco process (four furnaces in operation).
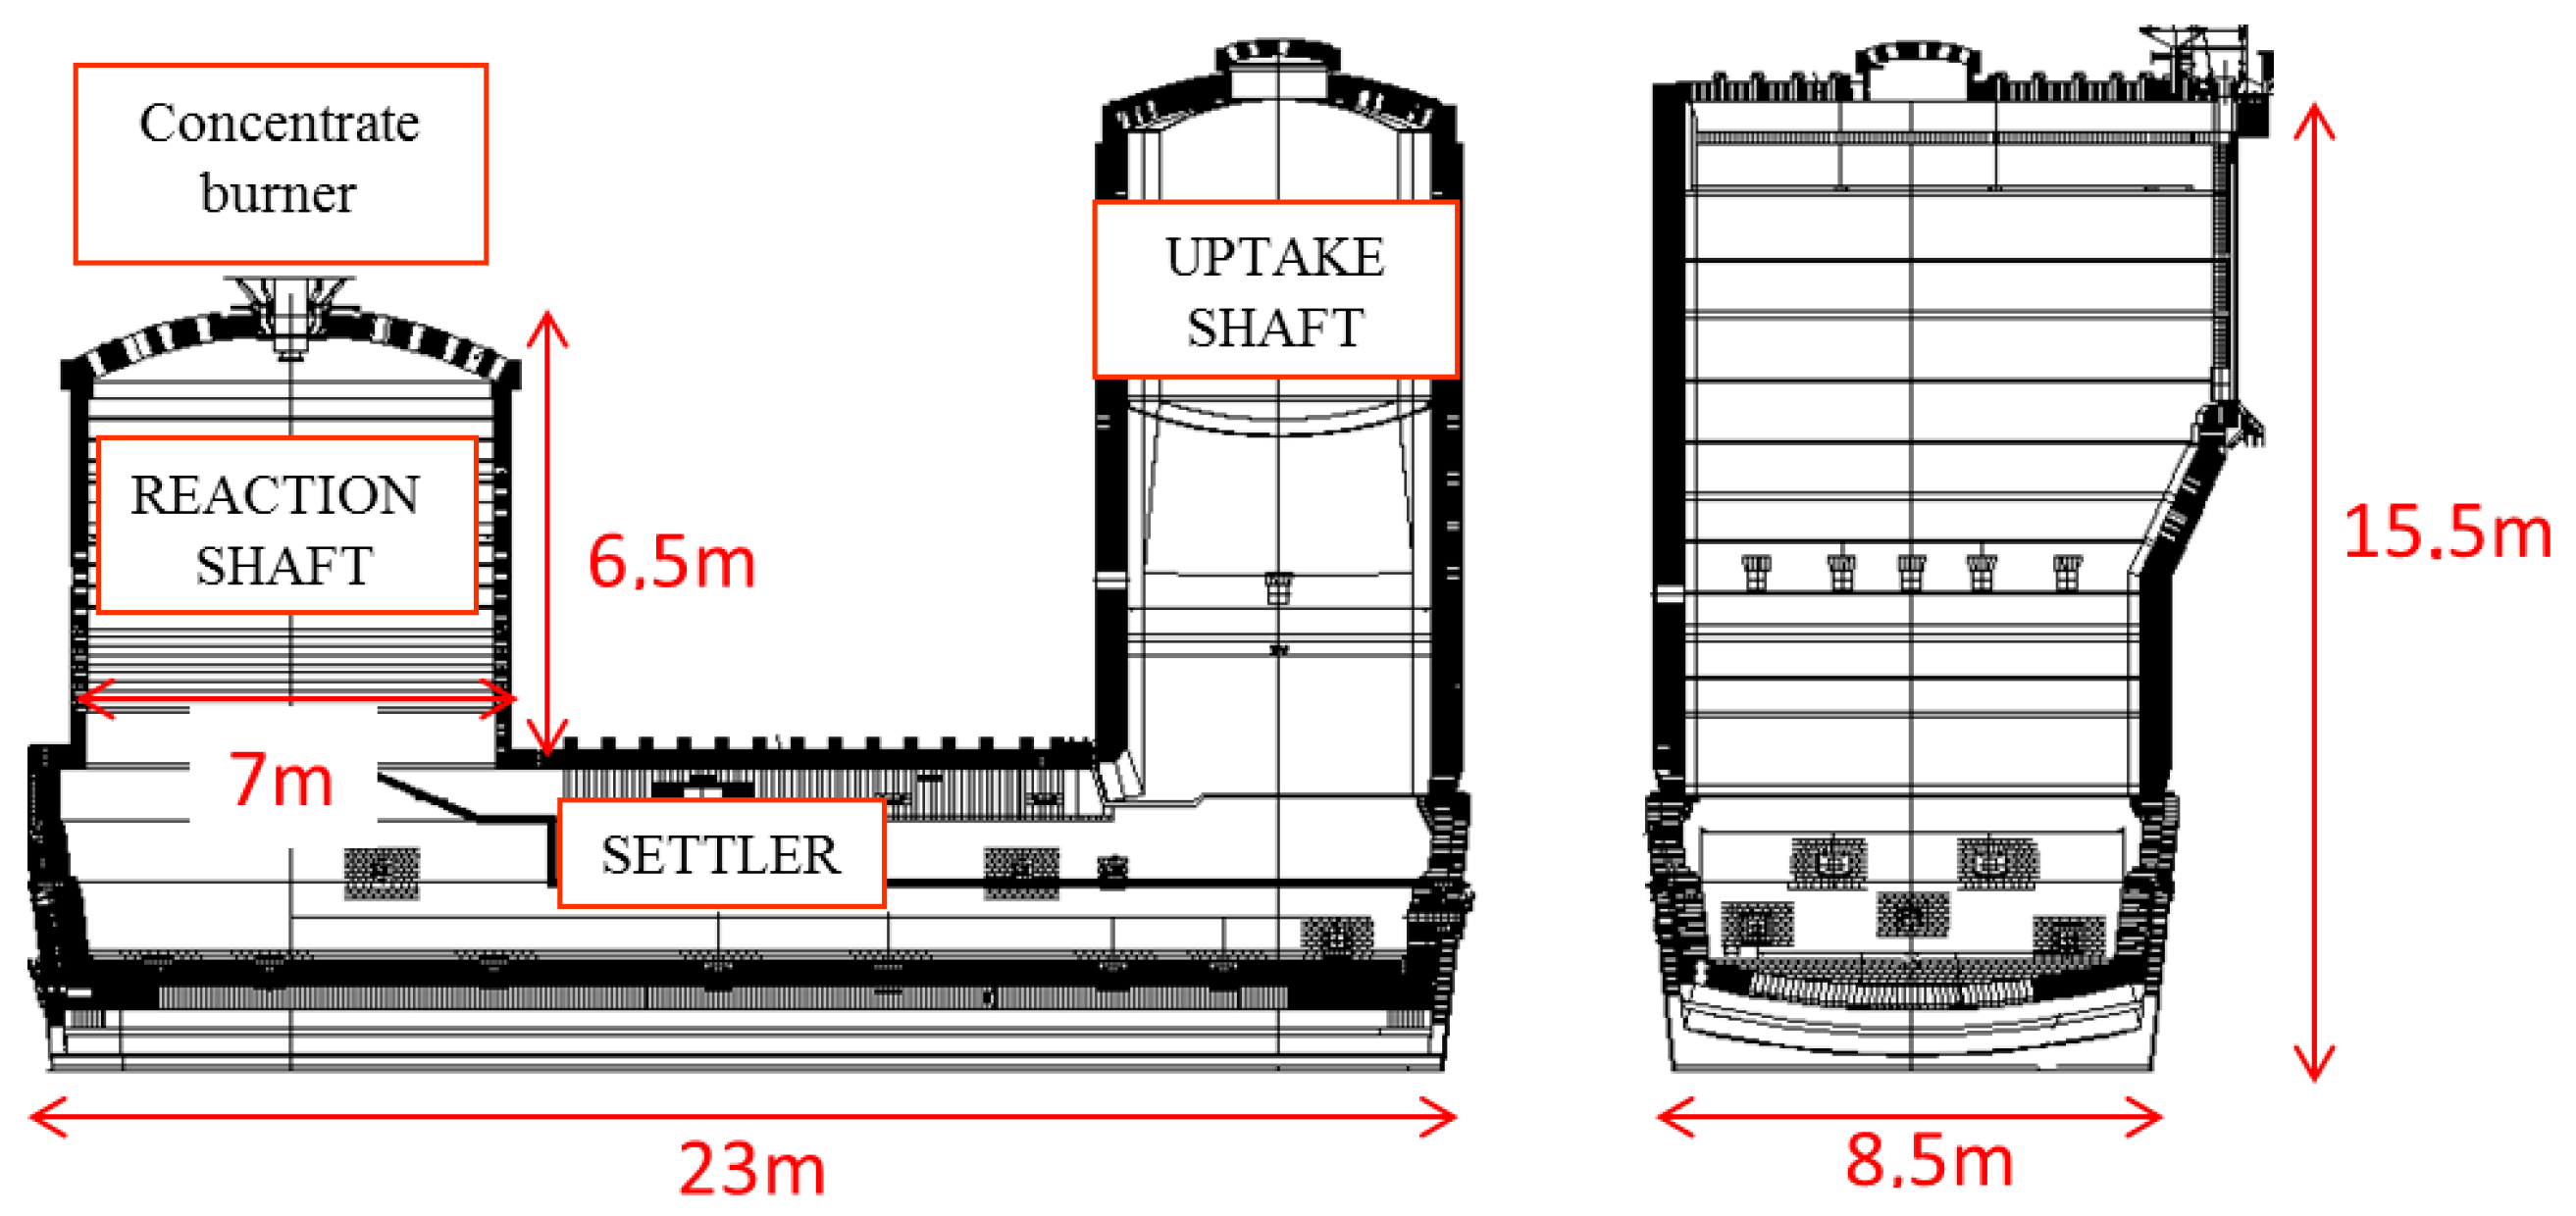
The Outotec Flash Smelting Furnace (FSF) (Helsinki, Finland) comprises three different parts, as shown in Figure 1:
  • Reaction shaft
  • Settler
  • Uptake shaft
The flash smelting entails blowing a well-dispersed mixture of oxygen, air, dried concentrate, and flux into a hot (1300 °C) reaction shaft through the concentrated burner. Under these conditions, the fine concentrate particles of the concentrates react rapidly with the oxygen from the blast in the reaction shaft. This results in controlled oxidation of the concentrate’s iron and sulfur, which is a considerable evolution of heat and melting of the solids. The process is continuous and autothermal and produces:
  • Molten matte (60–65% Cu.)
  • Molten iron-silicate slag (~1% Cu)
  • Off gas with a sufficiently high SO2 content (20–30 vol.%) to capture it efficiently as sulfuric acid and that leaves the furnace through the uptake shaft.
As a result of the flash reactions, drops from two immiscible liquids (matte and slag) that fall onto the flash furnace settler are generated. The difference in density between matte (3900–5200 kg/m3) and slag (3300–3700 kg/m3) [1] produces the separation of these two immiscible phases in the settler. Matte and slag are periodically tapped from the furnace via tap holes located in the settler.
Matte is basically a mix of [Cu, S, Fe + minor elements] (45–75% Cu) whereas slag is basically a system composed of [Si, Fe, O ± Ca, Al, K, Na, Cu − minor elements]. Gaseous products are mainly composed of [SOx (mainly SO2, 10–60 vol.%), N2 ± COx + minor elements]. Smelting reactions are highly exothermic, which makes the process autogenous in energy terms and keeps the temperature within 1250–1350 °C.
Regarding the operation of the FSF, the key variables to be controlled are:
  • Matte grade by setting the oxygen coefficient (Nm3 O2/ton of concentrate).
  • SiO2 content in slag by means of an appropriate flux dosing.
  • Slag temperature adjusting the oxygen enrichment of the process air and/or by using auxiliary hydrocarbon burners.
This process control is usually carried by means of process models, such as the very well-known Outotec Process Advisor [2], which is a combined feedforward (concentrate blend assays, feed rate, etc.) and feedback (data from smelter melt, field measurements such as temperatures and levels, dynamic heat, and material balance to calculate the set points for the oxygen coefficient and enrichment, flux dosing, and burner fuel amount.
Nevertheless, it should be noted that most copper smelters worldwide, such as Atlantic Copper, are custom smelters that treat copper concentrates from different mines, which are blended onsite to ensure a relatively stable feed in terms of chemical composition. This blend of concentrates incorporates other smelter recirculating materials, such as flue dust, converter slags, and/or reverts [3]. These concentrate blends are characterized by their S/Cu ratio (blends used for this study have values between 1.12–1.14), where a high S/Cu ratio implies high iron content in the blend [4]. In this way, it should be of interest for copper smelters to develop a model that may incorporate mineralogical data from the copper concentrates.
On the other hand, an appropriate control of matte grade as well of slag chemistry is of great importance to minimize the copper solubility in the slag.
The present paper focuses on developing a process modeling, using a classical mass and energy balance methodology modified by distribution coefficients and molecular ratios calculated with the FactSage™ software of the flash furnace operation, which incorporates the mineralogical data from copper concentrates. Lastly, a comparison of the results of this model to those from industrial operational data for the same set of blends and operational conditions is presented.

2. Methods

2.1. Sampling Methods

Sampling of the polymetallic concentrates was carried out directly at the Atlantic Copper concentrate sampling plant. Samples of flux, recirculating and circulating dust, converter slag, and secondary materials were taken at their corresponding silos.

2.2. Analytical Methods

Microscopy techniques were used for the microanalytical and mineralogical characterization of the concentrates, and the molten material entrained by the furnace off gas was analyzed [5,6,7,8,9,10]. A scanning electron microscope (SEM, FEI-QUANTA 200, ThermoFisher Scientific, Waltham, MA, USA) was used mainly to get backscattered images of textures. The operating conditions were 20 kV and a high vacuum atmosphere. An electron probe microanalysis (EPMA, JEOL model JXA-8200 SuperProbe, JEOL Ltd. Akishima, Tokyo, Japan) was also performed. The microprobe was operated at an accelerating voltage of 15 Kv, a beam current of 20 nÅ, and a spot size of 1–5 μm depending on the size of the crystals analysed. The calibration standards used were the following: pyrite (S and Fe), chalcopyrite (Cu), sphalerite (Zn), galena (Pb), stibnite (Sb), Mo (Mo°), Ag (Ag°), Ni (Ni°), Au (Au°), As (Zn3As2), Se (SnSe), Bi (Bi2S2), Sn (SnSe), and Cd (CdTe) y Te (CdTe). The conventional ZAF (atomic number (Z), absorption effect (A), Fluorescence effect (F) correction procedure was applied to the data. Prior to the analyses, polished probes were prepared using epoxy resin (300-mm in diameter). The major crystalline phases of the recycling materials (recirculating dust, flue dust, reverts, and converter slag) were identified by x-ray diffraction (BRUKER D8 ADVANCE diffractometer, BRUKER, Billerica, MA, USA), using radiation Kα of the copper (Kα = 1.5406 Å) excited with 30 mA and 40 kV. The working conditions were: exploration interval 3° to 65° 2θ, angle increment was 0.2°, and exposure time per step was 0.6 s. The chemistry of the copper concentrate and recycling materials was determined using x-ray fluorescence spectroscopy [7,11,12].

2.3. Calculation Method

In this study, the copper smelting process has been modelled using a mass and energy balance [13] implemented with equations for coefficient distribution parameters of copper, lead, and zinc. Minor elements distribution and slag matte equilibria have been experimentally and extensively studied [14,15,16,17,18,19,20,21,22,23,24,25,26,27,28]. Furthermore, some equations incorporated molecular ratios (slag PbO/PbS, slag ZnO/ZnS, offgas PbS/PbO, offgas SO2/SO3, and O2 offgas/O2 process air).
The mass and energy balance model has been solved using the linear algebra methodology (Figure 1).
The model was carried out for four different types of blends and 12 single concentrates, according to the standard operation in an industrial smelter (Atlantic Copper smelter (AC))
The unknown variables solved in the model (Figure 2) are described as follows:
  • Mass of O2 in enriched process air (kg/ton of feed).
  • Mass of N2 in enriched process air (kg/ton of feed).
  • Mass of silica in flux (kg/ton of feed).
  • Matte: mass of Cu2S, FeS, ZnS, and PbS in matte (kg/ton of feed).
  • Matte mass (kg/ton of feed).
  • Slag: mass of FeO, SiO2, ZnO, ZnS, PbO, PbS, Cu2O, and Cu2S in slag (kg/ton of feed).
  • Slag mass (kg/ton of feed).
  • Offgas: mass of SO2, N2, Zn, PbS, PbO SO3, and O2 in off gas (kg/ton of feed).
Other unknown variables calculated from the previous list are the following:
  • Oxygen coefficient (OC): volume of oxygen per ton of feed (Nm3O2/ton of feed).
  • Oxygen enrichment (OE): volume proportion of oxygen in the enriched process air (vol.% O2).
The equations worked in the calculation matrix (Figure 2) are mass and energy balance equations.
Mass balance equations are of the general form [13]:
m a s s   o f   e l e m e n t   i   e n t e r i n g   t h e   f u r n a c e = m a s s   o f   e l e m e n t   i   l e a v i n g   t h e   f u r n a c e
Energy balance equation expresses the law of energy conservation applied to the autothermal copper smelting process. Its form is a follow:
e n t h a l p y   o f   t h e   c o m p o n e n t s   + f u r n a c e   h e a t   l o s s e s =   e n t h a l p y   o f   t h e   c o m p o n e n t s e n t e r i n g   t h e   f u r n a c e l e a v i n g   t h e   f u r n a c e

2.3.1. Elemental Mass Balance Equations

The mass balance equations for Cu, Fe, S, Pb, Zn, and O are defined as follows (Equation (3)):
M i R e a c t a n t s = ( j = 1 n C i j × m j ) P r o d u c t s
where Mi is the mass of element i in reactants per ton of feed. Parameter C i j is the concentration of element i in component j (Cu2S, FeS, ZnS and PbS) in the matte, (FeO, ZnO, ZnS, PbO, PbS, Cu2O, and Cu2S) in the slag and (SO2, PbS, PbO, SO3, and O2) in the off gas phase. Parameter mj is the mass of component j in the matte, slag, and off gas phase (as listed before).

2.3.2. Mass Balance Equations for Conservative Molecular Species

For conservative chemical species like N2 and SiO2, similar mass balance equations are applied (Equations (4) and (5)):
M N 2 P r o c e s s   a i r = M N 2 O f f g a s
M S i O 2 F l u x + M S i O 2 B l e n d = M S i O 2 S l a g
The conservative behavior of N2 is due to the fact that this molecule does not participate in the copper smelting reaction. The role of N2 is as a coolant because this molecule increases its temperature from 227 °C of the process air input to 1300 °C of the off gas.
The silica mass is conservative for the smelting reaction due to its participation being linked to the following reaction (Equation (6)).
M S i O 2 F l u x +   M F e O S l a g = M F e 2 S i O 4 S l a g

2.3.3. Mass Balance Equations of Elements i (Cu, Pb, and Zn) Using Distribution Coefficients ( D i α / β ) between Phases α and β

Thermodynamic databases for copper smelting have been developed as a result of experimental and theoretical work [15,16,17,20,21,23,29]. In this study, distribution coefficients (Table 1) have been calculated using thermodynamic databases of FactSage™ [30,31,32,33]. This calculation involves the chemistry of the flash furnace slag (mingled melts of matte and slag) as the composition of the starting material. Through minimization, the Gibbs energy techniques FactSage™ calculates the equilibrium mass and composition off gas, liquid slag, liquid matte, and possible solid phases [22]. The calculations were done for the process temperature (1300 °C). The equilibrium was calculated iteratively to get a matte (62 grade matte(MG)) in equilibrium with slag (SiO2 = 29 wt.%). Concentration data of copper, lead, and zinc in slag and matte were used to obtain the respective distribution coefficients (Equation (7)).
D C u m a t t e / s l a g = C C u m a t t e C C u s l a g
where CCu is the concentration of copper in phase liquid matte in equilibrium with liquid slag. Parameters for copper dissolved in slag have been established by thermodynamic modeling [16].
A similar procedure was used to calculate distribution coefficients of lead and zinc for slag/matte and matte/off gas equilibria.
Mass balance equations using distribution coefficients are Equation (8) for copper.
0 = D C u m a t t e / s l a g × C u 2 S m a t t e × C u   w t %   i n   C u 2 S m a t t e 100 C u 2 S s l a g × C u   w t %   i n   C u 2 S 100 C u 2 O s l a g × C u   w t %   i n   C u 2 O 100

2.3.4. Mass Balance Equations for Molecular Ratios (PbO/PbS Slag, ZnO/ZnS Slag, PbS/PbO off Gas, and SO2/SO3 off Gas)

Molecular ratios (Table 2) were calculated from the chemistry of slag, matte, and off gas in equilibrium at 1300 °C and the specified conditions (62 MG and silica in slag equal to 30 wt.%).
Mass balance equations of this type are exemplified for the SO2/SO3 ratio in off gas (9).
0 = S O 2 o f f g a s + ( S O 2 S O 3 ) o f f g a s × S O 3 o f f g a s
Mass balance equation for O2 off gas/O2 process air ratio was built in a similar way.
The mass balance equation based on the molecular ratio Cu2Smatte/Cu2Sslag (1900.28) was used to track the equilibrium between slag and matte immiscible liquids. This ratio was calculated through a similar methodology since it was used with distribution coefficients.

2.3.5. Mass Balance Equations for Slag Composition (9) and Matte Grade (10)

In this study, the silica content of slag (29 wt.%) was used as the parameter to specify the slag composition since it is registered in the industrial data logs (AC). Matte composition used for the model was 62 MG.
Mass balance equation for silica is the following (10):
( m a s s   S i O 2 ) S l a g = 0.29 s l a g _ m a s s
Mass balance equation for matte is the following (11):
0 = m a s s   m a t t e × 62 % C u   i n   m a t t e 100 m a s s   C u 2 S   i n   m a t t e × 80 % C u   i n   C u 2 S 100

2.3.6. Enthalpy Balance Equation

The conservative energy law applied to the copper smelting reaction is defined through the enthalpy balance equation that basically expresses that input energy must equal output energy. It is necessary to take account the loss energy of the furnace in which the smelting reaction take place.
Reaction reagents consist of concentrates (blends), flux, and process air. Reaction products consist of matte, slag, and off gas. The enthalpy of concentrates and blends was calculated from their mineralogical composition at 25 °C using the FactSage™ FactPS database. The enthalpy of the process air, at 227 °C, was calculated from their chemical composition described in terms of O2 and N2 using the same database. The enthalpy of matte, slag, and off gas, at 1300 °C, was calculated from their chemical composition described in terms of Cu2S, FeS, ZnS, and PbS for matte, SiO2, ZnO, ZnS, PbO, PbS, Cu2O, and Cu2S for slag, SO2, N2, Zn, PbS, PbO, SO3, and O2 for off gas, using the same database.
Typical values for the loss energy parameter of the flash furnace (AC) range between 33,000 and 37,000 MJ/h. This parameter affects directly to the oxygen enrichment need for the smelting reaction. To define a specific value for this parameter within the range, it was estimated to accomplish the oxygen enrichment (50.1 vol.% in operational log of AC for blend 1 smelted for a matte of 64 MG). This value (33,900 MJ/h) was used for all the cases.
For the energy balance, the following general equation was used (Equation (12)).
[ K = 1 n H K , 25   ° C c o n c e n t r a t e × m k c o n c e n t r a t e + C = 1 2 H C , 227   ° C p r o c e s s   a i r × m C p r o c e s s   a i r + H S i O 2 , 25   ° C f l u x   ×   m S i O 2 f l u x ] ( M J / t o n   o f   f e e d   ) R e a g e n t s +   H e a t   l o s s   f r o m   f u r n a c e   ( M J / t o n   o f   f e e d ) = [ j = 1 4 H j , 1300   ° C m a t t e × m j m a t t e + i = 1 8 H i , 1300   ° C s l a g × m i s l a g + h = 1 7 H h , 1300   ° C o f f g a s × m h o f f g a s ] ( M J / t o n   o f   f e e d   ) P r o d u c t s
where H K , 25   ° C c o n c e n t r a t e (MJ/kg) is the enthalpy at 25 °C (H°/MW) of mineral K in the concentrate, m k c o n c e n t r a t e is the mass of the mineral K in the concentrate (kg/ton of feed), H C , 227   ° C p r o c e s s   a i r (MJ/kg) is the enthalpy at 227 °C (H°/MW) of component C of the process air, m C p r o c e s s   a i r is the mass of the component C of the process air (kg/ton of feed), H S i O 2 ,   25   ° C f l u x (MJ/kg) is the enthalpy at 25 °C (H°/MW) of SiO2 in flux, m S i O 2 f l u x is the mass of SiO2 in flux (kg/ton of feed), H j , 1300   ° C m a t t e (MJ/kg) is the enthalpy at 1300 °C (H°/MW) of component j in matte, m j m a t t e is the mass of the component j in matte (kg/ton of feed), H i , 1300   ° C s l a g (MJ/kg) is the enthalpy at 1300 °C (H°/MW) of component i in slag, m i s l a g is the mass of the component i in slag (kg/ton of feed), H h , 1300   ° C o f f g a s (MJ/kg) is the enthalpy at 1300 °C (H°/MW) of component h in off gas, and m h o f f g a s is the mass of the component h in off gas (kg/ton of feed).
The input conditions and the output variables in the balance model are presented in Table 3.

3. Materials

The homogeneity of the blend is a key factor because the parameters of the smelting reactor are set to treat a blend with a defined chemical composition. Chemical and mineralogical analyses of the concentrates (Table 4 and Table 5) and recirculating materials (Table 6) were done. The blends (data from Atlantic Copper, AC, Table 7 and Table 8) were composed of eight different concentrates and recycling materials. Recycling materials are slag, reverts, and dust collected from the off gas in the waste heat boiler and electrostatic precipitators. The total number of concentrates (Table 4 and Table 5) used in this study is 12. While the copper concentrates are regularly assayed, other recirculating materials are only analyzed on a monthly basis, and, since the composition of these materials can change, it can lead to variability in the process. The same composition was applied to each blend in this work.
The sulfur components were estimated by mass balance from bulk chemistry of the concentrate and mineral chemistry (microprobe). The quantification of the mineral phases of the recycling materials was carried out by XRF (X-ray fluorescence) using the XPowder 12 [34] software. The mineralogy of the blends is shown in Table 9.
To compare the model results on trace elements (Pb and Zn) with industrial data, it has collected new data using sets of blends (Table 10), slags, and mattes (Table 11) relative to the same smelting process from monthly operational data logs (AC). Model calculations for this special data set were made using the same methodology as before. For this section of the study, blends were selected and formed from the same set of concentrates (Table 4 and Table 5). Enthalpy calculations were made using the mineralogy estimated for blends.

4. Results and Discussion

4.1. Mass and Energy Balance

The model balance was applied to blends (Table 8 and Table 9) and concentrates (Table 4 and Table 5) showing that the oxygen coefficient, oxygen enrichment, and flux requirements when processing blends are very homogeneous in terms of the oxygen coefficient and oxygen enrichment (Table 12).
Flux requirements (Table 12) fluctuate according to the silica contents of blends since the silica source to process are the flux and the silica of blends.
Slag mass is directly proportional to the flux requirement (Figure 3b) because flux is the main entrance of silica in slag. Processes with lower fluxing usually involve greater production of magnetite because of increased FeO activity [1,35], which could reduce the iron content of the slag coming out of the furnace.
Oxygen coefficient (Figure 3a, curve 4) is near parallel to sulfur in the blend (Figure 3a, curve 1) because the main function of oxygen in the smelting process is to oxide the sulfides. The oxygen coefficient for blend 3 is a little higher than for blend 2 because the iron in blend 2 is lower than in blend 3 (Figure 3a, curve 2), which implies somewhat higher consumption of oxygen (Figure 3a, curve 4). Off gas is mainly composed of sulfur dioxide plus nitrogen. Then it is composed of sulfur dioxide (Figure 3a, curve 5), which is near constant to the off gas mass curve (Figure 3a, curve 3) that is near parallel to the nitrogen curve (Figure 3a, curve 7). Fluctuations in oxygen enrichment (Figure 3a, curve 8) are oppositely related to the fluctuation of the nitrogen consumption curve (Figure 3a, curve 7) because the oxygen coefficient is near constant (Figure 3a, curve 4). The fluctuations in the nitrogen curve (Figure 3a, curve 7) are specular relative to the curve of silica in slag (Figure 3a, curve 6) because the oxygen coefficient is near constant and silica, as a conservative molecule in the smelting process, act as a coolant component. As a consequence of the two last arguments, the oxygen enrichment curve (Figure 3a, curve 8) is near parallel to the silica curve (Figure 3a, curve 6).
The copper losses concept means the copper that comes out the extractive process within the flash furnace slag pass through the submerged arc furnace, which implies the dragged mate drops the dissolved copper in slag [36]. Copper dissolved in the slag has been described as the contribution of oxidic and sulfidic dissolution [30,37].
The modeled copper dissolved in slag is around 1% (Figure 4), which is a usual value estimated for copper chemical losses in copper smelting (AC). The values of Cu2S dissolved in the slag are lower than 0.1 wt.%, but no null because slag is equilibrated with matte through a liquid solvus.

4.2. Effect of Variable Conditions in the Smelting Process

The oxygen coefficient is mainly related to the matte grade objective, whereas the Fe/SiO2 ratio of the slag is controlled through flux addition, and monitored by the silica content of the slag. Meanwhile, oxygen enrichment is related to the demand of nitrogen as a coolant to control the process temperature.
The influence of a 1% rise in some process parameters over oxygen enrichment of the air process has been studied through process balance modeling. The parameters selected for this study were the silica content of the slag (that is, related to the Fe/SiO2 ratio of the slag) and the content of recirculating dust and converter slag in the feed.
A 1% increment relative to the original value of the selected parameters produced the general effect of increment of the oxygen enrichment of the air process (Figure 5).
Oxygen enrichment has been quantitatively estimated, as observed in Figure 5a–c.
The increment of silica in slag reduces the consume of nitrogen to control the process temperature because silica is treated as a conservative molecule in the smelting process and behaves like a coolant (Figure 5a).
The increment of the recirculating dust in the process feed produces an increment (4.87–5.50 vol.%) of the oxygen enrichment (Figure 5b) as a consequence of the decomposition of sulfates of the recirculating dust.
The converter slag is mainly composed of magnetite that does not dissolve in the slag because it is saturated in magnetite. Chemistry of slag does not change when it is saturated in magnetite and other conditions (temperature and oxygen fugacity) do not change [19]. Phase diagrams of the slag system show a wide region for slags saturated in spinel (magnetite) for different oxygen fugacities and temperatures [18,38]. As a consequence, the converter slag in flash furnace behaves mainly like a coolant decreasing the content of nitrogen in the process air, which leads to an increase of the oxygen enrichment needed for the smelting process (Figure 5c).

4.3. Oxygen Coefficient for Smelting Blends and Concentrates

The smelting behavior of blends relative to concentrates could be visualized through the oxygen coefficient necessary to smelt these materials. In this study, the smelting process of blends and the concentrates that compose them under the same conditions were modeled. Model results show that the oxygen coefficient to smelt concentrates fluctuate in a range around the value of this parameter needed for smelting the blends (Figure 6), which suggests that the blend smelting is more stable than the concentrate smelting.

4.4. Industrial Data Results vs. Modeling Results

Mass balance and energy balance are classical methodologies used to model the copper smelting reaction that does not take into account the smelting reaction kinetic and the fluid dynamic of the smelting process within the furnace. These factors are important because smelting operates in a limited range of time and the flow regimen conditions of the dragged quantity of slag and matte come out of the flash furnace. Furthermore, the rheological parameters of the slag and matte liquids conditions the efficiency of the matte-slag gravity separation within the settler of the furnace. The value of the mass and energy balance methodology is to provide a set of parameters against which to compare the industrial results in order to evaluate the smelting process and to identify factors that need to be improved.
Industrial data on copper smelting was used to model the process by using the same set of parameters as registered in data logs (Table 13). Model results are shown in Table 14.
Some differences emerge from the comparison between both data-results (Table 14), which points to some factors that must be taken into account in order to optimize the process. The modeled oxygen coefficient was, in general, lower than the industrial values (relative errors were in the range of 13.01% to 18.06%). This suggests a certain inefficiency of oxygen in the real process, which was foreseeable.
The flux estimated by the model (Table 14) was, in all cases, under industrial values (relative errors ranged from 26.59% to 45.96%), which suggests that not all the flux employed in the industrial process was used in the process. This means there was an excess of quartz in the flame reaction that come out of the reaction shaft and was partially dragged by the off gas coming out of the furnace. Another factor is that the flux stream contains not only quartz because the flux has mineral components, such as other silicates. The kinetic availability of silica from quartz or alkali feldspars, plagioclases, pyroxenes, amphiboles, micas, etc… is different in each case, which induces a silica loss for the stoichiometric smelting reaction in the industrial operation. The study of samples of entrained material in off gas-flow shows the existence of quartz and feldspar grains dissolving in the slag drops dragged by the off gas.
The oxygen enrichment used in the industrial environment was higher than that obtained by the model for blends 1, 2, and 4 (Table 14). The estimated error for this parameter ranged from 0.06% to 10.60%. Oxygen enrichment is related to heat losses of the furnace and the presence of coolants as nitrogen, quartz-flux, converter slag, and recirculating dust. In the studied cases, the differences between industrial and modeled oxygen enrichment could be related to the deviations in the oxygen coefficient and flux previously commented.
The model balance was applied to minor elements like lead and zinc and obtained the results shown in Figure 7. For this study, a set of 12 blends and their related slags and mattes were used over a monthly base. Distribution coefficients of lead and zinc were calculated in which FactSage™ was commented before. Thermodynamic data for lead and zinc are part of the database working with FactSage™ [20].
The modeled contents of zinc in matte are similar to the real values (Figure 7a). However, the estimated contents of zinc in the slag are higher than the real values in an industrial operation (Figure 7b). The modeled distribution of zinc between matte and slag reflects the behavior of this element in the industrial context. Zinc is preferably distributed to the slag (comparison matte and slag).
The behavior of lead (Figure 7c,d) is the opposite to the zinc. Lead is mainly distributed to the matte.

5. Conclusions

The flash smelting process was modeled using a classical mass and energy balance approach modified by the introduction of the mineralogical composition of blends and concentrates, molecular ratios (PbO/PbS in slag, ZnO/ZnS in slag, PbS/PbO in off gas, SO2/SO3 in off gas, O2 off gas/process air, Cu2S matte/slag), and distribution coefficients of Cu matte/slag, Pb slag/matte, Pb matte/off gas, Zn slag/matte, Zn matte/off gas.
In general terms, there is good agreement between the model and industrial results.
Copper dissolved in slag was modeled and quantified as Cu2O and Cu2S. Total copper dissolved in slag was estimated to be around 1 wt.%.
The oxygen coefficient to process blends fluctuates in the range of 154 to 159 Nm3/ton of feed. This value is relatively narrow compared to the range (123–189 Nm3/ton of feed) of the same parameter to process concentrates, which quantifies the higher stability of blend smelting relative to concentrate smelting.
Model results allow us to detect and quantify (as a first approximation) the efficiency of the oxygen and flux used in the industrial process. Entrained material in off gas and mineral flux compositions need to be evaluated in order to reach more agreement on the estimated fluxing. Deviations between model predictions and industrial data likely reflect the existence of kinetic factors like the characteristic fluid dynamic conditions of the furnace and the size of flux grains.
An increment of 1% in some parameters like silica in the slag and recirculating dust or converter slag in feed produces an increment of the oxygen enrichment in the range (1.18–1.46 vol.%), (4.85–5.50 vol.%), and (3.54–3.98 vol.%), respectively.
Distribution of lead and zinc as predicted by the model reproduces the industrial results for this set of minor elements.

Author Contributions

Conceptualization, M.B., I.M.-V. and G.R., methodology, M.B., I.M.-V. and G.R., formal analysis, M.B., I.M.-V. and G.R., investigation, M.B., I.M.-V. and G.R. All authors have read and agreed to the published version of the manuscript.

Funding

The ATLANTIC COPPER S.L.U funded this research.

Acknowledgments

This work was carried out with the financial support of Atlantic Copper S.L.U., which collaborates closely with the University of Huelva. The authors wish to express their gratitude for this support.

Conflicts of Interest

The authors declare no conflict of interest.

References

  1. Schlesinger, M.E.; King, M.J.; Sole, K.C.; Davenport, W.G. Extractive Metallurgy of Copper, 5th ed.; Elsevier Science Ltd.: Oxford, UK, 2011; ISBN 978-08-096789-9. [Google Scholar]
  2. Pienimäki, K.; Björklund, P.; Mienttinen, E.; Talvensaari, H.; Vaajamo, I.; Lindroth, B.; Suikkanen, P. Flash Smelting-Technology overview 2014. In Proceedings of the 14th IFSC (International Flash Smelting Conference), Las Vegas, NV, USA, 16–21 November 2014. [Google Scholar]
  3. Balladares, E.; Kelm, U.; Helle, S.; Parra, R.; Araneda, E. Chemical-mineralogical characterization of copper smelting flue dust. Dyna 2014, 81, 11–18. [Google Scholar] [CrossRef]
  4. Kemori, N.; Kondo, Y.; Fujita, K. Flash smelting behavior of various copper concentrates in a pilot scale furnace. In Sulfide Smelting’98: Current and Future Practices; Asteljoki, J., Sohn, H., Eds.; TMS: Warrendale, PA, USA, 1998; pp. 113–123. [Google Scholar]
  5. Valle, M.; López-Ruiz, J.; Badia, J.M.; Adeva, P. Microscopia Electrónica de Barrido y Microanálisis por Rayos X; Rueda: Madrid, Spain, 1996. [Google Scholar]
  6. Goldstein, J.I.; Newbury, D.E.; Michael, J.R.; Ritchie, N.W.; Scott, J.H.J.; Joy, D.C. Scanning Electron Microscopy and X-ray Microanalysis; Springer: New York, NY, USA, 2017. [Google Scholar]
  7. Potts, P.J. A Handbook of Silicate Rock Analysis; Springer Science & Business Media: New York, NY, USA, 2012. [Google Scholar]
  8. Reed, S.J.B. Electron Microprobe Analysis and Scanning Electron Microscopy in Geology; Cambridge University Press: New York, NY, USA, 2005. [Google Scholar]
  9. Scott, V.D.; Love, G. Quantitative Electron-Probe Microanalysis; Ellis Horwood Limited; John Willey & Sons: New York, NY, USA, 1983. [Google Scholar]
  10. Potts, P.J.; Bowles, J.F.; Reed, S.J.; Cave, R. (Eds.) Microprobe Techniques in the Earth Sciences; Springer Science & Business Media: London, UK, 1995; Volume 6. [Google Scholar]
  11. Tsuji, K.; Injuk, J.; Grieken, R. X-Ray Spectrometry Recent Technological Advances; John Wiley & Sons Ltd.: Chichester, UK, 2004. [Google Scholar]
  12. Beckhoff, B.; Kanngießer, B.; Langhoff, N.; Wedell, R.; Wolff, H. Handbook of Practical X-ray Fluorescence Analysis; Springer Science & Business Media: Heidelberg, Germany, 2007; ISBN 978-3-540-36722-2. [Google Scholar]
  13. Davenport, W.G.; Jones, D.M.; King, M.J.; Partelpoeg, E.H. Flash Smelting: Analysis, Control and Optimization, 2nd ed.; Wiley-TMS: Warrendale, PA, USA, 2004; ISBN 978-0873395779. [Google Scholar]
  14. Shishin, D.; Hidayat, T.; Sultana, U.; Shevchenko, M.; Jak, E. Experimental measurement and thermodynamic model predictions of the distributions of Cu, As, Sb and Sn between liquid lead and PbO–FeO–Fe2O3–SiO2 slag. Int. J. Mater. Res. 2020. [Google Scholar] [CrossRef]
  15. Shishin, D. Development of a Thermodynamic Database for Copper Smelting and Converting. Ph.D. Thesis, École Polytechnique de Montréal, Montréal, QC, Canada, 2013. [Google Scholar]
  16. Shishin, D.; Evgueni, J. Critical assessment and thermodynamic modeling of the Cu-As system. Calphad 2018, 60, 134–143. [Google Scholar] [CrossRef]
  17. Jak, E.; Hidayat, T.; Shishin, D.; Mackey, P.J.; Hayes, P.C. Modelling of liquid phases and metal distributions in copper converters: Transferring process fundamentals to plant practice. Miner. Process Extr. Metall. 2019, 128, 74–107. [Google Scholar] [CrossRef]
  18. Hidayat, T.; Henao, H.M.; Hayes, P.C.; Jak, E. Phase equilibria studies of the Cu-Fe-O-Si System in equilibrium with air and with metallic copper. Metall. Trans. B 2012, 43, 1034–1045. [Google Scholar] [CrossRef]
  19. Nikolic, S.; Hayes, P.C.; Evgueni, J. Liquidus temperatures in the “Cu2O”-FeO-Fe2O3-CaO-SiO2 system at metallic copper saturation, at fixed oxygen partial pressures, and in equilibrium with spinel or dicalcium ferrite at 1200 C and 1250 C. Metall. Mater. Trans. B 2009, 40, 910. [Google Scholar] [CrossRef]
  20. Shishin, D.; Hidayat, T.; Jak, E.; Decterov, S.; Belov, G.V. Thermodynamic database for pyrometallurgical copper extraction. In Proceedings of the Copper 2016, Kobe, Japan, November 2016; p. 12. [Google Scholar]
  21. Shishin, D.; Jak, E.; Decterov, S.A. Thermodynamic assessment and database for the Cu–Fe–O–S system. Calphad 2015, 50, 144–160. [Google Scholar] [CrossRef]
  22. Shishin, D.; Jak, E.; Decterov, S.A. Thermodynamic assessment of slag–matte–metal equilibria in the Cu-Fe-OS-Si system. J. Phase Equilibria Diffus. 2018, 39, 456–475. [Google Scholar] [CrossRef]
  23. Shishin, D.; Hayes, P.C.; Jak, E. Multicomponent thermodynamic databases for complex non-ferrous pyrometallurgical processes. In Extraction; Springer: Cham, Switzerland, 2018; pp. 853–868. [Google Scholar]
  24. Shishin, D.; Hayes, P.C.; Jak, E. Development and applications of thermodynamic database in copper smelting. In Proceedings of the Copper’19 Conference, Vancouver, BC, Canada,, 18–21 January 2019. [Google Scholar]
  25. Henao, H.M.; Pizarro, C.; Font, J.; Moyano, A.; Hayes, P.C.; Jak, E. Phase Equilibria of “Cu2O”-“FeO”-CaO-MgO-Al2O3 Slags at PO2 of 10–8.5 atm in Equilibrium with Metallic Copper for a Copper Slag Cleaning Production. Metall. Mater. Trans. B 2010, 41, 1186–1193. [Google Scholar] [CrossRef]
  26. Henao, H.M.; Nexhip, C.; George-Kennedy, D.P.; Hayes, P.C.; Jak, E. Investigation of Liquidus Temperatures and Phase Equilibria of Copper Smelting Slags in the FeO-Fe2O3-SiO2-CaO-MgO-Al2O3 System at PO2 10−8 atm. Metall. Mater. Trans. B 2010, 41, 767–779. [Google Scholar] [CrossRef]
  27. Nikolic, S.; Hayes, P.C.; Jak, E. Phase equilibria in ferrous calcium silicate slags: Part III. Copper-saturated slag at 1250 C and 1300 C at an oxygen partial pressure of 10−6 atm. Metall. Mater. Trans. B 2008, 39, 200–209. [Google Scholar] [CrossRef]
  28. Nikolic, S.; Hayes, P.C.; Jak, E. Experimental techniques for investigating calcium ferrite slags at metallic copper saturation and application to the systems “Cu2O”-“Fe2O3” and “Cu2O”-CaO at metallic copper saturation. Metall. Mater. Trans. B 2009, 40, 892. [Google Scholar] [CrossRef]
  29. Yazawa, A.; Nakazawa, S.; Takeda, Y. Distribution behavior of various elements in copper smelting systems. Adv. Sulfide Smelt. 1983, 1, 99–117. [Google Scholar] [CrossRef]
  30. Bale, C.; Chartrand, P.; Degterov, S.; Eriksson, G.; Hack, K.; Mahfoud, R.B.; Melançon, J.; Pelton, A.; Petersen, S. FactSage thermochemical software and databases. Calphad 2002, 26, 189–228. [Google Scholar] [CrossRef]
  31. Bale, C.; Bélisle, E.; Chartrand, P.; Decterov, S.; Eriksson, G.; Hack, K.; Jung, I.H.; Kang, Y.B.; Melançon, J.; Pelton, A. FactSage thermochemical software and databases—Recent developments. Calphad 2009, 33, 295–311. [Google Scholar] [CrossRef]
  32. Bale, C.; Bélisle, E.; Chartrand, P.; Decterov, S.; Eriksson, G.; Gheribi, A.; Hack, K.; Jung, I.H.; Kang, Y.B.; Melançon, J. FactSage thermochemical software and databases 2010–2016. Calphad 2016, 54, 35–53. [Google Scholar] [CrossRef] [Green Version]
  33. FactSage, Montreal, Canada. Available online: www.factsage.com (accessed on 15 July 2020).
  34. Chung, F.H. Quantitative interpretation of X-ray diffraction patterns of mixtures. I. Matrix-flushing method for quantitative multicomponent analysis. J. Appl. Crystallogr. 1974, 7, 519–525. [Google Scholar] [CrossRef]
  35. Yazawa, A. Thermodynamic considerations of copper smelting. Can. Metall. Q. 1974, 13, 443–453. [Google Scholar] [CrossRef]
  36. Genevski, K.; Stefanova, V. Dispersed matte droplets in industrial slag melts from flash smelting furnace. Can. Metall. Q. 2008, 47, 51–58. [Google Scholar] [CrossRef]
  37. Furuta, M.; Tanaka, S.; Hamamoto, M.; Inada, H. Analysis of copper loss in slag in Tamano type flash smelting furnace. In Sohn International Symposium; Advanced Processing of Metals and Materials Volume 8: International Symposium on Sulfide Smelting; Warrendale: Pennsylvania, PA, USA, 2006; Volume 8, pp. 123–133. [Google Scholar]
  38. Muan, A. Phase equilibria in the system FeO-Fe2O3-SiO2. JOM 1955, 7, 965–976. [Google Scholar] [CrossRef]
Figure 1. Atlantic copper Outotec FSF dimensions.
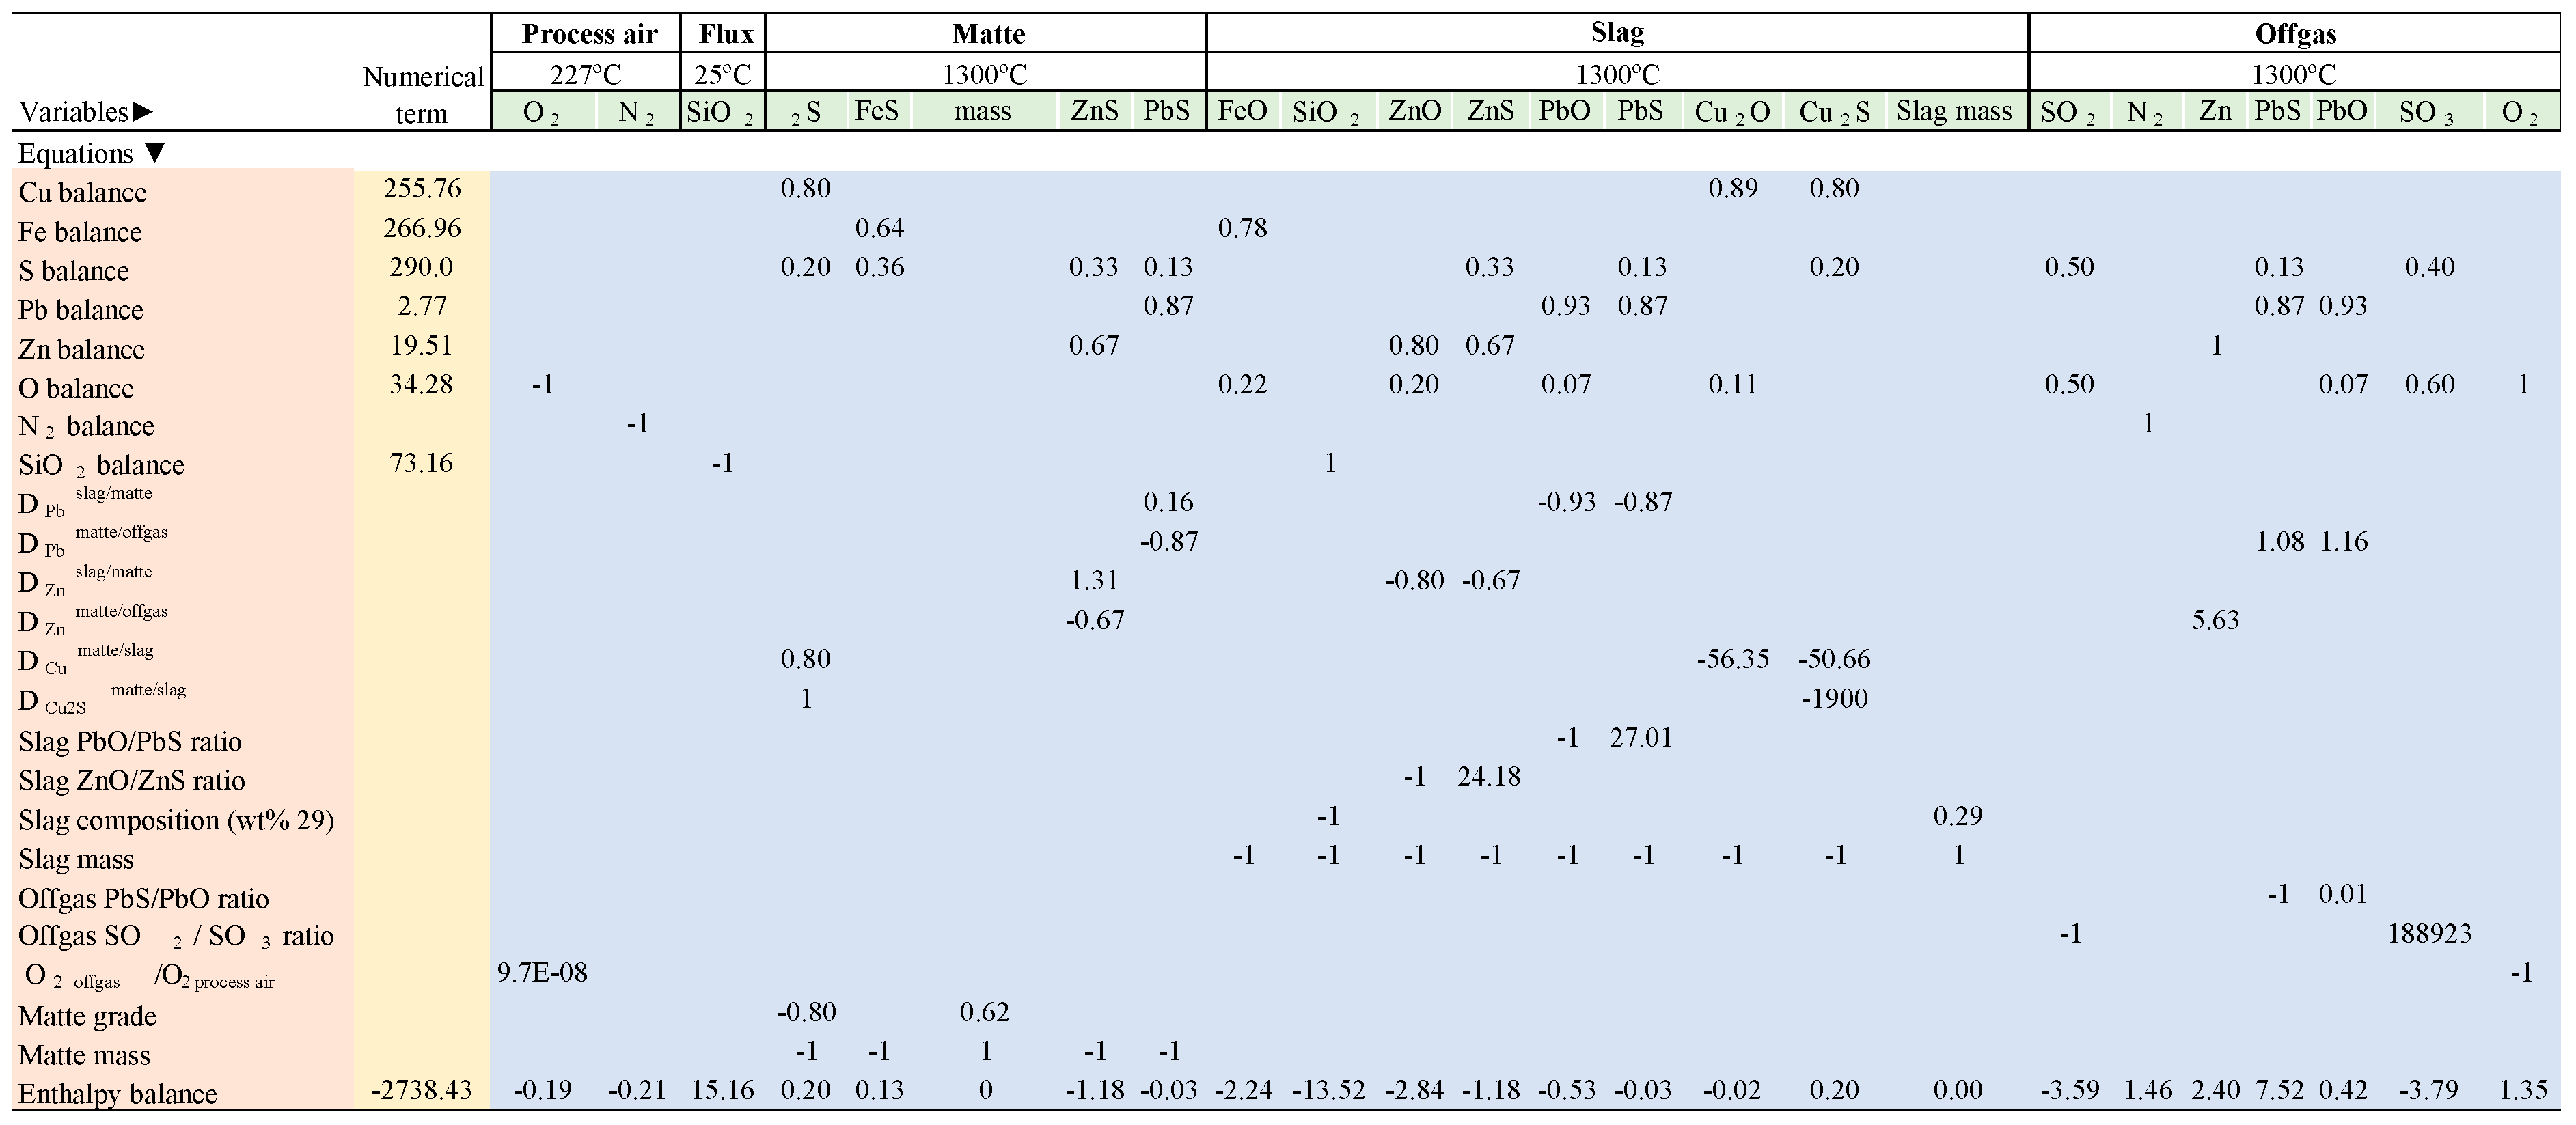
Metals 10 01229 g001
Figure 2. Calculation matrix for the mass and energy balance of the copper smelting process (example for blend 1). At the top, the unknown-variables (greenish) to solve the model balance is consigned. The list of all the balance equations (mass, distribution coefficients, molecular ratios, and enthalpy) is in the left column (brownish). The squared matrix (bluish) collects all the coefficients for each balance equation. The numerical term column (yellowish) collects all the numerical terms for each balance equation. All non-specified terms in the matrix and the numerical terms column are zero. Temperatures are referred to as the thermal conditions of each phase. The temperature of concentrates and blends is 25 °C.
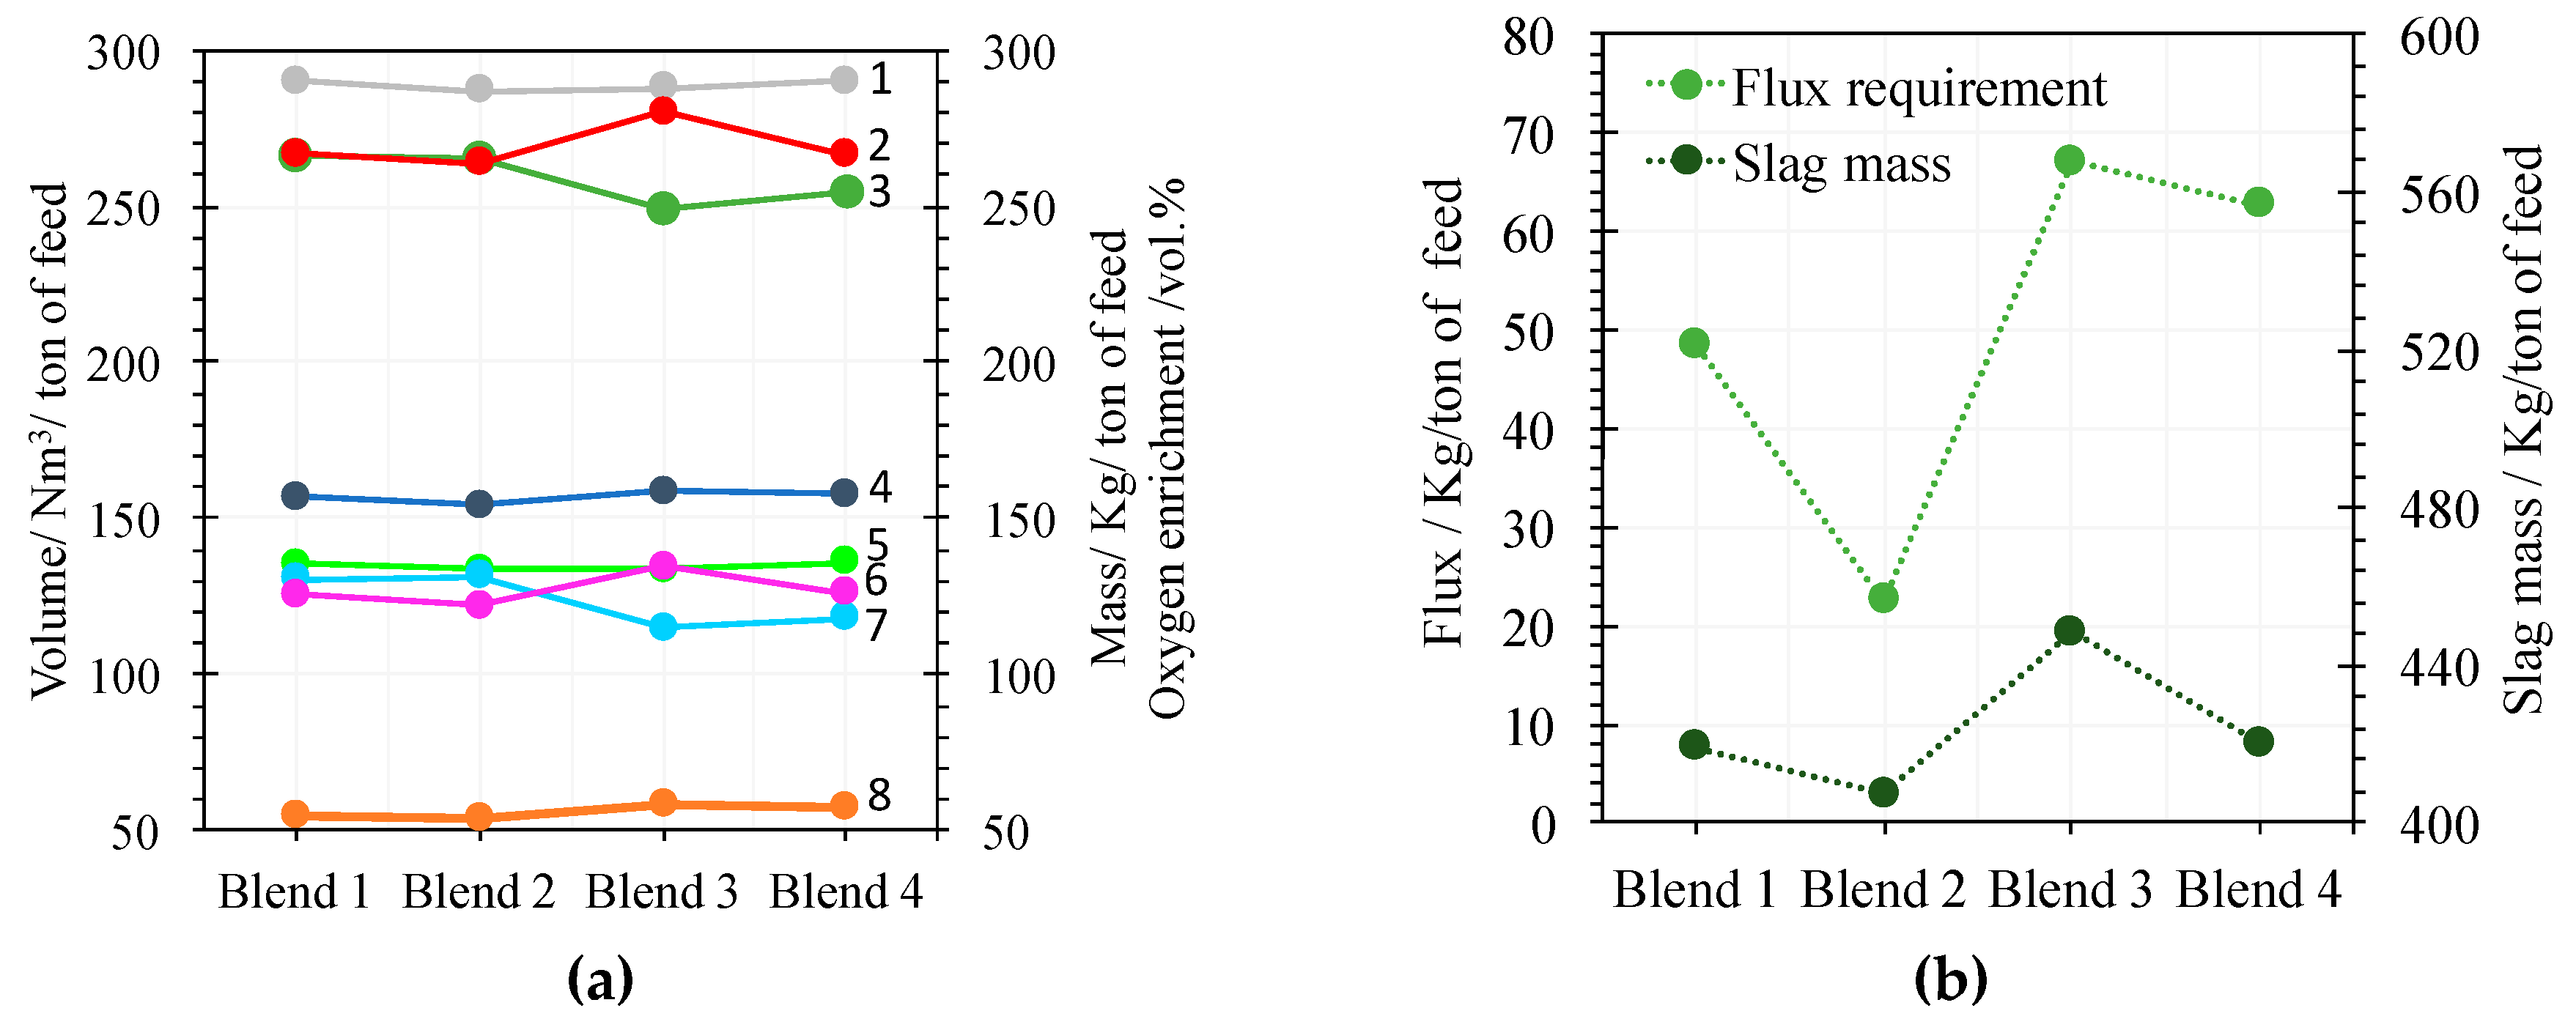
Metals 10 01229 g002
Figure 3. (a) 1: Sulfur mass (kg/ton of feed). 2: Iron mass in blend (kg/ton of feed). 3: Off gas mass (kg/ton of feed). 4: Oxygen coefficient (Nm3/ton of feed). 5: Sulfur dioxide mass (kg/ton of feed). 6: Silica mass in the slag (kg/ton of feed). 7: Nitrogen in off gas (Nm3/ton of feed). 8: Oxygen enrichment (vol.%). (b) Flux requirements (kg/ton of feed) for blends 1 to 4. (green). Slag mass (kg/ton of feed) (black).
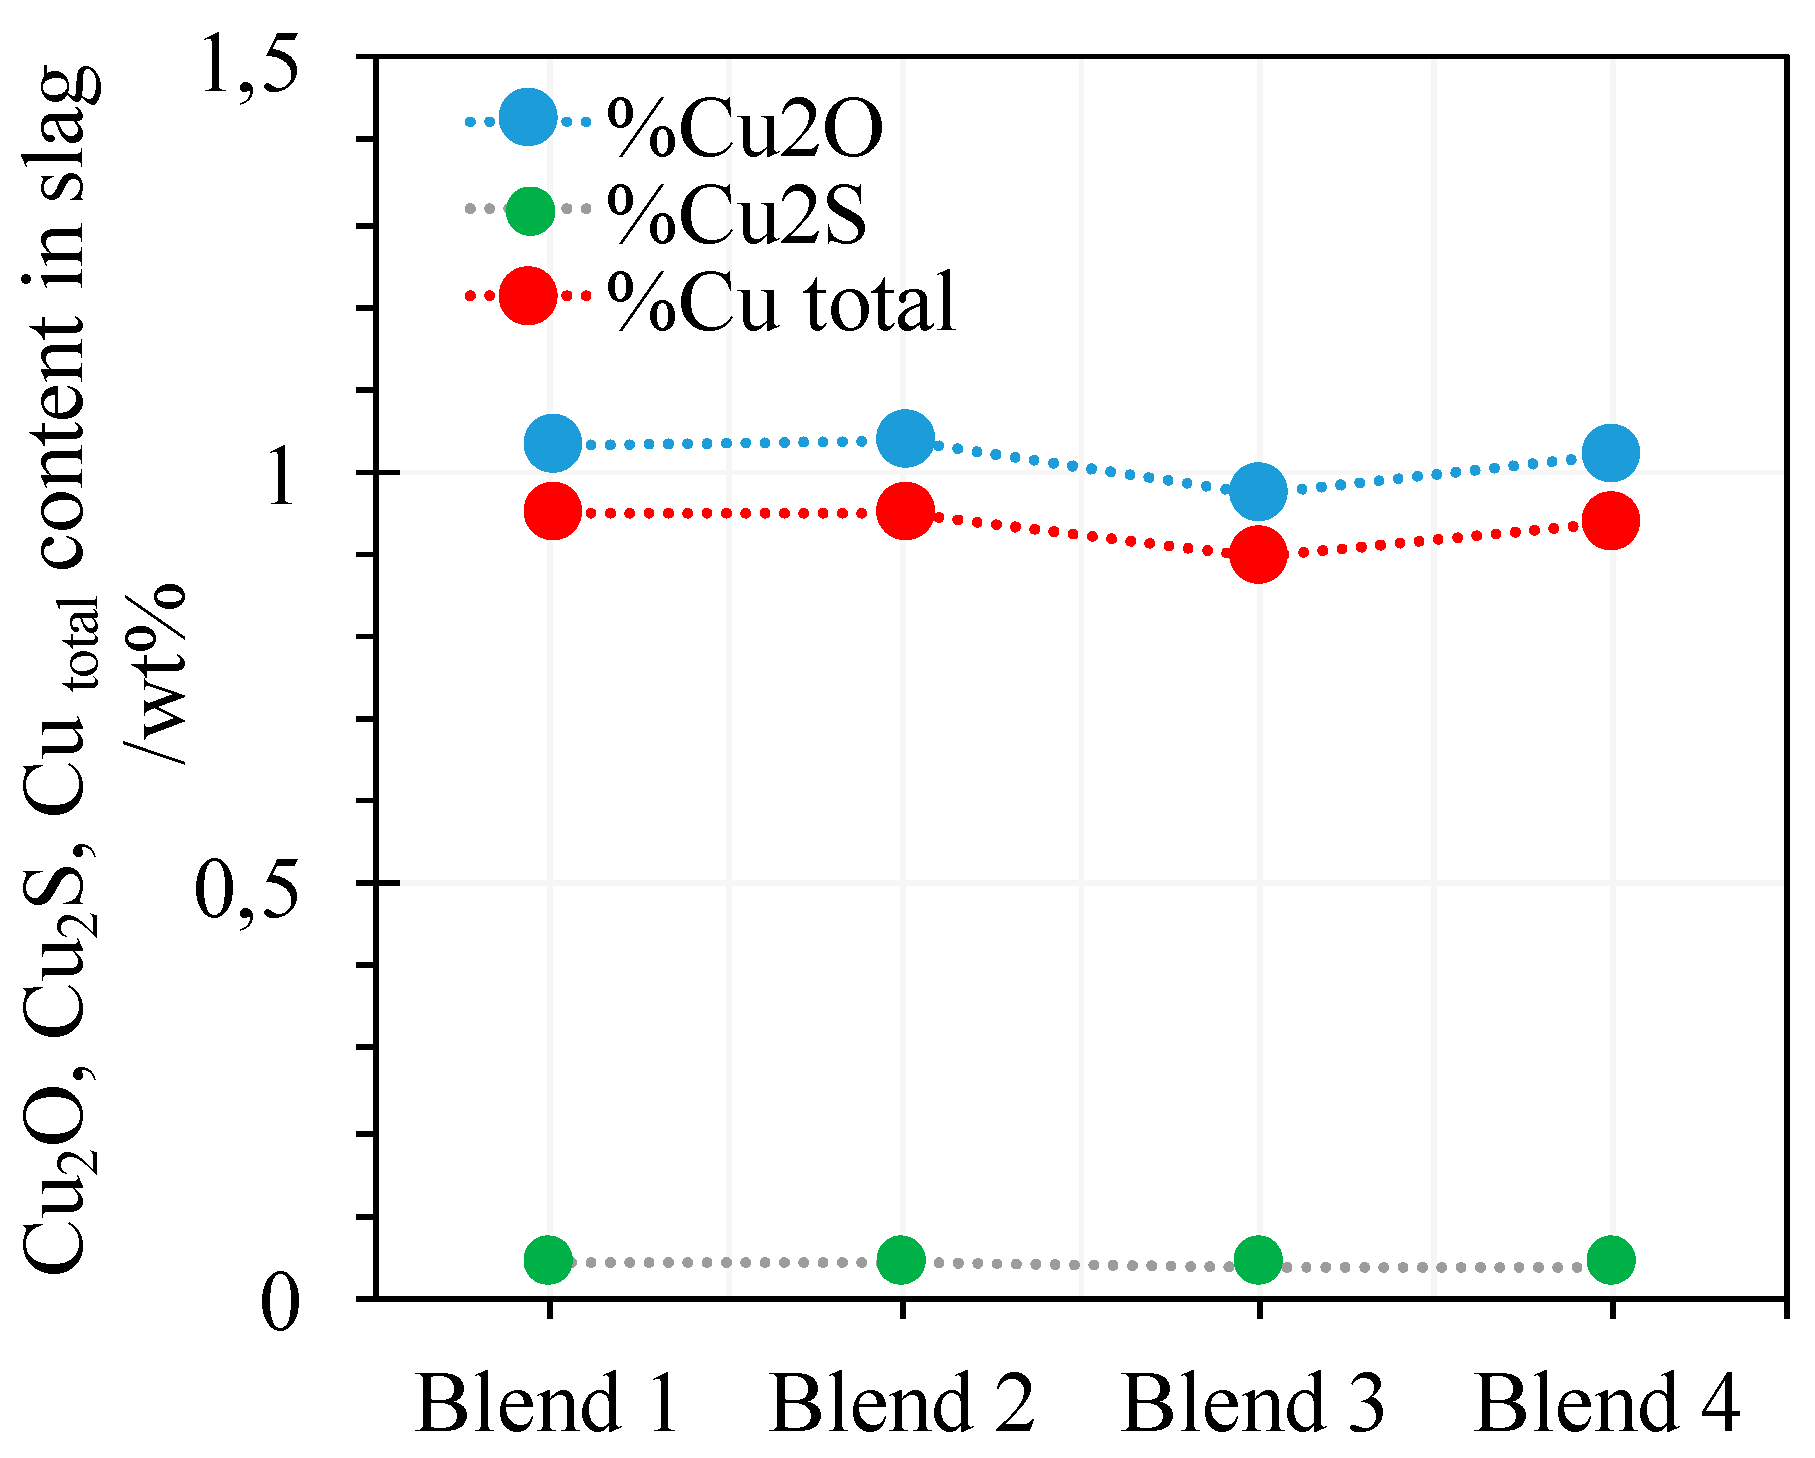
Metals 10 01229 g003
Figure 4. Process balance results: Cu2O, Cu2S, and Cu dissolved in the slags generated by smelting of each blend.
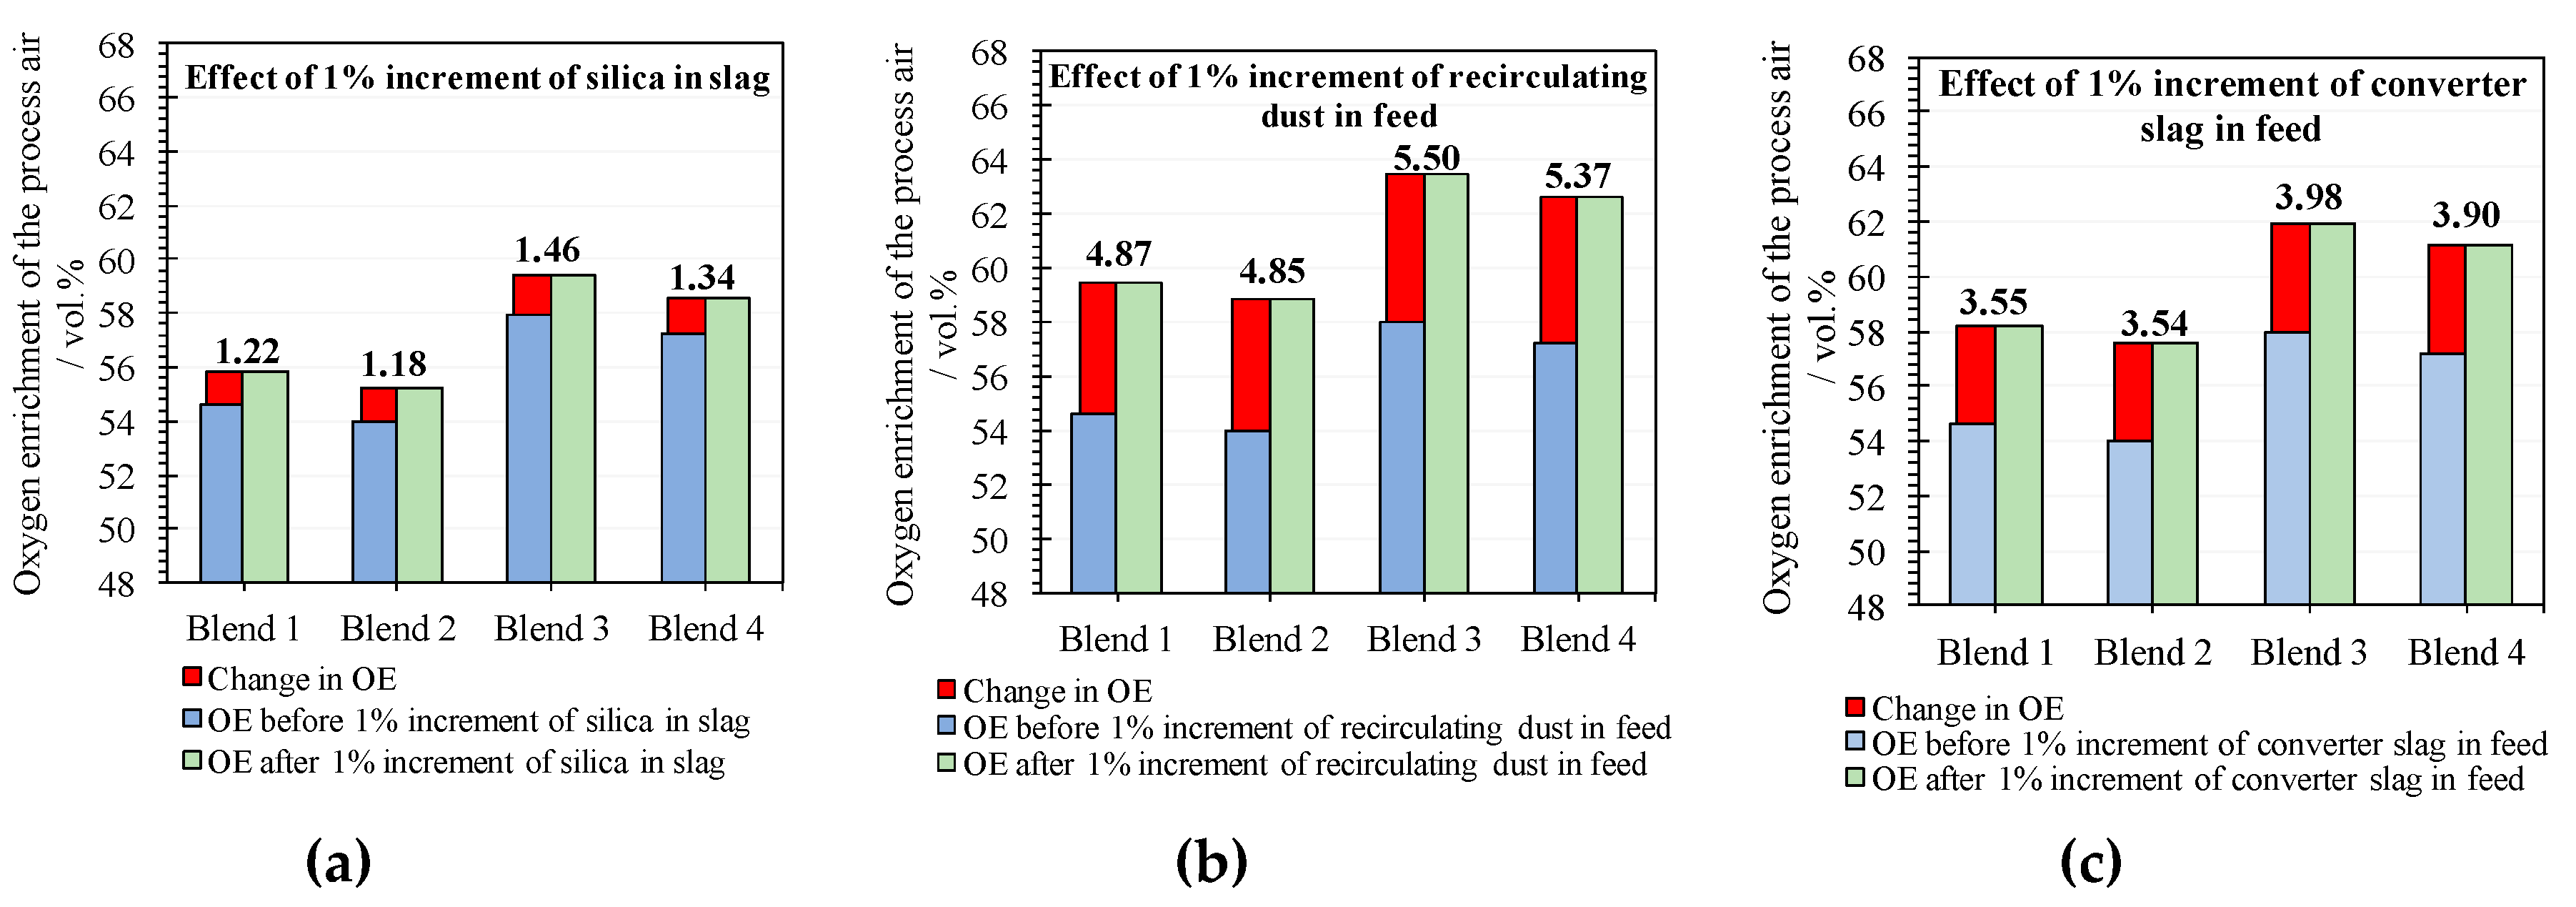
Metals 10 01229 g004
Figure 5. Oxygen enrichment (OE) estimated for increments of some parameters: (a) Increment of 1% of silica in the slag composition, (b) increment of 1% of recycled dust in feed, and (c) increment of 1% of slag converter in the feed.
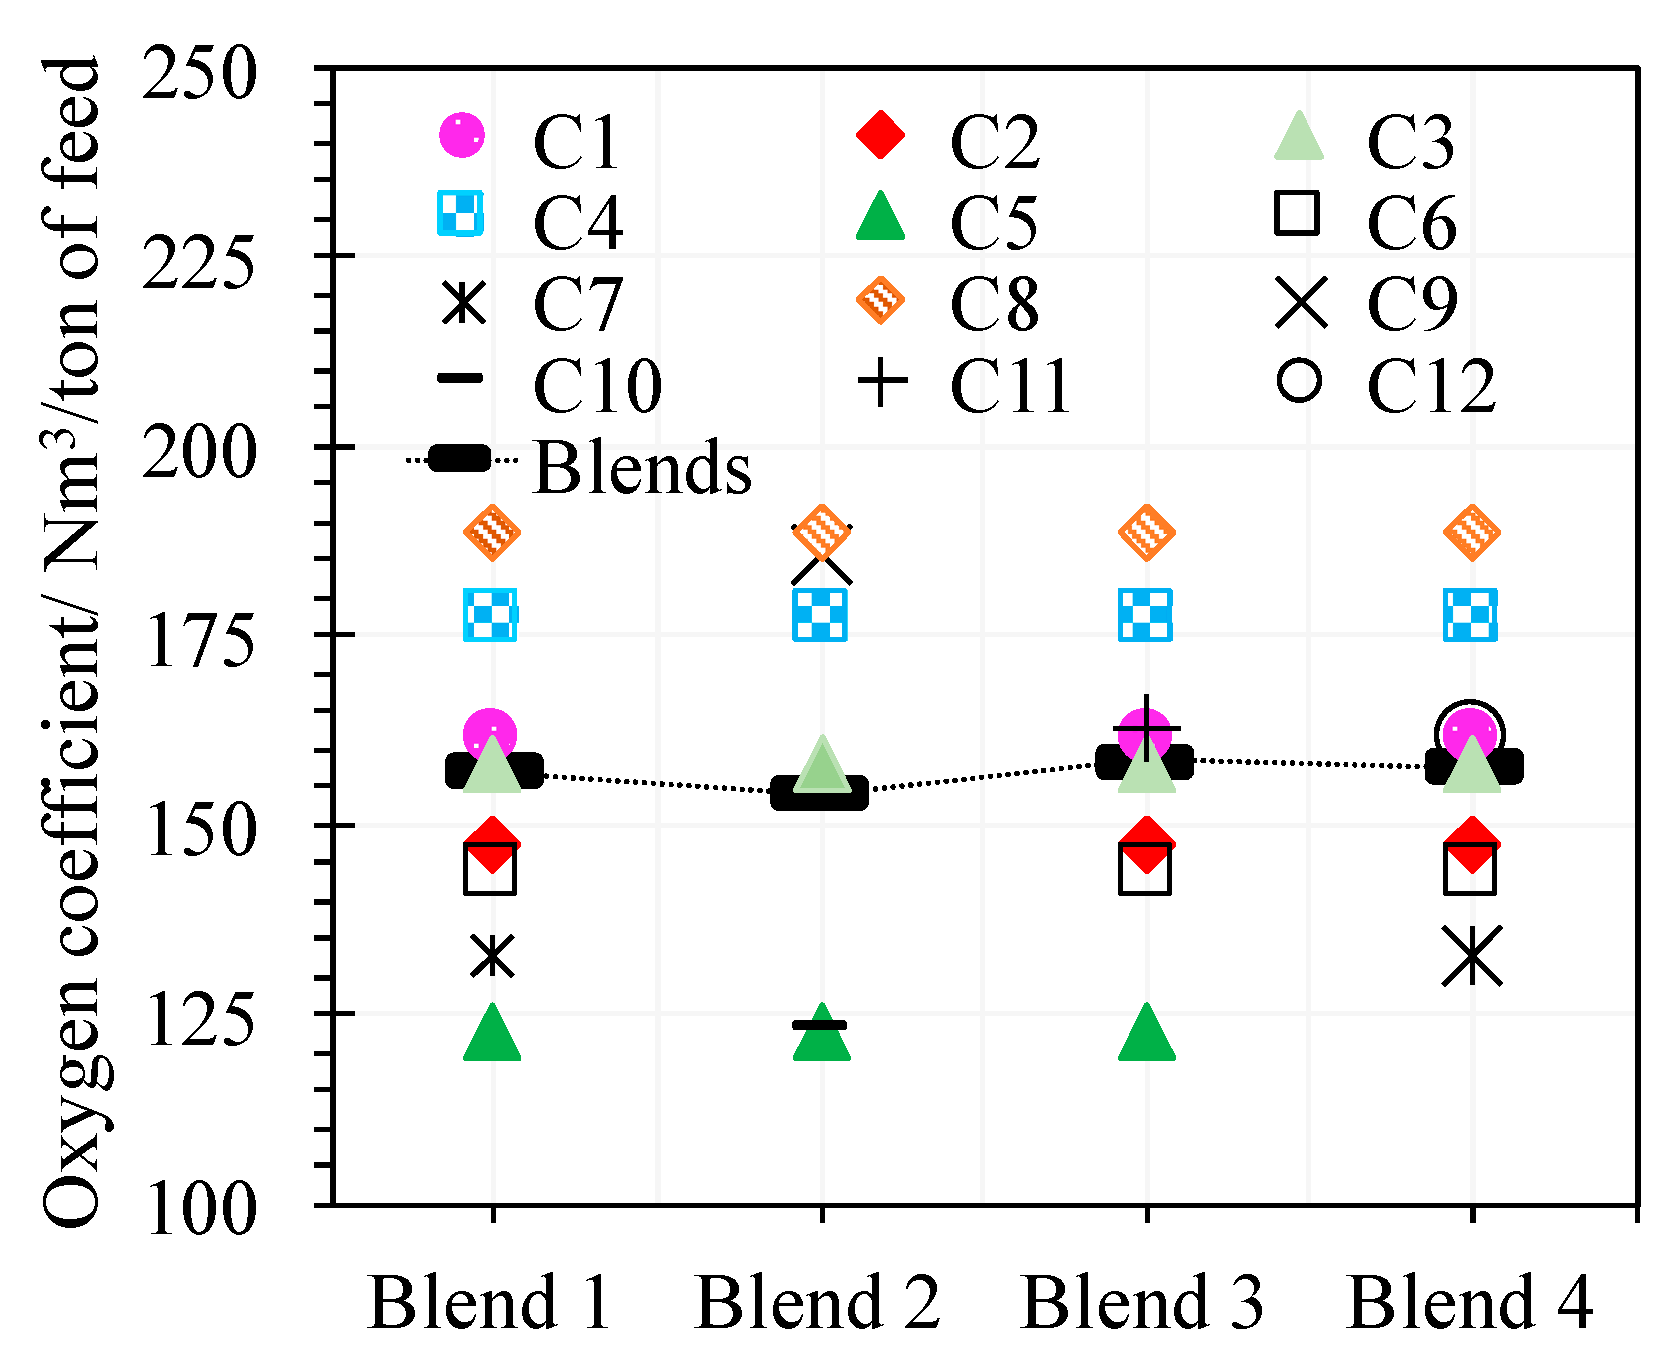
Metals 10 01229 g005
Figure 6. Modeling results of the oxygen coefficient needed for smelting blends and concentrates under the same conditions. In the same column, the parameter values for the blend (black) and the concentrates that compose it appears.
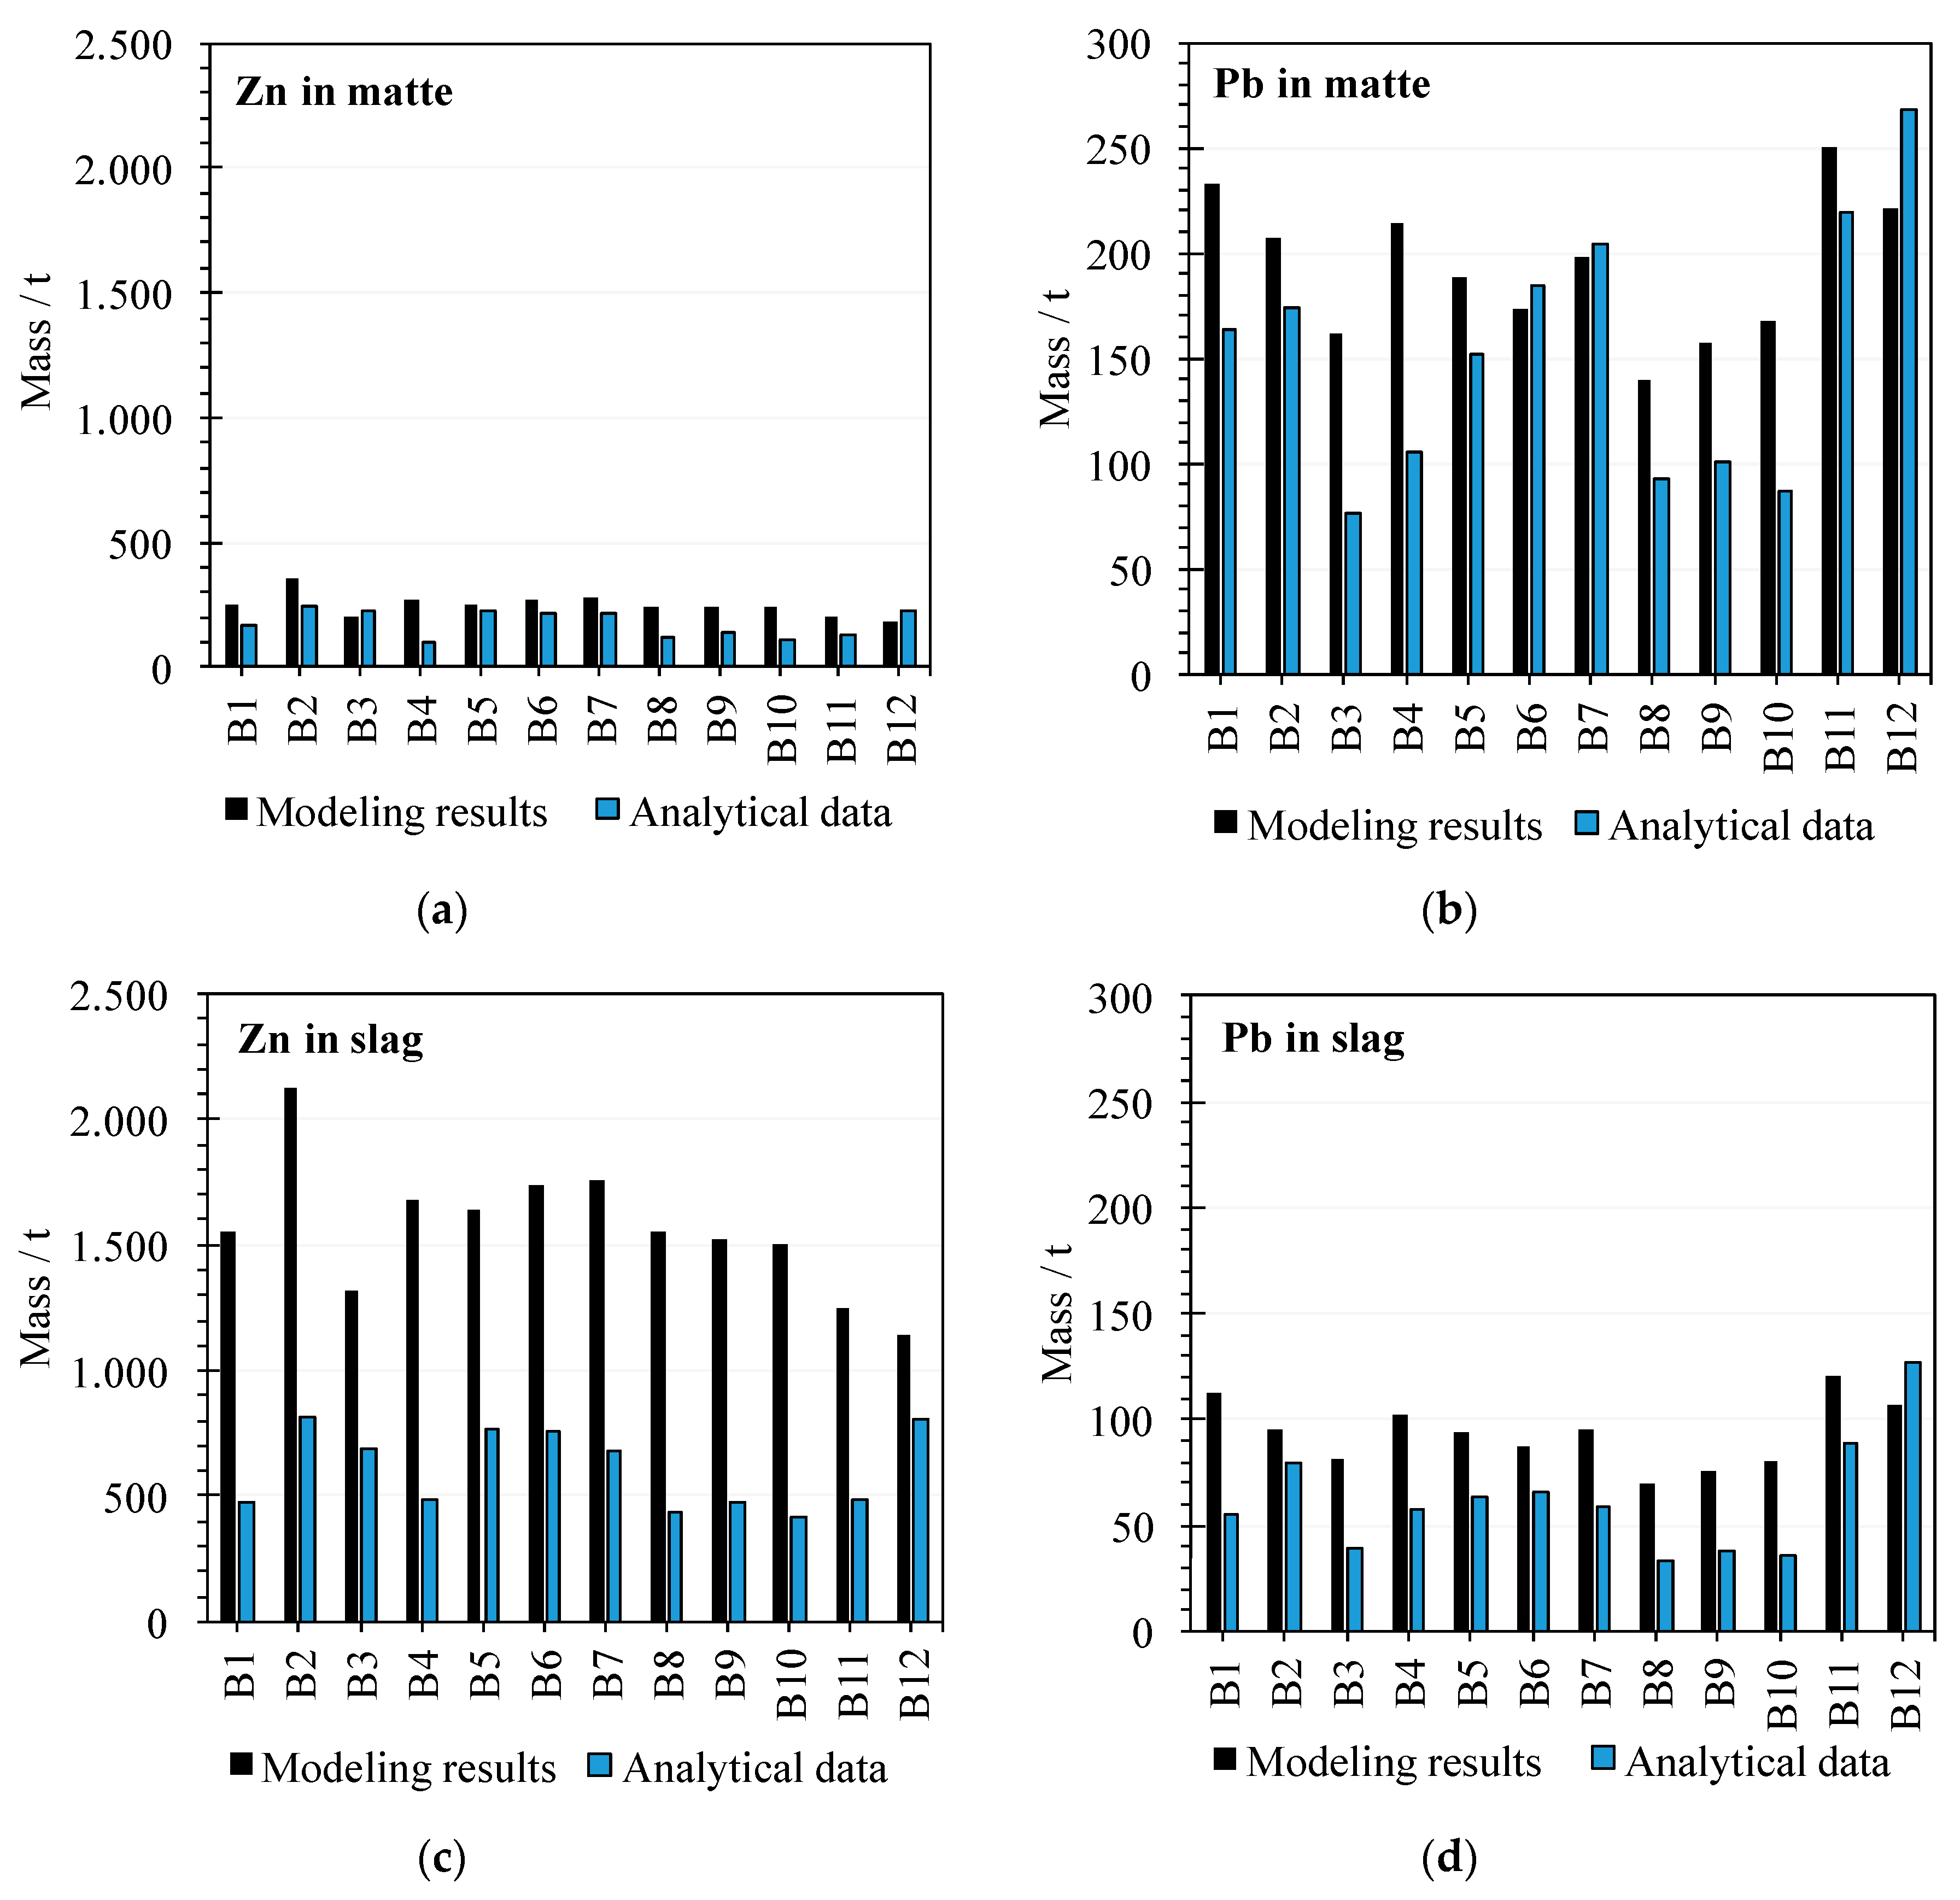
Metals 10 01229 g006
Figure 7. Minor elements (Pb, Zn) comparison. Mass of minor elements (in tons) corresponds to a monthly production. (a): Zn in matte, (b): Zn in slag, (c): Pb in matte, and (d): Pb in slag.
Metals 10 01229 g007
Table 1. Distribution coefficients calculated with FactSage™ for matte (MG 62) in equilibrium with slag (29 wt.% SiO2 in slag) at 1300 °C.
Element iPb Slag/MattePb Matte/Off GasZn Slag/MatteZn Matte/Off GasCu Matte/Slag
Di0.181.251.955.6363.45
Table 2. Molecular ratio calculated with FactSage™ for matte (MG 62) in equilibrium with slag (29 wt.% SiO2 in slag) and off gas at 1300 °C.
Molecular RatioPbO/PbS SlagZnO/ZnS SlagPbS/PbO Off GasSO2/SO3 Off GasO2 Off Gas/Process Air
-27.0124.18123.89188923.749.74 × 10−8
Table 3. Input conditions and output variables for the mass and energy balance model.
Input ConditionsOutput Variables
Concentrate and blend compositions (Tables 4 and 8)Mass O2, N2 in process air
Matte (62–64 MG,1300 °C)Mass SiO2 - flux
Slag (29–30 wt.% SiO2, 1300 °C)Mass Cu2S, FeS, ZnS and PbS in matte
Offgas (1300 °C)Matte mass
Heat Losses (33900 MJ/h)Mass FeO, SiO2, ZnO, ZnS, PbO, PbS, Cu2O and Cu2S in slag
Feed rate (160 ton/h)Slag mass
Process air (227 °C)Mass SO2, N2, Zn, PbS, PbO, SO3 and O2 in off gas
Di values (Table 1)Oxygen coefficient
Molecular ratio (Table 2)Oxygen enrichment
Enthalpy of mineral and components (FactSage™)Fe/SiO2 slag
Table 4. Mineral composition of the concentrates studied.
Minerals (wt.%)Chemical FormulaC1C2C3C4C5C6C7C8C9C10C11C12
ChacopyriteCuFeS283.8452.4848.1024.8376.331.6463.1359.8356.2825.794.174.86
PyriteFeS28.3021.8325.1841.223.9735.335.6426.5130.5717.4-16.24
TennantiteCu11FeAs4S13-1.230.46--0.83-1.6----
GalenaPbS0.06-0.1--0.02-0.690.30-0.01-
StanniteCu2FeSnS4-------4.93----
TetrahedriteCu9Fe3Sb4S13--0.16----0.28---0.1
BorniteCu5FeS4-----25.07---45.00--
ChalcociteCu2S---17.7--17.75-----
CovellineCuS--10.76-----6.931.80--
SphaleriteZnS3.341.88-0.002----0.17---
PyrrhotiteFeS----------5.58-
Table 5. Chemical composition of the concentrates studied.
Concentrate%Cu%Fe%S%Pb%Zn%SiO2
C128.5929.1734.050.042.062.62
C224.4725.0731.260.510.718.87
C326.0727.5333.220.120.345.84
C422.1726.3335.2500.19.79
C525.9526.5527.420.130.5110.4
C628.0927.3631.850.030.15.72
C731.3922.5432.770.010.185.46
C823.7530.4935.851.052.271.32
C924.0231.3235.960.070.14.39
C1035.2722.9829.740.030.199.45
C1131.7430.935.690.010.10.38
C1225.5829.0133.240.140.314.84
Table 6. Mineral composition of the recirculating materials.
Mineral (%)Chemical FormulaConverter SlagFlue DustRecirculating DustReverts
FayaliteFe2SiO419.5064.55-36.80
MagnetiteFe3O450.21-15.7915.10
CopperCu---1.00
ChalcocyaniteCuSO4--13.02-
ZinkositeZnSO4--43.68-
DelafossiteCuFeO2-8.056.517.80
DolerophaniteCu2(SO4)O--17.78-
AnglesitePbSO4--3.29-
CupriteCu2O---8.60
ChalcociteCu2S9.45---
QuartzSiO220.8527.40-30.80
Table 7. Components of each blend studied for this work (wt.%).
Concentrates + Recycled MaterialsBlend 1Blend 2Blend 3Blend 4
Concentrate 122.43038.3224.30
Concentrate 22.8002.802.80
Concentrate 39.3524.769.359.35
Concentrate 414.0214.027.487.48
Concentrate 59.819.359.810
Concentrate 69.3509.359.35
Concentrate 714.02009.35
Concentrate 82.802.802.802.80
Concentrate 9014.9500
Concentrate 10018.5900
Concentrate 11004.670
Concentrate 1200019.16
Converter slag4.674.674.674.67
Flue dust1.401.401.401.40
Recirculating dust6.546.546.546.54
Reverts2.802.802.802.80
Total100100100100
Table 8. Chemical composition of the blends studied.
Blend%Cu%Fe%S%Pb%Zn%SiO2
Blend 125.5826.7029.000.271.957.32
Blend 225.3626.3928.670.281.539.56
Blend 325.6328.0328.770.292.286.30
Blend 425.3526.6328.980.292.045.91
Table 9. Mineral composition of the blends studied.
Minerals (wt.%)Chemical FormulaBlend 1Blend 2Blend 3Blend 4
ChacopyriteCuFeS249.2237.4256.4753.07
PyriteFeS215.8320.9513.6615.75
TennantiteCu11FeAs4S130.200.160.200.20
GalenaPbS0.040.090.050.05
StanniteCu2FeSnS40.140.140.140.14
TetrahedriteCu9Fe3Sb4S130.020.050.020.04
BorniteCu5FeS42.348.412.342.34
ChalcociteCu2S5.412.921.773.42
CovellineCuS1.214.041.211.21
SphaleriteZnS0.800.031.330.86
PyrrhotiteFeS0.000.000.260.00
FayaliteFe2SiO42.852.852.852.85
MagnetiteFe3O43.803.803.803.80
CopperCu0.030.030.030.03
ChalcocyaniteCuSO40.850.850.850.85
ZinkositeZnSO42.862.862.862.86
DelafossiteCuFeO20.760.760.760.76
DolerophaniteCu2(SO4)O1.161.161.161.16
AnglesitePbSO40.220.220.220.22
CupriteCu2O0.240.240.240.24
QuartzSiO27.329.566.305.91
Table 10. Chemical composition of the blends studied.
Blend% Cu% Fe% S% Zn% Pb% SiO2
B126.4926.8631.262.130.475.28
B225.7826.6131.252.840.405.40
B327.1325.4830.212.000.366.98
B425.8526.6431.282.020.385.20
B526.6725.7628.952.050.356.80
B626.0726.3431.252.280.346.77
B725.7626.4329.582.060.347.63
B826.5126.6330.201.980.267.20
B926.2226.3630.762.020.306.58
B1025.9225.8730.321.830.306.94
B1126.1926.7930.711.520.456.65
B1226.6026.8230.751.410.406.68
Table 11. Zinc and lead content in matte and slag.
BlendIndustrial Data/wt.%Industrial Data/wt.%
MatteSlag
ZnPbZnPb
B10.450.440.950.11
B20.670.471.660.16
B30.690.231.750.10
B40.240.260.930.11
B50.550.371.460.12
B60.570.481.610.14
B70.500.481.270.11
B80.310.240.920.07
B90.360.270.990.08
B100.280.220.820.07
B110.340.560.920.17
B120.570.681.330.21
Table 12. Process variables: Oxygen coefficient and flux requirement of each blend.
Process Variables ResultsBlend 1Blend 2Blend 3Blend 4
Oxygen coefficient/Nm3/ton feed157154159158
Oxygen enrichment/vol.%57545857
Flux requirement/kg/ton feed48226763
Table 13. Operational data sets and results related to smelted blends.
BlendsBlend 1Blend 2Blend 3Blend 4
Input Variables
Feed rate/ton/hour165160165155
Oxygen coefficient/Nm3/ton of feed186188193186
Oxygen enrichment/vol.%50.151.053.453.8
Process air temperature/°C227227227227
Flux/%8.265.2410.610.0
Output Variables----
Matte grade/%63.7 ± 1.262.7 ± 1.466.6 ± 1.062.6 ± 0.8
SiO2 in slag/%29.0 ± 0.828.5 ± 1.027.5 ± 1.230.0 ± 1.6
Parameters----
Heat loss from furnace/ MJ / ton of feed−205.5−211.9−205.5−218.7
Table 14. Process balance results. Output variables and relative error (RE) estimation. OC (oxygen coefficient). O2E (oxygen enrichment). MG (matte grade). Relative errors were calculated following the expression “100 × (model values − industrial values)/industrial values.”
BlendsBlend 1Blend 2Blend 3Blend 4
Output Variables (Balance)
Oxygen coefficient/Nm3/ton of feed161.8154.0163.3157.6
Oxygen enrichment/vol.%50.155.152.959.5
Flux/%5.92.87.86.9
Matte grade/%63.961.963.961.9
SiO2 in slag/%30.030.030.030.0
Relative Error
RE(OC)/%−13.01−18.06−15.37−15.26
RE (O2E)/%0.068.10−0.8710.60
RE(Flux)/%−28.93−45.96−26.59−31.26

