Article

A Coolant Circulation Cooling System Combining Aluminum Plates and Copper Rods for Li-Ion Battery Pack

College of Mechanical Engineering, Xi’an University of Science and Technology, Xi’an 710054, China
*
Author to whom correspondence should be addressed.
Energies 2020, 13(17), 4296; https://doi.org/10.3390/en13174296
Submission received: 24 June 2020 / Revised: 15 August 2020 / Accepted: 17 August 2020 / Published: 19 August 2020
(This article belongs to the Section J: Thermal Management)

Abstract

:
The spontaneous combustion of electric vehicles occurs frequently, and the main reason is the thermal runaway of a lithium-ion battery. In order to prevent the heat that is produced in the use of a lithium-ion battery out of control, this study proposed a coolant circulation cooling system, that is, the heat generated by the lithium-ion battery is transferred to heat sinks through aluminum plates and copper rods, and then dissipated through the coolant. Based on a CALB-LB5F73 LiFePO4 battery pack, experiments with the coolant circulation cooling system were conducted to study the temperature rise characteristics at different ambient temperatures. The temperature of the battery pack was still close to the upper limit of permitted temperature when the ambient temperature reached 313 K. Further improvement, increasing the diameter of copper rod of the system was proposed to enhance heat dissipation and simulations with this scheme were completed. The findings show that the cooling system can clearly reduce the temperature of a lithium-ion battery pack and control the temperature within the safe temperature range.

1. Introduction

Electric vehicles are gradually replacing fuel-powered vehicles in the market with the advantages of zero emissions [1]. As one of the three major parts of electric vehicles, the power battery is the driving core and plays a vital role in the development and safety of electric vehicles. With the advantage of high energy density, low self-discharge rate and no memory effect [2,3], the lithium-ion battery is becoming the best choice for power batteries. However, in a high-temperature environment, the internal resistance of lithium-ion battery continues to generate heat in process of working. The heat of accumulation can cause dangerous situations such as fire or even explosions, which is called thermal runaway [2,4,5]. In order to avoid the occurrence of thermal runaway and improve the service life of a lithium-ion battery and the safety of electric vehicles, the battery thermal management system (BTMS) plays a vital role in the process of using a lithium-ion battery.
A BTMS is mainly divided into air cooling system (ACS) [6,7,8], liquid cooling system (LCS) [9,10,11,12,13], phase change material cooling system [1,3] and special material conductor cooling system (such as the cooling system mainly consisting of the heat pipe [14] or thermoelectric cooler [15]). At present, due to the high cost of phase change materials and special material conductors, they have not been used in electric vehicles. However, the Nissan Leaf, Toyota Prius and some electric vehicles of BYD, which is a Chinese vehicle company, all use ACS to dissipate heat for lithium-ion battery packs; BMW i8, Tesla modelS and Chevrolet volts all use LCS to dissipate heat for lithium-ion battery packs.
The ACS mainly uses air convection to take away the heat of the battery pack. Air-cooling methods are divided into natural convection cooling and forced convection cooling. Natural convection cooling means directly using natural wind to remove heat [16]. Toyota Prius directly blows the air of the air-conditioning cabin into the battery pack for cooling the battery. This method is simple and its cost is low, but the convective heat transfer coefficient is small, and it is only suitable for battery packs of small capacity. Forced convection cooling means that heat is taken away with the help of external wind [17]. Teng et al. [6] took the large-capacity battery pack as the research object and installed a heat-dissipating aluminum sheet in the ACS. The results show that the temperature of the whole battery pack decreases and the difference of temperature decreases. Wang et al. [7,8] studied air-cooling strategies by installing fans in different locations of battery packs to obtain the best cooling performance and improve temperature uniformity. In order to further study the cooling effect of the ACS, they conducted experiments at different discharge rates and ambient temperatures. The results show that when the ambient temperature is higher than 308 K, the maximum temperature of the whole battery pack has exceeded 333K, which shows that ACS is not feasible to be used in a high-temperature environment.
The ACS cannot meet the requirement that is for a battery pack to dissipate heat, so researchers have proposed LCS, that is, using a liquid medium to assist in dissipating heat generated by the battery pack. The Roadster liquid-cooled BTMS designed by Tesla’s Daniel Adams et al. [9], chose a flat aluminum tube that has good scalability as a cooling pipe. The contact position between the battery and the cooling pipe is from line contact to the surface contact, improving the heat transfer efficiency and enhancing the heat dissipation effort of the system. Lan et al. [10]. designed an LCS by winding flat aluminum tube around a square battery, and each tube contains many small channels to allow water to pass through. The results show that the highest temperature and the difference of temperature decrease. Zhao [11] and Jarrett [12] had designed a serpentine cooling tube. The battery is in direct contact with the serpentine cooling tube, and the coolant flows through the serpentine tube to take away the heat. The feasibility of this scheme has been verified by simulation. Wang and et al. [13] proposed a method of combining forced convection cooling and liquid cooling. The upper battery pack is cooled by liquid, and the lower liquid is cooled by a fan. Numerical simulation results show that this method can reduce the highest temperature and can significantly improve the temperature uniformity. Although the current study about LCS can meet the requirements of heat dissipation of the lithium-ion battery pack, the cooling pipes are arranged between the single lithium-ion battery, and the coolant needs to flow through those batteries. If the cooling pipe is damaged, coolant leakage will occur, increasing the risk to safety in the process of the battery working [18].
This paper designed a coolant circulation cooling system (CCCS) combining aluminum plates and copper rods. The lithium-ion battery pack is placed on the water tank and is isolated from the coolant, which improve the safety of the lithium-ion battery used. The second section analyzes the heat generation rate of the lithium-ion battery. The third section discusses the experimental results of CCCS at different ambient conditions. The fourth section carries out simulation to verify and optimize the CCCS. The last section discusses the difference between simulation results and experimental results, and concludes on the utilization of CCCS.

2. Theoretical Analysis

This paper takes the CALB-L135F73 LiFePO4 battery as the research object, and its specific parameters are shown in Table 1:
In the process of a lithium-ion battery charging or discharging, a complex electrochemical reaction takes place inside it, accompanied by the generation of heat. Noboru Sato [19] proposed a general battery thermal model from the view of thermal dynamics and battery internal reaction. The heat generated by the lithium-ion battery during charging and discharging is divided into Joule heat, polarization heat, reaction heat and side reaction heat. The calculation formula is:
Q = Q J + Q P + Q r + Q s
In the formula, Q represents the total heat generated by the battery; QJ and QP respectively represent Joule heat and polarization heat, that is, the heat generated by the ohmic resistance and polarization resistance; Qr represents the reaction heat, which means the heat generated by the decomposition of the anode material and the reaction between the cathode material and the electrolyte. When the temperature of the lithium-ion battery is lower than 343 K, the value of reaction heat is very small and can be ignored [20]. Qs represents side reaction heat, which is the heat generated by the decomposition of the electrolyte and solid electrolyte interphase (SEI), and the reaction of the cathode material and the binder. Its value is very small, so the side reaction heat also can be ignored [21]. Therefore, the calculation formula of the heat generated by the lithium-ion battery can be simplified as:
Q = Q J + Q P = I 2 R
In the formula, I represents the discharging current; R represents the total resistance, including ohmic resistance and polarization resistance. The rate of heat generation of the lithium-ion battery per unit volume is:
q = Q V = I 2 R V
In the formula, q represents the rate of heat generation of lithium-ion battery per unit volume, that is, the heat generation rate. The HPPC (Hybrid Pulse Power Characteristic) experiment can test the total internal resistance of the lithium-ion battery at different temperatures as shown in Figure 1a. According to the above formula, the heat generation rate of lithium-ion battery selected in this paper is calculated as shown in Figure 1b:
As is shown in Figure 1a, with the ambient temperature increasing, the value of internal resistance decreases. When the ambient temperature increases to a certain value, the value of internal resistance hardly changes. Therefore, with the increase of ambient temperature, heat generation rate of the battery decreases, which is shown in Figure 1b. As the discharging current is increasing, the heat generation rate of the battery increases obviously and reaches the maximum value at a discharging current of 144 A. The higher the heat generation rate of the battery is, the faster the temperature rising rate will be and the higher the temperature will reach. If the battery temperature can be controlled within a safe range under the condition that discharging current is 144 A, the battery temperature must be controlled within a reasonable range when the discharging current is below 144 A. Therefore, this paper studies the temperature rise characteristic of the battery pack under the discharging current of 144 A.

3. Experiment and Result Analysis

3.1. Experimental Design

The equipment used in the experiment included a charging and discharging tester used to charge or discharge a battery pack, an Agilent data acquisition instrument and many T-type thermocouples used to acquire the temperature of the battery over time, a thermostat used to simulate the ambient temperature, a liquid cooling test instrument used to make the coolant circuitry flow, a power battery pack that is the testing object, and a computer used to monitor the process of experiment. The test methods were as follow:
(1)
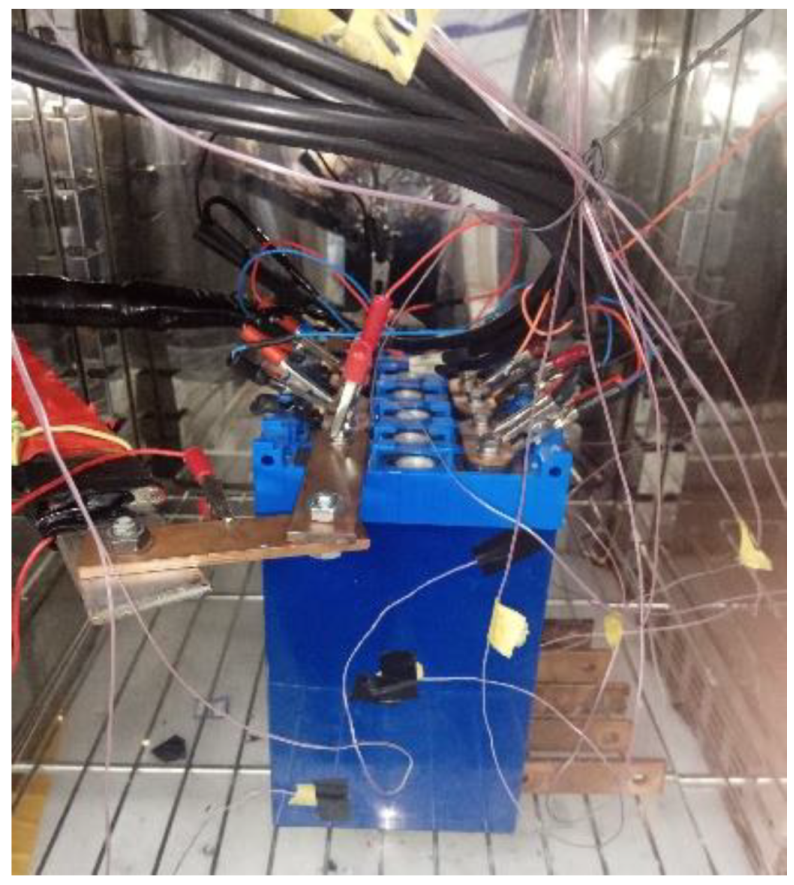
Preparation stage: all lithium-ion batteries were connected in series in groups, and the discharging experiments were carried out by the charging and discharging tester. Then, six lithium-ion batteries with stable performance and consistent power were chosen. In order to avoid excessive local temperature and reduce the average temperature time during charging and discharging, six lithium-ion batteries were connected in series with an interval of 10 mm.
(2)
Environmental simulation stage: after completing the assembly of the experimental model in the thermostat and installing thermocouples to a battery pack for measuring the temperature, the thermostat began to work and the ambient temperature required was set. We waited for another 8 h until the temperature in thermostat reached the set temperature, and then discharging experiments began to be conducted.
(3)
Charging and discharging test stage: in order to protect the power battery, all the charging experiments in this paper adopted the charging mode of constant current and constant voltage (CC-CV). The discharging experiments were carried out at the current of 144 A, the discharging capacity was 70 Ah, and the end-of-discharge voltage was 15 V.
(4)
Data processing stage: the value of temperature at the center of the single battery was selected to represent the temperature of the battery, and then the value of the temperature of each battery was added to calculate the average value, which represents the value of temperature of the whole battery pack.

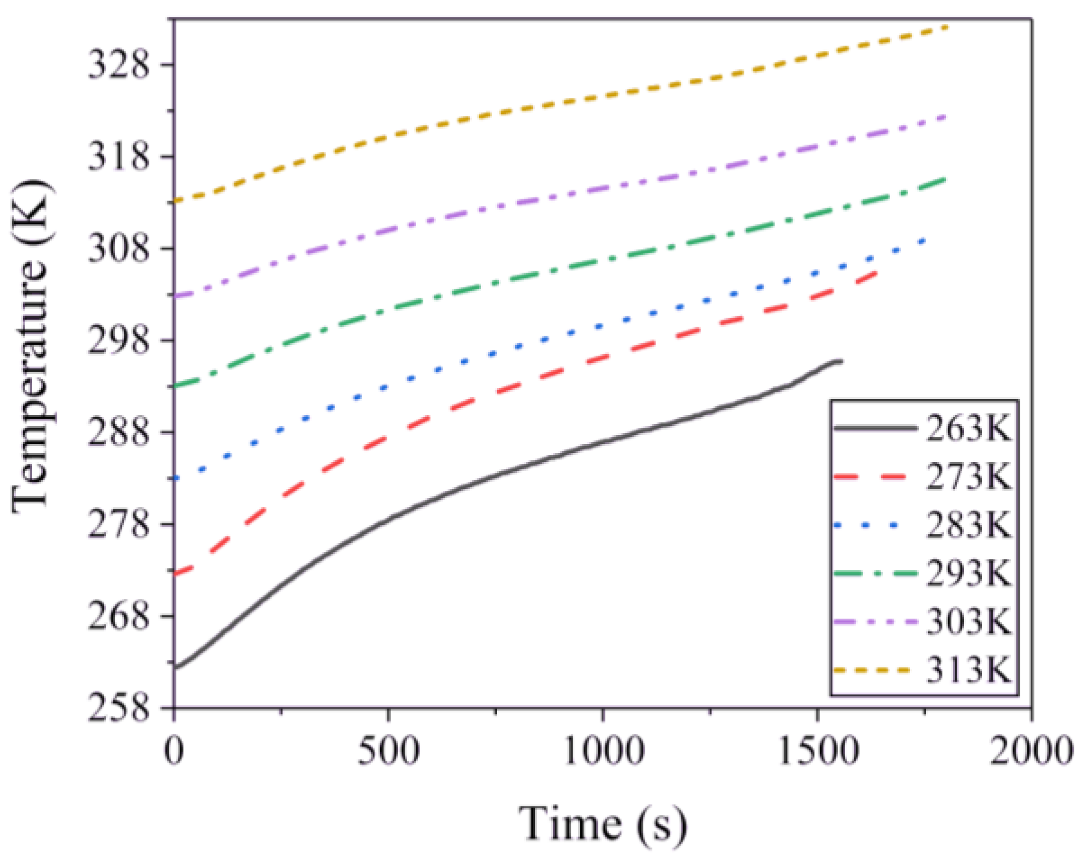
3.2. Temperature Rise of Battery Pack in Natural State

In the natural state, the battery pack does not take any heat dissipation measures, and heat is only dissipated by natural convection of air. The six lithium-ion batteries selected were discharged according to the above test method, as shown in Figure 2.
The ambient temperature varies from 263 K to 313 K in most areas, so this paper set the ambient temperature as 263 K, 273 K, 283 K, 293 K, 303 K, and 313 K. Discharging experiments were carried out to study the temperature-rise characteristics of the battery pack. The experimental results are shown in Figure 3:
It can be seen from Figure 3 that when the ambient temperature is 263 K and 273 K, the discharging capacity and discharging time of the battery pack are obviously reduced. When the ambient temperature is low, the activity of the chemical substances inside the lithium-ion battery is low, and the substances participating in the chemical reaction are few, resulting in a reduction of the discharge capacity and a shortened discharge time of the lithium-ion battery [22,23]. As the ambient temperature increases, the temperature of the battery pack also increases. When the ambient temperature is 303 K and 313 K, the temperature of the battery pack reaches 322.3 K and 332.1 K, respectively, which is very close to or even exceeds the upper limit of the safe temperature of the lithium-ion battery. Therefore, when the ambient temperature exceeds 303 K, the battery pack needs a heat dissipation system to ensure its safety.

3.3. Temperature Rise of Battery Pack in Coolant Circulation Cooling System (CCCS)

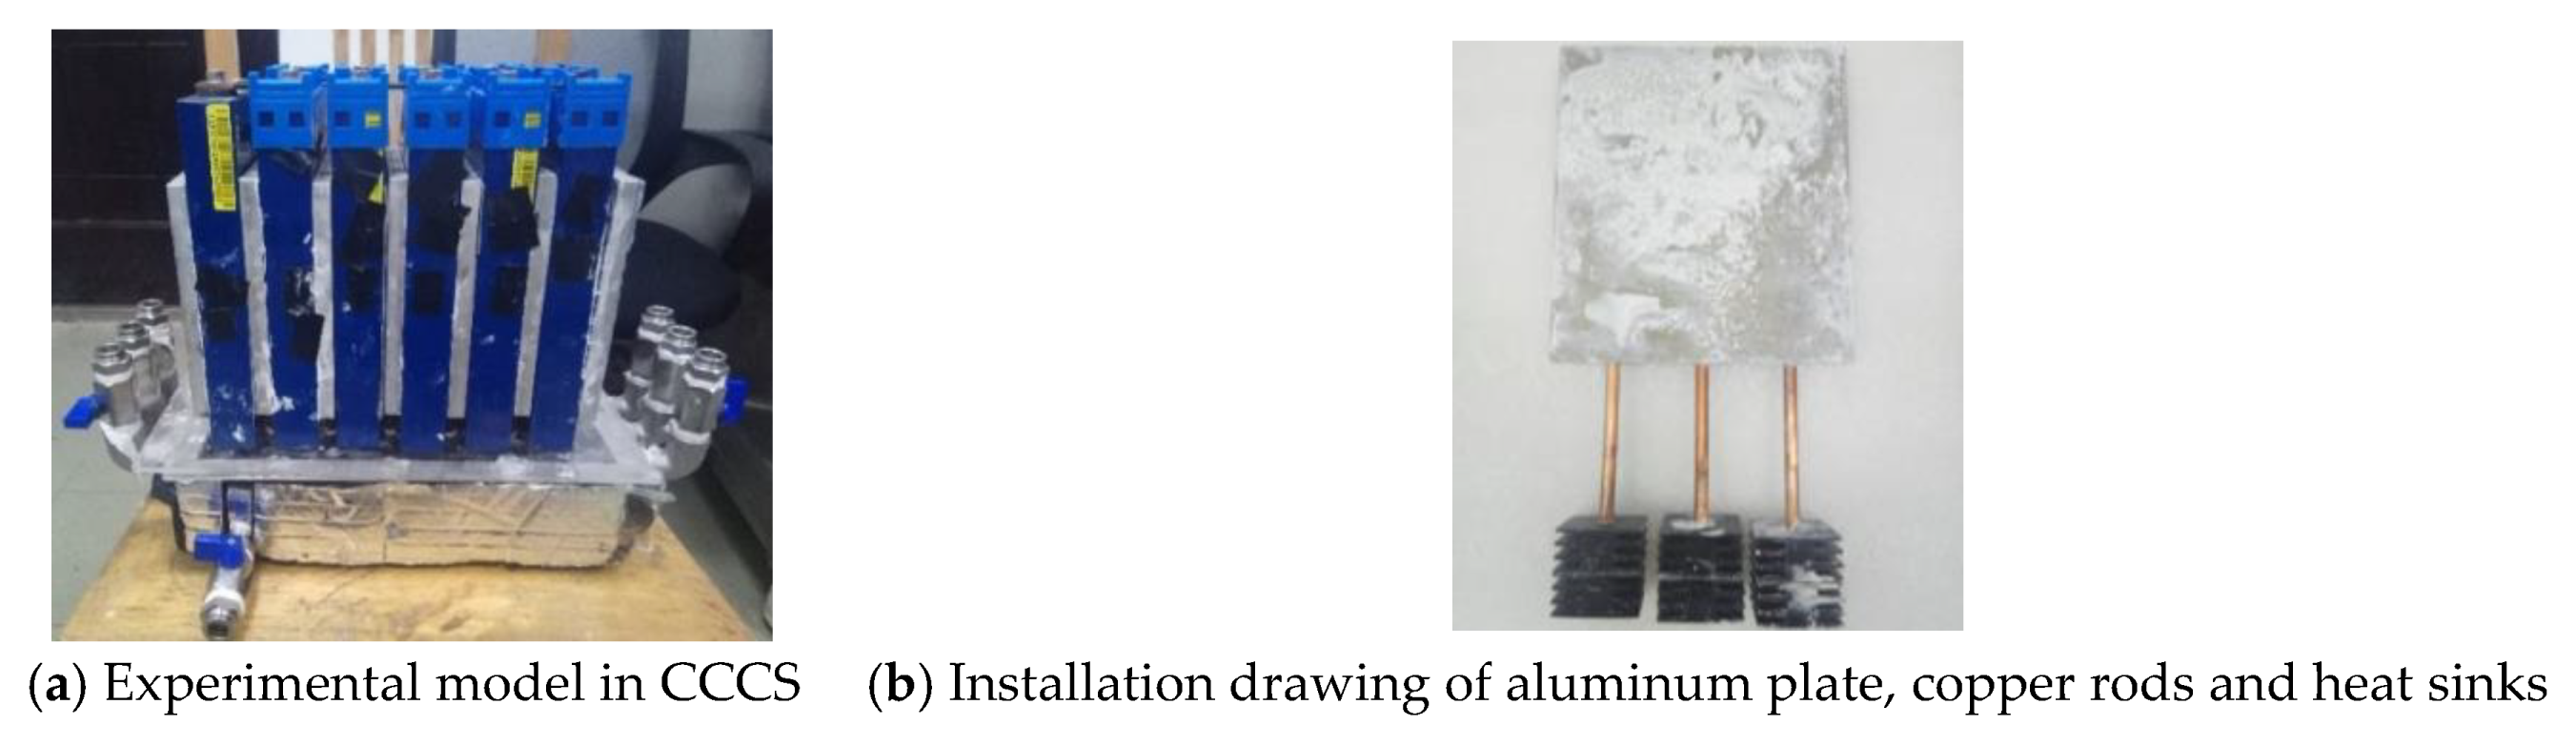
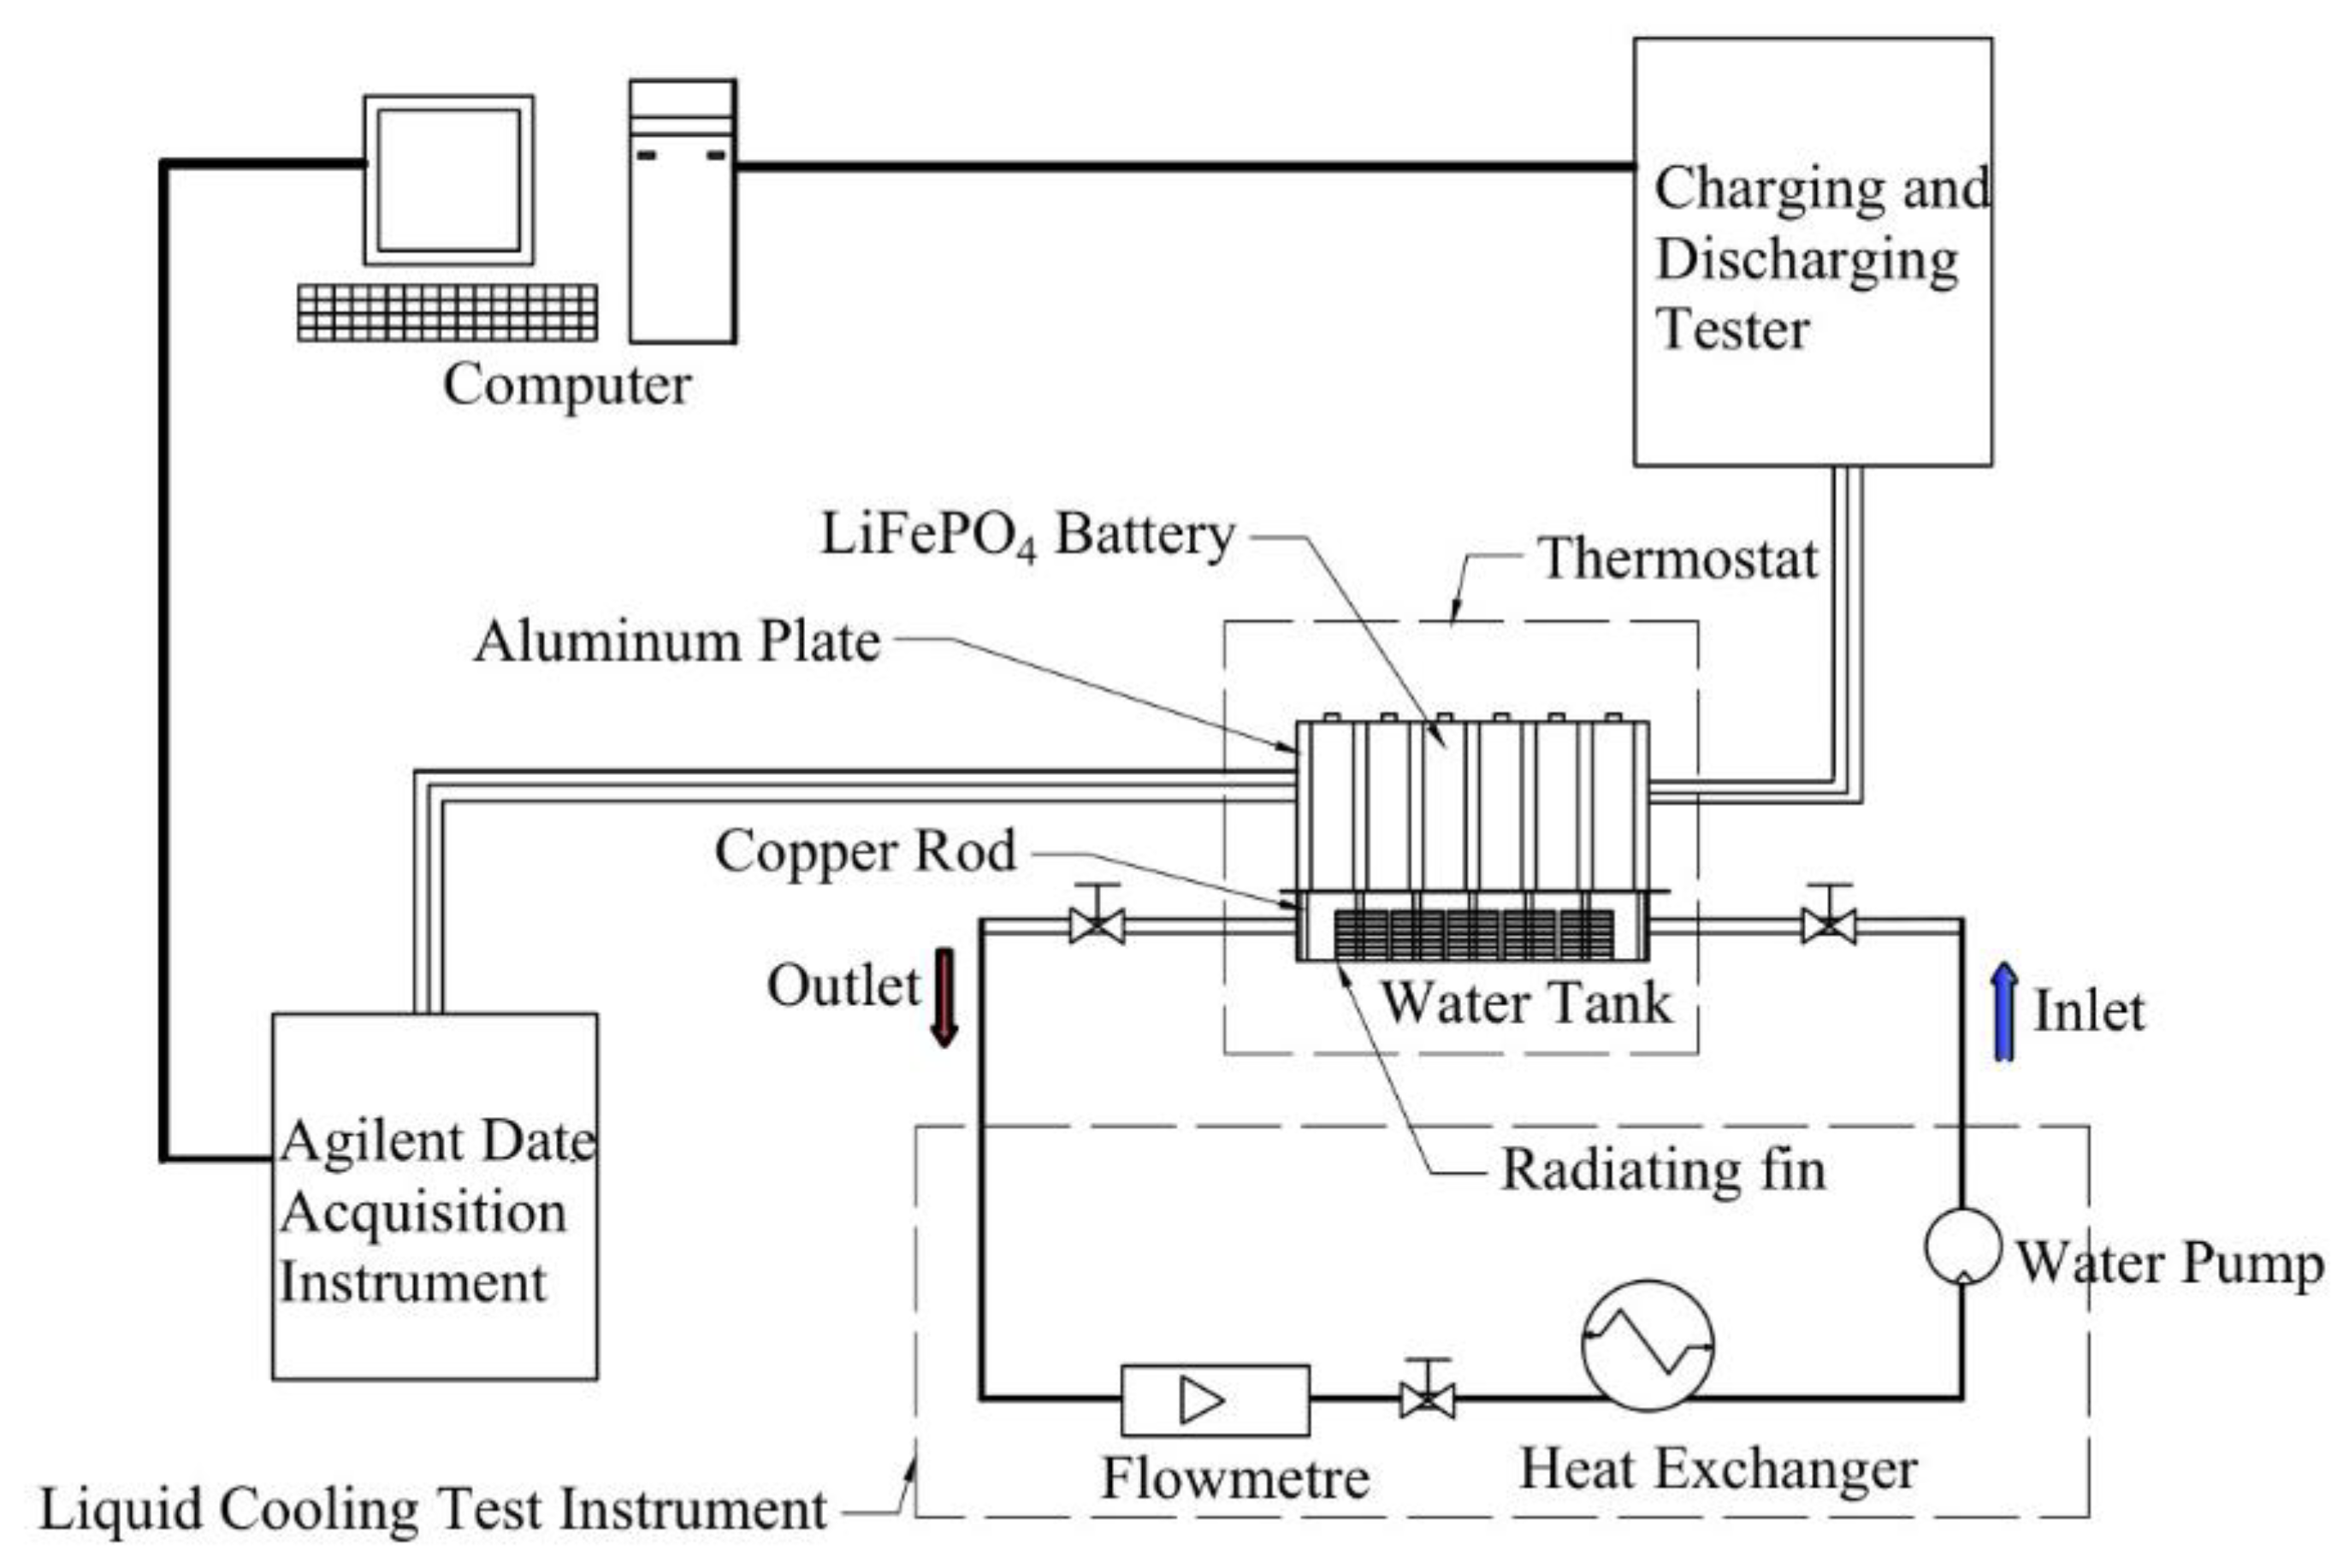
3.3.1. Design of CCCS

Considering the thermal conductivity and cost, this paper chose aluminum plates and copper rods as the thermal conductive materials. The CCCS proposed in this paper is shown in Figure 4. The whole battery pack was placed above the water tank. The aluminum plates and the lithium-ion batteries were installed at intervals, and the contact surface was thinly coated with thermal grease to fill the contact gap. Three copper rods were inserted into the aluminum plate. The top of the copper rods was flush with the upper end of the aluminum plate, and the bottom extended outward to the bottom of the water tank. In order to enlarge the heat dissipation area, heat sinks were installed at the bottom of the copper rod and placed in the water tank.
Figure 5 shows the working principle of CCCS. The heat exchanger and the water pump start to work, and the coolant circulates through the water tank. Then, battery pack starts to discharge. The heat generated by the lithium-ion battery pack is transferred to heat sinks through the aluminum plates and copper rods, and finally is dissipated by coolant. In order to save costs, this paper choose water at temperature of 293 K as the coolant.

3.3.2. Temperature Rise of Battery Pack in Coolant Circulating State

According to Figure 4a, the experimental model of CCCS was assembled in the thermostat, and the temperature of the thermostat was set as 303 K and 313 K, respectively, to simulate the ambient temperature. After the temperature of the thermostat had reached the set temperature for 8 h, the liquid cooling test instrument began to work to make the coolant circulate. Then, discharging experiments of 144 A current were carried out to study the temperature rise characteristics of the battery pack. When the ambient temperature is 303 K and 313 K, the comparison of experimental results between the natural state and the coolant circulating state is shown in Figure 6:
It can be seen from Figure 6 that in the same state, as the ambient temperature increases, the temperature of the battery pack increases. In the coolant circulating state, when the ambient temperature is 313 K, the temperature rise rate of the battery pack is slower than that when the ambient temperature is 303 K in the period of about 0–1100 s. This is because when the ambient temperature is 313 K, the difference of temperature between battery pack and coolant is larger, and the heat loss of the battery pack is faster. In the period of about 1100–1800 s, the specific heat capacity of coolant is constant and the ability to absorb heat is limited, so the temperature rising rate of the battery pack increases. When the ambient temperature is 303 K and 313 K, the temperature of the battery pack in the coolant circulating state reaches 315.7 K and 322.4 K, which is 6.6 K and 9.7 K, respectively, lower than that in the natural state, and the temperature of battery pack can be controlled within a safe range.

3.3.3. Temperature Rise of Battery Pack in Coolant without Circulating State

When the ambient temperature is 303 K, the temperature of the battery pack in the coolant circulating state is 315.7 K, which is 7.3 K lower than the upper limit of permitted temperature of the battery. In order to save energy, an experiment of the coolant not circulating was conducted under the same conditions to study the temperature rise of battery pack. In the natural state, coolant circulating state and coolant without circulating state, the temperature rise of the battery pack is shown in Figure 7.
It can be seen from Figure 7 that the rate of temperature rise of the battery pack is the largest in the natural state, and the smallest in the coolant circulating state. When the coolant does not circulate, the temperature of the battery pack reaches 318.6K, which is 3.7 K lower than that in the natural state, and its temperature of the battery pack is still within the safe using range. Therefore, when the ambient temperature is 303 K, a CCCS with coolant not circuiting can meet the usage conditions of the battery pack.

4. Simulation and Result Analysis

Numerical simulation can also be called theoretical experiment, which can not only compare and verify the results of the experiments, but also supply the analysis of the experiments.

4.1. Simulation Model Design

In this paper, the Solidworks and the DM (Design Modeler) module in Ansys was used to model the single lithium-ion battery and the model of CCCS is in a scale of 1:1. The sizes of components are as Table 2.
When modeling the water tank, in order to improve the quality of the grid, the wall thickness was ignored. In order to achieve the thermal balance of the actual simulation model, on the basis of the physical model, two half-cells were added on the outside of two aluminum plates. After completing the establishment of the simulation models, they were imported into the mesh module for automatic meshing. According to the characteristics of the model structure, local encryption was performed. Figure 8 shows the simulation models after completing meshing.
The grid of above simulation models was mainly divided into a tetrahedral grid, hexahedral grid and wedge grid. According to the aspect ratio of each cell grid, the abscissa is 0 to 1, which represents the quality of each cell grid. The closer to 1 the quality is, the better the cell grid quality is. The quality of each cell grid in this paper was over 0.2, and more than 80% of the grids had a quality of around 0.8, showing a good quality of all grids. After the mesh division was completed, the mesh file was imported into the Fluent module to set the boundary conditions.
According to the theoretical calculations in Chapter 2, the heat generation rate of lithium-ion battery can be known at different ambient temperature in discharge current of 144 A. According to reference [24], the heat-transfer coefficient was taken as 3.9 W·m−2·K−1. The simulation parameters of the lithium-ion battery, aluminum plate and copper rod are shown in Table 3:
We turn on the energy equation, and select the k-e turbulence model while keeping the default settings for others. Transient heat transfer was chosen for the simulation. According to the discharging current, simulation time had been set. The time step was set for 3 s, and saving once every two steps.

4.2. Simulation of Temperature Rise of Battery Pack in Natural State

The temperature of ambient environment was set to 263 K, 273 K, 283 K, 293 K, 303 K, and 313 K, respectively. At the low temperature, the lithium-ion battery cannot be fully discharged. According to the experimental data in chapter 3.2, when the ambient temperature was 263 K, 273 K and 283 K, the simulation duration was 1527 s, 1648 s and 1750 s, respectively, and when the ambient temperature was 293 K, 303 K and 313 K, the simulation duration was 1800 s. The simulation results are shown in Figure 9.
It can be seen from Figure 9 that as the ambient temperature increases, the temperature of the battery pack shows an increasing trend. When the ambient temperature was higher than 303 K, the temperature of battery pack approached or even exceeded its upper limit of the safe use range. Working under this high temperature condition for a long time is likely to cause thermal runaway. Therefore, the BTMS plays a vital role in the working process of battery. The following continues to study the temperature rise of battery pack when the ambient temperature exceeds 303 K after adding the cooling system.

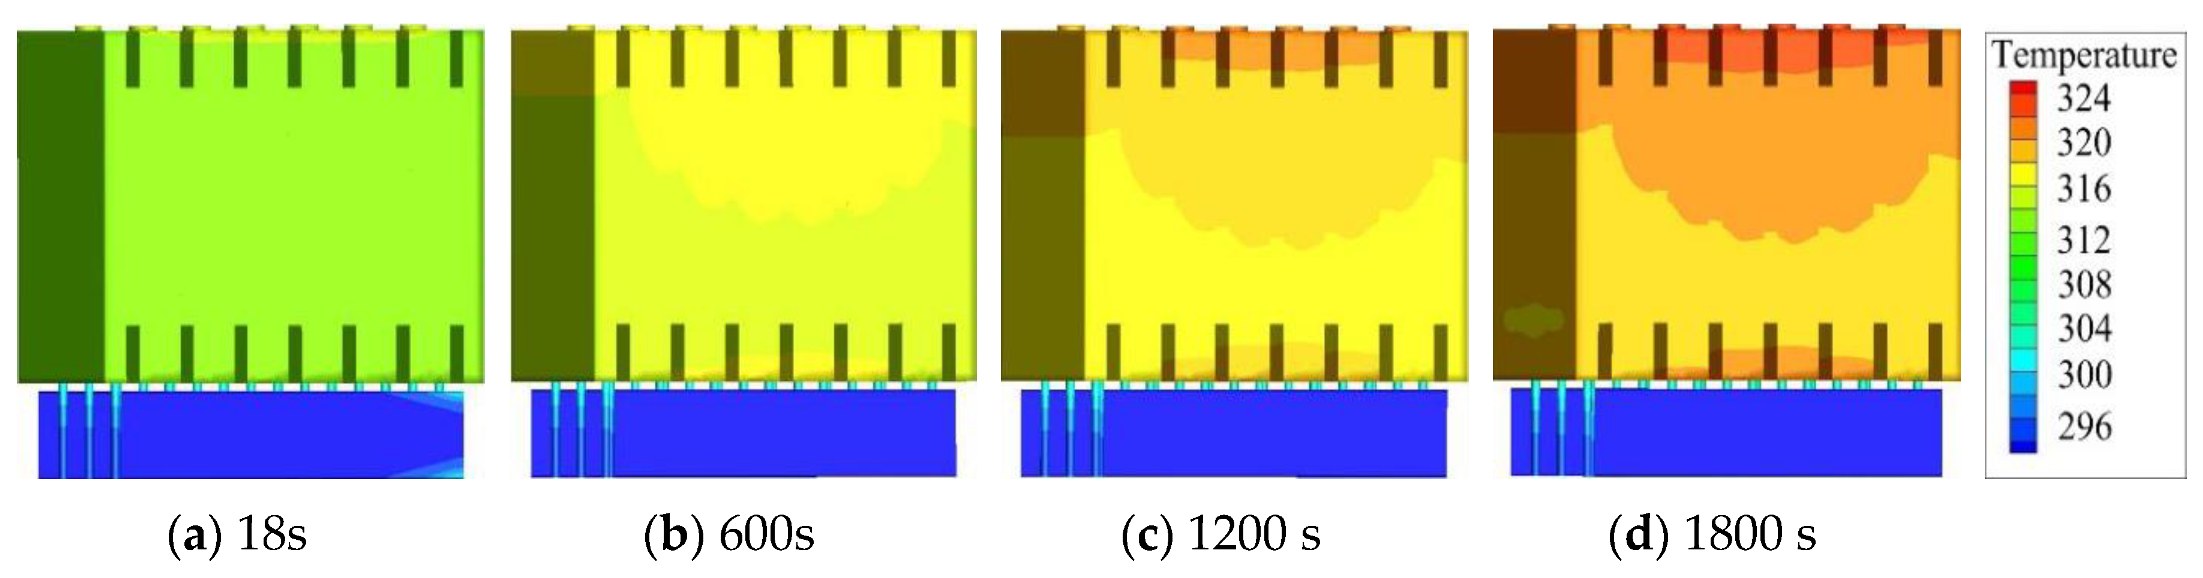
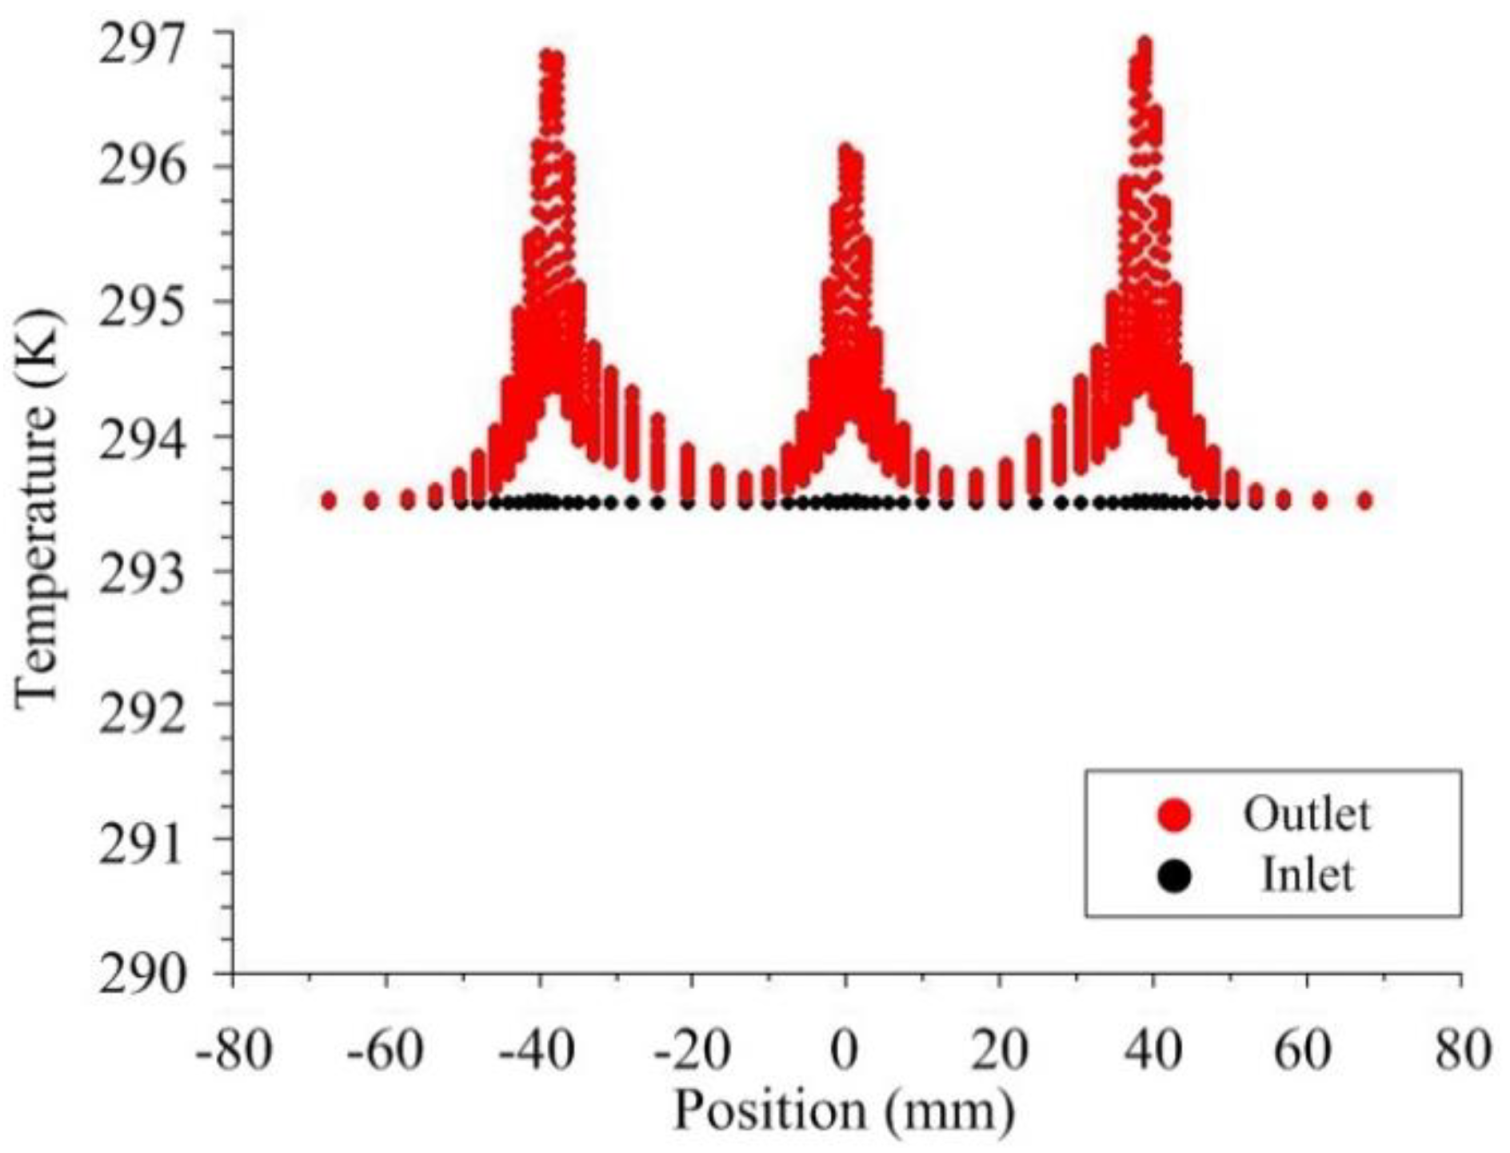
4.3. Simulation with CCCS

The flow of coolant in the water tank selected in this paper was 0.6 L/s. In order to make coolant flow uniformly through the water tank, the two sides of the water tank were set as inlet and outlet, respectively. Ambient temperature was set to 303 K and 313 K respectively, and the simulation duration was 1800 s. Figure 10 and Figure 11 are the temperature cloud graphs of the battery pack at different time periods.
As shown in the figure, when the ambient temperature is 303 K and 313 K, the temperature of the battery pack, respectively, reaches 313.7 K and 321.2 K at the end of the discharging, which is 8.4 K and 10.3 K lower than that in the natural state, which verifies the effectiveness of CCCS proposed in this paper. Although by adding this system the temperature of battery pack decreases significantly, when the ambient temperature reaches 313 K the temperature of battery pack is still very close to the upper limit of the permitted temperature.

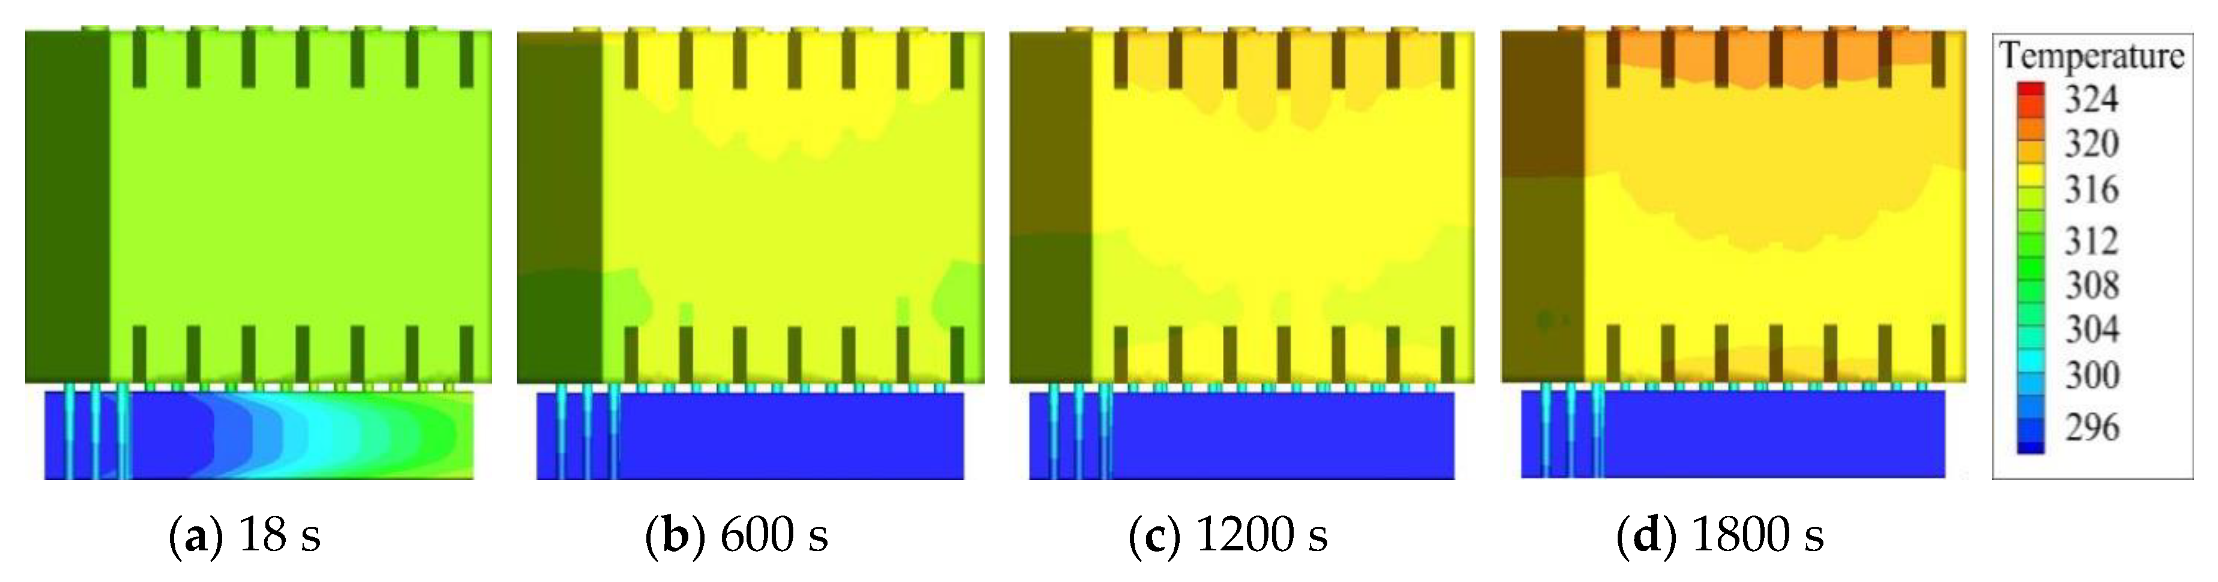
4.4. Simulation with Optimized CCCS

When ambient temperature is 313 K, Figure 12 shows a comparison of temperature changes at different positions on the inlet and outlet of the water tank at the end of the discharge. The temperature of the coolant only near the copper rods has increased obviously, and the temperature of the coolant in other places has hardly changed. Moreover, the increase of temperature of the coolant near the copper rods, which is on both sides, is more obvious. The maximum temperature of the liquid rises to 3.6 K at 313 K ambient temperature.
Based on the above analysis, this paper proposed to increase the diameter of the copper rod, which can improve the efficiency of heat transfer, and further improve the heat dissipation effect of the system. When ambient temperature is 313 K and the diameter of copper rod is 7 mm, Figure 13 shows the temperature cloud graphs of the battery pack at different periods.
It can be seen from Figure 13 that when the diameter of the copper rod is 7 mm, the temperature of the battery pack reaches 319.3 K at the end of discharge, which is 2.1 K lower than that the diameter of copper rod which is 6 mm, as shown in Figure 11. This result indicates that increasing the diameter of the copper rod can improve the heat-transfer efficiency of the copper rod and further reduce the temperature of the battery pack at the end of discharge.

5. Discussion and Conclusions

5.1. Discussion

5.1.1. Comparison of Experiment and Simulation Results in the Natural State

The ratio of temperature difference between the end of discharge and the initial to the discharge time is called the average temperature rise rate. Experiments and simulation have been conducted to study on the temperature rise of lithium-ion battery packs at different ambient temperatures. The highest temperature and temperature rise rates are shown in Figure 14.
It can be seen from Figure 14 that as the ambient temperature increases, the average temperature rise rate of the battery pack decreases, which is mainly caused by the internal resistance that changes with temperature. The changing trend of the experimental and simulation results is consistent. The maximum difference of the highest temperature and the average temperature rise rate occurs at the ambient temperature of 263 K, which are 2.9 K and 0.0019 K/s, respectively. Those difference are small and can be considered as reasonable errors, indicating that the experimental results are in line with simulation results.

5.1.2. Comparison of Experiment and Simulation Results Adding CCCS

Based on the CCCS proposed in this paper, experiments and simulations were conducted at ambient temperatures of 303 K and 313 K. The temperature rise of the battery pack is shown in Figure 15.
As shown in Figure 15, during the simulation, the temperature rise curve of the battery pack rises steadily. During the experiment, when the ambient temperature is 303 K, the temperature rise rate of the battery pack is almost unchanged, and the maximum error from the simulation curve is 1.4 K; when the ambient temperature is 313 K, the temperature rise rate of the battery pack is stable in the early stage and increases in the later stage, and the maximum error from the simulation curve is 2.1 K. Due to the error between experiment and simulation being small, it can be considered that the experiment and simulation results are consistent.

5.2. Conclusions

In order to solve the problem of thermal runaway that occurs during the use of lithium-ion batteries, this paper designed a coolant circulation cooling system combining aluminum plates and copper rods. In order to verify the effectiveness of this cooling system, experiments and simulations were conducted. Based on a CALB-LB5F73 LiFePO4 battery, the following conclusions can be drawn:
(1)
Working in the natural state, a lithium-ion battery pack can discharge within its safe temperature range in the condition where ambient temperature is below 303 K.
(2)
Adding the CCCS with coolant not circulating, the temperature of lithium-ion battery pack can be controlled in a reasonable range at the ambient temperature of 303 K. When the CCCS with coolant circulating, the temperature has reduced further, and is still in a safe range until the ambient temperature goes over 313 K.
(3)
When the ambient temperature reaches 313 K, the temperature of the battery pack is close to the upper limit of the safe-use range. The CCCS can be optimized by increasing the diameter of the copper rod to reduce the temperature further.
The whole size of this cooling system is L256 × T135 × H283 mm, and if used in electric vehicles, this cooling system can be used combining the air-conditioning system to control the temperature of the coolant. Our future work will focus on the BTMS for lithium-ion batteries used at low ambient temperature. If the circulating liquid is hot, the CCCS can exchange into a coolant circulating heat system. Furthermore, the thermal conductivity of copper rods is limited, and copper rods can be replaced by a heat pipe to improve the effect of coolant circulating heat system.

Author Contributions

Conceptualization, C.Z.; methodology, Z.X. and H.G.; software, S.C.; formal analysis, J.W. and M.D.; date curation, Z.X. and J.Z.; writing-original draft, Z.X. and S.G. All authors have read and agreed to the published version of the manuscript.

Funding

This research was funded by the Natural Science Foundation of China, grant number “51974229” and the APC was funded by Xi’an University of Science and Technology.

Acknowledgments

This study was supported by a research grant from the Natural Science Foundation of China (Grant No. 51974229).

Conflicts of Interest

The authors declare no conflict of interest. The funders had no role in the design of the study; in the collection, analyses, or interpretation of data; in the writing of the manuscript, or in the decision to publish the results.

References

  1. Wu, W.X.; Yang, X.Q.; Zhang, G.Q.; Ke, X.F.; Wang, Z.Y.; Situ, W.F.; Li, X.X.; Zhang, J.Y. An experiment study of thermal management system using copper mesh-enhanced composite phase change materials for power battery pack. Energy 2016, 113, 909–916. [Google Scholar] [CrossRef]
  2. Zhang, C.W.; Xia, Z.; Wang, B.; Gao, H.B.; Chen, S.R.; Zong, S.C.; Luo, K.X. A Li-Ion Battery Management System Combining a Heat Pipe and Thermoelectric Cooler. Energies 2020, 13, 841. [Google Scholar] [CrossRef] [Green Version]
  3. Wang, X.M.; Xie, Y.Q.; Day, R.; Wu, H.W.; Hu, Z.L.; Zhu, J.Q.; Wen, D.S. Performance analysis of a novel thermal management system with composite phase material for a lithium-ion battery pack. Energy 2018, 156, 154–168. [Google Scholar] [CrossRef] [Green Version]
  4. Wang, Q.S.; Ping, P.; Zhao, X.J. Thermal runaway caused fire and explosion of lithium ion battery. Power Sources 2012, 208, 210–224. [Google Scholar] [CrossRef]
  5. Feng, X.N.; Lu, L.G.; Ouyang, M.G.; Li, J.Q.; He, X.M. A 3D thermal runaway propagation model for a large format lithium ion battery module. Energy 2016, 115, 194–208. [Google Scholar] [CrossRef]
  6. Teng, H.; Ma, Y.; Yeow, K.; Thelliez, M. Thermal Characterization of a Li-ion Battery Module Cooled through Aluminum Heat-Sink Plates. Int. J. Passeng. Cars 2011, 4, 1331–1342. [Google Scholar] [CrossRef]
  7. Wang, T.; Tseng, K.J.; Zhao, J.Y.; Wei, Z.B. Thermal investigation of lithium-ion battery module with different cell arrangement structures and forced air-cooling strategies. Appl. Energy 2014, 134, 229–238. [Google Scholar] [CrossRef]
  8. Wang, T.; Tseng, K.J.; Zhao, J.Y. Development of efficient air-cooling strategies for lithium-ion battery module based on empirical heat source model. Appl. Therm. Eng. 2015, 90, 521–529. [Google Scholar] [CrossRef]
  9. Adams, D.T.; Berdichevsky, G.; Colson, T.; Hebert, A.; Kohn, S.; Lyons, D.; Mendez, N.J.; Straubel, J.B.; West, D.; Simpson, A. Battery Pack Thermal Management System. U.S. Patent 20090023056A1, 22 January 2009. [Google Scholar]
  10. Lan, C.J.; Xu, J.; Qiao, Y.; Ma, Y.B. Thermal management for high power lithium-ion battery by minichannel aluminum tubes. Appl. Therm. Eng. 2016, 101, 284–292. [Google Scholar] [CrossRef] [Green Version]
  11. Zhao, C.R.; Sousa, A.C.M.; Jiang, F.M. Minimization of thermal non-uniformity in lithium-ion battery pack cooled by channeled liquid flow. Int. J. Heat Mass Transf. 2019, 129, 660–670. [Google Scholar] [CrossRef]
  12. Jarrett, A.; Kim, I.Y. Design optimization of electric vehicle battery cooling plates for thermal performance. J. Power Sources 2011, 196, 10359–10368. [Google Scholar] [CrossRef]
  13. Wang, S.N.; Li, Y.H.; Li, Y.Z.; Mao, Y.F.; Zhang, Y.N.; Guo, W.; Zhong, M.L. A forced gas cooling circle packaging with liquid cooling plate for the thermal management of Li-ion batteries under space environment. Appl. Therm. Eng. 2017, 123, 929–939. [Google Scholar] [CrossRef]
  14. Deng, S.S.; Li, K.N.; Xie, Y.; Wu, C.X.; Wang, P.Z.; Yu, M.; Li, B.; Deng, J.T. Heat Pipe Thermal Management Based on High-Rate Discharge and Pulse Cycle Tests for Lithium-Ion Batteries. Energies 2019, 12, 3143. [Google Scholar] [CrossRef] [Green Version]
  15. Arora, S.S.; Kapoor, A.; Shen, W.X. A novel thermal management system for improving discharge/charge performance of Li-ion battery packs under abuse. J. Power Source 2018, 378, 759–775. [Google Scholar] [CrossRef]
  16. Qian, S.T. The Design of Heat Radiation Structure and Simulation of Cooling System for EV’S Li-ion Power Battery. Master’s Thesis, Zhejiang University of Technology, Hangzhou, China, 2013. [Google Scholar]
  17. Park, H. A design of air flow configuration for cooling lithium ion battery in hybrid electric vehicles. J. Power Sources 2013, 239, 30–36. [Google Scholar] [CrossRef]
  18. Arun, M.D.; Dean, H.; Krishna, N.M.; Manickam, M. Design, Development and Thermal Analysis of Reusable Li-Ion Battery Module for Future Mobile and Stationary Application. Energies 2020, 13, 1477. [Google Scholar]
  19. Noboru, S. Thermal behavior analysis of lithium-ion batteries for electric and hybrid vehicles. J. Power Sources 2001, 99, 70–77. [Google Scholar]
  20. Jiang, C. Research of Thermal Characteristics of Battery Pack in Pure Electric Vehicle. Master’s Thesis, Hefei University of Technology, Hefei, China, 2015. [Google Scholar]
  21. Bernardi, D.; Pawlikowski, E.; Newman, J. A general balance for battery systems. Electrochem. Soc. 1985, 132, 1. [Google Scholar] [CrossRef] [Green Version]
  22. Rodrigues, M.T.F.; Babu, G.; Gullapalli, H.; Kalaga, K.; Sayed, F.N.; Kato, K.; Joyner, J.; Ajayan, P.M. A materials perspective on Li-ion batteries at extreme temperature. Nat. Energy 2017, 2, 17108. [Google Scholar] [CrossRef]
  23. Liu, X.Z.; Wang, Y.H.; Yang, Y.J.; Lv, W.; Lian, G.; Golberg, D.; Wang, X.; Zhao, X.; Ding, Y. A MoS2/Carbon hybrid anode for high-performance Li-ion batteries at low temperature. Nano Energy 2020, 70, 104550. [Google Scholar] [CrossRef]
  24. Wang, S.X.; Zhang, N.; Zhang, M. Simulation Analysis of Lithium-ion Battery Thermal Management in EV. J. Therm. Sci. Technol. 2016, 15, 40–45. [Google Scholar]
Figure 1. The value of total internal resistance and heat generation rate.
Energies 13 04296 g001
Figure 2. Experimental model in natural state.
Energies 13 04296 g002
Figure 3. Temperature rise in natural state at different ambient temperature.
Energies 13 04296 g003
Figure 4. The construction of coolant circulation cooling system (CCCS).
Energies 13 04296 g004
Figure 5. The working principle of CCCS.
Energies 13 04296 g005
Figure 6. The comparison of experimental results.
Energies 13 04296 g006
Figure 7. The temperature rises of the battery pack in different state.
Energies 13 04296 g007
Figure 8. Simulation models meshing.
Energies 13 04296 g008
Figure 9. Simulation results in natural state at different ambient temperature.
Energies 13 04296 g009
Figure 10. Temperature cloud graphs of battery pack at ambient temperature of 303K.
Energies 13 04296 g010
Figure 11. Temperature cloud graphs of battery pack at ambient temperature of 313 K.
Energies 13 04296 g011
Figure 12. Comparison of temperature changes at different positions on the inlet and outlet of the water tank.
Energies 13 04296 g012
Figure 13. Temperature clouds graphs at 7 mm diameter of copper rod at 313 K ambient temperature.
Energies 13 04296 g013
Figure 14. Comparison of the highest temperature and average temperature rise rate of battery pack.
Energies 13 04296 g014
Figure 15. Experimental and simulated temperature rise curves of the battery pack.
Energies 13 04296 g015
Table 1. The parameters of the CALB-L135F73 LiFePO4 battery.
Number OrderItemSpecification
1Size (L × W× H)135 × 30 × 220.8 mm
2Rated capacity72 Ah
3Rated voltage3.2 V
4Normal working voltage2.5–3.65 V
5Maximum discharging current144 A
6Safe working temperature253–323 K
Table 2. Sizes of components.
ComponentLength (mm)Thickness (mm)Height (mm)
Aluminum plate13510150
Copper rodDiameter 6 mm245
Heat sink303025
Water tank25613560
Table 3. Simulation parameters in this paper.
MaterialDensity
(kg·m−3)
Specific Heat Capacity (J·kg−1·K−1)Thermal Conductivity
(W·m−1·K−1)
Li-ion Battery199099010
Aluminum Plate2719871202
Copper Rod7900390401

