Article

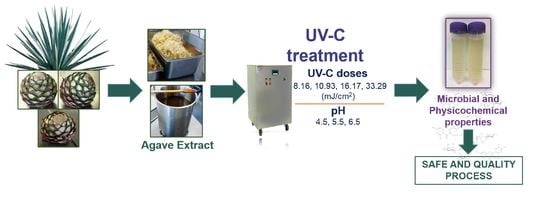
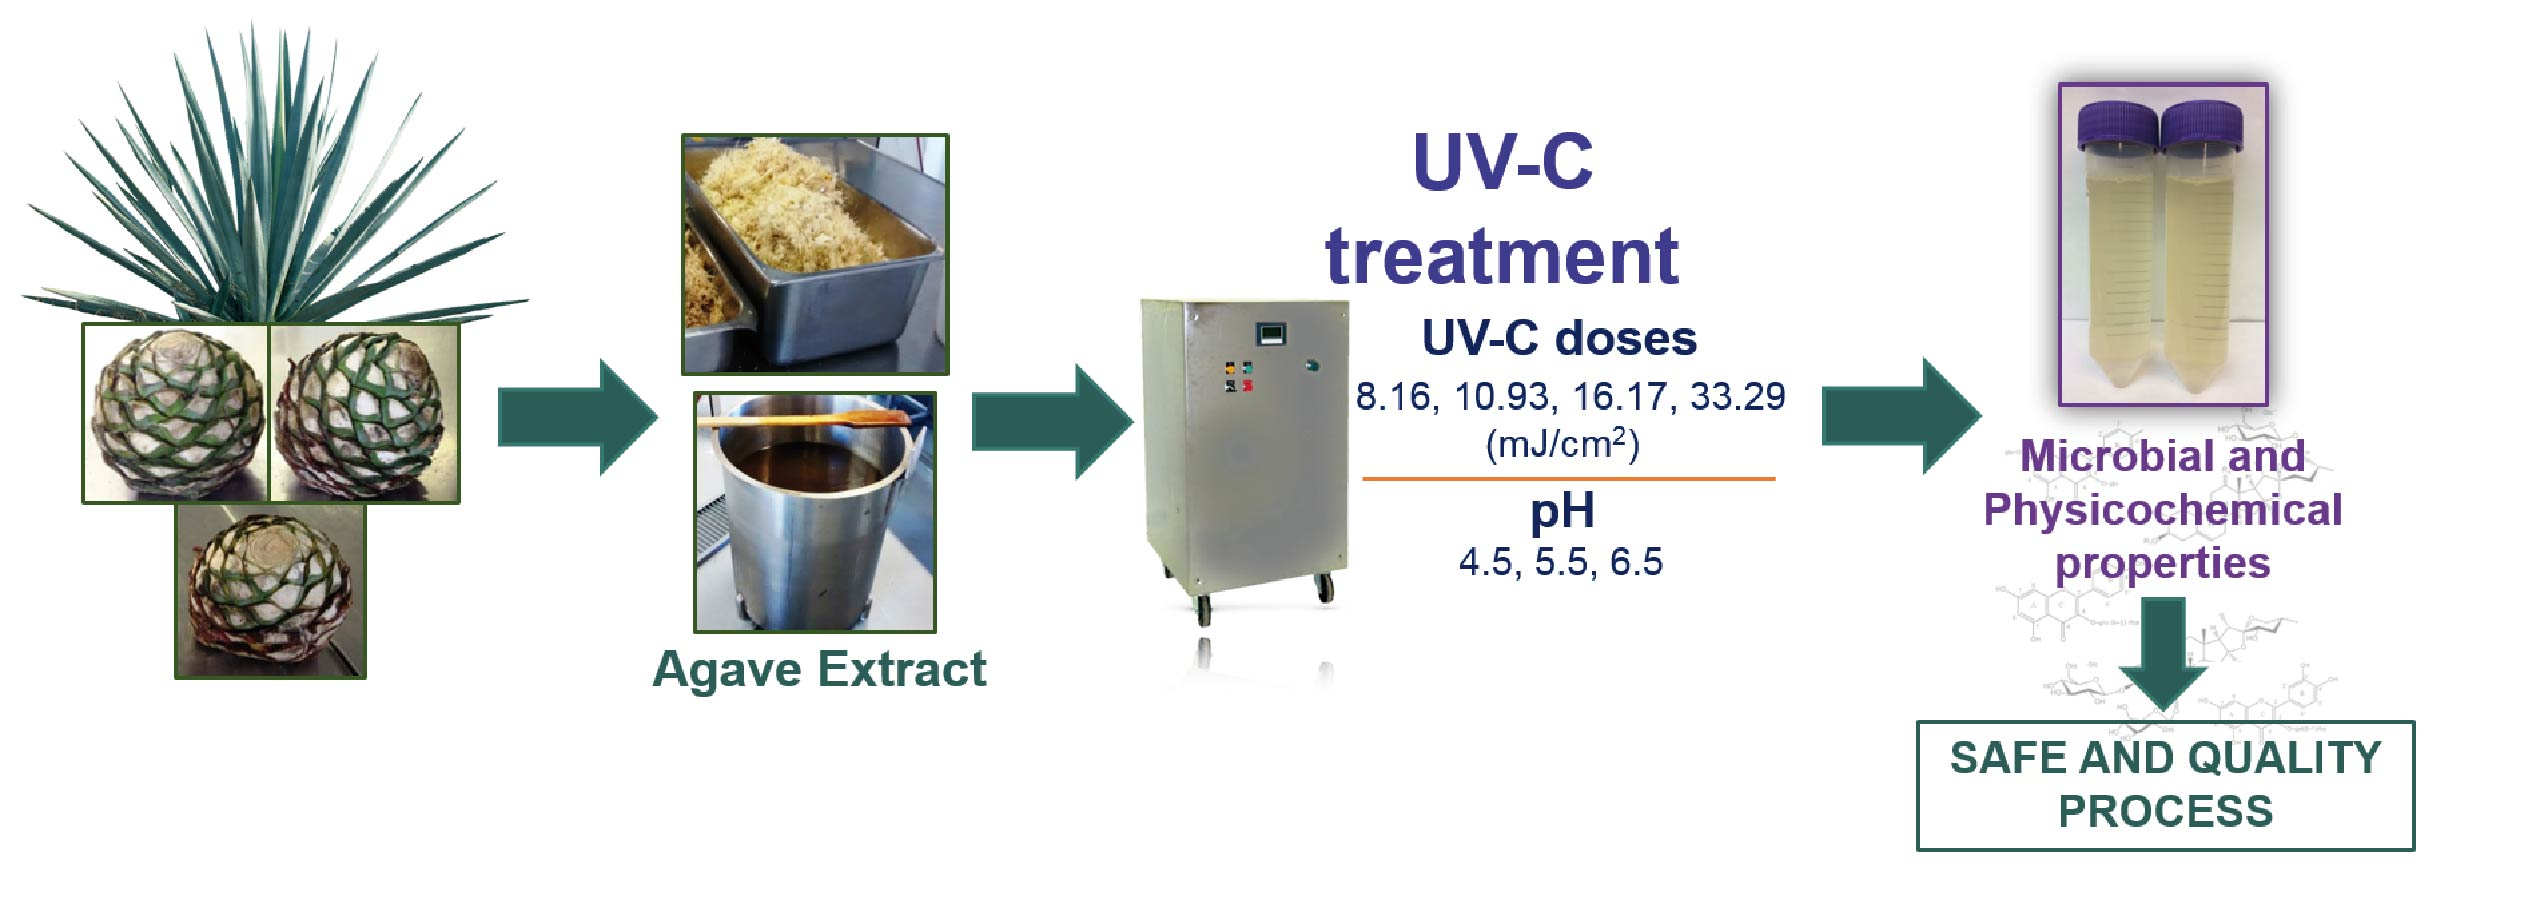
Effects of UV-C Irradiation and Thermal Processing on the Microbial and Physicochemical Properties of Agave tequilana Weber var. azul Extracts at Various pH Values

by
Aracely Z. Santana-Jiménez
1,
Armando Quintero-Ramos
1,*,
Miguel Á. Sánchez-Madrigal
1,
Carmen O. Meléndez-Pizarro
1,
María del Cielo Valdez-Cárdenas
1,
Magdalena del Rosario Orizaga-Heredia
1,
Gerardo Méndez-Zamora
2 and
Ricardo Talamás-Abbud
1
1
Facultad de Ciencias Químicas, Universidad Autónoma de Chihuahua, Nuevo Campus Universitario s/n, Circuito Universitario # 2, Chihuahua C.P. 31125, Chihuahua, Mexico
2
Facultad de Agronomía, Universidad Autónoma de Nuevo León, Francisco Villa s/n, Ex Hacienda El Canada, Escobedo 66050, Nuevo León, Mexico
*
Author to whom correspondence should be addressed.
Processes 2020, 8(7), 841; https://doi.org/10.3390/pr8070841
Submission received: 19 June 2020 / Revised: 11 July 2020 / Accepted: 12 July 2020 / Published: 15 July 2020
(This article belongs to the Special Issue Progress in Food Processing)

Abstract

:
The effects of UV-C irradiation (at doses of 8.16, 10.93, 16.17, and 33.29 mJ/cm2) on the physicochemical and microbiological properties of Agave tequilana Weber extracts at various pH values (4.5, 5.5, and 6.5) were evaluated. Thermal treatment (TT) was used as a control (85 °C for 30 s). Both processed (UV-C or TT) and unprocessed (UP) extracts were investigated. The UV-C dose and the pH significantly (p < 0.05) affected the inactivation of total coliforms (TC), total aerobic mesophiles (TAM), and yeasts and molds (YM). UV-C doses of 10.93 mJ/cm2 at pH 4.5 and 33.29 mJ/cm2 at any agave extract pH completely inactivated the native microbial load compared to TT. The total polyphenols (TP), antioxidant activity (AA), and sugar content did not change in the agave extracts at any dose, but the total flavonoid (TF) content decreased at doses > 16.17 mJ/cm2 at the evaluated pH values. Although the color of the agave extracts (L*, a*, and b*) was significantly affected, the total color difference (∆E) did not change after processing compared to the ∆E in the UP extracts. TT further reduced all the physicochemical properties of the agave extracts compared to UV-C processing. The results suggest that UV-C continuous flow technology can be used to stabilize agave extracts at doses of 10.93 mJ/cm2 and pH 4.5, while preserving their functional properties.

Graphical Abstract

1. Introduction

Agave plants are endemic to the Americas. The greatest diversity of the Agave genus occurs in Mexico, where 75% of species are found [1]. Agaves are important because they contain water-soluble carbohydrates such as fructan, which is their main carbohydrate reserve. The blue agave (Agave tequilana Weber var. azul) is the most economically important variety in Mexico, and is used primarily for the production of “Tequila”, which is internationally recognized as the most popular alcoholic beverage made from agave [2]. In recent years, agaves have also been used to produce insulin-type fructans, fructose syrups, extracts, and other derivatives, which are either directly consumed or used in food formulations [3,4]. Some researchers have highlighted the bioactivity of the agave genus in terms of its products and by-products [5], owing to the presence of various metabolites such as reducing sugars [6]; tannins [7]; and phenolic compounds [8], including flavonoids [9] and saponins [10]. High antibacterial activity has been reported in extracts from some agave species—such as Agave tequilana Weber var. azul—compared to the antibacterial activity in extracts from other species [7,8]. Such activity is associated with the presence of tannins, alkaloids, flavonoids, and saponins [7]. Extracts obtained from the heads of A. tequilana Weber var. azul have mainly been valued for their fructan content. However, these extracts are a potential source of phytochemicals and functional products such as fructose-rich syrups, which are in increasing demand as food additives owing to their health benefits and low glycemic indices [3]. Thermal methods are used to ensure the safe preservation of these agave extracts and syrups. However, the exposition of these extracts and syrups to high temperatures can affect their bioactive compounds. Muñiz-Márquez et al. [4] reported changes in some sugars during the heat treatment of Mexican agave syrups. Therefore, for the preservation of this kind of product, it is desirable that moderate heat treatments or non-thermal alternative strategies are applied. Ultraviolet light irradiation (UV-C) is a non-thermal strategy that could be applied individually or in combination with mild heat treatment to ensure the safety of the product. It is also a cost-effective non-thermal pasteurization strategy for liquid foods. UV-C is short wavelength irradiation that inactivates microorganisms in the 250–260 nm range [11]. Its most efficient germicidal effect occurs at 253.7 nm, which corresponds to the peak of UV absorption by bacterial DNA [12], but it has minor effects on the inactivation of molds and yeasts [13]. This strategy has been applied effectively to fruit juice to eliminate pathogens such as Escherichia coli [11,13,14], Listeria innocua [15], and Cryptosporidium parvum [16]. Although the effectiveness of UV-C light for the inactivation of microorganisms has been demonstrated, it is dependent on various factors such as the pH and optical properties of the liquid, the irradiation dose, the type and load of the microorganisms, and the characteristics of the UV system used (batch or continuous). These factors must be optimized to establish adequate processing conditions [12,17]. Agave extracts and syrups are susceptible to microbial contamination, which jeopardizes their quality and safety. Under appropriate conditions, UV-C irradiation can provide an alternative strategy for the stabilization of agave extracts. However, data regarding this approach are scarce, and the impact of the strategy on the microbiological and physicochemical characteristics of A. tequilana extract is unclear. The present study aimed to evaluate the effect of various UV-C doses at different pH values on the physicochemical and microbiological properties of Agave tequilana Weber var. azul extracts.

2. Materials and Methods

2.1. Chemicals and Reagents

Folin–Ciocalteu phenol reagent, gallic acid, 2,2-diphenyl-1-picrylhydrazyl (DPPH), catechin, d-fructose, and 6-hydroxy-2,5,7,8-tetramethylchroman-2-carboxylic acid (Trolox) were purchased from Sigma-Aldrich (St. Louis, MO, USA). Plate count agar (PCA; Difco, Detroit, MI, USA), violet red bile agar (VRBA; Difco, Detroit, MI, USA), and potato dextrose agar (PDA; Difco, Detroit, MI, USA) were used for the microbiological analyses. All the other analytical grade reagents and solvents were obtained from J.T. Baker (Mexico City, Mexico).

2.2. Agave Tequilana Plant

Three 6-year-old Agave tequilana Weber var. azul heads weighing 7–15 kg were collected from the same area of Tequila, Jalisco State, Mexico. The agave heads were stored at 4 °C and 90% relative humidity for 2 days before analysis.

2.3. Obtaining A. tequilana Weber var. azul Extract

The agave heads were peeled and washed in a solution of sodium hypochlorite (200 ppm) and then rinsed with tap water. Each head was cut transversely into two halves, and subsequently into four parts. Each of these pieces was cut into smaller sections and ground in a model T 5 L industrial blender (TAPISA, Mexico City, Mexico). The ground fresh agave material was immediately subjected to extraction with a solid: liquid ratio (agave: distilled water) of 1:10 at 70 °C for 45 min. Subsequently, the extract was collected and the remaining solids were compressed to obtain the remaining extract. The obtained extracts were mixed and filtered through a 100-mesh stainless steel sieve to remove impurities and foreign matter. The final extract was stored at 4 °C for 2 h or less before use.

2.4. Extract Characterization

The Agave tequilana extract was characterized in terms of pH, soluble solids (the sugar content in degrees Brix (°Bx)), and optical properties. The pH was measured using the Association of Official Agricultural Chemists (AOAC) method 981.12 [18] with an EDGE HI2020 digital pH meter (Hanna Instruments, RI, USA). The total soluble solids (°Bx) were measured using an Abbe hand refractometer (Atago Co. Ltd., Tokyo, Japan) according to the AOAC method 932.12 [18]. The optical properties were determined according to the method described by Koutchma et al. 2004 [19]. The absorption coefficient of the extract was determined using matched demountable fused quartz cuvettes (FireflySci, Inc., NY, USA) with path lengths of 0.1, 0.2, 0.5, and 1.0 mm. Each sample solution was placed in a cuvette and investigated at 254 nm using a Lambda 25 UV/VIS spectrophotometer (PerkinElmer, Waltham, MA, USA). The absorption coefficient (log base 10) of the sample solution (α) was calculated from the slope of the absorbance and the path length and expressed in cm−1. The turbidity was measured using a micro Turbidimeter 100 system (Scientific Inc., Fort Myers, FL, USA), and was expressed in nephelometric turbidity units (NTU). The penetration depth parameter was calculated as the reciprocal of the absorption coefficient (l = 1/α) and expressed in cm. These measurements were obtained in triplicate, and the mean values with standard deviations are reported herein.

2.5. UV-C Irradiation Treatments

The obtained Agave tequilana extract was separated into three batches and adjusted to various pH values (4.5, 5.5, and 6.5). Each batch was subjected to irradiation doses of 8.16 ± 0.12 (D1), 10.93 ± 0.17 (D2), 16.17 ± 0.72 (D3), and 33.29 ± 0.59 (D4) mJ/cm2 in duplicate. The UV doses were achieved by adjusting the flow rate (37.85–151.41 L per hour (LPH)) of the agave extracts through a CiderSure 3500 commercial UV-C processing unit (FPE Inc., Macedon, NY, USA). This continuous unit-of-flow UV system comprises an outer casing of stainless steel and three chambered inner quartz tubes connected in series. Each A. tequilana extract was pumped as a thin film between the outer steel housing and the inner quartz tubing by positive displacement; four-vane pumps enabled a variable flow rate. The UV light source for the irradiation of the passing fluid comprised eight germicidal low-pressure mercury lamps placed concentrically within the interior of the quartz and stainless steel cylinder with a gap of 0.08 cm. The UV unit operated at an irradiation peak of 254 nm, and had two UVX-25 light sensors (one at the top and one at the bottom of the cylinder; UVP, Inc., Upland, CA, USA). Prior to and following each treatment, the UV unit was cleaned and sanitized with 200 ppm hypochlorite solution and rinsed with water. The physicochemical properties (total sugars (TS), reducing sugars (RS), total polyphenols (TP), antioxidant activity (AA), total flavonoids (TF), and color (L*, a*, and b* parameters)) and the native microbiota (total aerobic mesophiles (TAM), total coliforms (TC), yeasts and molds (YM), and psychrophiles (PS)) of the processed (UV-C irradiated) and unprocessed (UP) samples were determined immediately.

2.6. Thermal Treatment (TT)

Thermal treatment (TT) was used as a control and was performed in duplicate using a continuous tubular UHT/HTST pasteurizer (MicroThermics, Raleigh, NC, USA), in which the agave extract batches were adjusted to various pH values (4.5, 5.5, and 6.5) and heated at 85 °C for 30 s [20]. The physicochemical properties and native microbial loads of the TT samples were determined immediately.

2.7. UV-C Irradiation Measurements

The intensity of the UV radiation incident on each Agave tequilana extract was determined according to the method described by Quintero-Ramos et al. [14]. This measurement was made at 254 nm with the two UVX-25 sensors (UVP, Inc.), which measured the energy emitted by the lamps every 50 ms. The average obtained intensity was multiplied by the sensor placement factor (supplied by the manufacturer) to obtain the real intensity. Exposure times were determined from the flow rate for each UV-C treatment. The UV-C dose is expressed in mJ/cm2 and was calculated as follows: UV dose = irradiation × exposure time.

2.8. Microbiological Analysis

The microbiological analysis of each treatment was carried out using the serial dilution pour plate method [21]. The agave extract samples were collected aseptically before and after the UV-C and thermal treatments and were analyzed immediately. Aliquots of appropriate dilutions of the inoculum (1 mL) were poured onto plates containing various media. For the determination of the TAM, the samples were poured onto PCA and the plates were incubated at 37 °C for 48 h. For the determination of the TC, the samples were poured onto VRBA and the plates were incubated at 37 °C for 18–24 h. For the determination of the YM, the samples were poured onto PDA and the plates were incubated at 30 °C for 5 days. For the determination of the PS, the samples were poured onto PCA, and the plates were incubated at 5 °C for 10 days. Each microbiological analysis was performed in triplicate. After incubation, the colony-forming units (CFU) were counted and the average of three counts was expressed as log (base 10) CFU/mL ± standard deviation; the detection limit of the analysis was 10 CFU/mL.
The differences in the log CFU/mL values between the Agave tequilana extracts that had received no treatment (UP) and those that had received the UV-C and TT treatments at the various pH values were calculated for each experiment as log reduction factors (LRF).

2.9. Analytical Methods

The total sugars (TS) content was determined according to the phenol–sulfuric acid method [22], and the reducing sugars (RS) content was determined according to the dinitrosalicylic acid method described by Miller [23], using d-fructose as a standard in both cases. The results are expressed as the mg of fructose/g of dry weight (d.w.) of the agave extracts.
The total polyphenols (TP) content was determined according to the Folin–Ciocalteu colorimetric method [24]. A mixture of 30 µL of the extract, 3 mL of deionized water, and 200 µL of Folin–Ciocalteu phenol reagent was prepared, and after maintaining the mixture at room temperature (25 °C) for 10 min, 600 µL of a 20% Na2CO3 solution was added. The mixture was incubated at 40 °C for 20 min and cooled on ice, and the developed color was measured at 760 nm. Gallic acid was used as the standard for the calibration curve, and the results are expressed as the mg of gallic acid equivalents per g of agave extract in dry weight (mg GAE/g d.w.).
The total flavonoids (TF) quantification was carried out according to the method described by Rizwan et al. [25], with some modifications. The extract (100 µL) was mixed with 2 mL of deionized water and 150 µL of NaNO2 (5%), and agitated in a vortex for 5 min. Then, 150 µL of AlCl3 (10%) was added, the mixture was vortexed for 1 min, 1 mL of 1 M NaOH was added, and the mixture was stirred again for 1 min. The measurements were made at 510 nm and compared to a standard curve derived from catechin, and the flavonoid content is expressed as the mg of catechin equivalents per g of agave extract in dry weight (mg CE/g d.w.).
The antioxidant activity (AA) was measured using the free radical 2,2-diphenyl-1-picrylhydrazyl (DPPH) method developed by Brand-Williams et al. [26]. The extract (100 µL) was reacted with 3.9 mL of DPPH solution (100 µM) in the dark for 3 h against a methanol blank. Subsequently, the absorbance was measured at 517 nm and the results are expressed as µmol of Trolox equivalents per g of agave extract in dry weight (µmol TE/g d.w.).
All the determinations were made using a Lambda 25 UV/VIS spectrophotometer (PerkinElmer, Waltham, MA, USA). All the parameters were measured in triplicate, and are reported as mean values with standard deviations.

2.10. Color Measurements

The color of the UP agave extract and of each of the UV-C- or TT-processed samples was determined using a Konica Minolta CR-400/410 colorimeter (Minolta Co., Osaka, Japan), which was calibrated with a white ceramic plate. The L* (lightness), a* (greenness–redness), and b* (blueness–yellowness) parameters were measured 10 times for each treatment. The total color difference (∆E) was calculated by ∆E = [(L0* − L*)2 + (a0* − a*)2 + (b0* − b*)2]1/2, where ∆E is the total color difference or the change between the unprocessed sample (the agave extract) and the processed samples (UV-C- and TT-processed), with their corresponding L0*, a0*, b0*, L*, a*, and b* values.

2.11. Experimental Design and Statistical Analysis

A statistical design consisting of 4 × 3 completely randomized factorial experiments was employed to determine the influences of UV-C dose (8.16, 10.93, 16.17, and 33.29 mJ/cm2) and pH (4.5, 5.5, and 6.5) on the Agave tequilana extracts. An unprocessed (UP) sample and a sample that had received thermal treatment (TT) at 85 °C for 30 s were used as controls. An analysis of variance (ANOVA) was carried out to assess the statistical significance of the data obtained from the various treatments. A contrast analysis between treatments was also performed. A confidence level of 95% (p < 0.05) was considered significant using Minitab version 16 statistical software (Minitab, 2010, State College, PA, USA).

3. Results and Discussion

3.1. Physicochemical Characterization of the Agave Extract

The agave extract had a pH of 5.45 and a soluble solid content of 2.2 °Bx. With regard to optical properties, it had an absorption coefficient of 0.483 ± 0.12 cm−1, a penetration depth of 2.07 ± 0.03 cm, and a turbidity of 37.82 ± 0.41 NTU, indicating a relatively low content of suspended solids. These optical properties qualify the agave extract for its various applications via UV-C continuous flow technology [17]. The TP content was 6.17 ± 0.4 mg GAE/g d.w., which agreed with the data reported by Ahumada-Santos et al. [8] for six different agave species, including Agave tequilana, and with the data reported by Santos-Zea et al. [27] for concentrated agave sap. The TF content was 0.89 ± 0.008 mg CE/g d.w.; this value is lower than the values reported by Hamissa et al. [28] and similar to those reported by Rizwan et al. [25] in Agave americana and Agave attenuate leaf extracts. With regard to the AA, the agave extract had a value of 6.89 ± 0.4 µmol TE/g d.w., which is lower than that reported by Puente-Garza et al. [29] in Agave salmiana plants, by [8] in various species of agave plants, and by Ahumada-Santos et al. [27] in concentrated agave sap. This variation in AA can be attributed to factors such as plant development, temperature, and age. In this type of plant, the synthesis of specific compounds such as phenols and saponins—which are associated with antioxidant activity—occurs as a defense mechanism during drought [10,29]. The total and reducing sugar contents in the agave extract were 619.8 ± 9.46 mg/g d.w. and 30.70 ± 0.37 mg/g d.w., respectively; these values agree with those reported by [8] and [6]. With regard to the color of the agave extract, the L*, a*, and b* parameters were 35.54 ± 0.132, 0.913 ± 0.012, and −1.196 ± 0.028, respectively.

3.2. Microbiological Inactivation

The native microbial loads of the agave extracts according to the adjusted pH values and the LRF values associated with the various treatments are shown in Table 1. Both treatments—UV-C irradiation and TT interaction with pH—noticeably reduced (p < 0.05) the native microbial load (TAM, TC, and YM) of the processed Agave tequilana extract. The UP and processed (UV-C- and TT-treated) samples did not show any signs of psychrophiles (PS) growth. At pH 4.5, the TAM, TC, and YM in the agave extracts were completely inactivated by irradiation at doses of 10.93 mJ/cm2, which resulted in LRF values of 2.64, 2.70, and 3.74, respectively. Furthermore, a complete inactivation of the TAM, TC, and YM was achieved at doses of 33.29 mJ/cm2 with the same efficacy as TT at any pH. Some reports have shown that the wall composition (peptidoglycan layer) of such microbial groups (which are gram (+) strains) and YM interferes with UV-C light absorption [30], limiting the efficacy of the UV-C treatment. The efficacy of the UV-C irradiation treatment of apple cider with regard to gram (+) and gram (−) bacteria was investigated by Geveke [31], who reported that Listeria innocua was less sensitive than Escherichia coli to UV-C treatment. Studies have shown that YM resistance to irradiation treatment is due to the morphological characteristics of the yeasts and molds (which are larger than bacteria and have comparatively thick cell walls) [13,32,33]; these characteristics induce light scattering, thereby limiting complete inactivation and the success of the UV-C strategy. Although, in the present study, a total reduction of YM was achieved at any pH and dose of irradiation, which could have been favored by the absorption coefficient, the agave extract exhibited low transmittance and °Bx values. A similar finding was reported by Rodríguez-Rodríguez et al. [34] in 10% Aloe vera gel blends irradiated at pH 4.5 and 5.5.

3.3. Physicochemical Properties

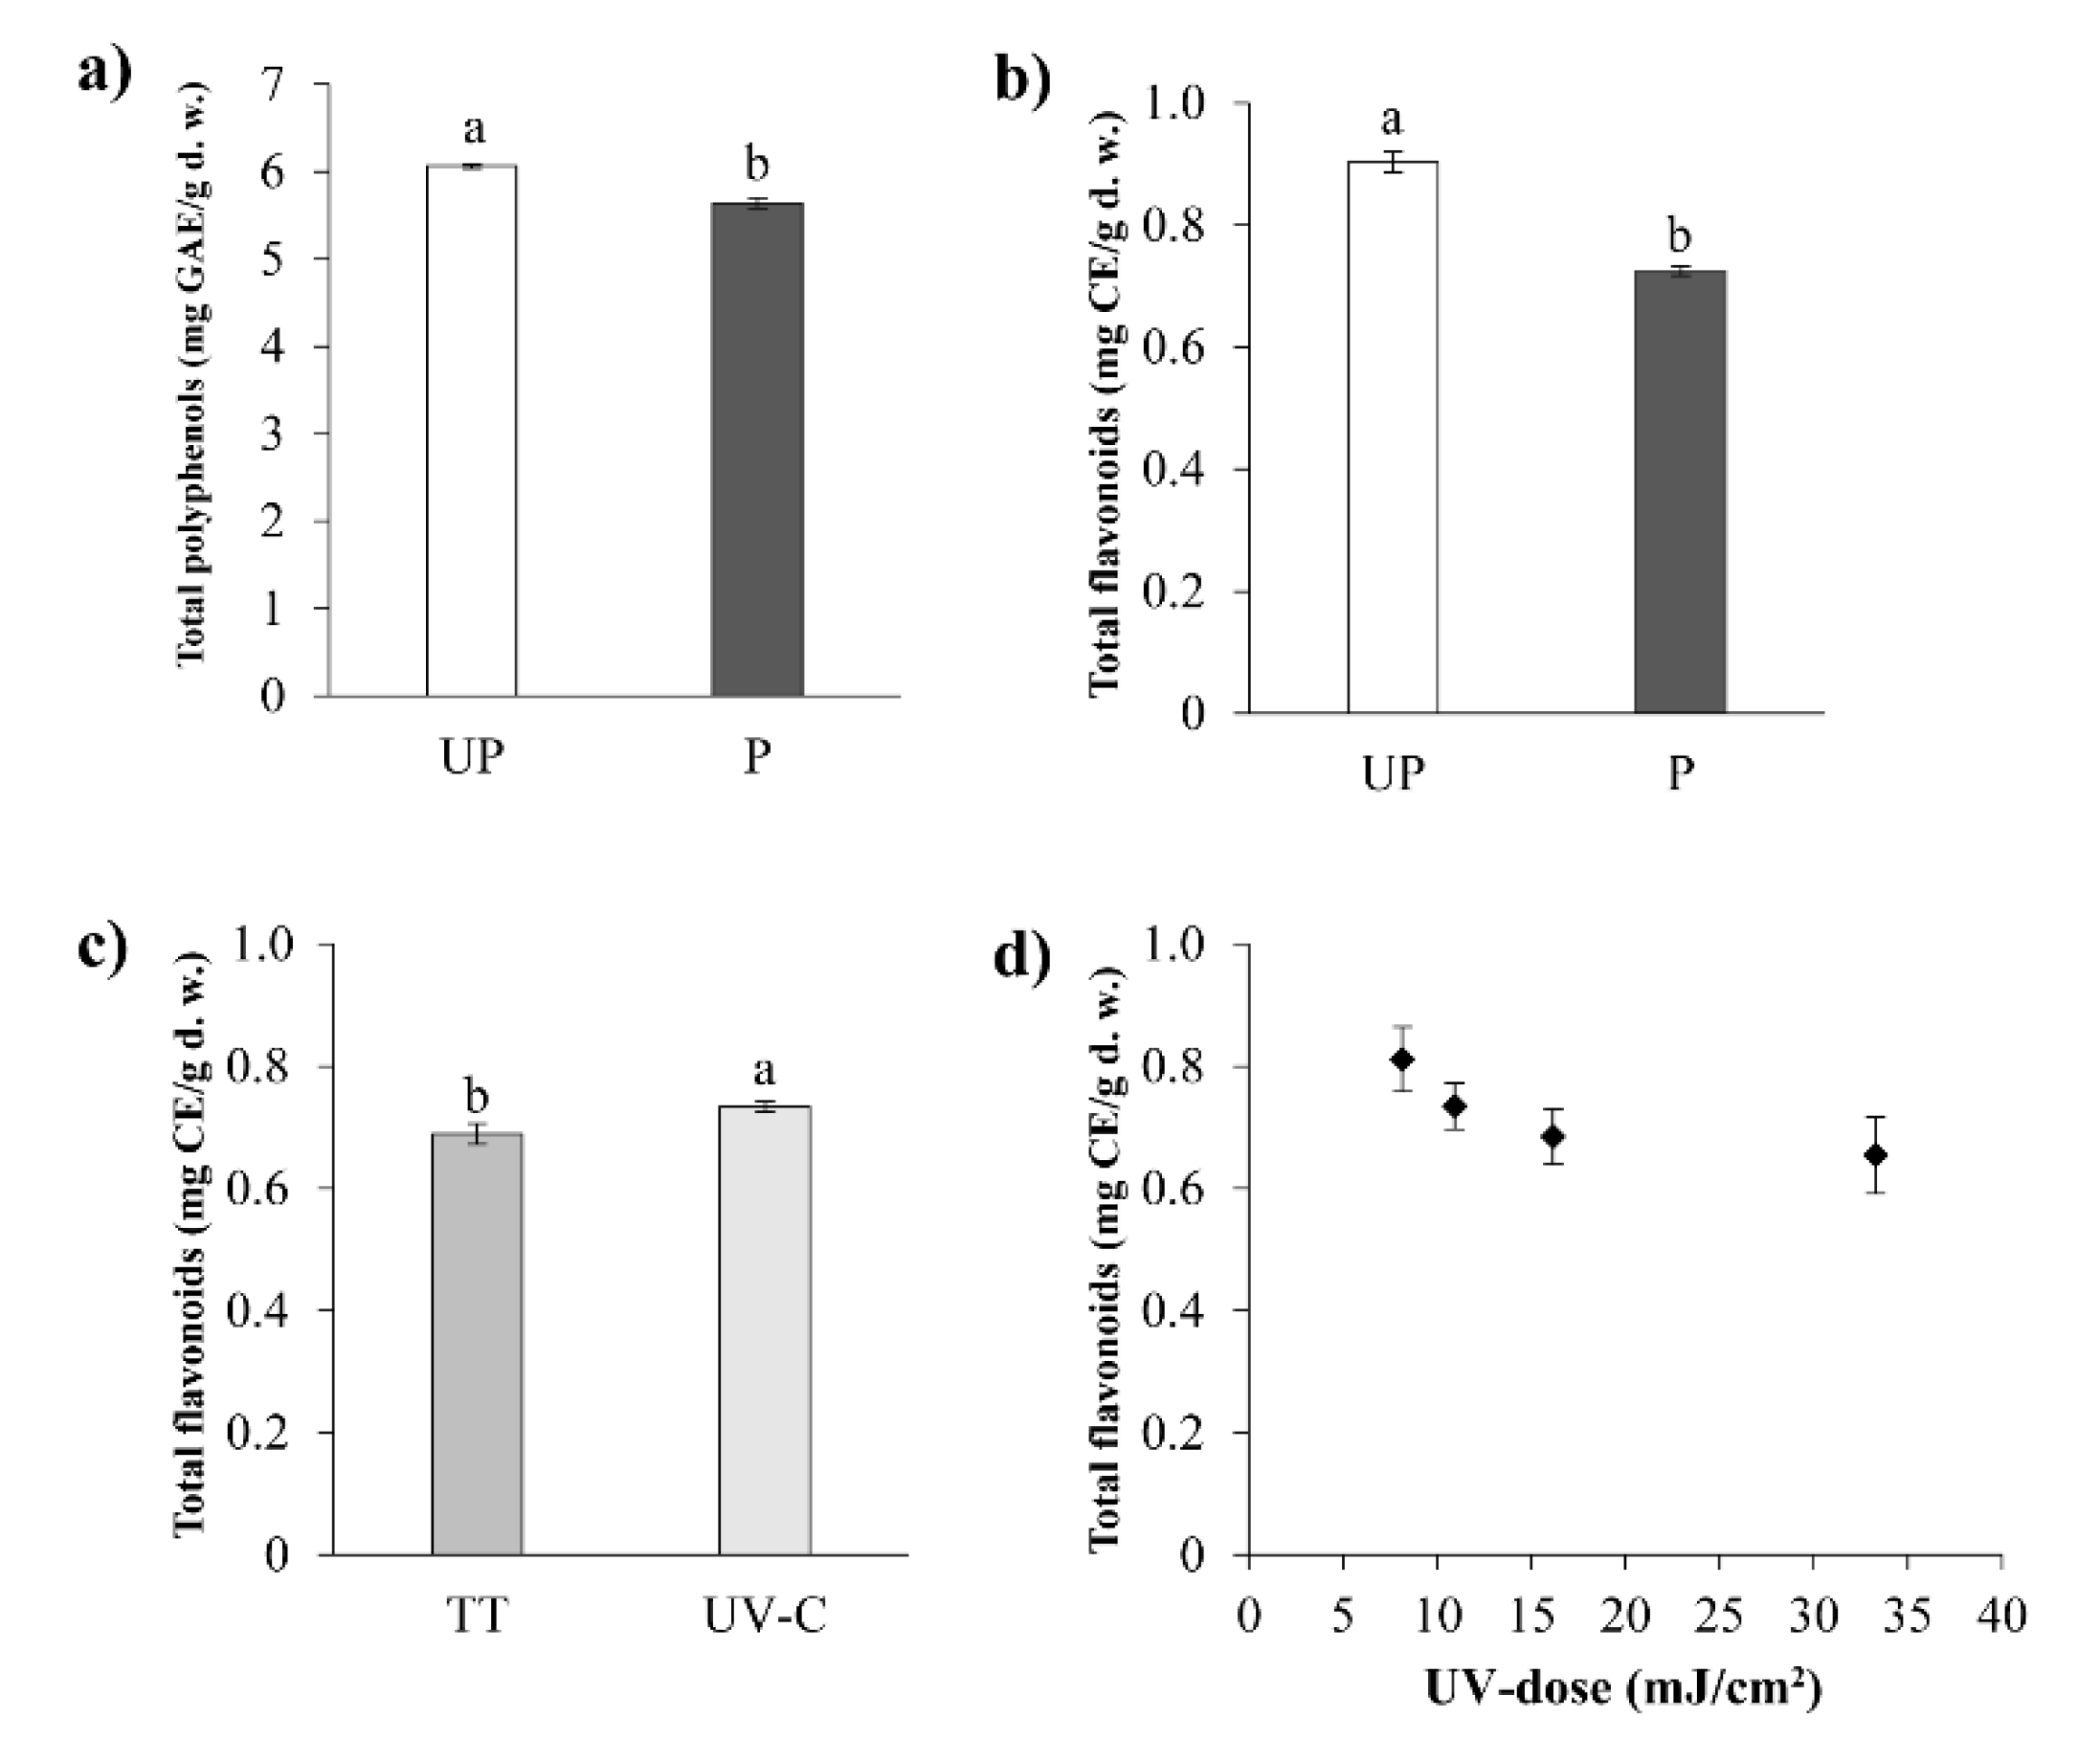
3.3.1. Total Polyphenols (TP)

The TP contents of the samples following the various treatments ranged from 5.44 to 6.17 mg GAE/g d.w., with variations for some treatments (Table 2).
The TP content of the Agave tequilana extracts was affected (p < 0.05) by processing, which reduced the content compared to nontreatment (Table 3; Figure 1a). The pH of the extracts caused only minor changes in the TP (Table 2). This was because stability is only compromised when polyphenols are exposed to high pH values (alkaline conditions), which cause their degradation [35,36]. Friedman and Jürgens [37] reported that, aside from the pH, the stability of phenolic compounds depends on their processing conditions and structures. The changes in TP were mainly due to TT at pH 4.5 (Table 2). This effect has been attributed to the chemical oxidation of phenolic compounds to quinones and their polymers [38], due to their exposure to high temperatures (85 °C for 30 s). Chang et al. [39] and Ding et al. [40] reported that polyphenol stability is reduced at temperatures >70 °C, which are the temperatures employed in thermal pasteurization. The irradiation treatment did not significantly affect the phenolic content of the agave extracts. This agreed with the results reported for pomegranate juice [41], apple juice [42], carrot–orange juice blended with yerba mate [43], and Aloe vera gel blended with water [34]. This has been related to the short exposure times applied, which can prevent the photooxidation of these compounds.

3.3.2. Total Flavonoids (TF)

The TF contents of the samples following the various treatments varied from 0.578 to 0.906 mg CE/g d.w. (Table 2). The pH significantly affected the TF content of the agave extracts (Table 3). Processing significantly (p < 0.05) reduced the TF content of the agave extracts relative to the TF content in the untreated samples (Table 3; Figure 1b). The TT reduced the TF content more than the UV-C treatment (p < 0.05) (Figure 1c). These results are consistent with those reported by Santhirasegaram et al. [44], who investigated thermal pasteurization versus UV-C treatment in mango juice. Igual et al. [45] reported flavonoid losses in grapefruit juice after thermal treatment. The degradation of flavonoids by thermal processing leads to the release of other products. Chaaban et al. [46] studied the sensitivity of certain flavonoids with regard to temperature, and reported that their degradation depends on their structural solidity; their sensitivity with regard to heat treatment dictates the formation of new products with various characteristics. Figure 1d shows the effect of the UV-C irradiation dose on the TF level. An increase in the UV-C dose caused an asymptotic and exponential decrease in the TF level at radiation doses >16.17 mJ/cm2 in the agave extracts. This trend could be due to the fact that phenolic and carboxylic groups absorb UV-C light [47], making them susceptible to high UV-C doses. Santhirasegaram et al. [44] reported similar findings with regard to TF in mango juice irradiated at high doses (related to increased exposure times).

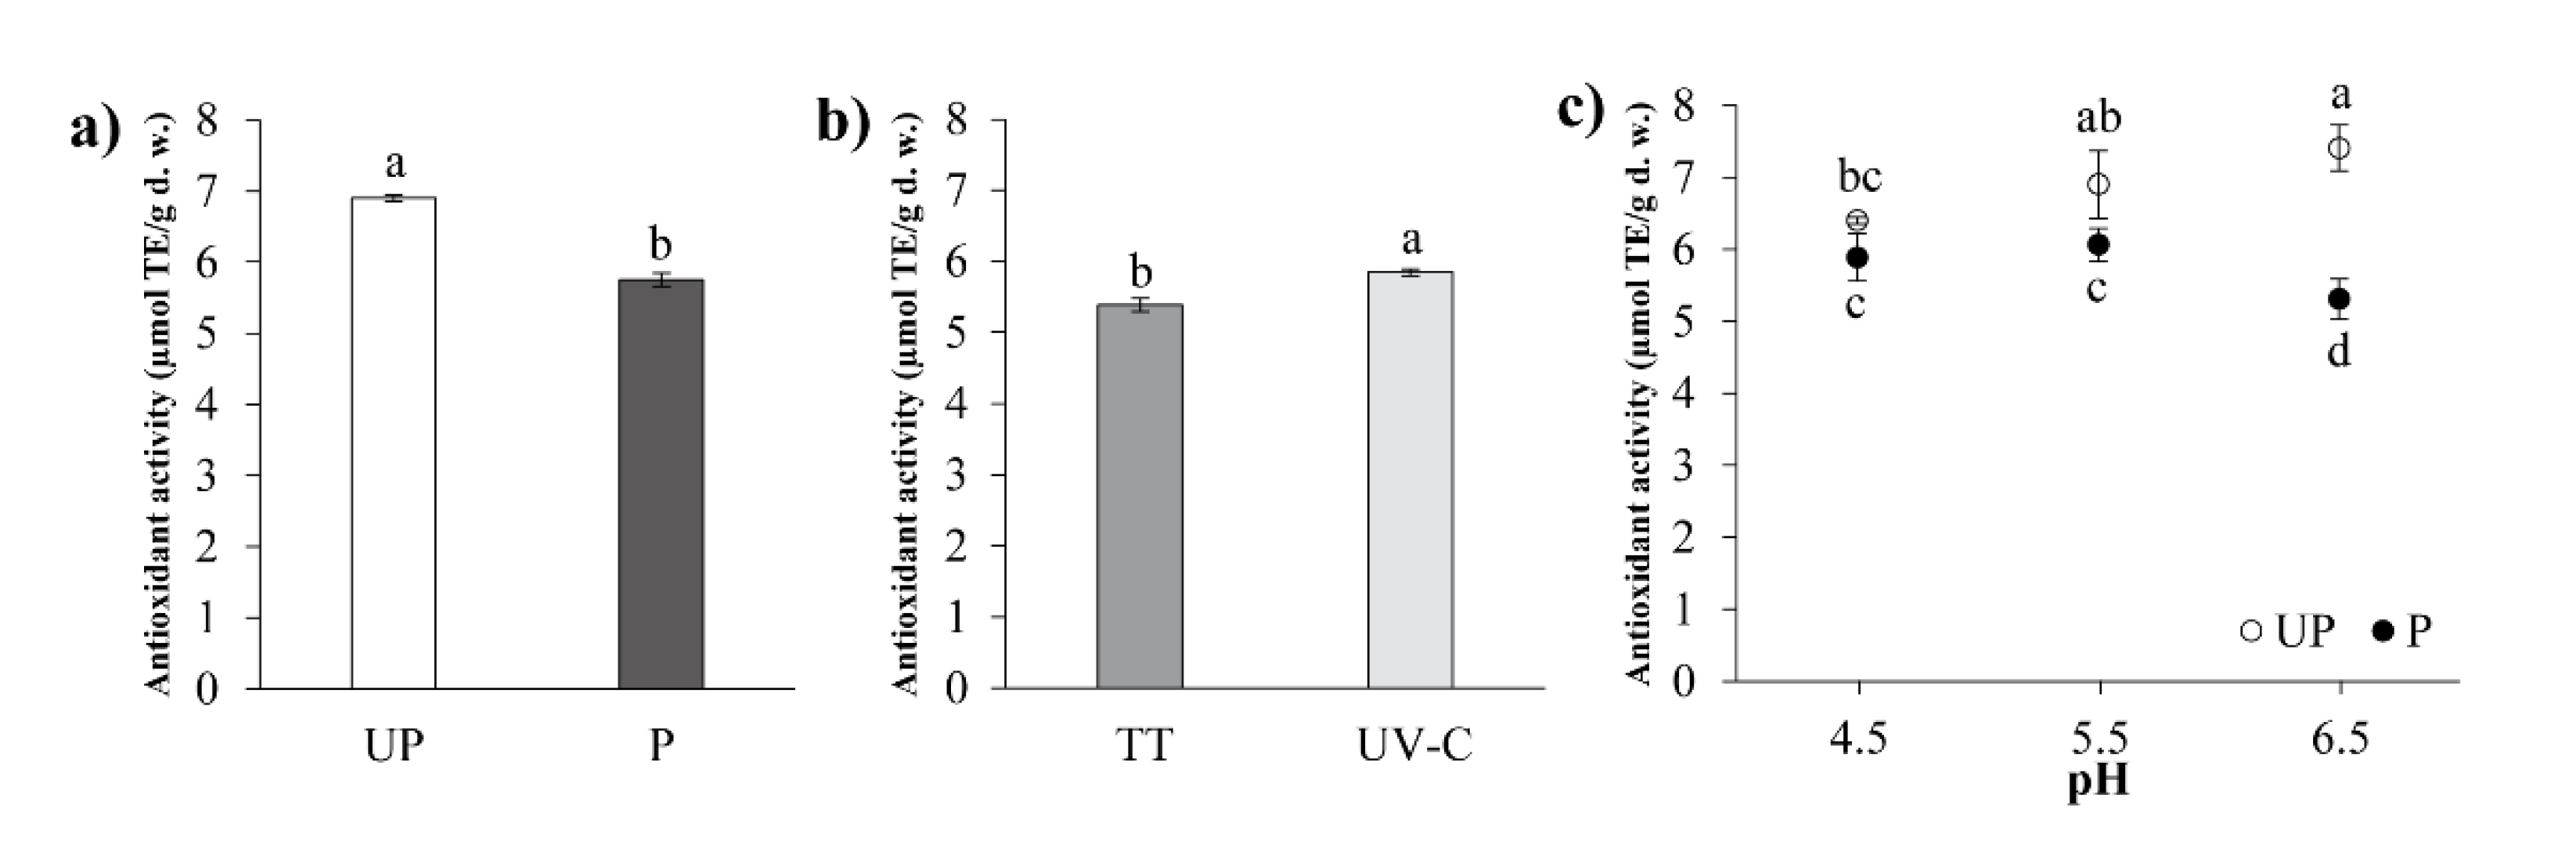
3.3.3. Antioxidant Activity (AA)

The AA values of the processed and unprocessed agave extracts are shown in Table 2. They range from 5.02 to 6.89 μmol TE/g d.w., and were due to the effect of pH and the type of treatment (TT versus UV-C). The processing and pH values, in their linear and interactions effects, significantly affected the AA of the extracts (Table 3). Figure 2a shows a significant decrease in AA due to processing compared to nontreatment; this was mostly attributable to thermal treatment, because TT caused a greater reduction (p < 0.05) in the AA than the UV-C treatment (Figure 2b). These results agree with those for TP and TF. The nontreated and treated agave extracts exhibited different behaviors according to the pH (Figure 2c). The AA increased linearly with the increasing pH in the nontreated samples (UP), whereas the treated samples (P) behaved in a quadratic manner with regard to AA, decreasing significantly at pH 6.5. A similar decrease in the AA was reported in Aloe vera–water blends [34] and apple juice [15] following UV-C irradiation. This has been attributed to a combination of ultraviolet light and oxygen, which produces free radicals by the reduction of antioxidant compounds, causing a decrease in AA [47]. TT decreased the AA by more than 22% compared to nontreatment, and by almost 8% compared to the UV-C treatment (Figure 2a,b). This AA decrease resulting from thermal treatment has been reported by Igual et al. [45] and Santhirasegaram et al. [44] in grapefruit and mango juice, respectively, owing to the degradation of antioxidant compounds. The low stability of these compounds when subjected to temperatures >70 °C is the main cause of this reduction [39,40].

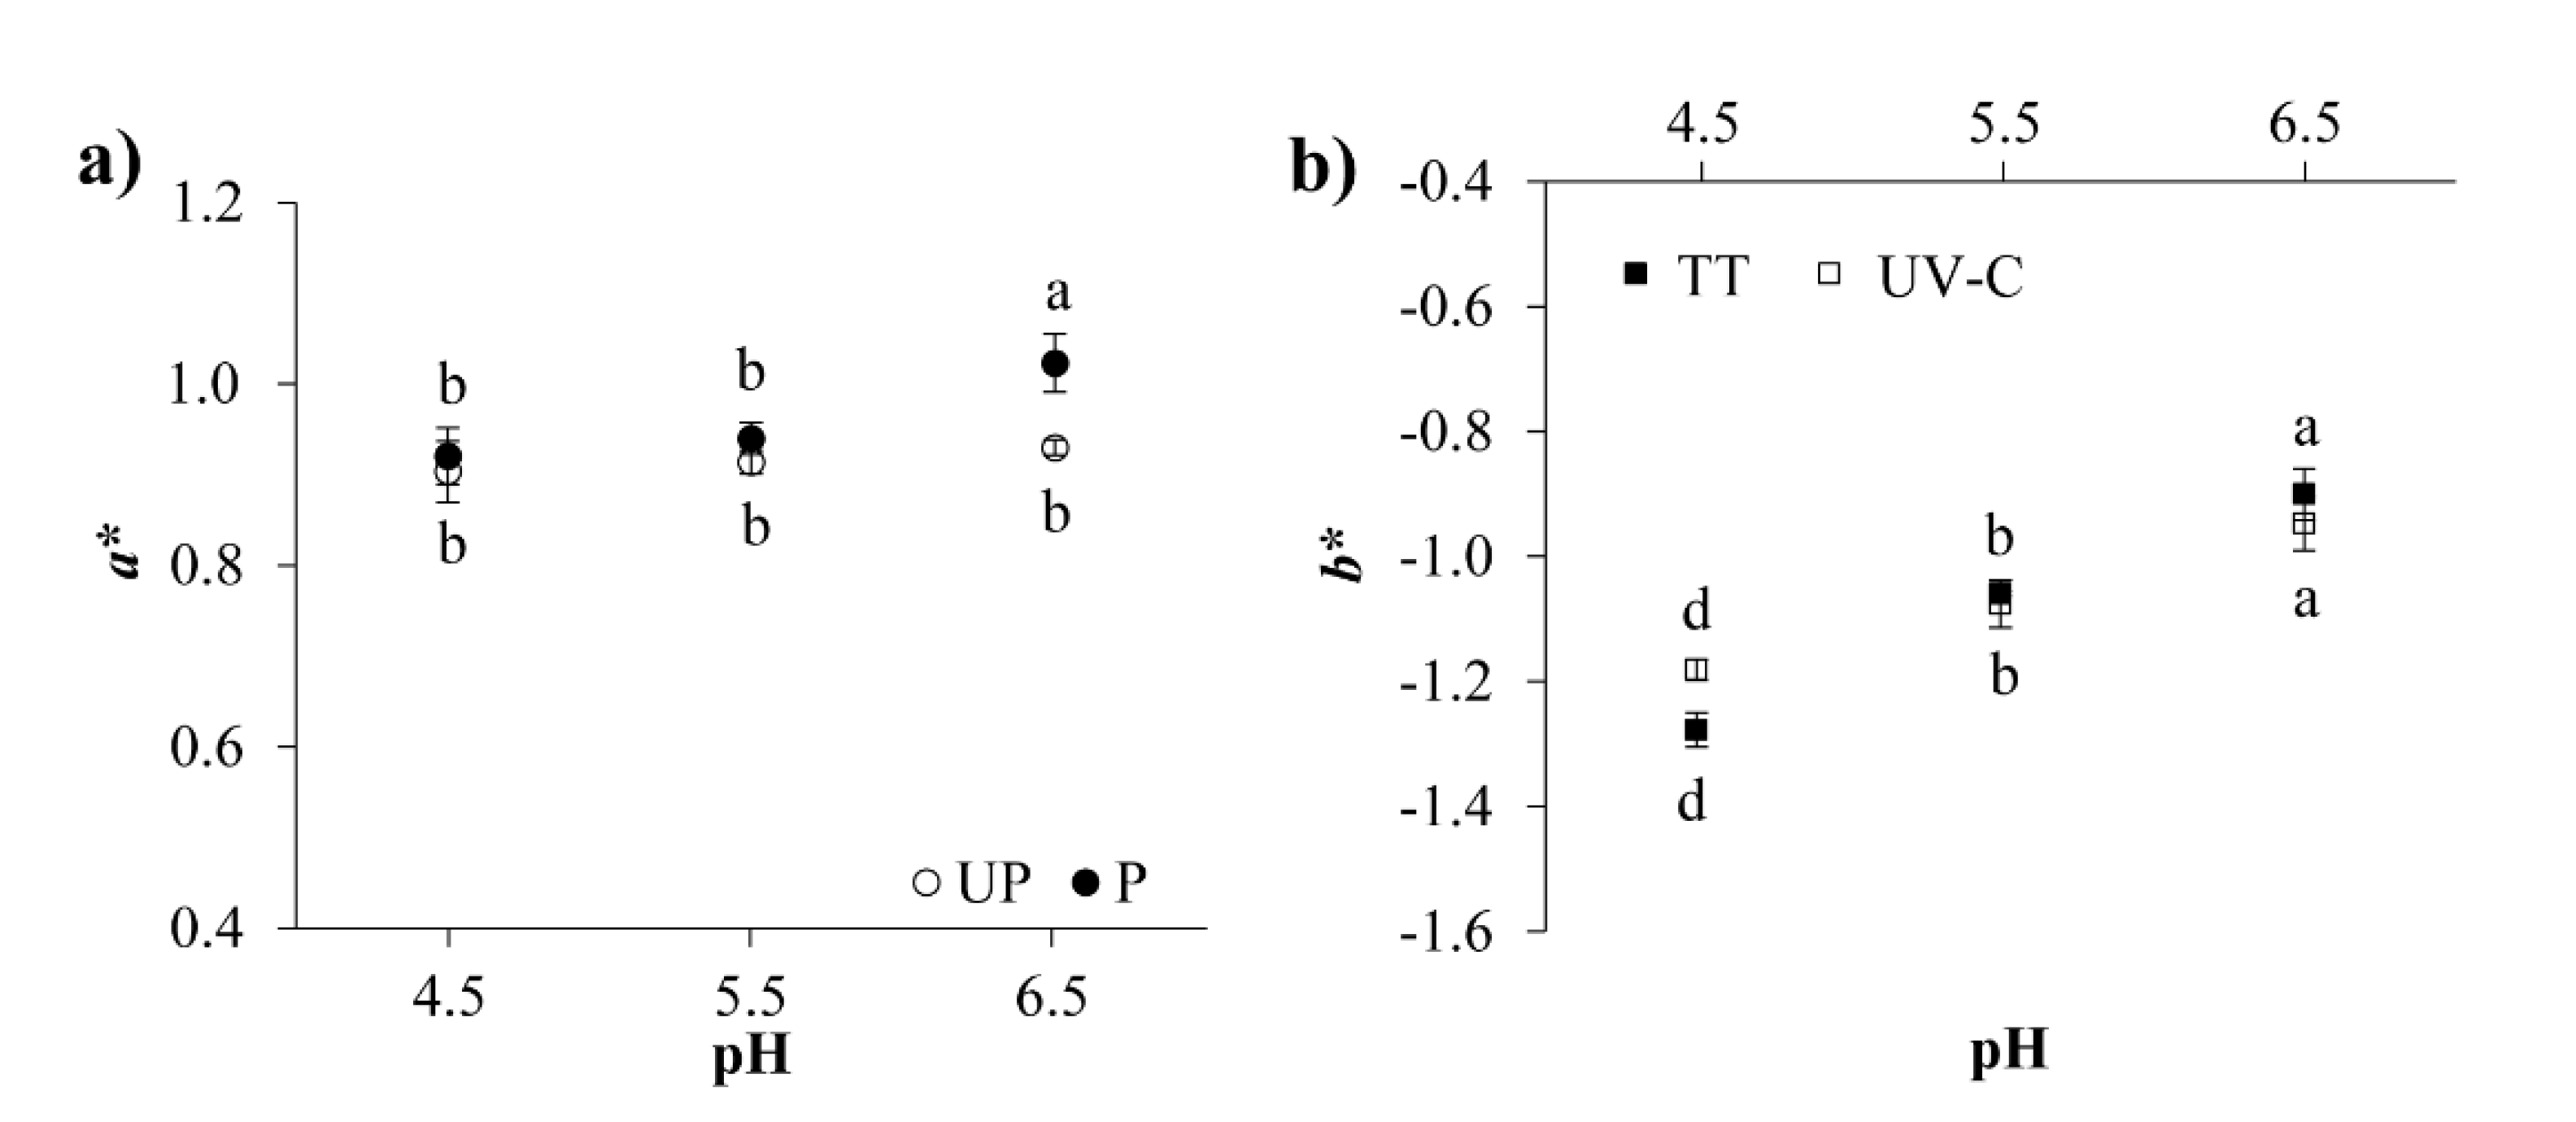
3.3.4. Color Analysis

The color results of the agave extracts in terms of the L*, a*, and b* parameters are shown in Table 4. According to contrast analysis, the L*, a*, and b* values of the agave extracts were significantly affected (p < 0.05) by processing, pH, and the interaction between pH and processing (Table 3). Processing significantly (p < 0.05) increased the a* values (greenness–redness; i.e., a tendency to reddish tones) at pH 6.5 compared to nontreatment (Figure 3a). The b* values (blueness–yellowness) of the agave extracts were also affected by the interaction between pH and the type of processing, and by the UV dose (Table 3). Figure 3b shows a slight increase in the b* values (shades to yellow) of the agave extract as the pH increased, with a similar tendency following both processes (TT and UV-C treatment). However, the b* values decreased as the UV dose increased (Table 4). This trend could be related to flavonoid degradation (Figure 1d), which would result in less yellow coloration. This behavior of the color parameters can be attributed to the solubility and stability of certain polyphenols and pigments contained within the agave extracts in relation to pH. Similar results were reported by Chethan and Malleshi [36] in finger millet (Eleusine coracana) extracts. Owing to the low ∆E values obtained, the color difference between the treated and untreated agave extracts was hardly noticeable (Table 4), because only ∆E values of 2.4 or higher are discernable [15]. These results indicate that the chemical changes that took place during processing did not affect the appearance of the agave extracts.

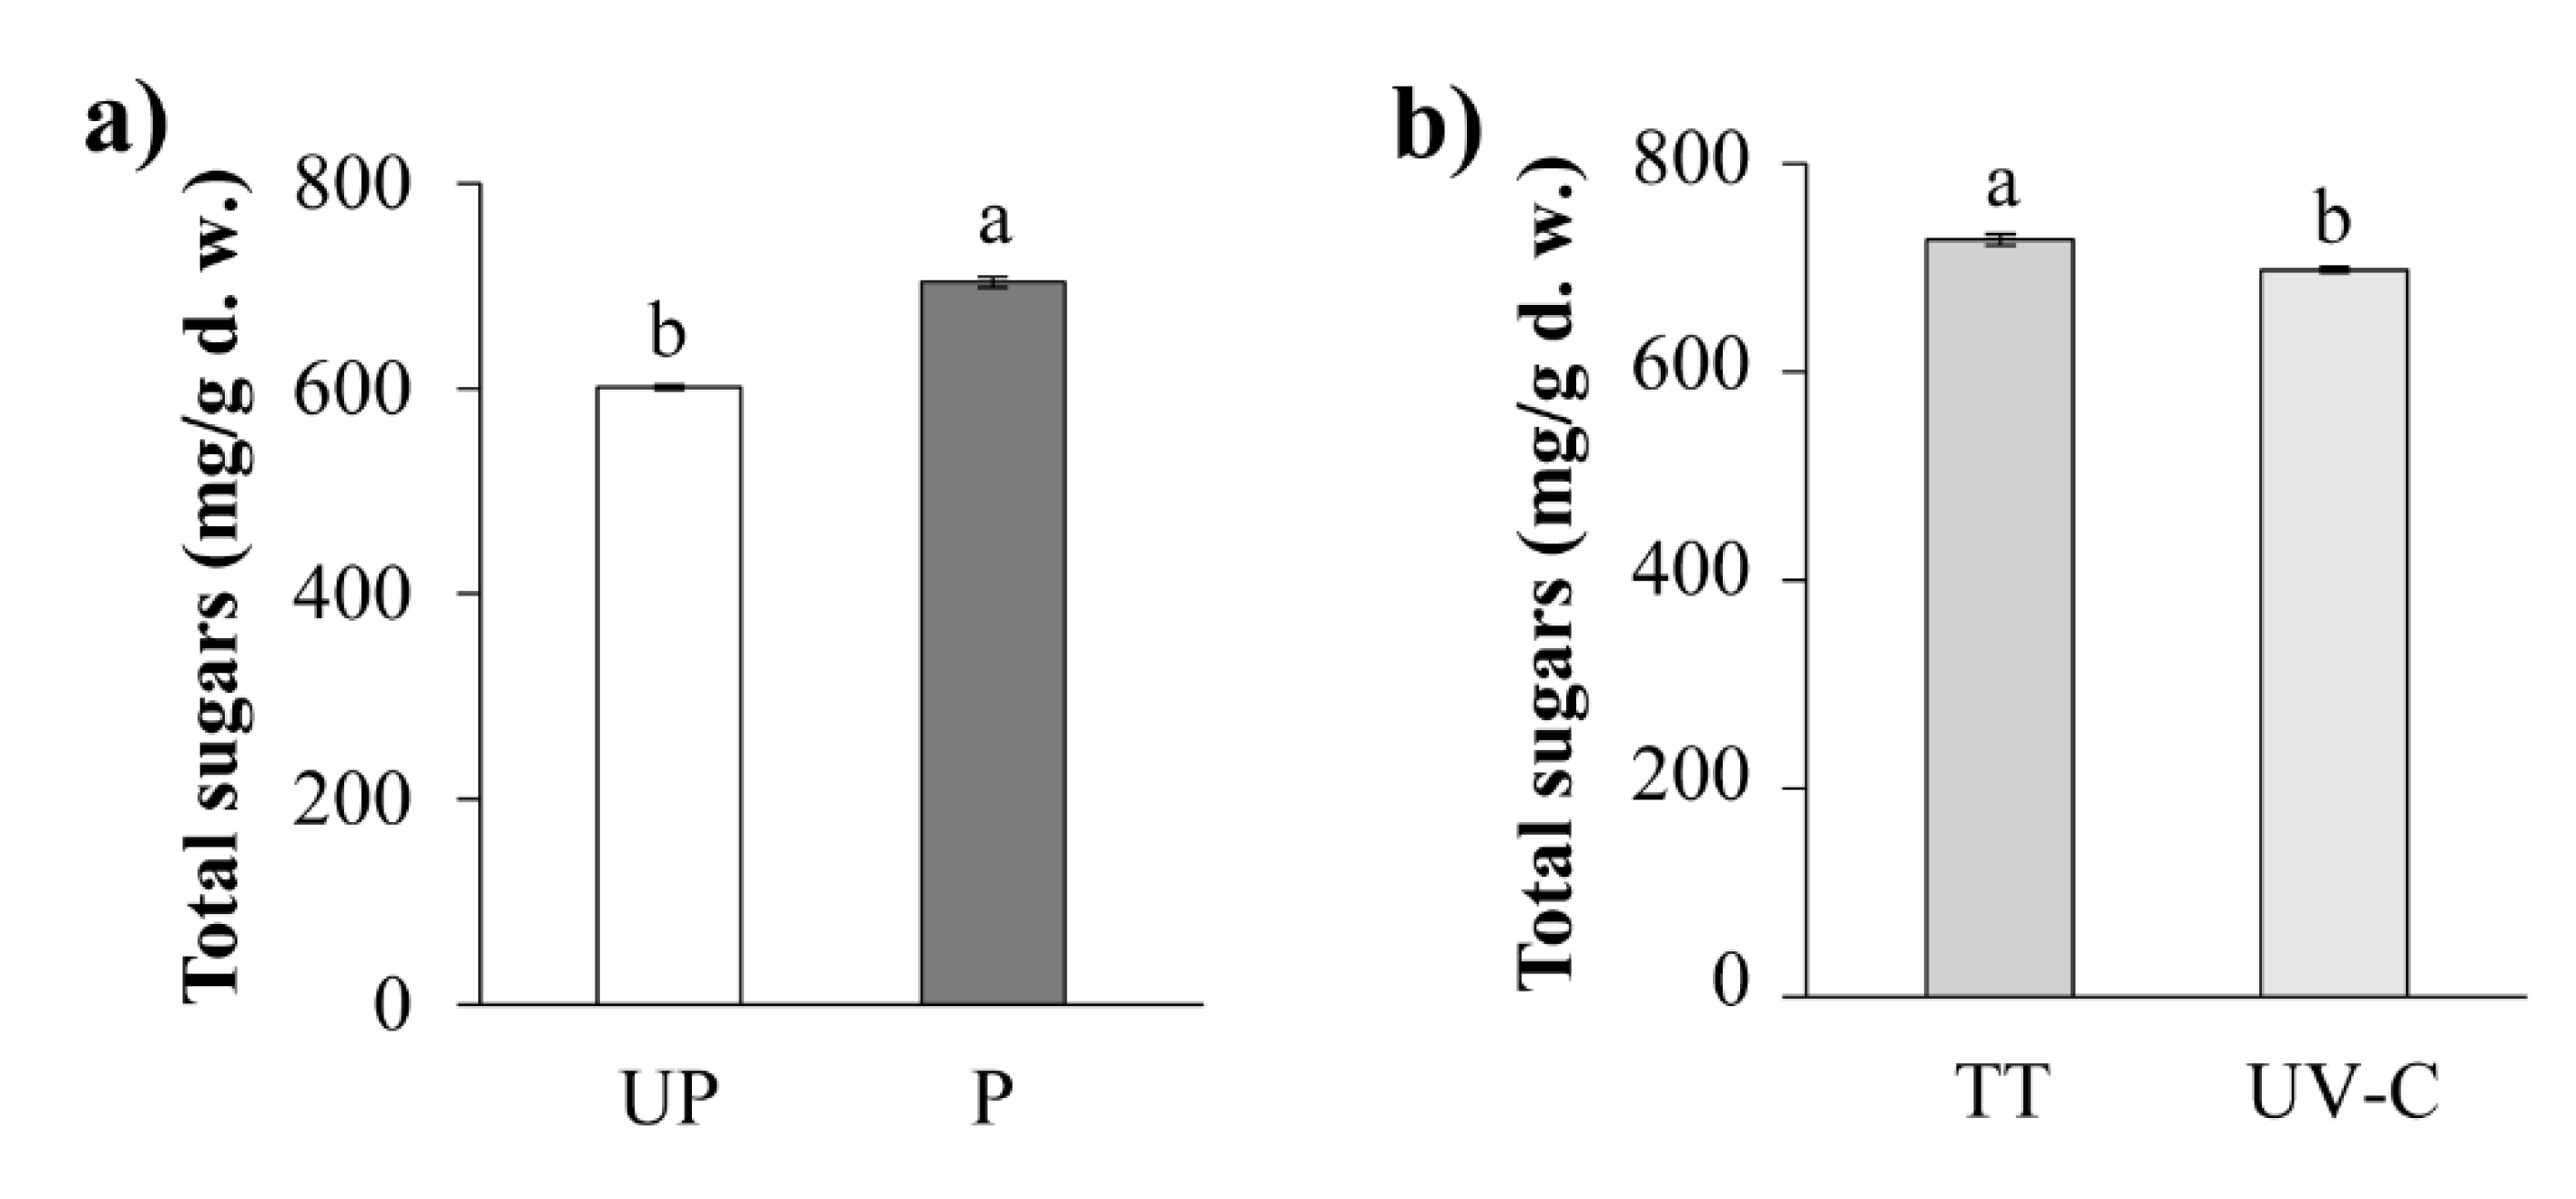
3.3.5. Total Sugars (TS)

Figure 4a shows that processing (TT and UV-C treatment) significantly increased (p < 0.05) the TS concentration of the agave extracts compared to nontreatment. The highest TS content was obtained following TT compared to the UV-C treatment (Figure 4b). The changes in TS can be attributed to the hydrolysis of fructan, which is the main polysaccharide in agave extracts, owing to thermal treatment [4]. Similar changes in the TS content have been reported by Rodríguez-Rodríguez et al. [34] in Aloe vera gel–water blends which contain acemannan (a complex polysaccharide).

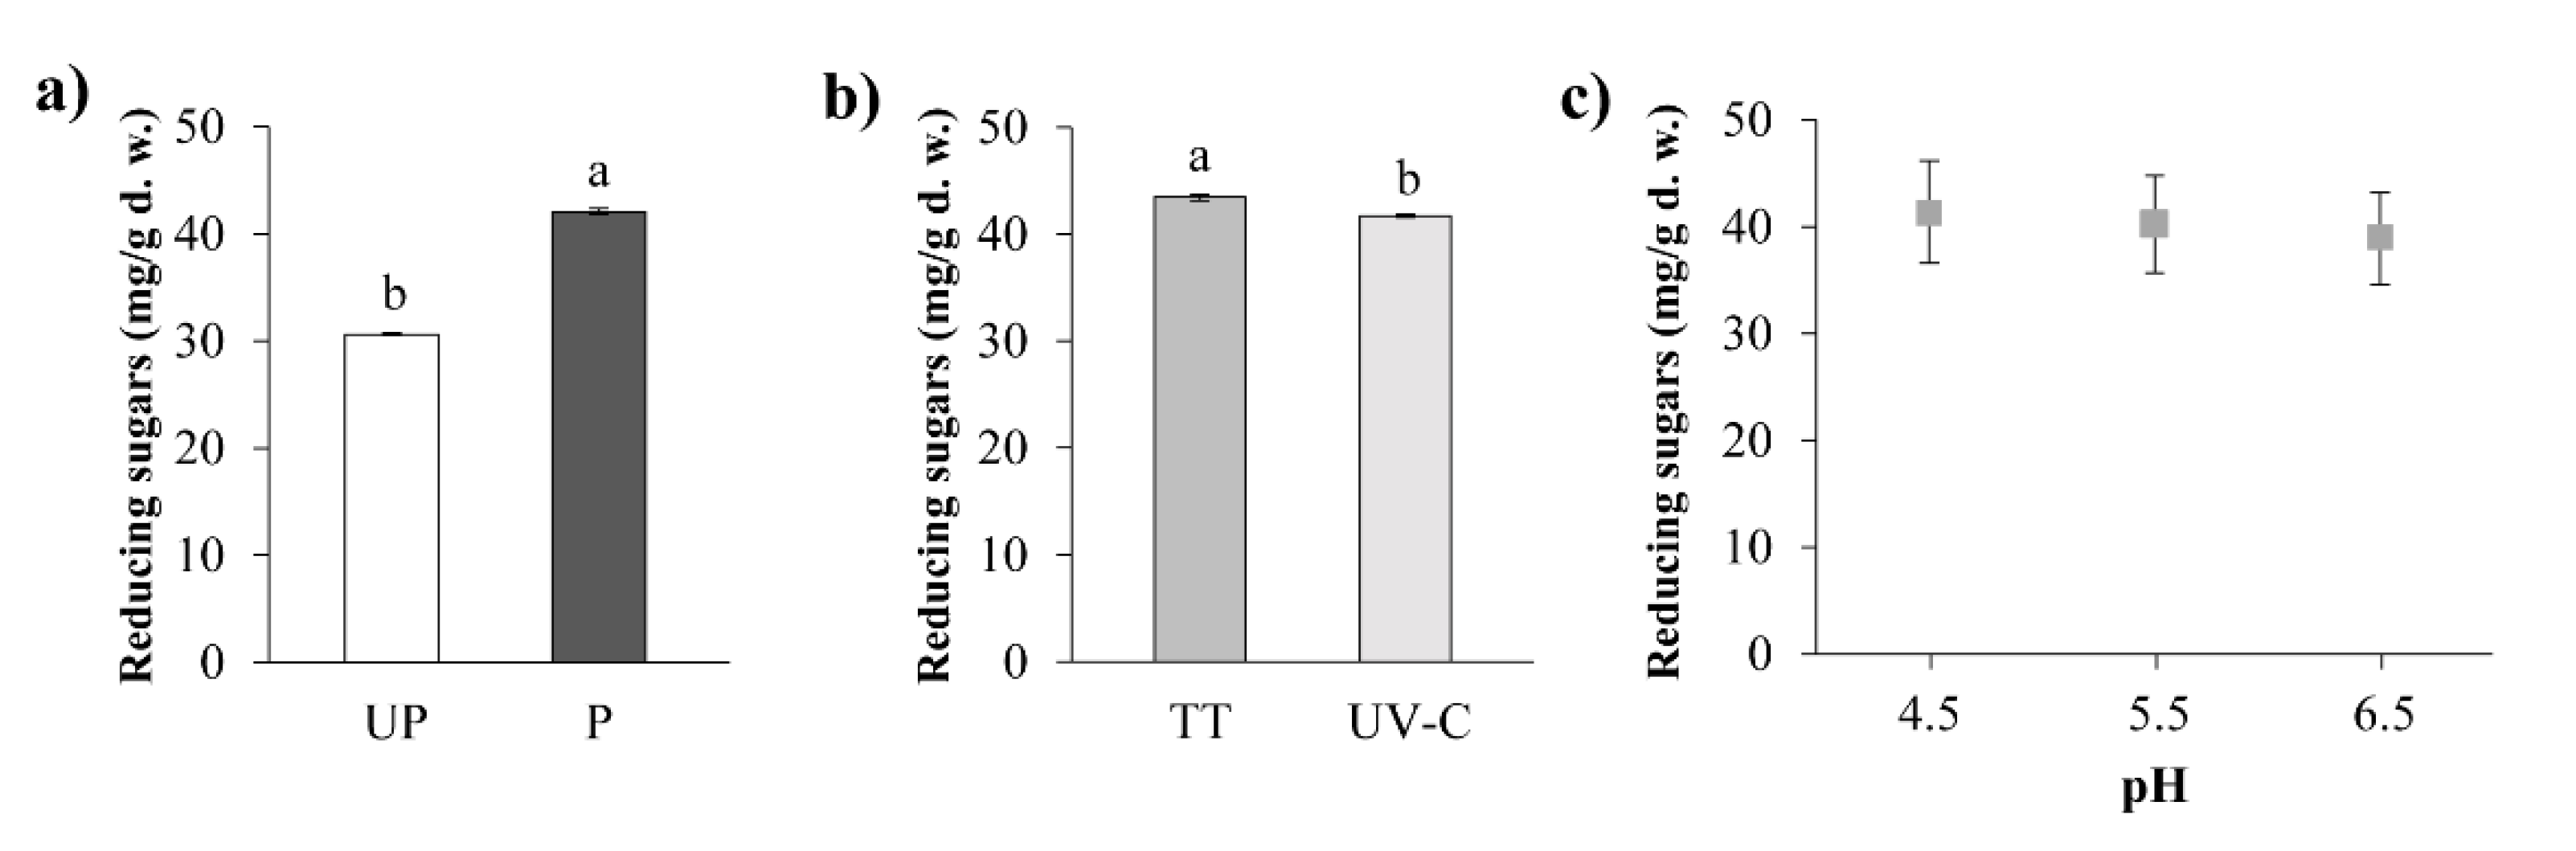
3.3.6. Reducing Sugars (RS)

The effects of the various treatments on the RS content of the agave extracts at the different pH values are shown in Table 3. Processing (P) caused an increase (p < 0.05) in the RS content of the agave extracts compared to nontreatment (Figure 5a). The heat-treated agave extracts had the highest RS contents compared to the UV-C-treated extracts (Figure 5b). Furthermore, the pH of the agave extract affected its RS content. The highest concentration of RS occurred at a low pH (4.5), and there was a slight decrease in the RS content as the pH increased (Figure 5c). This may be related to fructan hydrolysis at low pH, which causes the breakdown of this complex carbohydrate, releasing short-chain oligosaccharides and reducing sugars [48]. Muñiz-Márquez et al. [4] reported that the fructan contained in agave at these pH values becomes more susceptible to thermal degradation, resulting in an increase in the RS content. In the present study, the greatest increase in the RS content occurred following processing at low pH values, such as during heat treatment at pH ≤ 5.5. With regard to UV-C treatment, the irradiation dose did not have a significant effect on the RS content. However, UV-C treatment did cause a slight increase in the RS content (1.36 times more than nontreatment) (Figure 5b). Samples exposed to high irradiation doses (33.29 mJ/cm2) could experience changes to the fructan content of the agave and the release of simple sugars. Islam et al. [42] showed that apple juice irradiated at doses >40 mJ/cm2 exhibited the signs of structural changes to sugars—i.e., the release of simple sugars.

4. Conclusions

The present study revealed that the effective treatment of agave extracts by UV-C is influenced by the pH of the extract. The complete inactivation of the natural microbiota (TAM, TC, and YM) was achieved at a pH of 4.5 and an irradiation dose of 10.93 mJ/cm2, or a dose of 33.29 mJ/cm2 at any pH, with the same efficacy as TT. Processing (TT or UV-C treatment) affected all the physicochemical properties—i.e., TP, TF, AA, sugar content, and color compared to nontreatment. UV-C treatment did not affect most of the physicochemical properties except for the TF content, which decreased at doses greater than 16.17 mJ/cm2. The irradiation of the agave extract caused minimal modifications compared to nontreatment and produced better results than TT. The results suggest that UV-C continuous flow technology is suitable for the safe stabilization of Agave tequilana extracts at doses of 10.93 mJ/cm2 and pH 4.5, and preserves the functional properties of the extracts.

Author Contributions

Formal analysis, A.Z.S.-J.; conceptualization and writing—original draft, A.Q.-R.; formal analysis and data curation, M.Á.S.-M.; supervision in pilot plant experiments, R.T.-A.; Support data interpretation, C.O.M.-P. and G.M.-Z.; writing—review and editing, A.Q.-R., C.O.M.-P., M.d.C.V.-C., M.d.R.O.-H., G.M.-Z., and M.Á.S.-M. All the authors have read and agreed to the published version of the manuscript. All authors have read and agreed to the published version of the manuscript.

Funding

This research was funded by (Consejo Nacional de Ciencia y Tecnología and Secretaría de Educación Pública, México) grant number (no: 182169) and the APC was funded by PRODEP-DEGESU, SECRETARÍA DE EDUCACIÓN PÚBLICA, México.

Acknowledgments

The authors acknowledge the Universidad Autónoma de Chihuahua for supporting this research. The paper is based on Aracely Zulema Santana Jiménez’s MSc thesis on Food Science and Technology, and was supported by a scholarship from the Consejo Nacional de Ciencia y Tecnología (CONACYT), Mexico.

Conflicts of Interest

The authors have no conflict of interest to declared for the present article.

Abbreviations

The following abbreviations are used in this manuscript:
UV-CUltraviolet light of short wavelengths
TTThermal treatment
DUV-C Irradiation Dose
UPUnprocessed
PProcessed
LRFLog reduction factor
TAMTotal aerobic mesophiles
TCTotal coliforms
YMYeasts and molds
PSPsycrophiles
CFUColony forming units
TPTotal polyphenols
TSTotal sugars
TFTotal flavonoids
AAAntioxidant activity
L*Lightness parameter
a*a* color parameter
b*b* color parameter
∆ETotal color difference
mJ/cm2Millijoules per square centimeter

References

  1. López, M.G.; Urías-Silvas, J.E. Agave fructans as prebiotics. In Recent Advances in Fructooligosacharides Research; Shiomi, N., Benkeblia, N., Onodera, S., Eds.; Research Signpoint: Kerala, India, 2007; pp. 297–310. [Google Scholar]
  2. Waleckx, E.; Gschaedler, A.; Colonna-Ceccaldi, B.; Monsan, P. Hydrolysis of fructans from Agave tequilana Weber var. azul during the cooking step in a traditional tequila elaboration process. Food Chem. 2008, 108, 40–48. [Google Scholar] [CrossRef]
  3. Mellado-Mojica, E.; López, M.G. Identification, classification, and discrimination of agave syrups from natural sweeteners by infrared spectroscopy and HPAEC-PAD. Food Chem. 2015, 167, 349–357. [Google Scholar] [CrossRef] [PubMed] [Green Version]
  4. Muñiz-Márquez, D.B.; Contreras, J.C.; Rodríguez, R.; Mussatto, S.I.; Wong-Paz, J.E.; Teixeira, J.A.; Aguilar, C.N. Influence of thermal effect on sugars composition of Mexican Agave syrup. CyTA-J. Food. 2015, 13, 607–612. [Google Scholar] [CrossRef]
  5. Santos-Zea, L.; Leal-Díaz, M.A.; Cortés-Ceballos, E.; Gutiérrez-Uribe, J.A. Agave (Agave spp.) and its traditional products as a source of bioactive compounds. Curr. Bioact. Compd. 2012, 8, 218–231. [Google Scholar] [CrossRef]
  6. Arrizon, J.; Morel, S.; Gschaedler, A.; Monsan, P. Comparison of the water-soluble carbohydrate composition and fructan structures of Agave tequilana plants of different ages. Food Chem. 2010, 122, 123–130. [Google Scholar] [CrossRef]
  7. Ade-Ajayi, A.F.; Hammuel, C.; Ezeayanaso, C.; Ogabiela, E.E.; Udiba, U.U.; Anyim, B.; Olabanji, O. Preliminary phytochemical and antimicrobial screening of Agave sisalana Perrine juice (waste). J. Environ. Chem. Ecotoxicol. 2011, 3, 180–183. [Google Scholar]
  8. Ahumada-Santos, Y.P.; Montes-Avila, J.; Uribe-Beltrán, M.J.; Díaz-Camacho, S.P.; López-Angulo, G.; Vega-Aviña, R.; López-Valenzuela, J.Á.; Heredia, J.B.; Delgado-Vargas, F. Chemical characterization, antioxidant and antibacterial activities of six Agave species from Sinaloa, Mexico. Ind. Crop. Prod. 2013, 49, 143–149. [Google Scholar] [CrossRef]
  9. Almaraz-Abarca, N.; Delgado-Alvarado, E.A.; Ávila-Reyes, J.A.; Uribe-Soto, J.N.; González-Valdez, L.S. The phenols of the genus Agave (Agavaceae). J. Biomater. Nanobiotechnol. 2013, 4, 9–16. [Google Scholar] [CrossRef] [Green Version]
  10. Olvera-García, V.; Cardador-Martínez, A.; del Campo, S.T.M. Effect of thermal process and filtration on the antioxidant activity and physicochemical parameters of Agave atrovirens extracts. J. Food Res. 2015, 4, 155–167. [Google Scholar] [CrossRef] [Green Version]
  11. Oteiza, J.M.; Giannuzzi, L.; Zaritzkym, N. Ultraviolet treatment of orange juice to inactivate E. coli O157:H7 as affected by native microflora. Food Bioprocess Technol. 2010, 3, 603–614. [Google Scholar] [CrossRef]
  12. Koutchma, T. Advances in ultraviolet light technology for non-thermal processing of liquid foods. Food Bioprocess Technol. 2009, 2, 138–155. [Google Scholar] [CrossRef]
  13. Usaga, J.; Padilla-Zakour, O.I.; Worobo, R.W. UV tolerance of spoilage microorganisms and acid-shocked and acid-adapted Escherichia coli in apple juice treated with a commercial UV juice-processing unit. J. Food Prot. 2016, 79, 294–298. [Google Scholar] [CrossRef]
  14. Quintero-Ramos, A.; Churey, J.J.; Hartman, P.; Barnard, J.; Worobo, R.W. Modeling of Escherichia coli inactivation by UV irradiation at different pH values in apple cider. J. Food Prot. 2004, 67, 1153–1156. [Google Scholar] [CrossRef]
  15. Caminiti, I.M.; Palgan, I.; Muñoz, A.; Noci, F.; Whyte, P.; Morgan, D.J.; Cronin, D.A.; Lyng, J.G. The effect of ultraviolet light on microbial inactivation and quality attributes of apple juice. Food Bioprocess Technol. 2012, 5, 680–686. [Google Scholar] [CrossRef]
  16. Hanes, D.E.; Worobo, R.W.; Orlandi, P.A.; Burr, D.H.; Miliotis, M.D.; Robl, M.G.; Bier, J.W.; Arrowood, M.J.; Churey, J.J.; Jackson, G.J. Inactivation of Cryptosporidium parvum oocysts in fresh apple cider by UV irradiation. Appl. Environ. Microbiol. 2002, 68, 4168–4172. [Google Scholar] [CrossRef] [PubMed] [Green Version]
  17. Gopisetty, V.V.S.; Patras, A.; Kilonzo-Nthengea, A.; Yannam, S.; Bansode, R.R.; Sasges, M.; Burns, S.M.; Vergne, M.J.; Pan, C.; Xiao, H. Impact of UV-C irradiation on the quality, safety, and cytotoxicity of cranberry-flavored water using a novel continuous flow UV system. LWT-Food Sci. Technol. 2018, 95, 230–239. [Google Scholar] [CrossRef]
  18. AOAC methods 932.12 and 981.12. In Official Methods of Analysis, 16th ed.; Association of Official Analytical Chemists: Washington, DC, USA, 1996.
  19. Koutchma, T.; Keller, S.; Chirtel, S.; Parisi, B. Ultraviolet disinfection of juice products in laminar and turbulent flow reactors. Innov. Food Sci. Emerg. Technol. 2004, 5, 179–189. [Google Scholar] [CrossRef]
  20. He, Q.; Changhong, L.; Kojo, E.; Tian, Z. Quality and safety assurance in the processing of Aloe vera gel juice. Food Control. 2005, 16, 95–104. [Google Scholar] [CrossRef]
  21. APHA methods. In Compendium of Methods for the Microbiological Examination of Foods; American Public Health Association: Washington, DC, USA, 1992.
  22. Dubois, M.; Gilles, K.A.; Hamilton, J.K.; Rebers, P.A.; Smith, F. Colorimetric method for determination of sugars and related substances. Anal. Chem. 1956, 28, 350–356. [Google Scholar] [CrossRef]
  23. Miller, G.L. Use of dinitrosalicylic acid reagent for determination of reducing sugar. Anal. Chem. 1959, 31, 420–428. [Google Scholar] [CrossRef]
  24. Singleton, V.L.; Orthofer, R.; Lamuela-Raventós, R.M. Analysis of total phenols and other oxidation substrates and antioxidants by means of Folin–Ciocalteu reagent. Methods Enzymol. 1999, 299, 152–178. [Google Scholar]
  25. Rizwan, K.; Zubair, M.; Rasool, N.; Riaz, M.; Zia-Ul-Haq, M.; De Feo, V. Phytochemical and biological studies of Agave attenuata. Int. J. Mol. Sci. 2012, 13, 6440–6451. [Google Scholar] [CrossRef] [PubMed]
  26. Brand-Williams, W.; Cuvelier, M.E.; Berset, C. Use of a free radical method to evaluate antioxidant activity. LWT-Food Sci. Technol. 1995, 28, 25–30. [Google Scholar] [CrossRef]
  27. Santos-Zea, L.; Leal-Díaz, A.M.; Jacobo-Velázquez, D.A.; Rodríguez-Rodríguez, J.; García-Lara, S.; Gutiérrez-Uribe, J.A. Characterization of concentrated agave saps and storage effects on browning, antioxidant capacity and amino acid content. J. Food Compost. Anal. 2016, 45, 113–120. [Google Scholar] [CrossRef]
  28. Hamissa, A.M.B.; Seffen, M.; Aliakbarian, B.; Casazza, A.A.; Perego, P.; Converti, A. Phenolics extraction from Agave americana (L.) leaves using high-temperature, high-pressure reactor. Food Bioprod. Process. 2012, 90, 17–21. [Google Scholar] [CrossRef]
  29. Puente-Garza, C.A.; Meza-Miranda, C.; Ochoa-Martínez, D.; García-Lara, S. Effect of in vitro drought stress on phenolic acids, flavonols, saponins, and antioxidant activity in Agave salmiana. Plant Physiol. Biochem. 2017, 115, 400–407. [Google Scholar] [CrossRef]
  30. Gautam, D.; Umagiliyage, A.L.; Dhital, R.; Joshi, P.; Watson, D.G.; Fisher, D.J.; Choudhary, R. Nonthermal pasteurization of tender coconut water using a continuous flow coiled UV reactor. LWT-Food Sci. Technol. 2017, 83, 127–131. [Google Scholar] [CrossRef]
  31. Geveke, D.J. UV inactivation of bacteria in apple cider. J. Food Prot. 2005, 68, 1739–1742. [Google Scholar] [CrossRef]
  32. Gouma, M.; Gayán, E.; Raso, J.; Condón, S.; Álvarez, I. Inactivation of spoilage yeasts in apple juice by UV-C light and in combination with mild heat. Innov. Food Sci. Emerg. Technol. 2015, 32, 146–155. [Google Scholar] [CrossRef]
  33. Riganakos, K.A.; Karabagias, I.K.; Gertzou, I.; Stahl, M. Comparison of UV-C and thermal treatments for the preservation of carrot juice. Innov. Food Sci. Emerg. Technol. 2017, 42, 165–172. [Google Scholar] [CrossRef]
  34. Rodríguez-Rodríguez, M.Z.; Quintero-Ramos, A.; Meléndez-Pizarro, C.O.; Meza-Velázquez, J.A.; Jiménez-Castro, J.A.; Sánchez-Madrigal, M.Á.; Ruiz-Gutiérrez, M.G.; Espinoza-Hicks, J.C. Microbial and physicochemical properties of UV-C processed Aloe vera gel blends at different pHs using a continuous flow UV system. Rev. Mex. Ing. Química 2020, 19, 175–188. [Google Scholar] [CrossRef] [Green Version]
  35. Klimczak, I.; Małecka, M.; Szlachta, M.; Gliszczyńska-Świgło, A. Effect of storage on the content of polyphenols, vitamin C and the antioxidant activity of orange juices. J. Food Compos. Anal. 2007, 20, 313–322. [Google Scholar] [CrossRef]
  36. Chethan, S.; Malleshi, N.G. Finger millet polyphenols: Optimization of extraction and the effect of pH on their stability. Food Chem. 2007, 105, 862–870. [Google Scholar] [CrossRef]
  37. Friedman, M.; Jürgens, H.S. Effect of pH on the stability of plant phenolic compounds. J. Agric. Food Chem. 2000, 48, 2101–2110. [Google Scholar] [CrossRef] [PubMed]
  38. Nayak, B.; Liu, R.H.; Tang, J. Effect of processing on phenolic antioxidants of fruits, vegetables, and grains—A review. Crit. Rev. Food Sci. Nutr. 2015, 55, 887–918. [Google Scholar] [CrossRef] [PubMed]
  39. Chang, X.L.; Wang, C.H.; Feng, Y.M.; Liu, Z.P. Effects of heat treatments on the stabilities of polysaccharides substances and barbaloin in gel juice from Aloe vera Miller. J. Food Eng. 2006, 75, 245–251. [Google Scholar] [CrossRef]
  40. Ding, W.J.; Wu, X.F.; Zhong, J.S.; Wan, J.Z. Effects of temperature, pH, and light on the stability of aloin A and characterisation of its major degradation products. Int. J. Food Sci. 2014, 49, 1773–1779. [Google Scholar] [CrossRef]
  41. Pala, C.U.; Toklucu, A.K. Effect of UV-C light on anthocyanin content and other quality parameters of pomegranate juice. J. Food Compos. Anal. 2011, 24, 790–795. [Google Scholar] [CrossRef]
  42. Islam, M.S.; Patras, A.; Pokharel, B.; Wu, Y.; Vergne, M.J.; Shade, L.; Xiao, H.; Sasges, M. UV-C irradiation as an alternative disinfection technique: Study of its effect on polyphenols and antioxidant activity of apple juice. Innov. Food Sci. Emerg. Technol. 2016, 34, 344–351. [Google Scholar] [CrossRef] [Green Version]
  43. Ferrario, M.; Schenk, M.; García-Carrillo, M.; Guerrero, S. Development and quality assessment of a turbid carrot-orange juice blend processed by UV-C light assisted by mild heat and addition of Yerba Mate (Ilex paraguariensis) extract. Food Chem. 2018, 269, 567–576. [Google Scholar] [CrossRef] [Green Version]
  44. Santhirasegaram, V.; Razali, Z.; George, D.S.; Somasundram, C. Comparison of UV-C treatment and thermal pasteurization on quality of Chokanan mango (Mangifera indica L.) juice. Food Bioprod. Process. 2015, 94, 313–321. [Google Scholar] [CrossRef]
  45. Igual, M.; García-Martínez, E.; Camacho, M.M.; Martínez-Navarrete, N. Changes in flavonoid content of grapefruit juice caused by thermal treatment and storage. Innov. Food Sci. Emerg. Technol. 2011, 12, 153–162. [Google Scholar] [CrossRef]
  46. Chaaban, H.; Ioannou, I.; Chebil, L.; Slimane, M.; Gérardin, C.; Paris, C.; Charbonnel, C.; Chekir, L.; Ghoul, M. Effect of heat processing on thermal stability and antioxidant activity of six flavonoids. J. Food Process. Preserv. 2017, 41, e13203. [Google Scholar] [CrossRef]
  47. Cvetkovic, D.; Markovic, D.; Cvetkovic, D.; Radovanovic, B. Effects of continuous UV-irradiation on the antioxidant activities of quercetin and rutin in solution in the presence of lecithin as the protective target. J. Serb. Chem. Soc. 2011, 76, 973–985. [Google Scholar] [CrossRef]
  48. L’homme, C.; Arbelot, M.; Puigserver, A.; Biagini, A. Kinetics of hydrolysis of fructooligosaccharides in mineral-buffered aqueous solutions: Influence of pH and temperature. J. Agric. Food Chem. 2003, 51, 224–228. [Google Scholar] [CrossRef]
Figure 1. Total polyphenols (TP) and total flavonoids (TF) contents of the Agave tequilana extracts. (a) Comparison of TP content in processed (P) and unprocessed (UP) extracts; (b) effects of processing on the TF content; (c) TF content following thermal treatment (TT) and UV-C treatment; (d) effects of pH and UV-C dose on the TF content. For each figure panel, the different letters indicate significant differences between the treatments at p < 0.05 by contrast testing.
Processes 08 00841 g001
Figure 2. Antioxidant activity (AA) of the Agave tequilana extracts. (a) Comparison of the AA in the processed (P) and unprocessed (UP) extracts; (b) comparison of thermal treatment (TT) and UV-C treatment; (c) effect of pH on the AA in the UP and P extracts. For each figure panel, the different letters indicate significant differences between treatment at p < 0.05 by contrast testing. The mean differences in (c) were obtained by applying the Tukey test at p < 0.05.
Processes 08 00841 g002
Figure 3. Effects of treatments on the color parameters in the Agave tequilana extracts. (a) Effect of pH on the a* parameter in the unprocessed (UP) and processed (P) extracts; (b) effect of pH on the b* parameter in the thermally treated (TT) and UV-C-treated extracts. For each figure panel, the different letters indicate significant differences between treatments at p < 0.05 according to the Tukey test.
Processes 08 00841 g003
Figure 4. Total sugar (TS) content of the Agave tequilana extracts. (a) Effect of processing (P) compared with unprocessed treatment (UP) on the TS content; (b) effect of thermal treatment (TT) and UV-C irradiation on the TS content. For each figure panel, the different letters indicate significant differences between treatments at p < 0.05 by contrast testing.
Processes 08 00841 g004
Figure 5. Reducing sugar (RS) content of the Agave tequilana extracts. (a) Effect of processing (P) compared with unprocessed treatment (UP) on the RS content; (b) RS content in the thermally treated (TT) and UV-C-treated extracts; (c) effects of pH on the RS content. For each figure panel, the different letters indicate significant differences between treatments at p < 0.05 by contrast testing. The mean differences in (c) were obtained according to the Tukey test at p < 0.05.
Processes 08 00841 g005
Table 1. Effects of processing at the different pHs on the native microbiota changes of Agave tequilana Weber var. azul extract.
TreatmentspHTAMTCYM
Log CFU/mL
UP4.52.64 ± 0.032.70 ± 0.053.74 ± 0.05
5.54.79 ± 0.024.34 ± 0.063.00 ± 0.01
6.55.38 ± 0.123.60 ± 0.022.70 ± 0.03
LRF
D14.51.61 ± 0.12 f2.70 ± 0.05 c3.74 ± 0.05 ª
D22.64 ± 0.03 e2.70 ± 0.05 c3.74 ± 0.05 ª
D32.64 ± 0.03 e2.70 ± 0.05 c3.74 ± 0.05 ª
D42.64 ± 0.03 e2.70 ± 0.05 c3.74 ± 0.05 ª
D15.53.59 ± 0.39 b3.44 ± 0.09 b3.00 ± 0.01 b
D23.52 ± 0.16 d4.34 ± 0.06 a3.00 ± 0.01 b
D33.67 ± 0.10 d4.34 ± 0.06 a3.00 ± 0.01 b
D44.79 ± 0.02 b4.34 ± 0.06 a3.00 ± 0.01 b
D16.54.37 ± 0.11 b,c2.16 ± 0.05 d2.70 ± 0.03 c
D24.31 ± 0.15 c3.60 ± 0.02 b2.70 ± 0.03 c
D35.38 ± 0.12 a3.60 ± 0.02 b2.70 ± 0.03 c
D45.38 ± 0.12 a3.60 ± 0.02 b2.70 ± 0.03 c
TT4.52.64 ± 0.03 c2.70 ± 0.05 c3.74 ± 0.05 ª
5.54.79 ± 0.02 b4.34 ± 0.06 a3.00 ± 0.01 b
6.55.38 ± 0.12 a3.60 ± 0.02 b2.70 ± 0.03 c
Means ± standard deviation (n = 6). LRF, log reduction factor. Values with different letters per column indicate significant differences (p < 0.05) between treatments using the Tukey test. UP, unprocessed treatment; TAM, total aerobic mesophiles; TC, total coliforms; YM, yeasts and molds; UV dose; D1, 8.16 mJ/cm2; D2, 10.93 mJ/cm2; D3, 16.17 mJ/cm2; D4, 33.29 mJ/cm2; TT, thermal treatment (85 °C; 30 s).
Table 2. Effects of processing at the different pHs on the chemical properties of Agave tequilana Weber var. azul extracts.
TreatmentspHTP
(mg GAE/g d.w.)
TF
(mg CE/g d.w.)
AA
(μmol TE/g d.w.)
UP4.55.87 ± 0.029 a,b,c0.906 ± 0.007 a6.40 ± 0.04 b,c
5.56.17 ± 0.409 a0.897 ± 0.008 a6.89 ± 0.47 a,b
6.56.15 ± 0.377 a,b0.906 ± 0.028 a7.40 ± 0.31 a
D14.55.72 ± 0.009 a,b,c0.826 ± 0.051 a,b,c6.11 ± 0.04 b,c,d,e
D25.61 ± 0.007 a,b,c0.726 ± 0.074 b,c,d,e6.06 ± 0.16 bc,d,e
D35.61 ± 0.017 a,b,c0.655 ± 0.020 d,e5.79 ± 0.29 c,d,e,f
D45.62 ± 0.055 a,b,c0.578 ± 0.011 e6.10 ± 0.08 b,c,d,e
D15.55.59 ± 0.072 a,b,c0.766 ± 0.055 a,b,c,d6.21 ± 0.25 b,c,d
D25.64 ± 0.044 a,b,c0.744 ± 0.034 b,c,d6.16 ± 0.09 b,c,d,e
D35.62 ± 0.165 a,b,c0.698 ± 0.063 b,c,d,e5.88 ± 0.07 c,d,e,f
D45.62 ± 0.139 a,b,c0.696 ± 0.042 b,c,d,e6.26 ± 0.14 b,c,d
D16.55.81 ± 0.006 a,b,c0.842 ± 0.042 a,,b5.35 ± 0.18 d,e,f
D25.72 ± 0.021 a,b,c0.733 ± 0.003 b,c,d5.55 ± 0.18 c,d,e,f
D35.70 ± 0.018 a,b,c0.701 ± 0.055 b,c,d,e5.35 ± 0.11 d,e,f
D45.67 ± 0.083 a,b,c0.688 ± 0.006 c,d,e5.26 ± 0.38 e,f
TT4.55.44 ± 0.001 c0.635 ± 0.003 d,e5.35 ± 0.11 d,e,f
5.55.58 ± 0.059 b,c0.662 ± 0.006 d,e5.78 ± 0.09 c,d,e,f
6.55.60 ± 0.010 a,b,c0.736 ± 0.007 b,c,d5.02 ± 0.42 f
Means ± standard deviation (n = 6). Values with different letters per column indicate significant differences (p < 0.05) between treatments using the Tukey test. UP, unprocessed treatment; UV dose; D1, 8.16 mJ/cm2; D2, 10.93 mJ/cm2; D3, 16.17 mJ/cm2; D4, 33.29 mJ/cm2; TT, thermal treatment (85 °C; 30 s); TP, total polyphenols; TF, total flavonoids; AA, antioxidant activity.
Table 3. Contrast analysis of the treatment effect on the physicochemical properties of Agave tequilana Weber var. azul extract at different pHs.
SourceDFSum of Square
TPTFAAL*a*b*TSRS
Model171.2076 *0.3129 *12.2699 *1.3714 *0.0865 *0.4601 *60936.76 *712.32 *
UP vs. P10.8962 *0.1812 *6.5956 *0.9127 *0.0102 *0.0799 *52536.01 *652.71 *
TT vs. UV-C10.07009.0 × 10−3 *1.0129 *1.7 × 10−40.0129 *5.7 × 10−43991.95 *13.95 *
pH10.1029 *0.0130 *0.5989 *0.0742 *0.0482 *0.2876 *538.5337.03 *
pH214.1 × 10−41.2 × 10−61.2044 *2.9 × 10−35.8 × 10−3 *6.4 × 10−5538.630.0805
pH × UP vs. P10.02602.6 × 10−32.0973 *0.1965 *4.8 × 10−3 *0.0576 *24.811.6546
pH2 × UP vs. P10.04641.2 × 10−40.2460 *0.01219.2 × 10−43.1 × 10−5616.411.1 × 10−3
pH × TT vs. UV-C15.6 × 10−32.4 × 10−30.07670.03157.8 × 10−50.0163 *77.670.2707
pH2 × TT vs. UV-C10.01741.0 × 10−30.02910.01784.7 × 10−41.8 × 10−3292.650.0119
D30.01810.0847 *0.23450.05307.7 × 10−40.0113 *1574.724.4460
pH × D60.02420.01850.17410.07032.2 × 10−34.7 × 10−3745.342.1390
Error180.38060.02490.98440.17345.8 × 10−30.01722918.358.6462
* Significance level at p < 0.05. DF, degree of freedom; UP, unprocessed treatment; P, processed treatment; TT, thermal treatment; UV-C, UV treatment; D, UV dose; TS, total sugars; RS, reducing sugars; TP, total polyphenols; TF, total flavonoids; AA, antioxidant activity; L*, lightness (−/+); a*, greenness/redness (−/+); b*, blueness/yellowness (−/+).
Table 4. Effects of processing at the different pHs on the color properties of Agave tequilana Weber var. azul extracts.
TreatmentspHColor
L*a*b*∆E
UP4.535.46 ± 0.010 a,b,c0.903 ± 0.033 e−1.197 ± 0.042 f,g
5.535.54 ± 0.132 a,b0.913 ± 0.012 e−1.196 ± 0.065 f,g
6.535.76 ± 0.009 a0.930 ± 0.008 d,e−1.198 ± 0.008 f,g
D14.535.18 ± 0.178 b,c,d0.908 ± 0.012 e−1.175 ± 0.024 e,f,g0.28 ± 0.17 c,d
D235.18 ± 0.061 b,c,d0.932 ± 0.001 d,e−1.175 ± 0.007 e,f,g0.31 ± 0.10 b,c,d
D335.29 ± 0.066 b,c,d0.899 ± 0.041 e−1.181 ± 0.015 e,f,g0.17 ± 0.06 d
D435.30 ± 0.049 b,c,d0.901 ± 0.001 e−1.196 ± 0.019 f,g0.16 ± 0.04 d
D15.535.20 ± 0.146 b,c,d0.931 ± 0.015 de−1.046 ± 0.001 b,c,d0.37 ± 0.13 b,c,d
D235.17 ± 0.154 b,c,d0.935 ± 0.005 d,e−1.066 ± 0.037 b,c,d,e0.39 ± 0.03 b,c,d
D335.14 ± 0.005 c,d0.924 ± 0.002 d,e−1.092 ± 0.063 c,d,e,f0.41 ± 0.02 b,c,d
D435.15 ± 0.008 c,d0.937 ± 0.001 c,d,e−1.101 ± 0.026 d,e,f0.40 ± 0.01 b,c,d
D16.534.95 ± 0.035 d1.015 ± 0.007 a,b−0.884 ± 0.011 a0.86 ± 0.03 a
D235.02 ± 0.149 d1.009 ± 0.007 a,b,c−0.951 ± 0.021 a,b0.78 ± 0.13 a
D335.22 ± 0.077 b,c,d1.027 ± 0.007 a,b−0.980 ± 0.010 a,b,c,d0.58 ± 0.07 a,b,c
D435.13 ± 0.061 c,d0.988 ± 0.023 b,c,d−0.975 ± 0.021 a,b,c0.67 ± 0.04 a,b
TT4.535.29 ± 0.211 b,c,d0.963 ± 0.033 b,c,d,e−1.278 ± 0.027 g0.23 ± 0.13 d
5.535.26 ± 0.028 b,c,d0.970 ± 0.003 b,c,d,e−1.060 ± 0.003 b,c,d,e0.32 ± 0.02 b,c,d
6.534.94 ± 0.055 d1.074 ± 0.022 a−0.901 ± 0.041 a0.87 ± 0.06 a
Means ± standard deviation (n = 20). Values with different letters per column indicate significant differences (p < 0.05) between treatments using the Tukey test. UP, unprocessed treatment; UV dose; D1, 8.16 mJ/cm2; D2, 10.93 mJ/cm2; D3, 16.17 mJ/cm2; D4, 33.29 mJ/cm2; TT, thermal treatment (85 °C; 30 s); L*, lightness (−/+); a*, greenness/redness (−/+); b*, blueness/yellowness (−/+).

