Article

Single- and Multi-Objective Optimization of a Dual-Chamber Microbial Fuel Cell Operating in Continuous-Flow Mode at Steady State

by
Ibrahim M. Abu-Reesh
Department of Chemical Engineering, College of Engineering, Qatar University, Doha P.O. Box 2713, Qatar
Processes 2020, 8(7), 839; https://doi.org/10.3390/pr8070839
Submission received: 15 June 2020 / Revised: 5 July 2020 / Accepted: 9 July 2020 / Published: 15 July 2020

Abstract

:
Microbial fuel cells (MFCs) are a promising technology for bioenergy generation and wastewater treatment. Various parameters affect the performance of dual-chamber MFCs, such as substrate flow rate and concentration. Performance can be assessed by power density ( PD ), current density ( CD ) production, or substrate removal efficiency ( SRE ). In this study, a mathematical model-based optimization was used to optimize the performance of an MFC using single- and multi-objective optimization (MOO) methods. Matlab’s fmincon and fminimax functions were used to solve the nonlinear constrained equations for the single- and multi-objective optimization, respectively. The fminimax method minimizes the worst-case of the two conflicting objective functions. The single-objective optimization revealed that the maximum PD ,   CD , and SRE were 2.04 W/m2, 11.08 A/m2, and 73.6%, respectively. The substrate concentration and flow rate significantly impacted the performance of the MFC. Pareto-optimal solutions were generated using the weighted sum method for maximizing the two conflicting objectives of PD and CD in addition to PD and SRE   simultaneously. The fminimax method for maximizing PD and CD showed that the compromise solution was to operate the MFC at maximum PD conditions. The model-based optimization proved to be a fast and low-cost optimization method for MFCs and it provided a better understanding of the factors affecting an MFC’s performance. The MOO provided Pareto-optimal solutions with multiple choices for practical applications depending on the purpose of using the MFCs.

1. Introduction

Microbial fuel cells (MFCs) are a promising wastewater treatment technology in which microbes convert biochemical energy to electricity under anaerobic conditions. In MFCs, two objectives are accomplished at the same time: (1) treatment of wastewater and (2) generation of clean energy (electricity). MFCs normally consist of two compartments, a cathode and an anode, which are partitioned by a membrane. A simplified schematic drawing of a typical dual-chamber MFC is shown in Figure 1, and the status of this technology can be found in [1,2]. In the anode compartment, bacteria act as a catalyst, converting the organic substrate into CO2, H+, and e. The electrons are transferred from the anode to the cathode, creating an electric current [3]. The protons are transferred through the membrane to the cathode compartment. In the cathode compartment, oxygen, which is the terminal e acceptor, is reduced to water at the surface of a catalyst, such as platinum. MFCs can use a wide range of substrates as anode fuel, including glucose, acetate, and municipal and industrial wastewaters [4]. The power generated by MFCs depends on many factors, such as the MFC configuration, substrate type and concentration, microbial culture, and the operating parameters [5]. MFC technology is currently in the lab-scale stage and the main hurdle for efficient utilization is its low production of power [6]. To move MFCs from the lab scale and towards large-scale application, MFCs need to be optimized and the output power needs to be increased. The optimization of the operating conditions of MFC can be carried out by two methods: (1) experimental method and (2) mathematical modeling. Considerable work has been carried out to maximize the produced power from MFCs via minimizing their internal resistance, optimizing reactor configuration, and understanding microbial interaction with electrodes [7,8].
Mathematical modeling is inexpensive and fast, compared to experimental optimization. Mathematical models can be used to design and optimize MFC operating conditions to maximize the power output and percentage of substrate removal. Previous studies of MFCs were mainly experimental. The mathematical modeling approach has only recently been adopted in this field. Using mathematical models will improve our understanding of the process and help to identify the important parameters that limit electricity generation. Not all mathematical models are equally suitable for the optimization of MFCs. Marcus et al. [9] developed a one-dimensional biofilm model to describe the anode compartment in MFC—this model is comprehensive and not easy to implement. Picioreanu et al. [10] used a three-dimensional biofilm model to describe the anode compartment—this model [10] is complicated; it took more than 20 min to perform one simulation (according to the authors). Zeng et al. [11] developed an easy-to-use mathematical model for dual-chamber MFCs that depends on the anode biochemical reactions, Butler–Volmer equations, and charge and mass balance. In their study, the feed flow rate, which is required to maximize the power output, was manipulated. Zeng et al. [11] optimized the output power in MFCs by changing the flow rate of the feed stream according to different scenarios proposed by the authors. Oliveira et al. [12] developed a 1-D mathematical model for dual-chamber MFCs. The model considered heat transfer, mass and charge balance, redox reactions, and biofilm cell growth. Oliveira et al. [12] extended the model of Zeng et al. [11] by considering biofilm in addition to heat balance. Pinto et al. [13] optimized an MFC by maximizing the wastewater treatment efficiency. Pinto et al. [13] had found that the coexistence of anodophilic and methanogenic bacteria decreased the performance of MFCs, and also found that using MFCs in a series improved the wastewater treatment efficiency. Several other recent publications and reviews were devoted to the mathematical modeling of MFCs [14,15,16,17,18]. Lin et al. [15] developed a mathematical model based on the modification of the Freter equation combined with the Butler–Volmer equation. The model described the performance of an MFC well, such as the electricity-generation and the substrate-removal efficiencies. Gadkari et al. [17] developed a 2-D mathematical model for an air–cathode MFC using a graphite fiber brush anode. The model predicted the effect of the MFC design and operating variables on its performance.
Recently, there has been an increasing interest both in the optimization of MFCs [19,20,21,22,23] and in using mathematical models to control the operation of MFC processes [24,25,26,27,28]. Fu et al. [20] proposed method for performance improvement of microbial fuel cells based on an optimal control strategy for the electrochemical parameters in a two-chamber MFC. Using the model of Zeng et al. [11], Fan et al. [27] developed a method for performance improvement of microbial fuel cells based on model predictive control. Yan et al. [28] developed a mathematical model for MFCs based on biochemical reactions, mass balance, charge balance, and Butler–Volmer equations for voltage output control. All the developed mathematical models above for MFCs were validated by experiments. Very few simulation studies used mathematical models for the optimization of MFCs [29,30]. He et al. [29] used multi-objective genetic algorithms to study the robust optimal operation of dual-chamber MFCs with uncertainty. Using the model of Zeng et al. [11], He et al. [29] optimized the operation of double-chamber microbial fuel cells. This was carried out under a lack of certainty using a stochastic simulation multi-objective optimization. Yang et al. [30] used genetic algorithms for optimization of two-chamber microbial fuel cells. Yang et al. [30] showed that the MFC-produced power   density   ( PD ) cannot be improved without sacrificing the maximum substrate removal efficiency and also showed that the maximum PD production requires the degradation of the maximum attainable current   density   ( CD )   production.
Mathematical model-based optimization studies for MFCs are very rare, especially multi-objective optimization. The goal of this work was to optimize the variables that affect the performance of dual-chamber MFCs operating in the continuous-flow mode at a steady state. Single- and multi-objective model-based optimization was carried out for the three performance criteria of MFCs (i.e.,   PD ,   CD , and substrate   removal   efficiency   ( SRE ) ) . The effect of operating conditions (decision variables) on the performance of MFCs was investigated. The Matlab’s optimization functions were used to solve the nonlinear constrained equations for single- and multi-objective optimization. The optimization results were validated with experimental and simulation results from the literature.

2. Modeling and Optimization of a Microbial Fuel Cell (MFC)

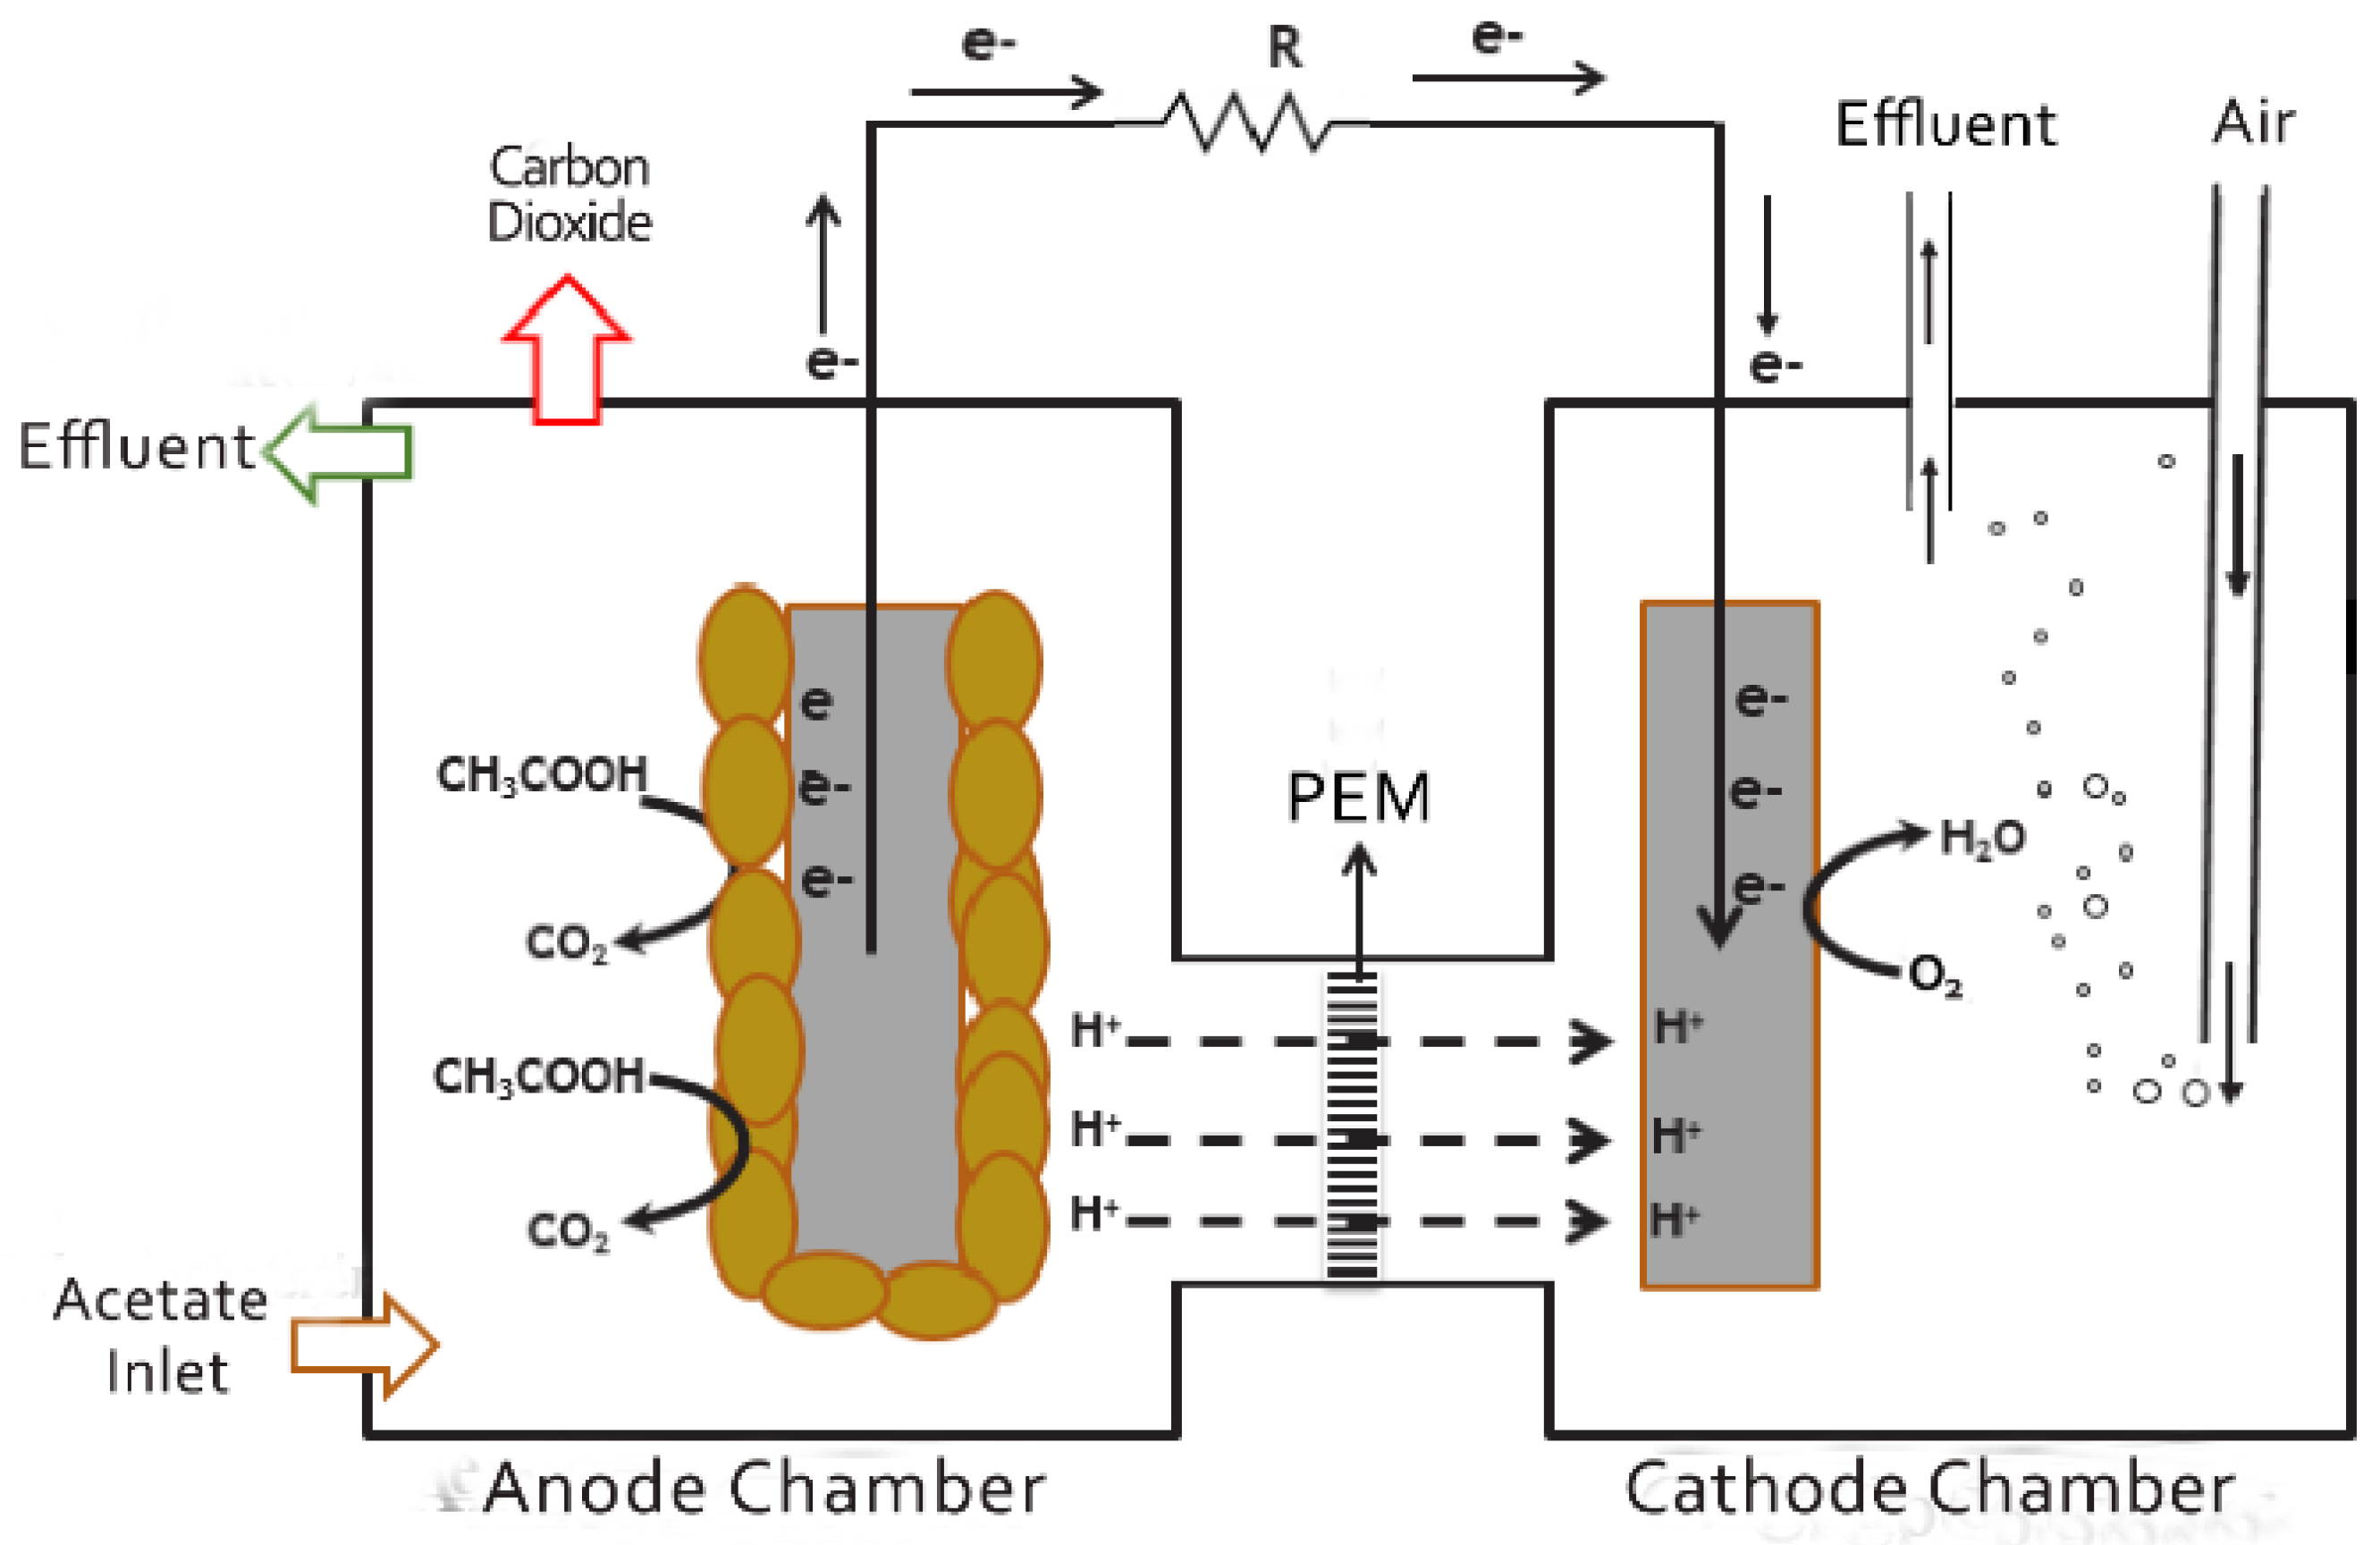
2.1. Mathematical Model for the Two-Chamber MFC

The mathematical model used in this optimization study was developed by Zeng et al. [11]. Other researchers who used this model in their study will also be referred to. The model of Zeng et al. [11] is one dimensional and relatively simple when compared to other mathematical models. It is easy to implement and use for the optimization and scale-up of MFCs. This model combines biochemical reactions, mole balance, the Butler–Volmer equation, and charge balance in MFCs. In their model [11], acetate was used as the only substrate (fuel) because of its simple and complete degradation pathway compared to other substrates. In Zeng et al. [11], experiments were performed to determine the constants and validate the model. In their experiments [11], they used a mediator-less double-chamber MFC with graphite felt electrodes and a Nafion cation-exchange membrane. The cathode was coated with 0.3 mg/cm2 Pt powder. In [11], they used a buffer solution in their experiments (4 mM of sodium acetate, inorganic salts), and external resistance range between 10 and 10,000   Ω . In the anodic chamber of this model, acetate is oxidized (Equation (1)), and eight electrons produced from each mole of acetate. In the cathode chamber, oxygen is reduced according to Equation (2).
Anode:           ( C H 2 O ) 2 + 2 H 2 O 2 C O 2 + 8 H + + 8 e
Cathode:   O 2 + 4 e + 2 H 2 O 4 O H
Equations (3) and (4) (Butler–Volmer kinetic expressions) describe the reaction rates in the anode and cathode chambers, respectively. Operating parameters used in the MFC model are described in Table 1.
r 1 = k 1 o   e x p   [ α   F R   T η a ]   C a c K a c + C a c   X
r 2 = k 2 o   e x p   [ ( β 1 )   F R   T η c ]   C O 2 K O 2 + C O 2  
Considering the anode and cathode chambers as continuously-mixed reactors, and all mass-transport processes are so fast compared to redox and biochemical reactions (i.e., no mass transfer limitations) [11], and since the process involves chemical reactions, the mole balance around the anode chamber for acetate, dissolved CO2, H+ ions, and cell concentrations are described by the following equations, respectively:
V a d C a c d t = Q a ( C a c o C a c ) A m r 1
    V a d C C O 2 d t = Q a ( C C O 2 o C C O 2 ) + 2 A m r 1
V a d C H d t = Q a ( C H o C H ) + 8 A m r 1
V a d X d t = Q a ( X o X ) f x + A m Y r 1 V a K d X
The mole of biomass is not practically used, as it can be converted to grams by multiplying with a conversion factor (for example, bacterial biomass with the empirical formula C5H7O2N, the conversion factor is 113 g/mol). Mole balance around the cathode chamber for dissolved O2, OH ion, and M+ cation concentrations is described by:
V c d C O 2 d t = Q c ( C O 2 o C O 2 ) + A m r 2
V c d C O H d t = Q c ( C O H o C O H ) 4 r 2 A m
V c d C M d t = Q c ( C M o C M ) + N M A m
where   N m   is positive ions ( M + ) flux moved to cathode from anode chamber over the membrane.   N m is calculated by the equation:
N m = 3600 F i c e l l
Balance of charges around the anode and cathode are described by:
C a d η a d t = 3600   i c e l l 8   F r 1
C c d η c d t = 3600   i c e l l 4   F r 2
The practical output voltage of the MFC is less than the open-circuit voltage ( U O C ) due to various losses. Assuming the ohmic drops in the current-collectors and electric connections are negligible, and considering only losses in the membrane and solution, the cell voltage can be described by:
U c e l l = U O C η a + η c [ d m k m + d c e l l k a q ]   i c e l l
where icell is the current density in (A/m2). The MFC power output is determined by:
Power   density   ( PD )   ( W / m 2 ) = U c e l l   .   i c e l l

2.2. Single-Objective Optimization

Mathematically-speaking, the single-objective optimization problem can be formulated as follows:
Min / Max   F ( X )
Subject to:
g i   ( X ) 0   i = 1 ,   2 ,   ,   m
h j ( X ) = 0   j = 1 ,   2 ,   ,   p
X k L b X k X k U b   k = 1 ,   2 ,   ,   n
where   F ( X ) ,   g ( X ) ,   and   h ( X )   are the objective function, inequality, and equality constraints functions, respectively. m and p are the inequality and equality constraints number. X is a vector of the design parameters, X = [ X ( 1 ) ,   X ( 2 ) X ( n ) ] , X k L b   and   X k U b are the lower and upper limits of the design parameters, and n is the number of the optimization design parameters.
The formulation of the single-objective optimization problem is based on multivariable, nonlinear constrained optimization. The numerical optimization was performed using the Matlab function, fmincon (Math Work. Cambridge, MA, USA). The single-objective function of this optimization problem is to maximize power density ( PD ), current density ( CD ) production, and substrate removal efficiency ( SRE ). In this work, the state variables that have an impact on the performance of the MFC were identified. The optimization function determines the optimum operating variables within the range tested. The optimization model composed of the objective function and constraints is described below:
Maximum       P D ( W / m 2 )   = U c e l l .     i c e l l
or   Maximum   C D ( A / m 2 ) =   i c e l l
or   Maximum   S R E   ( % ) = [ C a c o C a c C a c o ]
Subject to:
U c e l l = U O C V l o s s e s ,   V l o s s e s = η a η c + [ d m k m + d c e l l k a q ]   i c e l l   ,     η a = R T α F   l n   [ r 1 ( k a c + C a c ) k 1 o   C a c   X ]
η c = R T ( β 1 ) F   l n   [ r 2 ( k O 2 + C O 2 ) k 2 o   C O 2   ]   , Equations: (5)–(11), (13) and (14) at steady state, U O C V l o s s e s 0
In steady-state conditions, the rate of reaction at the cathode is double the rate of reaction at the anode (i.e., r 2   = 2   r 1 ) ,   this can be obtained from Equations (13) and (14) at the steady state.

2.3. Multi-Objective Optimization (MOO)

MOO is an optimization that involves two or more conflicting objectives. These objective functions are simultaneously optimized. The following mathematical formula describes this optimization problem:
Min / Max   F ( X ) = [ f 1 ( X ) ,   f 2 ( X ) ,   ,   f e ( X ) ]
Subject to:
  g i   ( X ) 0   i = 1 ,   2 ,   ,   m
h j ( X ) = 0   j = 1 ,   2 ,   ,   p
X k L b X k X k U b   k = 1 ,   2 ,   ,   n
where e is the number of conflicting optimization objective functions and m and p are the inequality and equality constraints numbers, respectively. X is a vector of the design parameters, X = [ X ( 1 ) ,   X ( 2 ) X ( n ) ] ,   X k L b   and   X k U b are the lower and upper limits of the design parameters, and n is the number of design parameters, which have lower and upper limit values.
There is no single solution for MOO problems. The solution is a trade-off between the conflicting objectives. The purpose of MOO is to determine an optimal solution set, called a non-dominated or Pareto set, which represents a compromise between conflicting objectives. This can happen if none of the objectives can be improved without degrading some of the other objectives. All the obtained Pareto-optimal solutions are considered equally good. Maximum PD is one objective for the high performance of MFCs. There are also other objectives, such as maximizing CD or SRE . The best performance of an MFC based on all three objectives cannot be achieved. These optimization objectives affect each other, thus, considering the objective functions separately is not accurate and therefore, the optimization requires these objectives to be optimized simultaneously using multi-objective optimization. In this study, the following two bi-objective functions were optimized:
1 . Maximize f 1 ( X ) = P D Maximize   f 2 ( X ) = C D 2 . Maximize f 1 ( X ) = P D Maximize   f 2 ( X ) = S R E
Note: A minus sign should be added to the equations above so that minimization can be carried out.
A Matlab code based on the function fmincon was used for the generation of a Pareto frontier using the weighted sum method that is used to capture Pareto-optimal points. This method is simple, but it is usually difficult to set the weight to be used [31]. The weighted sum technique reduces the MOO to single-objective optimization [32,33]:
Maximize   F ( X ) = w 1   f 1   ( X ) + w 2   f 2 ( X )
Subject to:
w 1   ,   w 2       0   and   w 1 + w 2   = 1
where w is the weighing factor that has a range between 0 and 1. The value of w 1 and w 2   determine the significance of the two objectives.
Using the weighted sum method requires information about the set of weights to be used. The Matlab optimization function, fminimax can be used to obtain one of the solutions of multi-objective optimization that gives the best trade-offs between conflicting objectives. The fminimax and fmincon optimization functions are based on a sequential quadratic programming algorithm. The fminimax function minimizes the worst-case value (or maximize) of multi-variable conflicting objective functions. The fminimax algorithm has the advantage of easily determining the optimum design point from an arbitrarily-selected initial design point. This method also requires fewer gradient and function evaluations compared with other nonlinear optimizations functions subject to constraints [34,35]. Using this method, the same results are obtained using different initial guesses. The fminimax procedure determines a point that minimizes the maximum of several objective functions. The general form of this optimization function is:
M i n X     M a x f       F ( X ) = [ f 1 ( X ) ,   f 2 ( X ) ,   ,   f e ( X ) ]
Subject to:
  g i   ( X ) 0   i = 1 ,   2 ,   ,   m
h j ( X ) = 0   j = 1 ,   2 ,   ,   p
X k L b X k X k U b   k = 1 ,   2 ,   ,   n
The parameter description for this equation is the same as that of Equations (17) and (19).

2.4. Operating Parameters and Properties

The operating parameters and constants used in the optimization study (Table 1) were used in the model of Zeng et al. [11], and later by others. This study used the following as optimization state variables: concentration of acetate, CO2, H+, and cells (biomass) in the anode chamber, and concentration of dissolved O2, OH, and M+ ions in the cathode chamber, in addition to current density or external resistance (Table 2). It was assumed that the concentration of biomass, hydrogen ions, and carbon dioxide in the anode feed were negligible. The concentration of hydroxyl ions and M+ ions in the feed to the cathode was also negligible. The boundaries for the optimization variables are shown in Table 2.

3. Results and Discussion

3.1. Single-Objective Optimization

Eight parameters need to be determined for the maximum power production of a double-chamber continuous-flow MFC at a steady state. These are as follows: (1) in the anode chamber, acetate, CO2, H+ ions, and cell concentrations and (2) in the cathode chamber, dissolved O2, OH ions, and M+ ion concentrations, and the produced current density (or external resistance). The optimized values of these eight variables are shown in Table 2. This was achieved using acetate concentration in the feed to the anode of 1.56 mol/m3 and dissolved oxygen concentration in the feed to the cathode of 0.3125 mol/m3. The lower and upper bounds of these eight variables that affect the performance of the MFC are shown in Table 2 and are mostly based on the stoichiometry of the acetate oxidation and oxygen reduction reactions (Equations (1) and (2)). The optimum (maximum) PD and voltage achieved at these conditions were 2.04 W/m2 and 0.292 V, respectively. The CD obtained at the maximum PD conditions was 6.98 A/m2, which corresponds to an external resistance of 83.65 Ω . The optimum PD was obtained when the external resistance is equal to the internal resistance in the MFC.
It should be clear that maximizing power density is not the only objective in MFC operation. Maximizing SRE or CD can be other objectives. The results of these two single-objective optimizations are listed in Table 2. The obtained maximum CD   and SRE were 11.08 A/m2 and 73.6%, respectively, and these two maximizing objectives were satisfied at the lowest external resistance used (10 Ω ) . In this study, the optimization results in Table 2 agree well with the model of Oliveira et al. [12], which was based on the same constants used by Zeng et al. [11]. From the results above, it is clear that no one operating condition maximizes all of the three MFC performance objectives at the same time. For maximum PD , the attainable CD and SRE were 6.98 A/m2 and 46.4%, respectively.
Table 2 shows that maximizing CD will also maximize SRE (i.e., the two objectives are not conflicting), this is also clear from Equation (23), which is obtained from a combination of Equations (5) and (13) at a steady state. This equation is valid for CD that satisfies the design equations above:
SRE = [ C a c o C a c C a c o ] = [ 450     A m   F   Q a   C a c o ] i c e l l
where SRE is the percentage of substrate removed in the anode chamber. SRE = 100 % indicates that all the substrate is removed in the anodic treatment. The description of other parameters in Equation (23) is shown in Table 1. The results above agree with the model of Oliveira et al. [12], which is an extension of the model of Zeng et al. [11]. The substrate is considered the electron donor. The availability of electrons to the anode and the loss of charges in the anode are directly proportional to the substrate removal as described in Equation (24) [36,37]:
i c e l l = n   F   K s   S u b s t r a t e   R e m o v a l
where n is the number of electrons, n = 2 for water as a product. K s   is the reaction rate constant in the anode. F is Faraday’s constant.

3.2. Operating Variables at the Maximum Power Density

Next, a set of solutions for some given values of acetate (fuel) concentration in the feed to the anode chamber were obtained and optimized for maximum power density. Figure 2 shows the effect of the concentration of acetate in the feed to the anode chamber on the optimum PD produced. As seen in the figure, the higher the concentration of acetate in the feed to the anode chamber, the higher the optimum-produced PD and the corresponding CD . The rate of reaction in the anode chamber depends on the acetate concentration as described by the Monod equation (Equation (3)). This resulted in a higher electron transfer from the anode to the cathode chamber; therefore a higher e would have been available for the reduction reaction of oxygen in the cathode, and this implies an increase in CD and   PD   production. Increasing the feed acetate concentration to the anodic chamber from 0.5 to 2.5 mol/m3 (5 times) resulted in increasing the CD from 1.87 to 12.17 A/m2 (6.5 times) and increasing the maximum PD from 0.43 to 3.65 W/m2 (8.5 times). A similar trend was observed for the relation of actual acetate concentration in the anode chamber and the optimum PD and CD . Gil et al. [38] showed that PD increases linearly with fuel added to microbial fuel cells at low concentrations (less than 50 mg chemical oxygen demand (COD)/L). A linear correlation was observed between CD and the concentration of COD of 0–120 mg/L in a continuous-flow microbial fuel cell using sodium acetate as a substrate [39]. At higher COD concentrations, the relationship was not linear and could be described by the modified Monod kinetics [40]. In literature, the current produced by microbial fuel cells was used to quantify anode cell metabolism and substrate concentration change with time [39,40].
Acetate consumption in the anodic chamber is accompanied by the production of carbon dioxide and more biomass. Two moles of carbon dioxide are produced from one mole of acetate consumed. Figure 3 shows the obtained biomass and carbon dioxide concentrations at the maximum PD production conditions with an increase in the feed acetate concentration to the anode chamber. Figure 3 shows that a higher concentration of acetate in the feed to the anode chamber resulted in a larger release of CO2 and cell growth (linear relation). As the feed acetate concentration increased from 0.5 to 2.5 mol/m3 (5 times), the biomass concentration increased from 0.0708 to 0.5066 mol/m3 (7.15 times). The produced carbon dioxide leaves the anode chamber with the exit stream in a continuous-flow MFC. It was reported that the addition of carbon dioxide to the cathode resulted in stable catholyte pH and increased the production of PD in the MFC [41].
Figure 4 shows the effect of the flow rate of fuel (acetate) in the anode on the optimum obtained PD and the corresponding CD in an MFC. The feed concentration of acetate was fixed at 1.56 mol/m3. As seen in Figure 4, CD and PD passed through their maximum at a certain fuel flow rate. The flow rate that achieved maximum CD (7.02 A/m2) and PD (2.8 W/m2) was 2.4 × 10⁻⁵ and 1.1 × 10⁻⁵ m3/h, respectively (i.e., the maximum PD (2.8 W/m2) achieved at a hydraulic retention time of five hours, as shown in Figure 5). Figure 5 also shows that for acetate concentrations in the feed to the anode chamber of 1.2 and 1.9 mol/m3, the maximum PD achieved was 1.98 and 3.59 W/m2, respectively; this was also achieved using a hydraulic retention time (HRT) of five hours (i.e., a higher feed substrate concentration resulted in a higher maximum-produced PD ) .
The results above show that the concentration of substrate and HRT had a great effect on the performance of an MFC. At low HRT, where the flow rate of acetate fuel is high and substrate removal is low, there is not enough time for bacterial growth that cause low current and power density production. At high HRT, cells grow but also die at a higher rate. Dead cells do not produce electrons and their presence at high concentrations in the anolyte and anode biofilm may hinder the movements of protons, which harms the current and power density production. Other researchers using continuous-flow MFCs [42] obtained similar results. A recent study showed that increasing the flow rate of the substrate to the anode improved the PD production, but further increase in flow rate did not improve the PD production [30]. Figure 6 shows oxygen and M+ concentration in the cathode chamber at optimum conditions of maximum PD production at different concentrations of acetate in the feed to the anode chamber (using a feed stream to the cathode chamber with the concentration of 0.3125 mol/m3 oxygen). Figure 6 shows that the optimum concentration of M+ increases with the concentration of acetate in the feed to the anode chamber, where M+ represents the cation species in the cathode chamber such as Na+, K+, and H+ transported from the anode chamber. Rozendal et al. [43] reported that species other than protons, such as Na+ and K+, were behind the transfer of positive charge through the Nafion membrane in an MFC. Figure 6 also shows that the oxygen concentration at maximum power production conditions was reduced by increasing the anode feed substrate concentration. This was expected due to the high consumption of oxygen at high substrate concentrations in the anode chamber and the production of protons that reacted with oxygen in the cathode chamber. Oxygen plays an important role in an MFC; it is the final electron acceptor.
Figure 7 shows the effect of oxygen concentration in the cathode chamber feed on the optimum-produced PD and the corresponding CD . Increasing the concentration of oxygen above 0.03 mol/m3 had very little effect on the obtained CD and PD . The concentration of 0.03 mol/m3 is considered a critical oxygen concentration, as at concentrations below this, increasing oxygen concentration increases the CD and   PD sharply. This critical oxygen concentration is about 1 mg/L (i.e., about 13% of the saturation concentration of oxygen in water at the temperature of the experiment of 30 °C) [11].
Optimization results showed that the critical oxygen concentration increased with increasing acetate concentration in the feed to the anode chamber. In addition to that, the feed flow rate to the cathode chamber had almost no effect on the optimum-produced PD and the corresponding CD   in an MFC (data not shown). In practice, the oxygen flow rate is usually high in lab-scale MFCs, so the oxygen supply is not limiting. As shown above, increasing acetate concentration in the feed to the anode chamber increased the current and power density. Substrate consumption produces organic acids that resulted in a reduction in the pH of the anode chamber (more acidic) and an increase in the production of OH and therefore the pH of the cathode chamber (Figure 8). The concentration of hydrogen ions and hydroxyl ions was used to determine the pH in the anode and cathode chambers, respectively. These results agree with those of Zeng et al. [11] and others [38,44]. Figure 8 shows that increasing the concentration of acetate in the feed to the anode chamber reduced the optimum overpotential of both anode and cathode, according to the Tafel equation. For the anode, the overpotential curve is always lower than that of the cathode. This indicates the importance of the cathode reaction in the performance of an MFC. Figure 8 shows that the change in the pH and overpotential were significant at low anode substrate feed concentration. At high substrate concentration in the anode feed, the concentration of substrate had little effect on the pH and overpotential of both anode and cathode chambers. These results agreed well with both Zeng et al. [11] and Oliveira et al. [12] models.

3.3. Multi-Objective Optimization (MOO) Using the Weighted Sum Method

MOO optimizes two or more objectives that are conflicting. In addition to power generation, MFCs can be used for current generation and substrate removal if used for wastewater treatment. The maximum-achieved power in an MFC is not associated with maximum attainable current density or maximum substrate removal efficiency. No one condition produces maximum PD and CD at the same time. Previous experimental and simulation results showed that maximum PD   production requires degradation of the maximum attainable CD   production [30]. The same also applied for maximizing PD and SRE (i.e., the MFC PD cannot be improved without sacrifice in the maximum SRE ) [30]. The best solution is to carry out MOO by taking the weighted average of the two objectives and treat the problem as a single-optimization problem. From this technique, a set of optimal solutions (Pareto-optimal front) can be achieved. The optimum solution is a trade-off between the two objectives. This depends on the purpose of using the MFC, i.e., whether it is for power production or wastewater treatment. Figure 9 shows the Pareto-optimal front for the case of maximizing PD and CD simultaneously.
Figure 9 shows that the maximum PD achieved was 2.037 W/m2 with the corresponding CD   of about 7 A/m2. The maximum attained CD was 11.08 A/m2 with the corresponding PD of 0.614 W/m2 achieved at the lowest external resistance used (10   Ω ) . This figure shows that increasing the CD will reduce the PD and vice versa, this implies a conflicted relationship between PD and CD . In the high PD region, the attainable CD can be improved significantly without much loss in the PD . Whereas in the high CD region, any improvement in the attainable CD resulted in a high loss of   PD . Similar trends were reported in the literature [30]. Figure 10 shows the Pareto-optimal front for the case of maximizing PD and SRE simultaneously. In Figure 10, the maximum PD achieved was 2.037 W/m2, with the corresponding SRE of only 46.4%, while at the maximum SRE (i.e., 73.6%), the PD was the minimum (0.614 W/m2, achieved at the lowest external resistance used,10   Ω ) . This figure shows that increasing the PD reduced the SRE and vice versa, this means that PD and SRE objectives are conflicting. In the high PD region, the SRE can be improved significantly without much loss in the PD . Whereas in the high SRE region, any small improvement in SRE resulted in a high loss in the PD . This is expected since substrate removal is proportional to the CD generated. Similar trends were reported in the literature [30]. In this study, maximizing CD and SRE objectives were not conflicting using the mathematical model of Zeng et al. [11] at a steady state. As shown in Equation (23), SRE is directly proportional to the CD generated, this relation is valid for CD below the maximum, otherwise, the voltage becomes negative. Al Matouq et al. [19] optimized the operating variables for the production of electricity and phosphorus recovery in double-chamber MFCs. They found that the substrate feed concentration in the anode and the aeration flow rate in the cathode were major players in the MFC performance. They reported that the high production of electricity and the recovery of phosphorus could not be achieved simultaneously [19].

3.4. Multi-Objective Optimization Using the Fminimax Optimization Function

In multi-objective optimization, there is no single solution for all the optimized objective functions. For conflicting objective functions, such as PD   and CD , multi-objective optimization produces many optimal solutions for the problem, which is called Pareto optimal. Using the Pareto method provides a wide range of solutions to choose from, and choosing a solution is no easy task. In the previous section, the weighted sum method was used, in which the MOO was transformed into a single-objective optimization by using a weighting factor. So, for each set of weighing factors, there was a set of optimum solutions. This method is easy to use but it is difficult to select the proper weight and the nonconvex parts of the Pareto set cannot be found. In this study, the fminimax optimization method was used to obtain one of the optimal solutions that is the best trade-off between the conflicting objective functions. This method minimizes the worst-case value (or largest) of the objective functions. It gives the best trade-off between the optimization objectives.
Using the fminimax function for multi-objective optimization of PD and   CD , Table 3 shows the obtained optimum operating variables and the optimum PD and CD at these variables. It is clear from Table 3 that these were the same conditions for single-objective optimization of PD   ( i . e . ,   PD = 2.04 W/m2 and CD = 6.98 A/m2). The SRE at these conditions was 46.4%. We found that the compromise solution for maximizing PD and CD simultaneously is to operate the MFC at maximum   PD conditions. For the case of the multi-objective optimization of PD and SRE , Table 3 shows the optimum variables and the optimum PD and SRE at these operating variables ( i . e . ,   PD = 0.728 W/m2 and SRE = 72.8%). The obtained SRE was very close to that which resulted from the single-objective optimization of SRE (73.6%). The obtained CD at these conditions was 10.95 A/m2. For the case of non-conflicting objective functions, such as CD and SRE , one solution was obtained, which is the same as that of the single-objective optimization of both functions.

3.5. Validation of the Optimization Results

In this section, we summarize the evidence that was used to validate the obtained mathematical model-based optimization results. First, the obtained optimization results satisfied the mathematical model used. The used model and the design parameters were adopted from Zeng et al. [11]. The obtained PD maximization results agree with the experimental and simulation results of both Zeng et al. [11] and Oliveira et al. [12] models. The model of Oliveira et al. [12] is an extension of the model of Zeng et al. [11], using the same constants to include the microbial biofilm concept. The obtained current density results and trends in this work were comparable with those of the recent study [45]. In [45], the authors investigated the impact of operational variables, such as the effect of acetate concentration and flow rate in the anode feed, the anode surface area, temperature, and other variables on MFC performance. The authors used the same model parameters as Zeng et al. [11] and Oliveira et al. [12] models. He et al. [29] used multi-objective genetic algorithms to study the robust optimal operation of dual-chamber MFCs with uncertainty. Using the model parameters and operation conditions of Zeng et al. [11], the authors reported a maximum PD of 2.039 W/m2 and a corresponding CD of 7 A/m2, which agreed well with the optimization results in this work (Table 2). The obtained trends in this study for PD and SRE as a function of substrate concentration in the feed agree well with other MFC mathematical models reported recently in the literature [17]. Gadkari et al. [17] developed a 2-D mathematical model for an air-cathode MFC using a graphite fiber brush anode. The model predicted the effect of MFC design and operating variables on its performance. The authors studied the effect of substrate concentration in the feed on the PD and   SRE . The results obtained by the authors [17] agree with those obtained in this optimization study. In addition to the validation methods above, the obtained MOO results agree with the single-objective optimization results, for example, the MOO of PD and CD simultaneously agree with the results of maximizing PD or CD alone depending on the value of the weighting factor, w .

4. Conclusions

A mathematical model-based optimization method was used for the single- and multi-objective optimization of dual-chamber microbial fuel cells operating in a continuous-flow mode at a steady state. The main objective was to maximize the performance of MFCs described by PD , CD ,   or SRE .   Single-objective optimization was carried out using the Matlab optimization function, fmincon whereas the MOO was carried out using the weighted sum and fminimax function methods. The performance of the dual-chamber MFC depended mainly on the concentration and the flow rate of the substrate in the anode chamber. There was an optimum substrate flow rate (HRT) that achieved maximum PD at certain substrate feed concentration. The maximum PD produced within the range of conditions simulated was 2.04 W/m2, which corresponds to a CD of 6.98 A/m2 and 83.6 Ω external resistance. The single-objective optimization for CD and SRE was also determined (11.08 A/m2 and 73.62%). A critical oxygen concentration of 13% of saturation in the cathode chamber was determined by the simulation results. The bi-objective optimization of PD   and CD , in addition to PD and SRE , showed that they were conflicting; however, maximizing CD and SRE were not conflicting. Pareto-optimal solutions were obtained for the conflicting objectives using the weighted sum method. The nonlinear programming algorithm, fminimax, determined the best trade-off between the two conflicting objectives. The MOO of PD and CD indicated to operate the MFC at maximum PD conditions ( PD = 2.04 W/m2, CD = 6.98 A/m2, and SRE of 46.4%). The MOO of PD and SRE was determined, the compromise solution was ( PD = 0.728 W/m2, SRE = 72.8%, and CD of 10.95 A/m2). The mathematical model-based optimization technique outlined in Section 2.1 was useful for predicting the optimum operating and design variables of the dual-chamber MFC. It is both economical and faster when compared to the experimental optimization method. The mathematical model can also be used to optimize an MFC operating with other fuels, such as wastewater.

Funding

This research received no external funding.

Conflicts of Interest

The author declares no conflict of interest.

References

  1. Slate, A.J.; Whitehead, K.A.; Brownson, D.A.C.; Banks, C.E. Microbial fuel cells: An overview of current technology. Renew. Sust. Energ. Rev. 2019, 101, 60–81. [Google Scholar] [CrossRef]
  2. Santoro, C.; Arbizzan, C.; Erable, B.; Ieropoulos, I. Microbial fuel cells: From fundamentals to applications. A review. J. Power Source 2017, 356, 225–244. [Google Scholar] [CrossRef]
  3. Logan, B.E.; Call, D.; Cheng, S.; Hamelers, H.; Sleutels, T.; Jeremiasse, A.; Rozendal, R. Microbial electrolysis cells for high yield hydrogen gas production from organic matter. Environ. Sci. Technol. 2008, 42, 8630–8640. [Google Scholar] [CrossRef] [PubMed]
  4. Prashant, P.; Vikas, N.S.; Rajendra, L.D.; Sharad, P.K.; Sunil, A.P.; Deepak, P. Recent advances in the use of different substrates in microbial fuel cells toward wastewater treatment and simultaneous energy generation. Appl. Energy 2016, 168, 706–723. [Google Scholar]
  5. Flimban, S.G.A.; Ismail, I.M.I.; Kim, T.; Oh, S.E. Overview of recent advancement in the microbial fuel cell from fundamentals to applications: Design, major elements, and scalability. Energies 2019, 12, 3390. [Google Scholar] [CrossRef] [Green Version]
  6. Logan, B.E.; Hamelers, B.; Rozendal, R.; Schroder, U.; Keller, J.; Freguia, S.; Aelterman, P.; Verstraete, W.; Rabaey, K. Microbial fuel cells: Methodology and technology. Environ. Sci. Technol. 2006, 40, 5181–5192. [Google Scholar] [CrossRef] [PubMed]
  7. Li, M.; Zhou, M.; Tian, X.; Tan, C.; Mc Daniel, C.; Hassett, D.J. Microbial fuel cell (MFC) power performance improvement through enhanced microbial electrogenicity. Biotechnol. Adv. 2018, 36, 1316–1327. [Google Scholar] [CrossRef] [PubMed]
  8. Capodaglio, A.G.; Cecconet, D.; Molognoni, D. An integrated mathematical model of microbial fuel cell processes: Bioelectrochemical and microbiologic aspects. Processes 2017, 5, 73–78. [Google Scholar] [CrossRef] [Green Version]
  9. Marcus, A.K.; Torres, C.I.; Rittmann, B.E. Conduction—Based modeling of the biofilm anode of a microbial fuel cell. Biotechnol. Bioeng. 2007, 98, 1171–1182. [Google Scholar] [CrossRef]
  10. Picioreanu, C.; Head, I.M.; Katuri, K.P.; van Loosdrecht, M.C.M.; Scott, K. A computational model for biofilm-based microbial fuel cells. Water Res. 2007, 41, 2921–2940. [Google Scholar] [CrossRef] [PubMed]
  11. Zeng, Y.; Choo, Y.F.; Kim, B.H.; Wu, P. Modeling and simulation of two-chamber microbial fuel cell. J. Power Source 2010, 195, 79–89. [Google Scholar] [CrossRef]
  12. Oliveira, V.B.; Simoes, M.; Melo, L.F.; Pinto, A.M.F.R. A 1 D mathematical model for a microbial fuel cell. Energy 2013, 61, 463–471. [Google Scholar] [CrossRef]
  13. Pinto, R.P.; Tartakovsky, B.; Perrier, M.; Srinivasan, B. Optimizing treatment performance of microbial fuel cells by reactor staging. Ind. Eng. Chem. Res. 2010, 49, 9222–9229. [Google Scholar] [CrossRef] [Green Version]
  14. Xia, C.; Zhang, D.; Pedrycz, W.; Zhu, Y.; Guo, Y. Models for microbial fuel cells: A critical review. J. Power Source 2018, 373, 119–131. [Google Scholar] [CrossRef]
  15. Lin, H.; Wu, S.; Zhu, J. Modeling power generation and energy efficiencies in air-cathode microbial fuel cells based on freter equations. Appl. Sci. 2018, 8, 1983. [Google Scholar] [CrossRef] [Green Version]
  16. Gadkari, S.; Gu, S.; Sadhukhan, J. Towards automated design of bioelectrochemical systems: A comprehensive review of mathematical models. Chem. Eng. J. 2018, 343, 303–316. [Google Scholar] [CrossRef]
  17. Gadkari, S.; Gu, S.; Sadhukhan, J. Two-dimensional mathematical model of an air-cathode microbial fuel cell with graphite fiber brush anode. J. Power Source 2019, 441, 227145. [Google Scholar] [CrossRef]
  18. Kadivarian, M.; Karamzadeh, M. Electrochemical modeling of microbial fuel cells performance at different operating and structural conditions. Bioproc. Biosyst. Eng. 2020, 43, 393–401. [Google Scholar] [CrossRef]
  19. Al Matouq, A.; Babatunde, A.O. Identifying optimized conditions for concurrent electricity production and phosphorus recovery in a mediator-less dual chamber microbial fuel cell. Appl. Energy. 2018, 230, 122–134. [Google Scholar] [CrossRef]
  20. Fu, C.; Ma, F. Optimization of electrochemical parameters in microbial fuel cell system based on Fuzzy-PID and CMAC neural network. J. Electrochem. Sci. Eng. 2019, 9, 135–142. [Google Scholar] [CrossRef]
  21. Wang, Y.; Wu, J.; Yang, S.; Li, H.; Li, X. Electrode modification and optimization in air-cathode single-chamber microbial fuel cells. Int. J. Environ. Res. Public Health 2018, 15, 1349. [Google Scholar] [CrossRef] [PubMed] [Green Version]
  22. You, J.; Greenman, J.; Ieropoulos, I. Novel analytical microbial fuel cell design for rapid in situ optimization of dilution rate and substrate supply rate, by flow, volume control and anode placement. Energies 2018, 11, 2377. [Google Scholar] [CrossRef] [Green Version]
  23. Penteado, E.D.; Fernandez-Marchante, C.M.; Zaiat, M.; Gonzalez, E.R.; Rodrigo, M.A. Optimization of the performance of a microbial fuel cell using the ratio electrode-surface area/anode-compartment volume. Braz. J. Chem. Eng. 2018, 35, 141–146. [Google Scholar] [CrossRef] [Green Version]
  24. Patel, R.; Deb, D.; Dey, R.; Balas, V.E. Adaptive and Intelligent Control of Microbial Fuel Cells; Springer International Publishing: Cham, Switzerland, 2020. [Google Scholar]
  25. Patel, R.; Deb, D. Parametrized control-oriented mathematical model and adaptive back stepping control of a single chamber single population microbial fuel cell. J. Power Source 2018, 396, 599–605. [Google Scholar] [CrossRef]
  26. Luo, Q.; An, A.; Wang, M. Model reference adaptive control for microbial fuel cell (MFC). In Proceedings of the 2019 4th International Conference on Robotics, Control and Automation, Guangzhou, China, 26–28 July 2019. [Google Scholar]
  27. Fan, L.; Zhang, J.; Shi, X. Performance improvement of a microbial fuel cell based on model predictive control. Int. Electrochem. Sci. 2015, 10, 737–748. [Google Scholar]
  28. Yan, M.; Fan, L. Constant voltage output in two–chamber microbial fuel cell under fuzzy PID control. Int. Electrochem. Sci. 2013, 8, 3321–3332. [Google Scholar]
  29. He, Y.J.; Ma, Z.F. Robust optimal operation of two-chamber microbial fuel cell system under uncertainty: A stochastic simulation based multi-objective genetic algorithm approach. Fuel Cells 2013, 13, 321–335. [Google Scholar] [CrossRef]
  30. Yang, K.; He, Y.; Ma, Z. Multi-objective steady-state optimization of two-chamber microbial fuel cells. Chin. J. Chem. Eng. 2017, 25, 1000–1012. [Google Scholar] [CrossRef]
  31. Messac, A. Optimization in Practice with Matlab: For Engineering Students and Professionals; Cambridge University Press: New York, NY, USA, 2015; pp. 156–159. [Google Scholar]
  32. Ang, S.M.C.; Brett, D.J.L.; Fraga, E.S. A multi-objective optimization model for a general polymer electrolyte membrane fuel cell system. J. Power Source 2010, 195, 2754–2763. [Google Scholar] [CrossRef] [Green Version]
  33. Dokkar, B.; Negrou, B.; Settou, N.; Imine, O.; Chennouf, N.; Benmhidi, A. Optimization of PEM fuel cells for PV-Hydrogen power system. Energy Procedia 2013, 36, 798–807. [Google Scholar] [CrossRef] [Green Version]
  34. Na, W.; Gou, B. The efficient and economic design of PEM fuel cell systems by multi-objective optimization. J. Power Source 2007, 166, 411–418. [Google Scholar] [CrossRef]
  35. Kazeminasab, B.; Rowshanzamir, S.; Ghadamian, H. Nitrogen doped graphene/cobalt-based catalyst layers of a PEM fuel cell: Performance evaluation and multi-objective optimization. Korean J. Chem. Eng. 2017, 34, 2978–2983. [Google Scholar] [CrossRef]
  36. Jadhav, G.S.; Ghangrekar, M.M. Performance of microbial fuel cell subjected to variation in pH, temperature, external load and substrate concentration. Bioresour. Technol. 2009, 100, 717–723. [Google Scholar] [CrossRef]
  37. Zhang, X.C.; Halme, A. Modeling of a microbial fuel cell process. Biotechnol. Lett. 1995, 17, 809–814. [Google Scholar] [CrossRef]
  38. Gil, G.C.; Chang, I.S.; Kim, B.H.; Kim, M.; Jang, J.K.; Park, H.S.; Kim, H.J. Operational parameters affecting the performance of a mediator-less microbial fuel cell. Biosens. Bioelectron. 2003, 18, 327–334. [Google Scholar] [CrossRef]
  39. Franzetti, A.; Daghio, M.; Parenti, P.; Truppi, T.; Bestetti, G.; Trasatti, S.P.; Cristiani, P. Monod kinetics degradation of low concentration residual organics in membrane-less microbial fuel cells. J. Electrochem. Soc. 2017, 164, H3091–H3096. [Google Scholar] [CrossRef] [Green Version]
  40. Tront, J.M.; Fortner, J.D.; Plotze, M.; Hughes, J.B.; Puzrin, A.M. Microbial fuel cell technology for measurement of microbial respiration of lactate as an example of bioremediation amendment. Biotechnol. Lett. 2008, 30, 1385–1390. [Google Scholar] [CrossRef]
  41. Fornero, J.; Rosenbaum, M.; Cotta, M.A.; Angenent, L.T. Carbon dioxide addition to microbial fuel cell cathodes maintains sustainable catholyte pH and improves anolyte pH, alkalinity, and conductivity. Environ. Sci. Technol. 2010, 44, 2728–2734. [Google Scholar] [CrossRef]
  42. Wei, L.; Yuan, Z.; Cui, M.; Han, H.; Shen, J. Study of electricity generation characteristic of two-chambered microbial fuel cell in continuous flow mode. Int. J. Hydrogen Energy. 2012, 37, 1067–1073. [Google Scholar] [CrossRef]
  43. Rozendal, R.A.; Hamelers, H.V.M.; Buisman, C.J.N. Effects of membrane cation transport on pH and microbial fuel cells performance. Environ. Sci. Technol. 2006, 40, 5206–5211. [Google Scholar] [CrossRef]
  44. Angenent, L.T.; Karim, K.; Al-Dahhan, M.H.; Wrenn, B.A.; Domiguez-Espinosa, R. Production of bioenergy and biochemical from industrial and agricultural wastewater. Trends Biotechnol. 2004, 22, 477–485. [Google Scholar] [CrossRef]
  45. Singh, A.; Krishnamurthy, B. Parametric modeling of microbial fuel cells. J. Electrochem. Sci. Eng. 2019, 9, 311–323. [Google Scholar] [CrossRef]
Figure 1. Schematic of dual-chamber microbial fuel cell separated by proton exchange membrane (PEM).
Processes 08 00839 g001
Figure 2. Effect of concentration of acetate in the feed of the anode chamber on the maximum-produced power density ( PD ) and the corresponding current density ( CD ) in an MFC.
Processes 08 00839 g002
Figure 3. Effect of concentration of acetate in the feed to the anode chamber on the produced biomass and carbon dioxide concentration at the maximum PD production conditions in an MFC.
Processes 08 00839 g003
Figure 4. Effect of the feed flow rate to the anode chamber on the maximum-produced PD and the corresponding CD in an MFC (acetate feed concentration was 1.56 mol/m3).
Processes 08 00839 g004
Figure 5. Effect of the hydraulic retention time (HRT) of the fuel in the anode chamber on the optimum-produced power density ( PD ) at three different acetate feed concentrations.
Processes 08 00839 g005
Figure 6. Effect of acetate concentration in the feed to the anode chamber on the required concentrations of M+ cation and oxygen in the cathode chamber at maximum power production conditions.
Processes 08 00839 g006
Figure 7. Effect of oxygen concentration in the cathode chamber on the maximum-produced power density ( PD ) and the corresponding current density ( CD ) in an MFC.
Processes 08 00839 g007
Figure 8. Anode and cathode pH and overpotential required for maximum power density ( PD ) production at different acetate concentration in the feed to the anode chamber.
Processes 08 00839 g008
Figure 9. Pareto front obtained by multi-objective optimization (MOO) of PD and CD .
Processes 08 00839 g009
Figure 10. Pareto front obtained by multi-objective optimization of PD and substrate removal efficiency ( SRE ).
Processes 08 00839 g010
Table 1. Parameters and operating conditions used in the microbial fuel cell (MFC) model [11]. Reproduced with permission from Zeng, Y.; Choo, Y.F.; Kim, BH; Wu, P., Journal of Power Sources; Published by Elsevier, 2010.
SymbolDescriptionUnitsValue
F Faraday’s constantA.s/mole e96,485.4
R Gas constantJ/mole K8.3144
T Temperature of the experimentk303
k m Electrical conductivity of the membrane1/ohm m17
d m Membrane thicknessm1.778 × 10−4
  k a q Solution electrical conductivity1/ohm m5
d c e l l Distance between electrodesm2.2 × 10−2
C a Capacitance of anodeF/m2400
C c Capacitance of cathodeF/m2500
V a Anode chamber volumem35.5 × 10−5
V c Cathode compartment volumem35.5 × 10−5
A m Area of membranem25 × 10−4
Y Bacterial cell yield[-]0.05
K d Decay constant for acetate utilizers1/h8.33 × 10−4
f x Reciprocal of wash-out fraction[-]10
Q a Fuel flow rate in the anode chamberm3/h2.25 × 10−5
Q c Feed flow rate in the cathode chamberm3/h1.11 × 10−3
C a c o Acetate concentration in the anode feedmol/m31.56
C C O 2 o CO2 concentration in the anode feed mol/m30
X o Bacteria concentration in the anode feedmol/m30
C H o H+ concentration in the anode feedmol/m30
C O 2 o O2 concentration in the feed of cathodemol/m30.3125
C M o M + concentration in the cathode feedmol/m30
C O H o OH concentration in the cathode feedmol/m30
U o Open circuit voltagevolt0.77
k 1 o Rate constant for anode reaction at standard conditions.mol/m2 h0.207
k 2 o Rate constant of cathode reaction at standard conditions.mol/m2 h3.288 × 0−5
k a c Acetate half velocity rate constant.mol/m30.592
k O 2 O2 half velocity rate constant.mol/m30.004
α Transfer coefficient for charge in the anode[-]0.051
β Transfer coefficient for charge in the cathode[-]0.663
Table 2. MFC optimization parameters and optimum values for the three single-objective optimization functions (i.e., maximum power density (PD), current density (CD) and substrate removal efficiency (SRE).
Variable *Lower BoundUpper BoundOptimum Value for Max PD Optimum Value for Max CD **
X ( 1 ) concentration of acetate0       C a c o 0.8370.4115
X ( 2 ) concentration of carbon dioxide02   C a c o 1.4472.2969
X ( 3 ) concentration of hydrogen ions08 C a c o 5.7879.1877
X ( 4 ) concentration of cells00.3550.5628
X (5) concentration of dissolved oxygen0 C o 2 o 0.2830.2659
X (6) concentration of hydroxyl ions04   C o 2 o 0.1170.1862
X (7) concentration of M+ ions00.1170.1862
X (8) cell current density (A/m2), or0 i c e l l   ( m a x ) 6.9811.081
external resistance ( Ω ) 1010,00083.610
* All concentrations are in mol/m3. ** The same values for maximum SRE.
Table 3. Optimization parameters and objective functions for two multi-objective optimization cases of MFCs using the Matlab optimization function, fminimax.
Variable *Maximize f 1 ( X ) = P D Maximize f 2 ( X ) = C D Maximize f 1 ( X ) = P D Maximize f 2 ( X ) = S R E
X ( 1 ) concentration of acetate0.8370.4248
X ( 2 ) concentration of carbon dioxide1.4472.2704
X ( 3 ) concentration of hydrogen ions5.7879.082
X ( 4 ) concentration of cells0.3550.556
X ( 5 ) concentration of dissolved oxygen0.2830.267
X ( 6 ) concentration of hydroxyl ions0.1170.184
X ( 7 ) concentration of M+ ions0.1170.184
X ( 8 ) cell current density (A/m2)6.9810.953
Power density ( PD ) [W/m2]2.040.728
Current density ( CD ) [A/m2]6.9810.953
Substrate removal efficiency ( SRE ) [-]0.4640.728
External resistance ( Ω ) 83.6612.13
* All concentrations are in mol/m3.

