Article

An Experimental–Numerical Approach for Modelling the Mechanical Behaviour of a Pneumatic Tyre for Agricultural Machines

by
Alexandros Sotirios Anifantis
1,
Maurizio Cutini
2 and
Marco Bietresato
3,*
1
Department of Agricultural and Environmental Science, University of Bari Aldo Moro, via Amendola 165/A, I-70126 Bari (BA), Italy
2
Consiglio per la ricerca in agricoltura e l’analisi dell’economia agraria (CREA)-Centro di ricerca Ingegneria e Trasformazioni agroalimentari (CREA-IT), via Milano 43, I-24047 Treviglio (BG), Italy
3
Faculty of Science and Technology, Free University of Bozen/Bolzano, Piazza Università 5, I-39100 Bolzano (BZ), Italy
*
Author to whom correspondence should be addressed.
Appl. Sci. 2020, 10(10), 3481; https://doi.org/10.3390/app10103481
Submission received: 20 April 2020 / Revised: 11 May 2020 / Accepted: 14 May 2020 / Published: 18 May 2020
(This article belongs to the Section Mechanical Engineering)

Abstract

:

Featured Application

The mechanical behaviour of an agricultural pneumatic tyre was investigated experimentally and the results,linearized in adjacent stretches, were used to tune a finite element model, including both the carcass and the air.

Abstract

The mechanical behaviour of an agricultural tyre is a matter of extreme interest as it is related to the comfort of operators, to the adherence of agricultural machines, and to the compaction of agricultural soil. Moreover, the deformability of the tyres plays a fundamental role in vehicle stability in terms of side rollover. The behaviour of a loaded tyre during its deformation is complex, due to the combined contributions of the carcass components, the tread rubber and the air contained within it. Therefore, this study proposes an experimental–numerical approach for the mechanical characterization of agricultural tyres based on real-scale experiments and matches these results with a finite-element (FE) model. The tyre flattening in the elastic field has been described using two coefficients (Young’s modulus “E”, Poisson’s ratio “ν”), whose values have been identified with an iterative FEM procedure. The proposed approach was applied to two different tyres (420/85 R24 and 460/85 R34), each one inflated at two different pressures (1.0 bar and 1.6 bar). Young’s modulus was appreciated to be highly variable with the inflation pressure “p” of the tyres. Furthermore, the response surface methodology was applied to find two mathematical regression models, useful for studying the variations of the tyre footprint dimensions according to the type of tyre. This simple approach can be applied in other simulations without suffering any loss of accuracy in the description of the phenomenon.

1. Introduction

In recent decades, agriculture has faced a gradual transition towards higher working speeds for all machines involved and greater use of transport-oriented farm tractors, due to a constantly-increasing demand for higher productivities and lower costs. This change raises lots of issues for many technical systems of agricultural vehicles. In particular, agricultural tyres are the mechanical interfaces by which the engine power of wheeled tractors is delivered to the ground, enabling a vehicle to travel safely and to perform its tasks. Therefore, tyres need to retain a high level of efficiency and effectiveness both in the field and on the road. There are several aspects involved, from the capability for the tyres to limit energy waste while rolling (efficiency), to the capability of accomplishing successfully the tasks for which they are intended and/or which they are requested to complete (effectiveness). In this regard, the most important technical demands concern the conciliation of two only-apparently antithetical aspects involving the tyres: the safety and the performance of the vehicle when it operates both on the road and in the field. As regards safety, intended as the preservation of a safe situation despite the presence of an elastic medium such as tyres, vehicle stability remains a very relevant topic [1], as well as the comfort for professional operators, intended as the mitigation of whole-body vibrations and the protection of workers from correlated occupational diseases [2]. As regards performance, the focus is, in this case, on the maximization of adherence to the road, of traction in the field, and the limitation of soil compaction. The necessary premise is the knowledge of the deformation of the tyre in correspondence to the contact area with the ground, e.g., detected by making use of laser sensors in a purely-experimental approach [3]. Apart from the instrumentation, the same article [3] also reports an interesting fact that is indicative of the complexity of the phenomenon: tyre deformation due to contact with the ground affects not only the footprint area (±40° from the centre of the footprint) but also other parts close to it (up to ±140°). Other studies have also highlighted the need to consider the many operative conditions in order to gain a clear understanding of tyre performance. For example, the importance of inflation pressure on adhesion and slippage was investigated in [4] and [5,6], respectively. The control of these parameters has a fundamental role in tyre and vehicle performances and in fuel consumption [7], especially for large towed vehicles [8,9,10], and thus reduces energy loss, which is crucial for agriculture [11,12,13,14]. A centralized system to control the inflation pressure of agricultural tractor tyres according to the soil and working conditions was developed and tested in [15], and a wireless power charger for the pressure sensors was the object of another recent contribution [16]. The tyre pressure can also be identified using 3-axis accelerometers and by exploiting the relationship between tyre pressure and characteristic frequency of the rim, as explained in [17].
The most widespread approach that emerges from the literature, in this case, is to make use of the geometrical characteristics and of the constitutive equations of the materials of the bodies in contact (e.g., using the values of the coefficients regarding the tyre materials collected in [18]). For example, in [19,20], a model for the prediction of tyre traction capability from a series of geometrical and elastic tyre properties, soil characteristics and slippage is presented. Other authors use a similar approach to identify a correlation between the nominal characteristics of tyres and their two-dimensional footprint (2D), considering the tyre footprint on a rigid surface [21,22]. However, 3D models of the whole wheel also have been developed to further deepen the knowledge about the soil-compaction phenomenon [23] and to develop some indexes that, taking account of both the contact area and the volume of soil involved in the footprint, can be related to the compaction and traction behaviour of a considered tyre [24,25]. Moreover, the technological evolution of the tyre structure brought about by the “improved flexion” and “very high flexion” tyres (namely, IF and VF tyres) and the concept of new tread profiles, different from classic ones, confirm the importance of continuing to improve the modelling of agricultural tyres to deepen the knowledge of their operative behaviour. An accurate study of the tyre vertical dynamics and, hence, of the vehicle dynamics, can require models of agricultural tyres that are more complex than a damper-spring system [26,27], but which can also take into account the elastic, mechanical and geometric properties. This approach is present in the recent scientific literature concerning the automotive [28,29] and, especially, in all the works using simulation software to study the driveability of the vehicle in order to develop Advanced Driver-Assistance Systems (ADAS). The main properties regarding on-road tyre performances (e.g., longitudinal, lateral forces or self-aligning moment) can be expressed by the so-called “magic formula”, an empirical model proposed by Hans B. Pacejka, commonly used to simulate steady-state tyre forces. The magic formula can be applied whatever the structure of the wheel: indeed, it has also been applied to a mechanical elastic wheel (ME-Wheel) for an off-road vehicle to set up an integrated yaw and rollover stability control [30]. However, it is also necessary to consider the geometry and mechanical properties of the tyres when developing models of agricultural vehicle aimed at studying both stability [31,32], and traction and soil compacting [33,34]. To this end, the approach based on a tyre equipped with strain sensors, also known as “Intelligent Tyre”, seems particularly promising, thus allowing relevant vehicle dynamics information to be provided [35]. In order to simulate the behaviour of an agricultural tyre, the finite elements method (FEM) has been hence considered the most appropriate, e.g., for studying deformation of an off-road tyre based on experimental results of characterization of the material [36,37]. The influence of tyre pressure on the deformations of an agricultural tractor wheel has been studied in [38] by means of a plane-symmetric FE model of the tyre in the frontal plane. A more detailed 3D FE model was used in [36]; this detailed multi-component model accurately reproduces the real structure of the tyre with its tread, inner fabric, carcass, sidewalls, circumferential and radial cords and bead cores. The modelling of the interaction of a tractor tyre with the soil surface also requires a high detail of this last, if the aim is to analyse the contact pressure distribution for several wheel loads and tyre inflation pressures, as in [39,40]. In these cases, the soil structure has been modelled through a multilayered mesh with its attributes corresponding to the soil properties, and, the tyre–soil interface pressures having been validated by equipping a tyre thread with six miniature pressure transducers [39] or by using proper lab equipment [40].
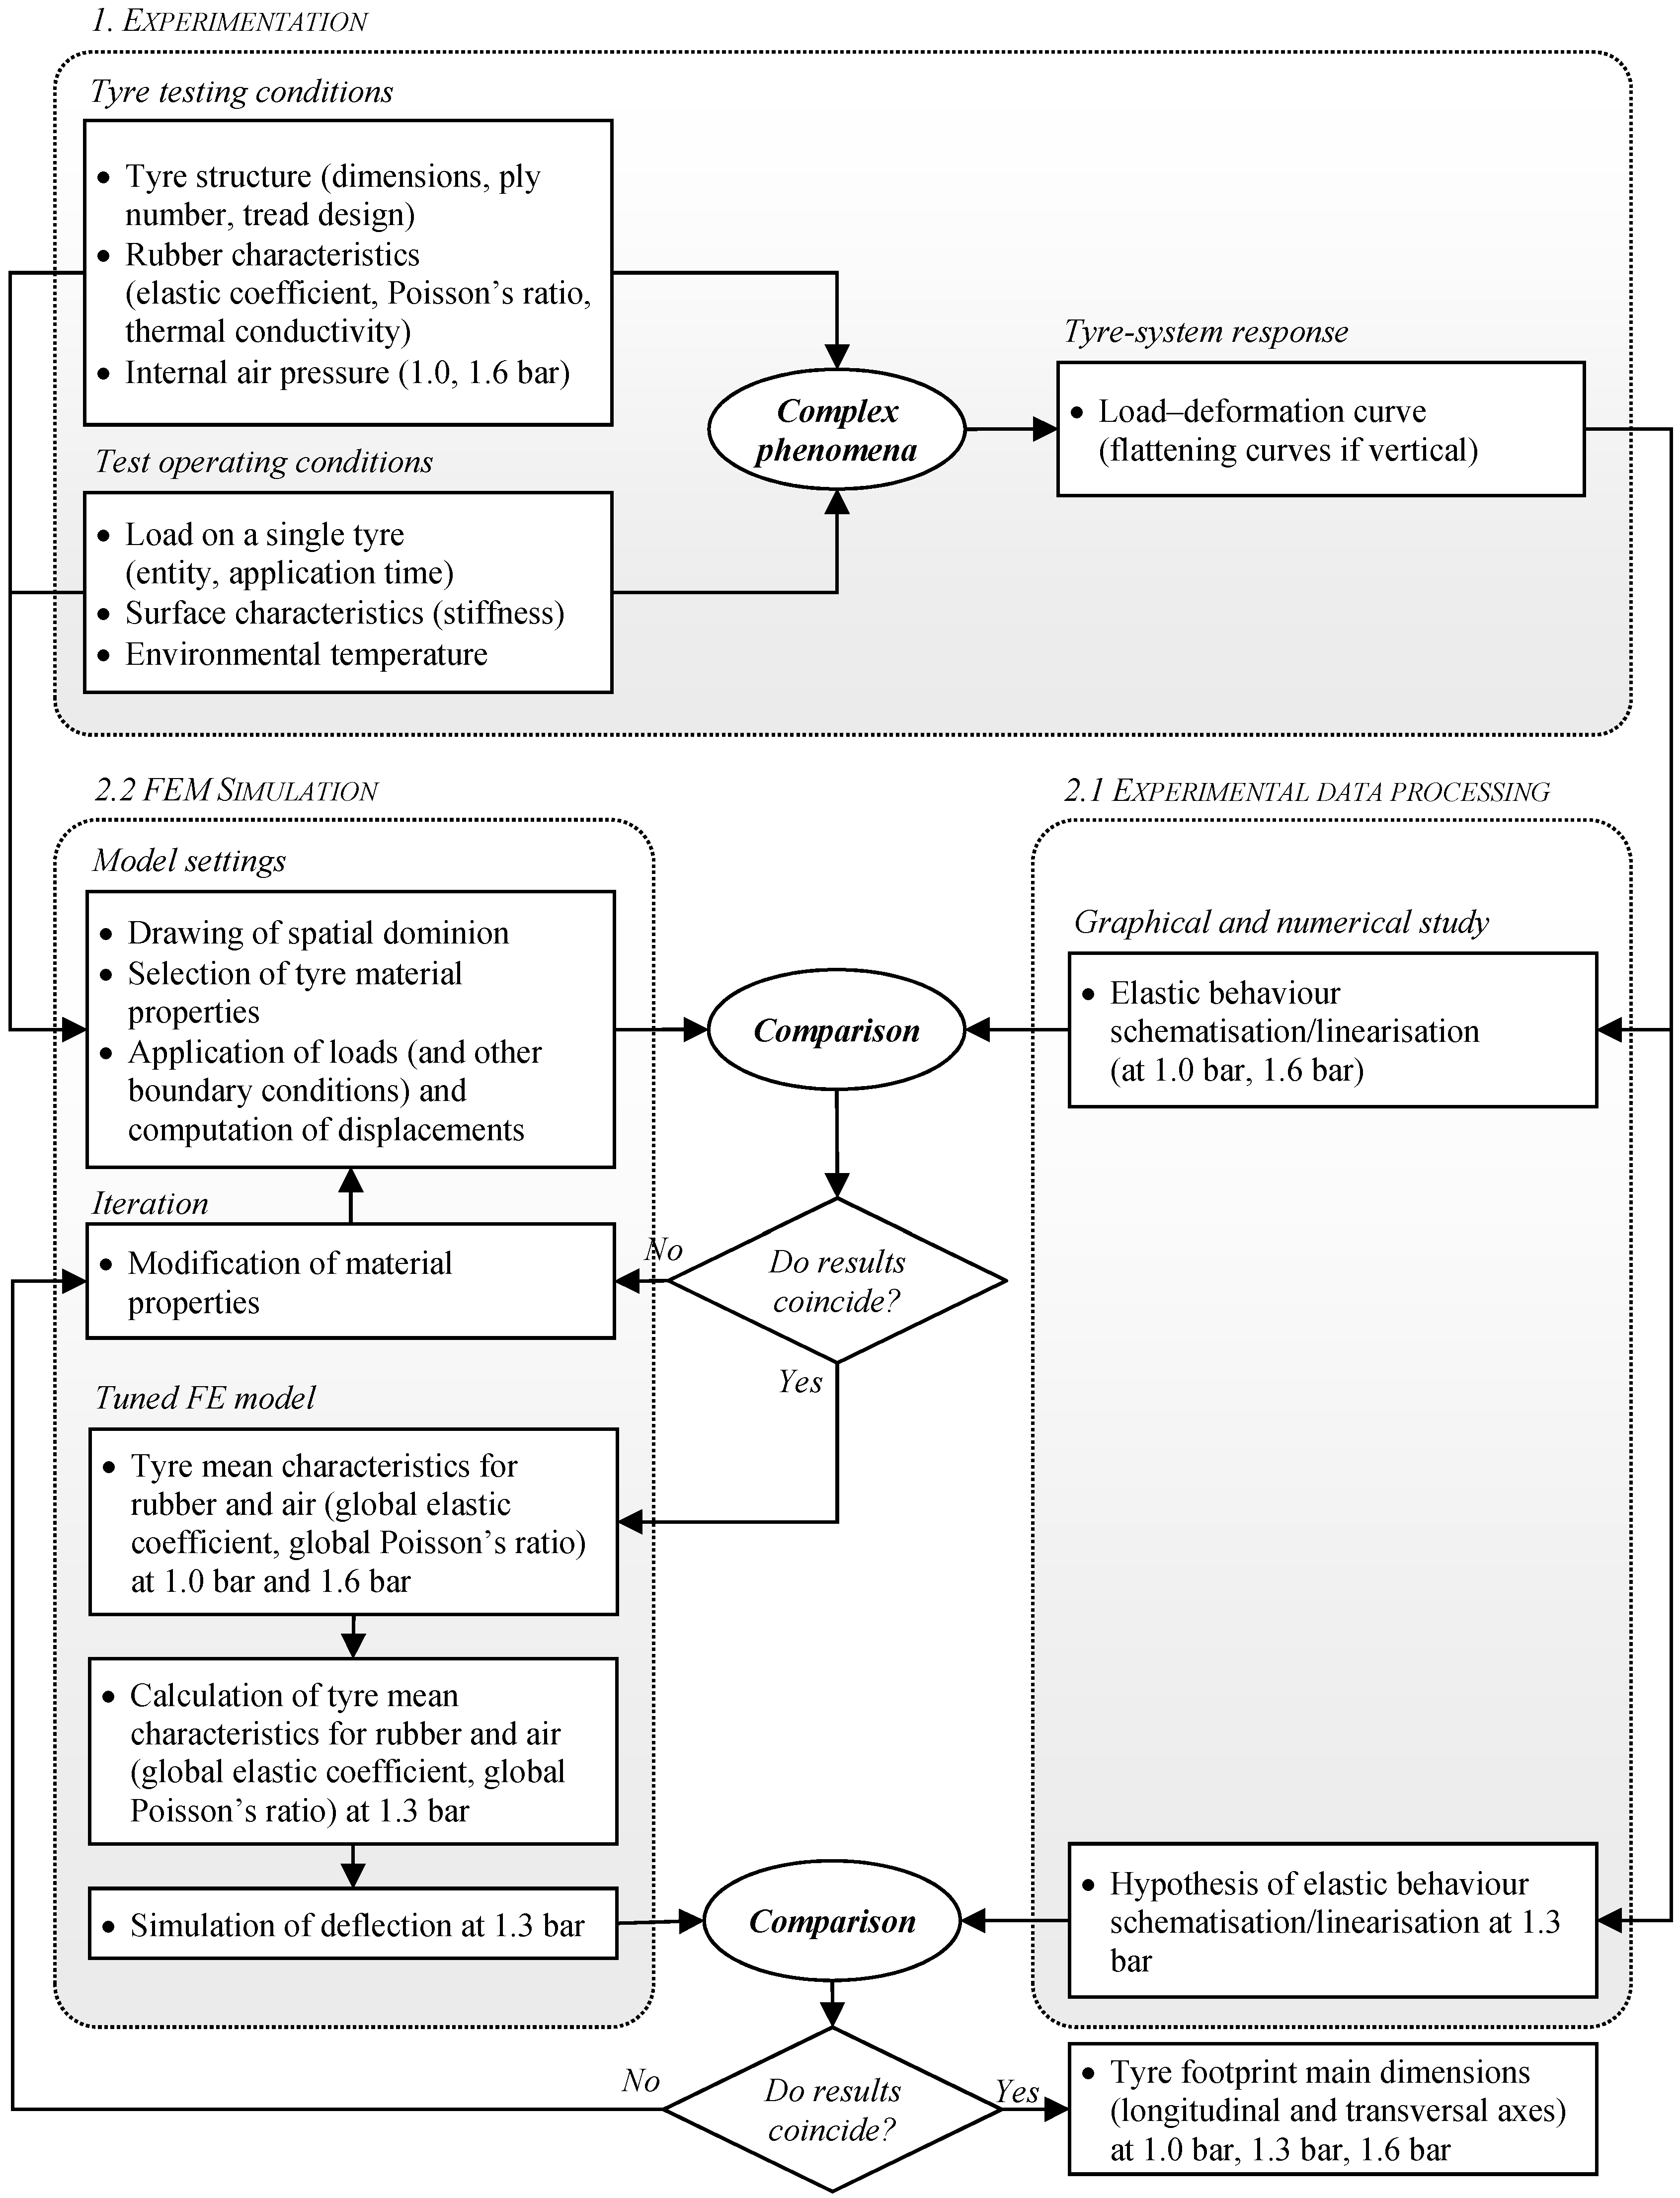
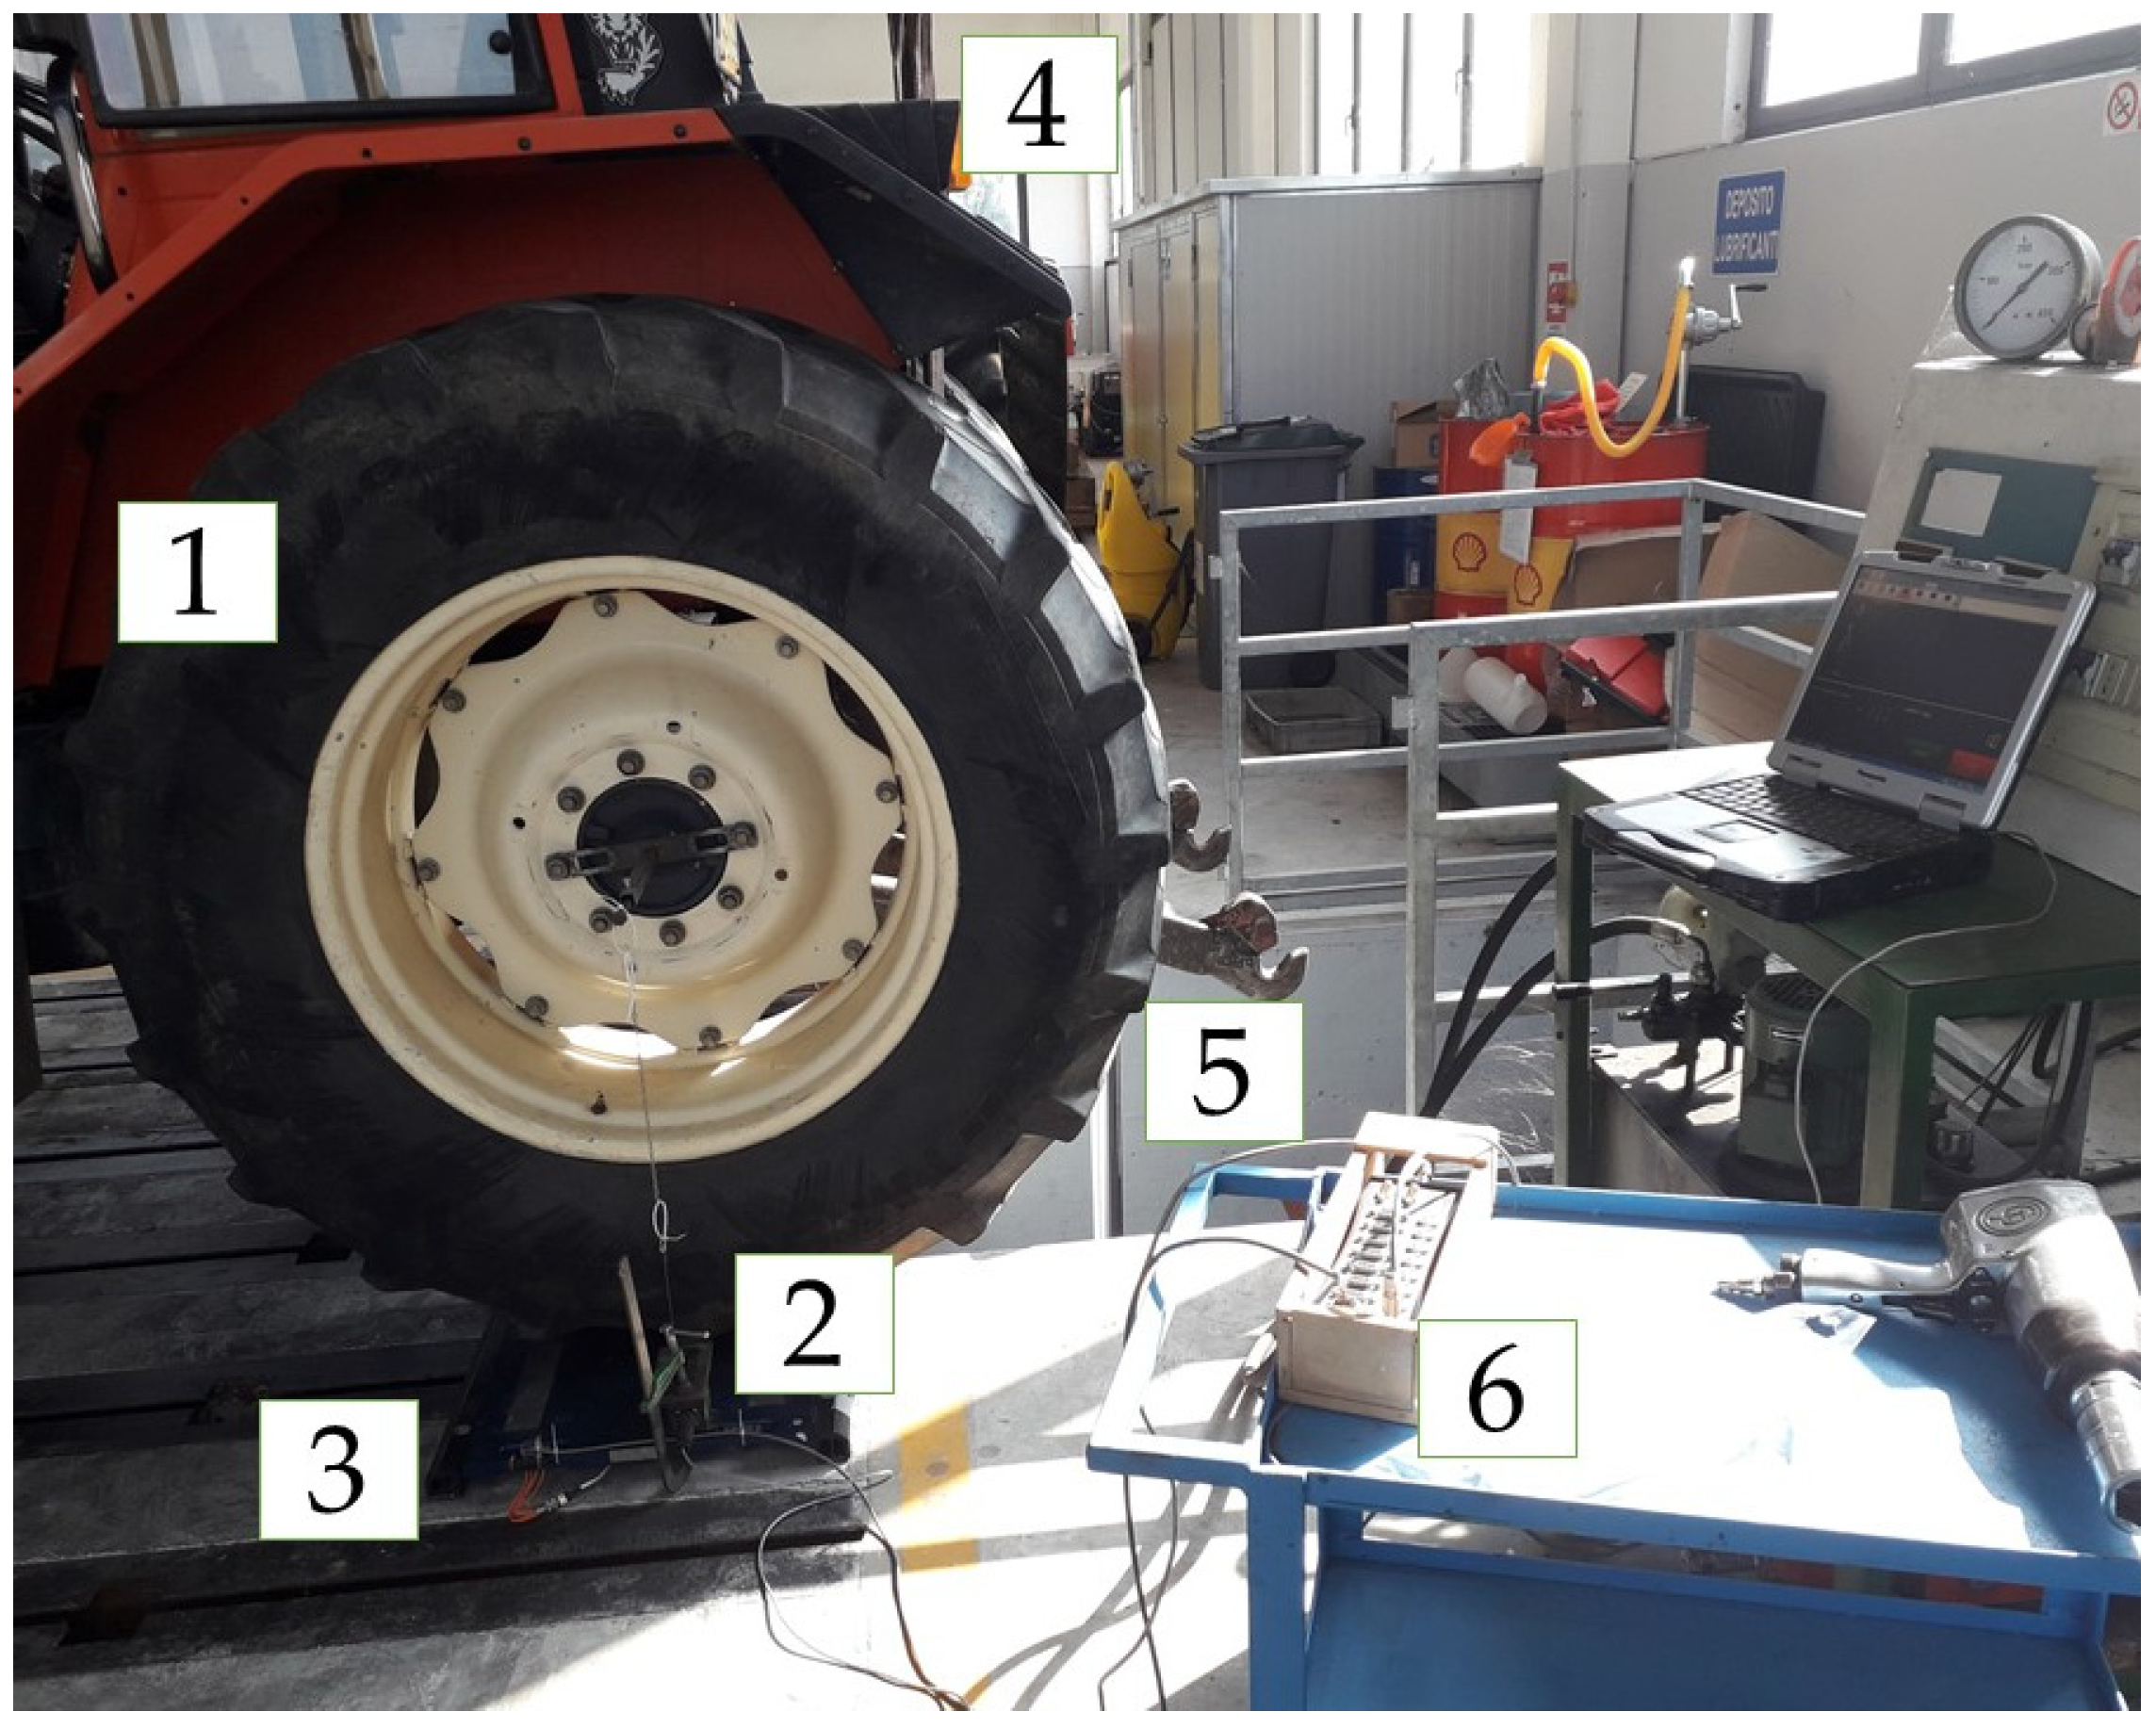
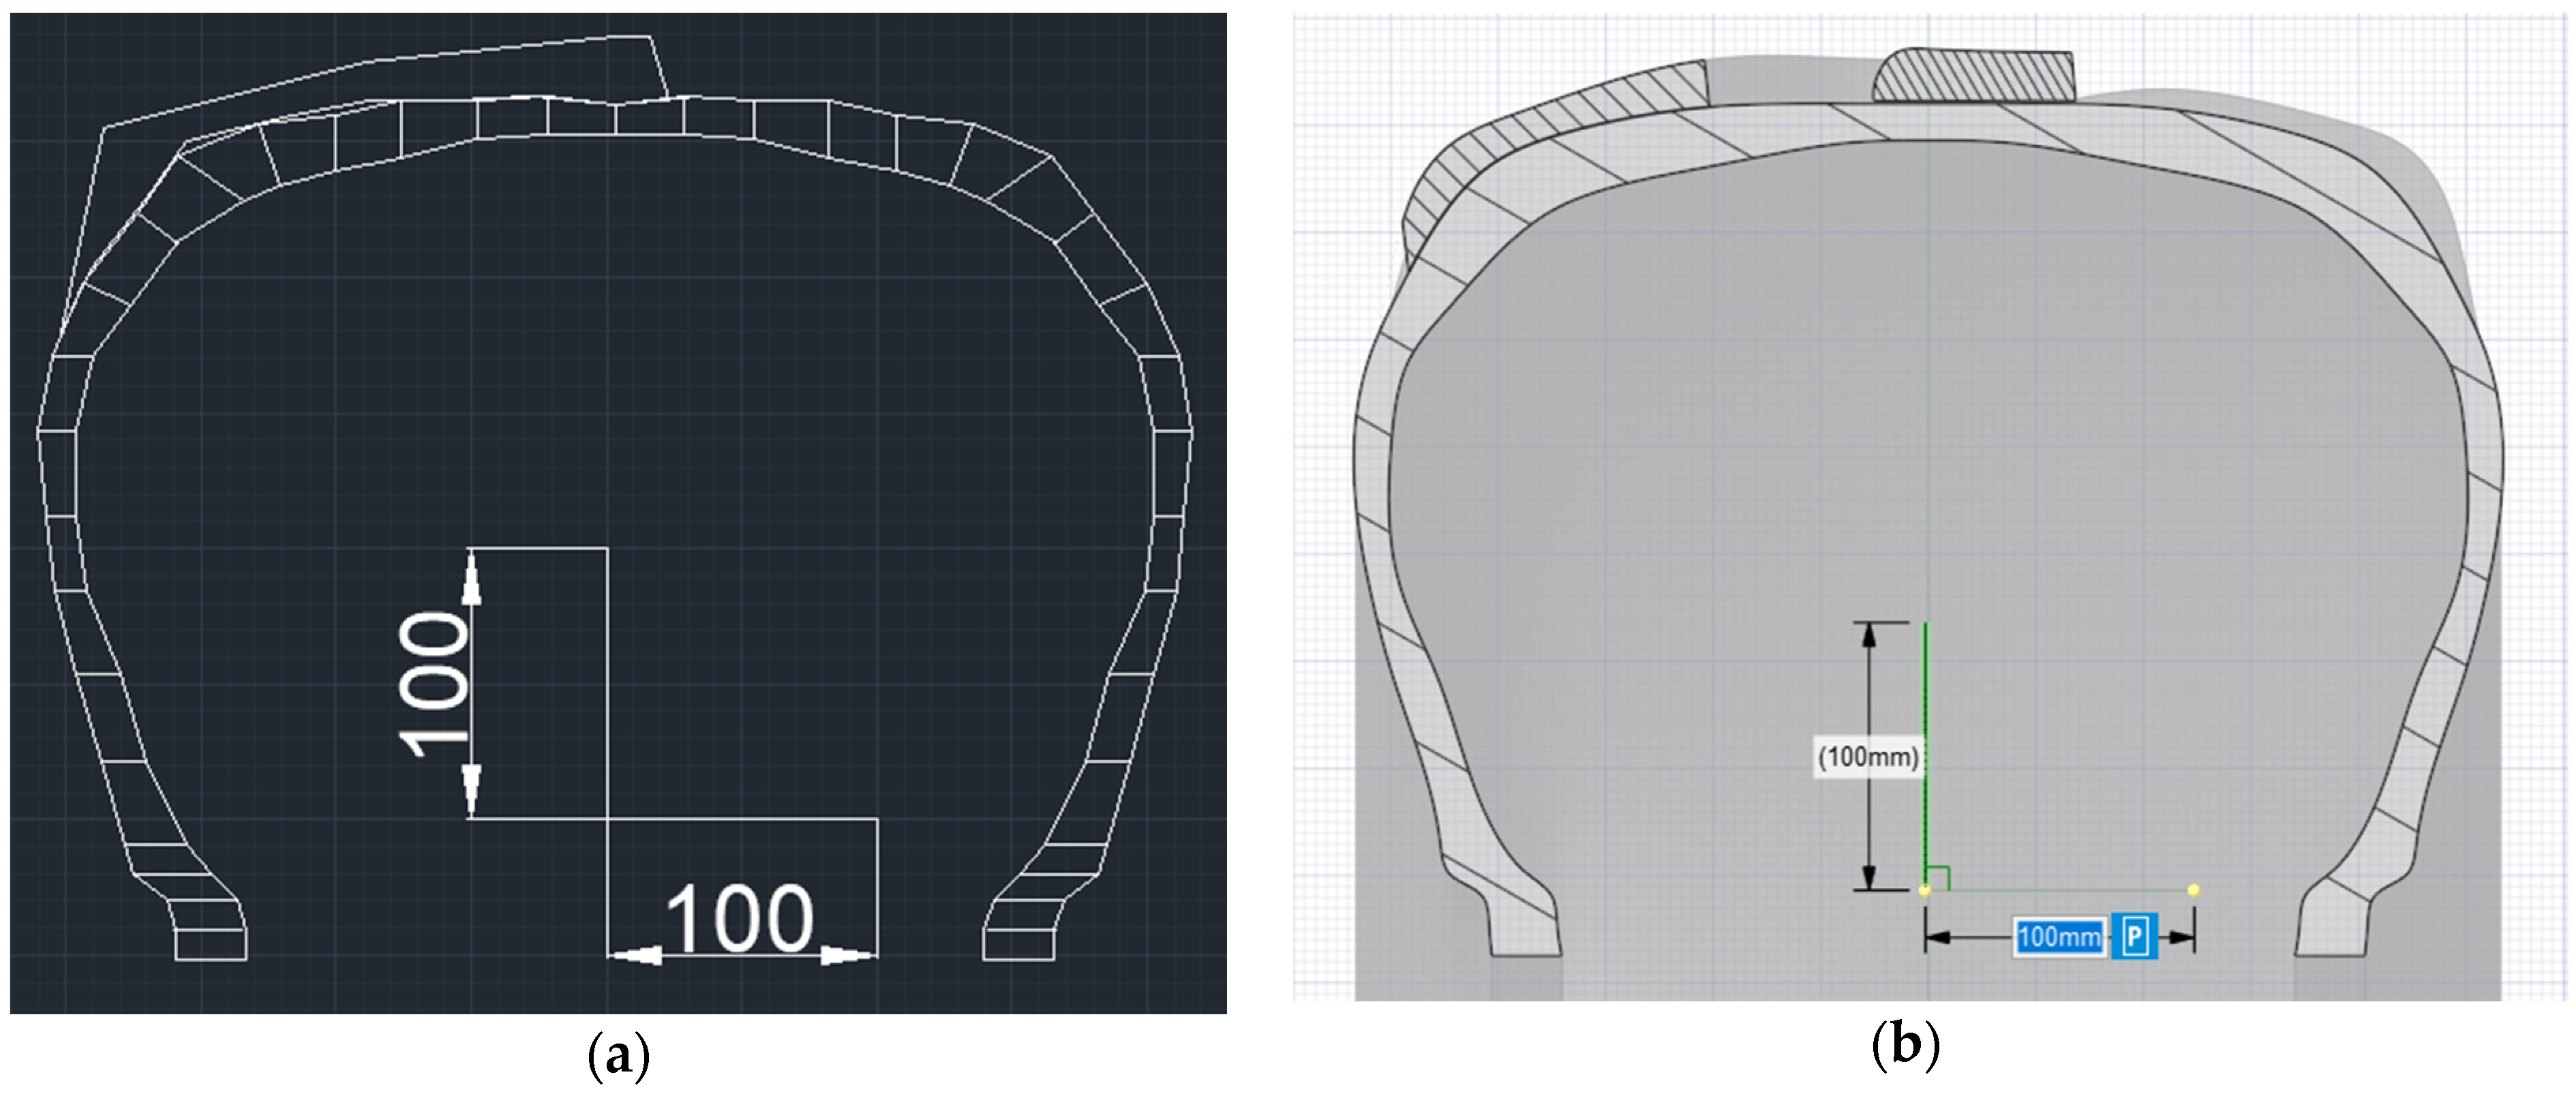
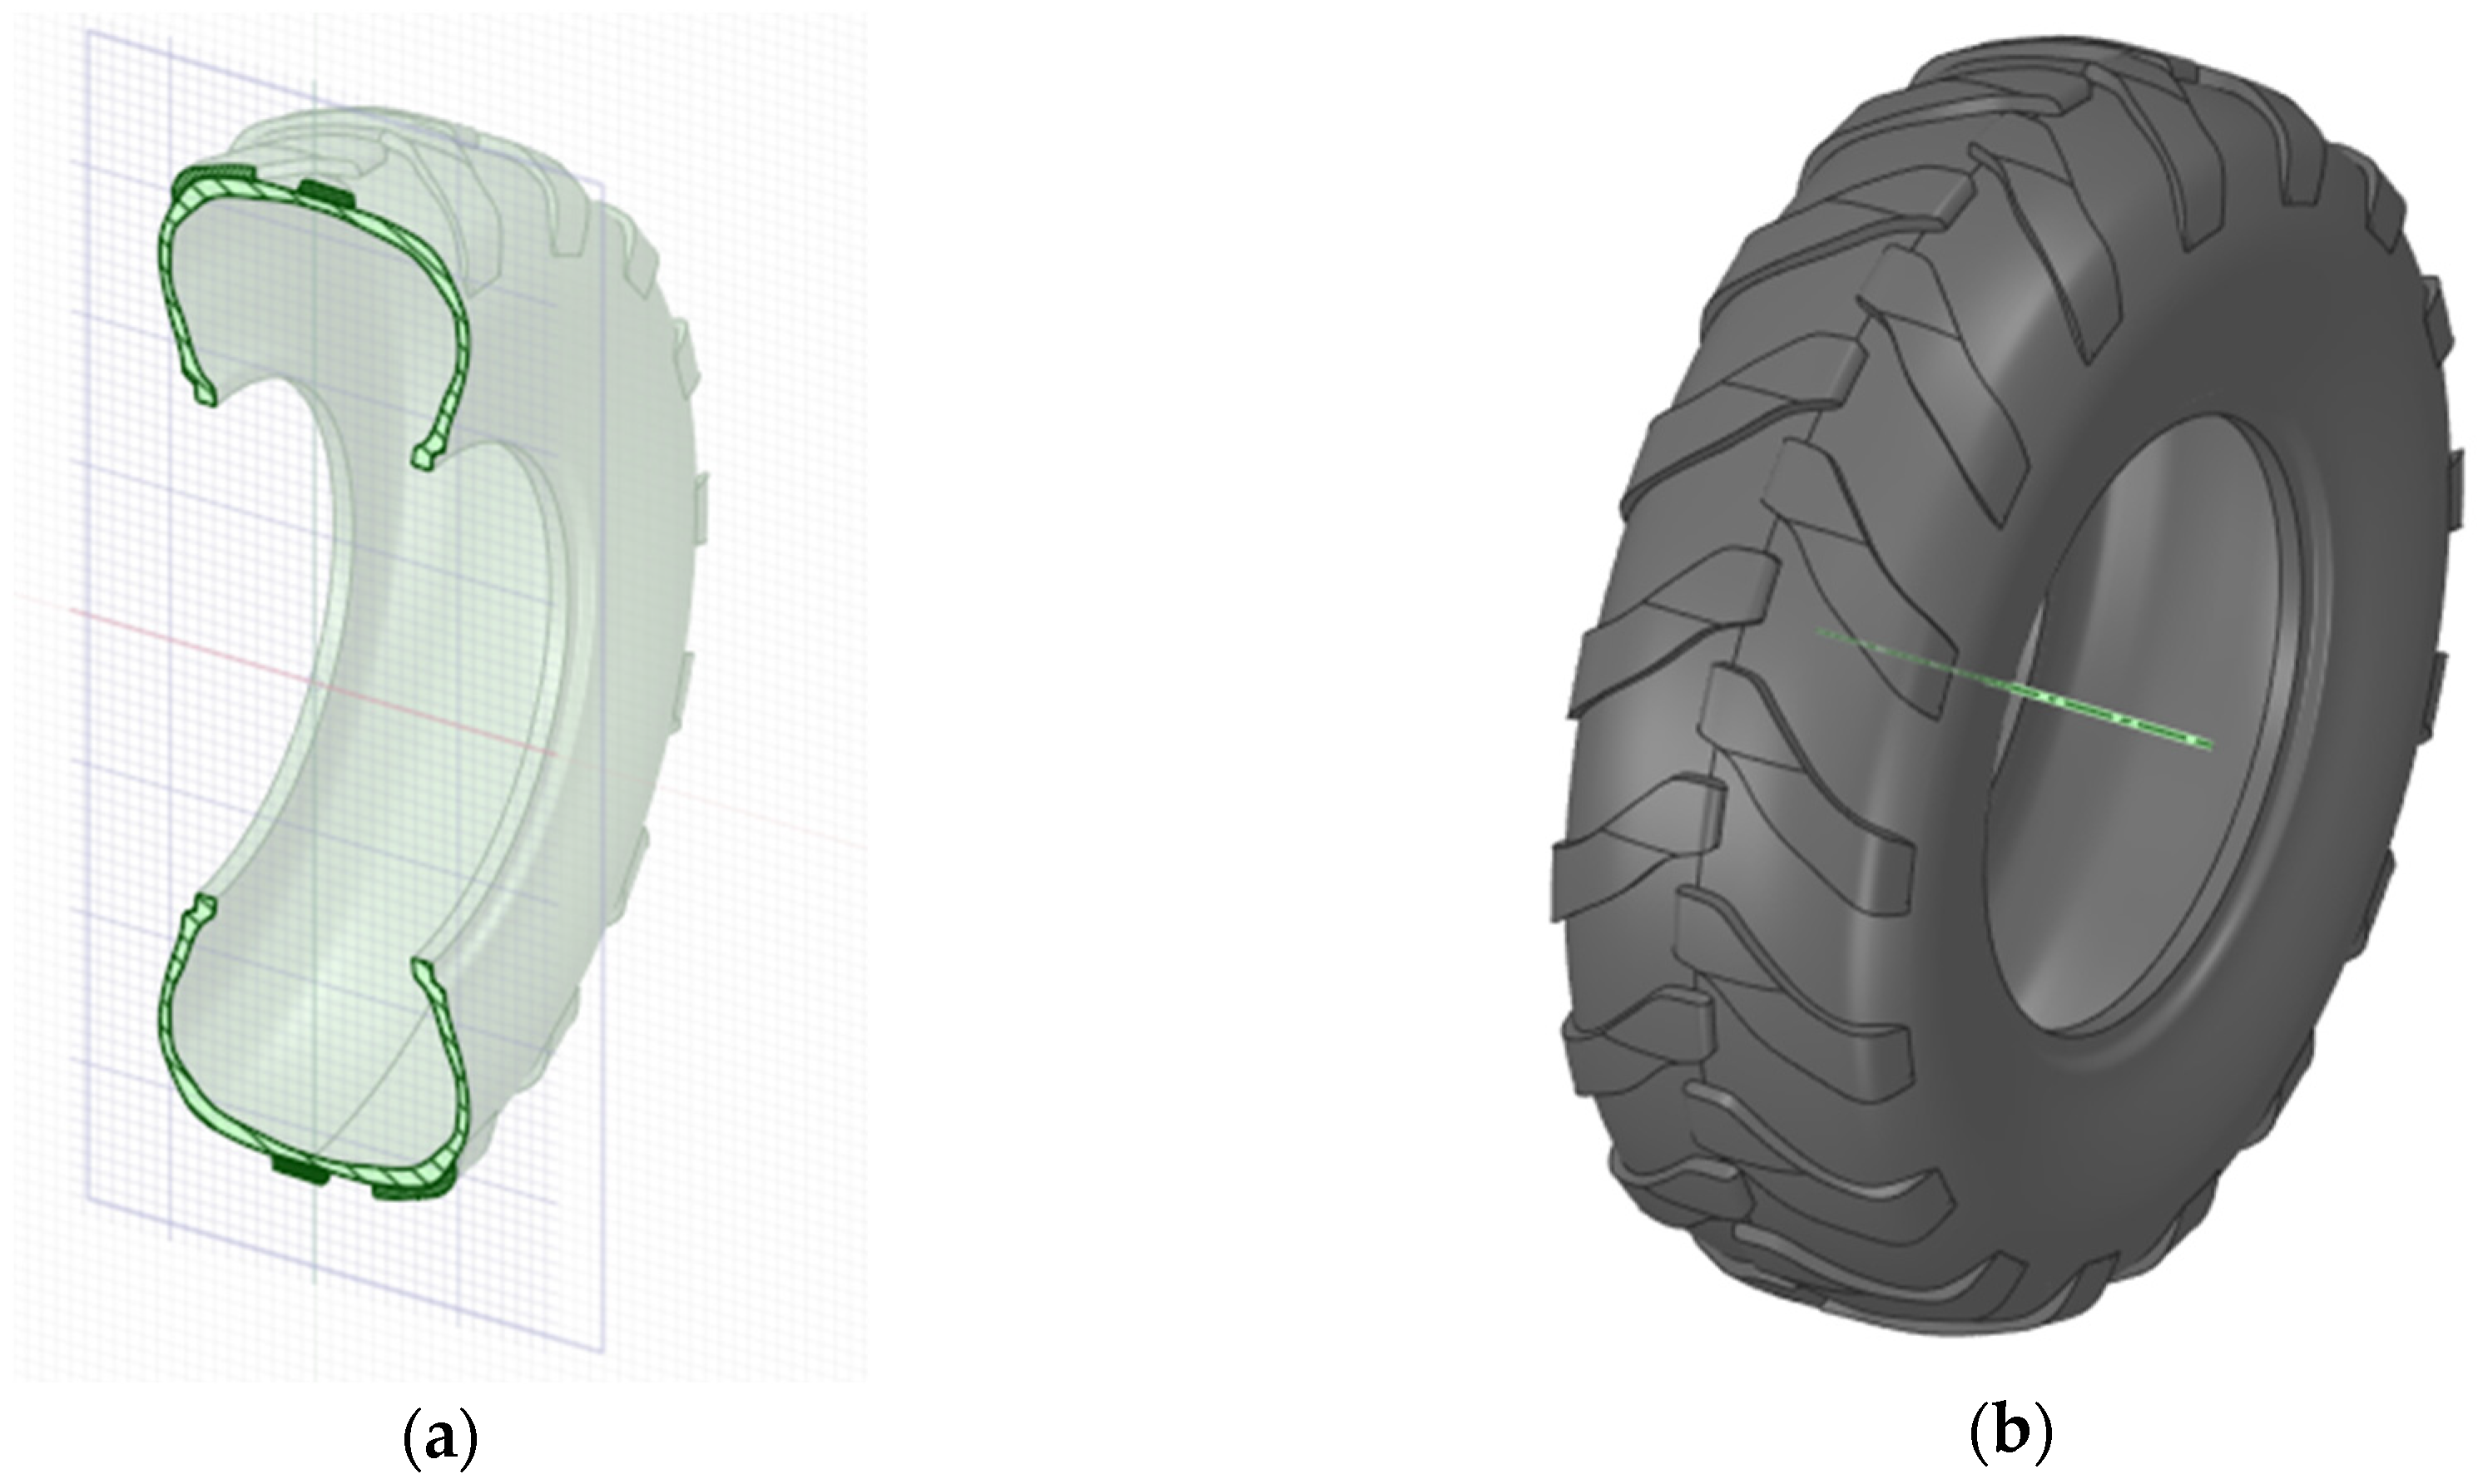
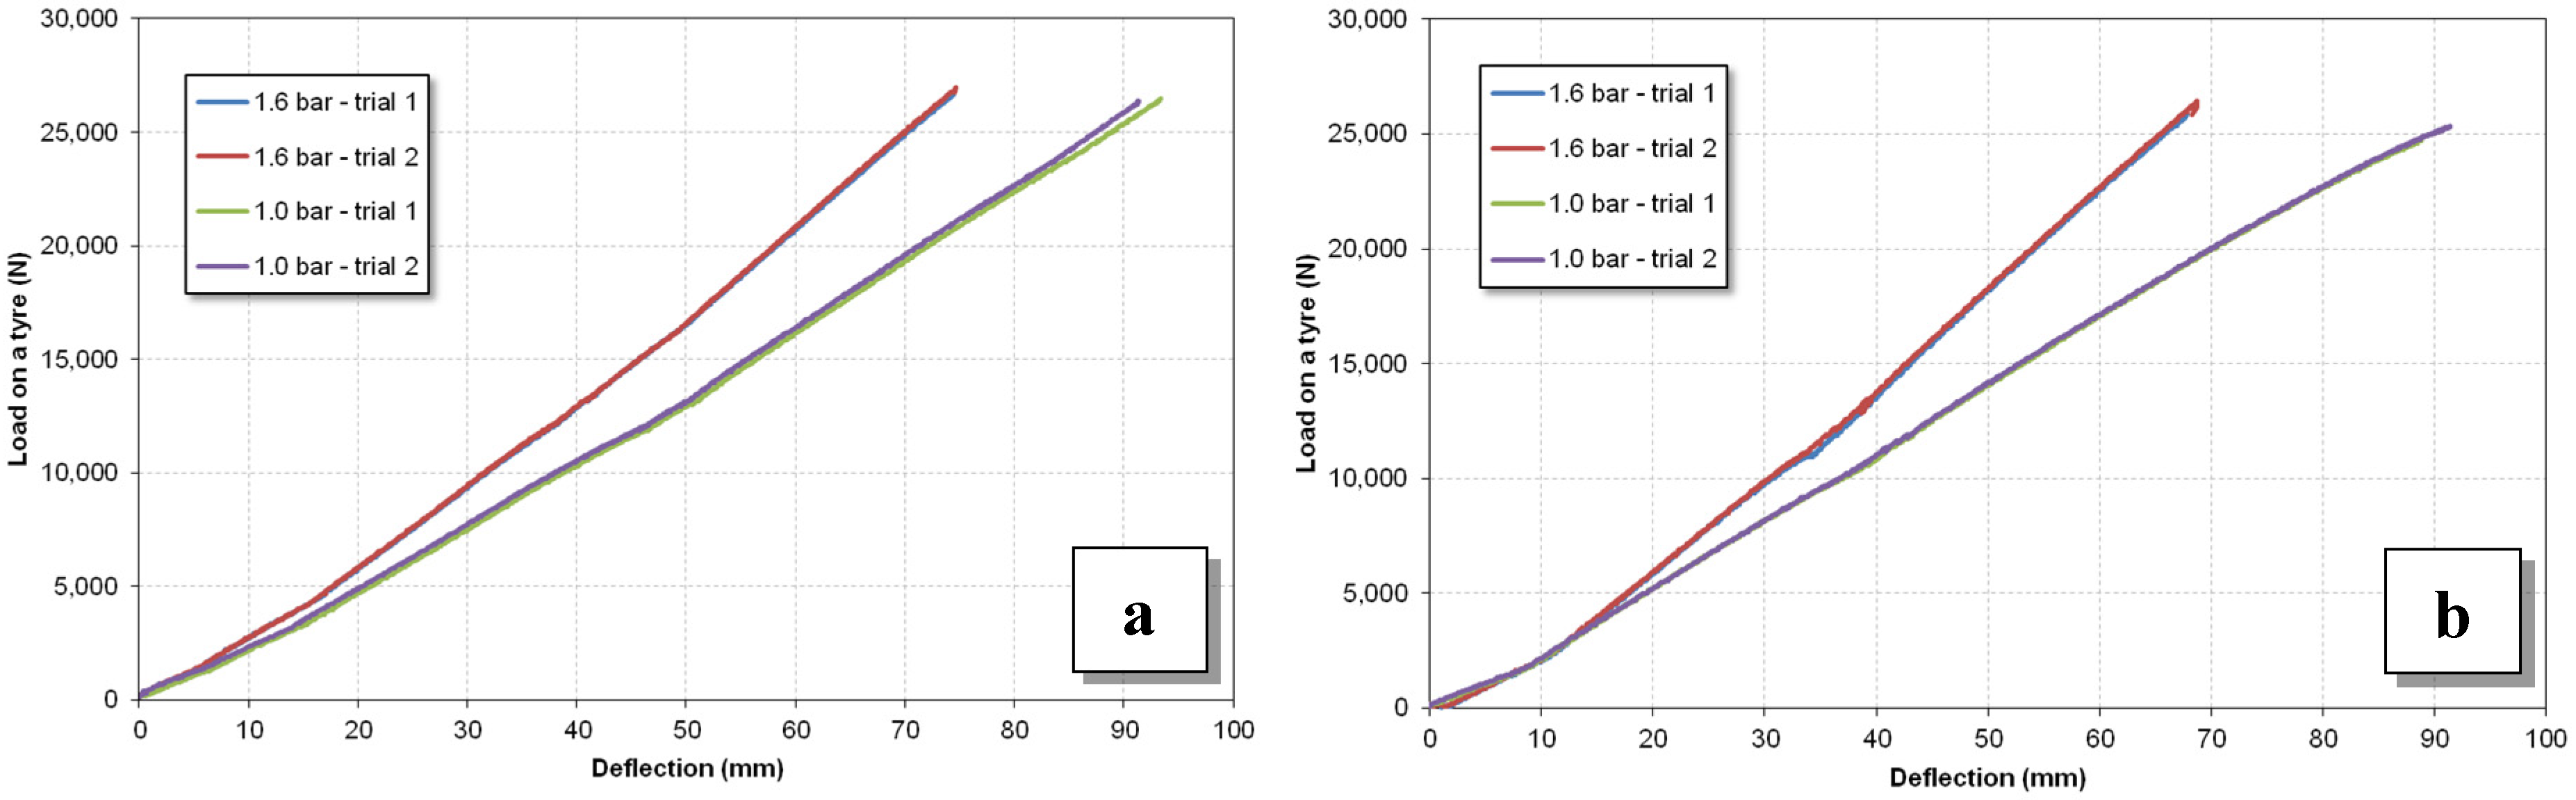
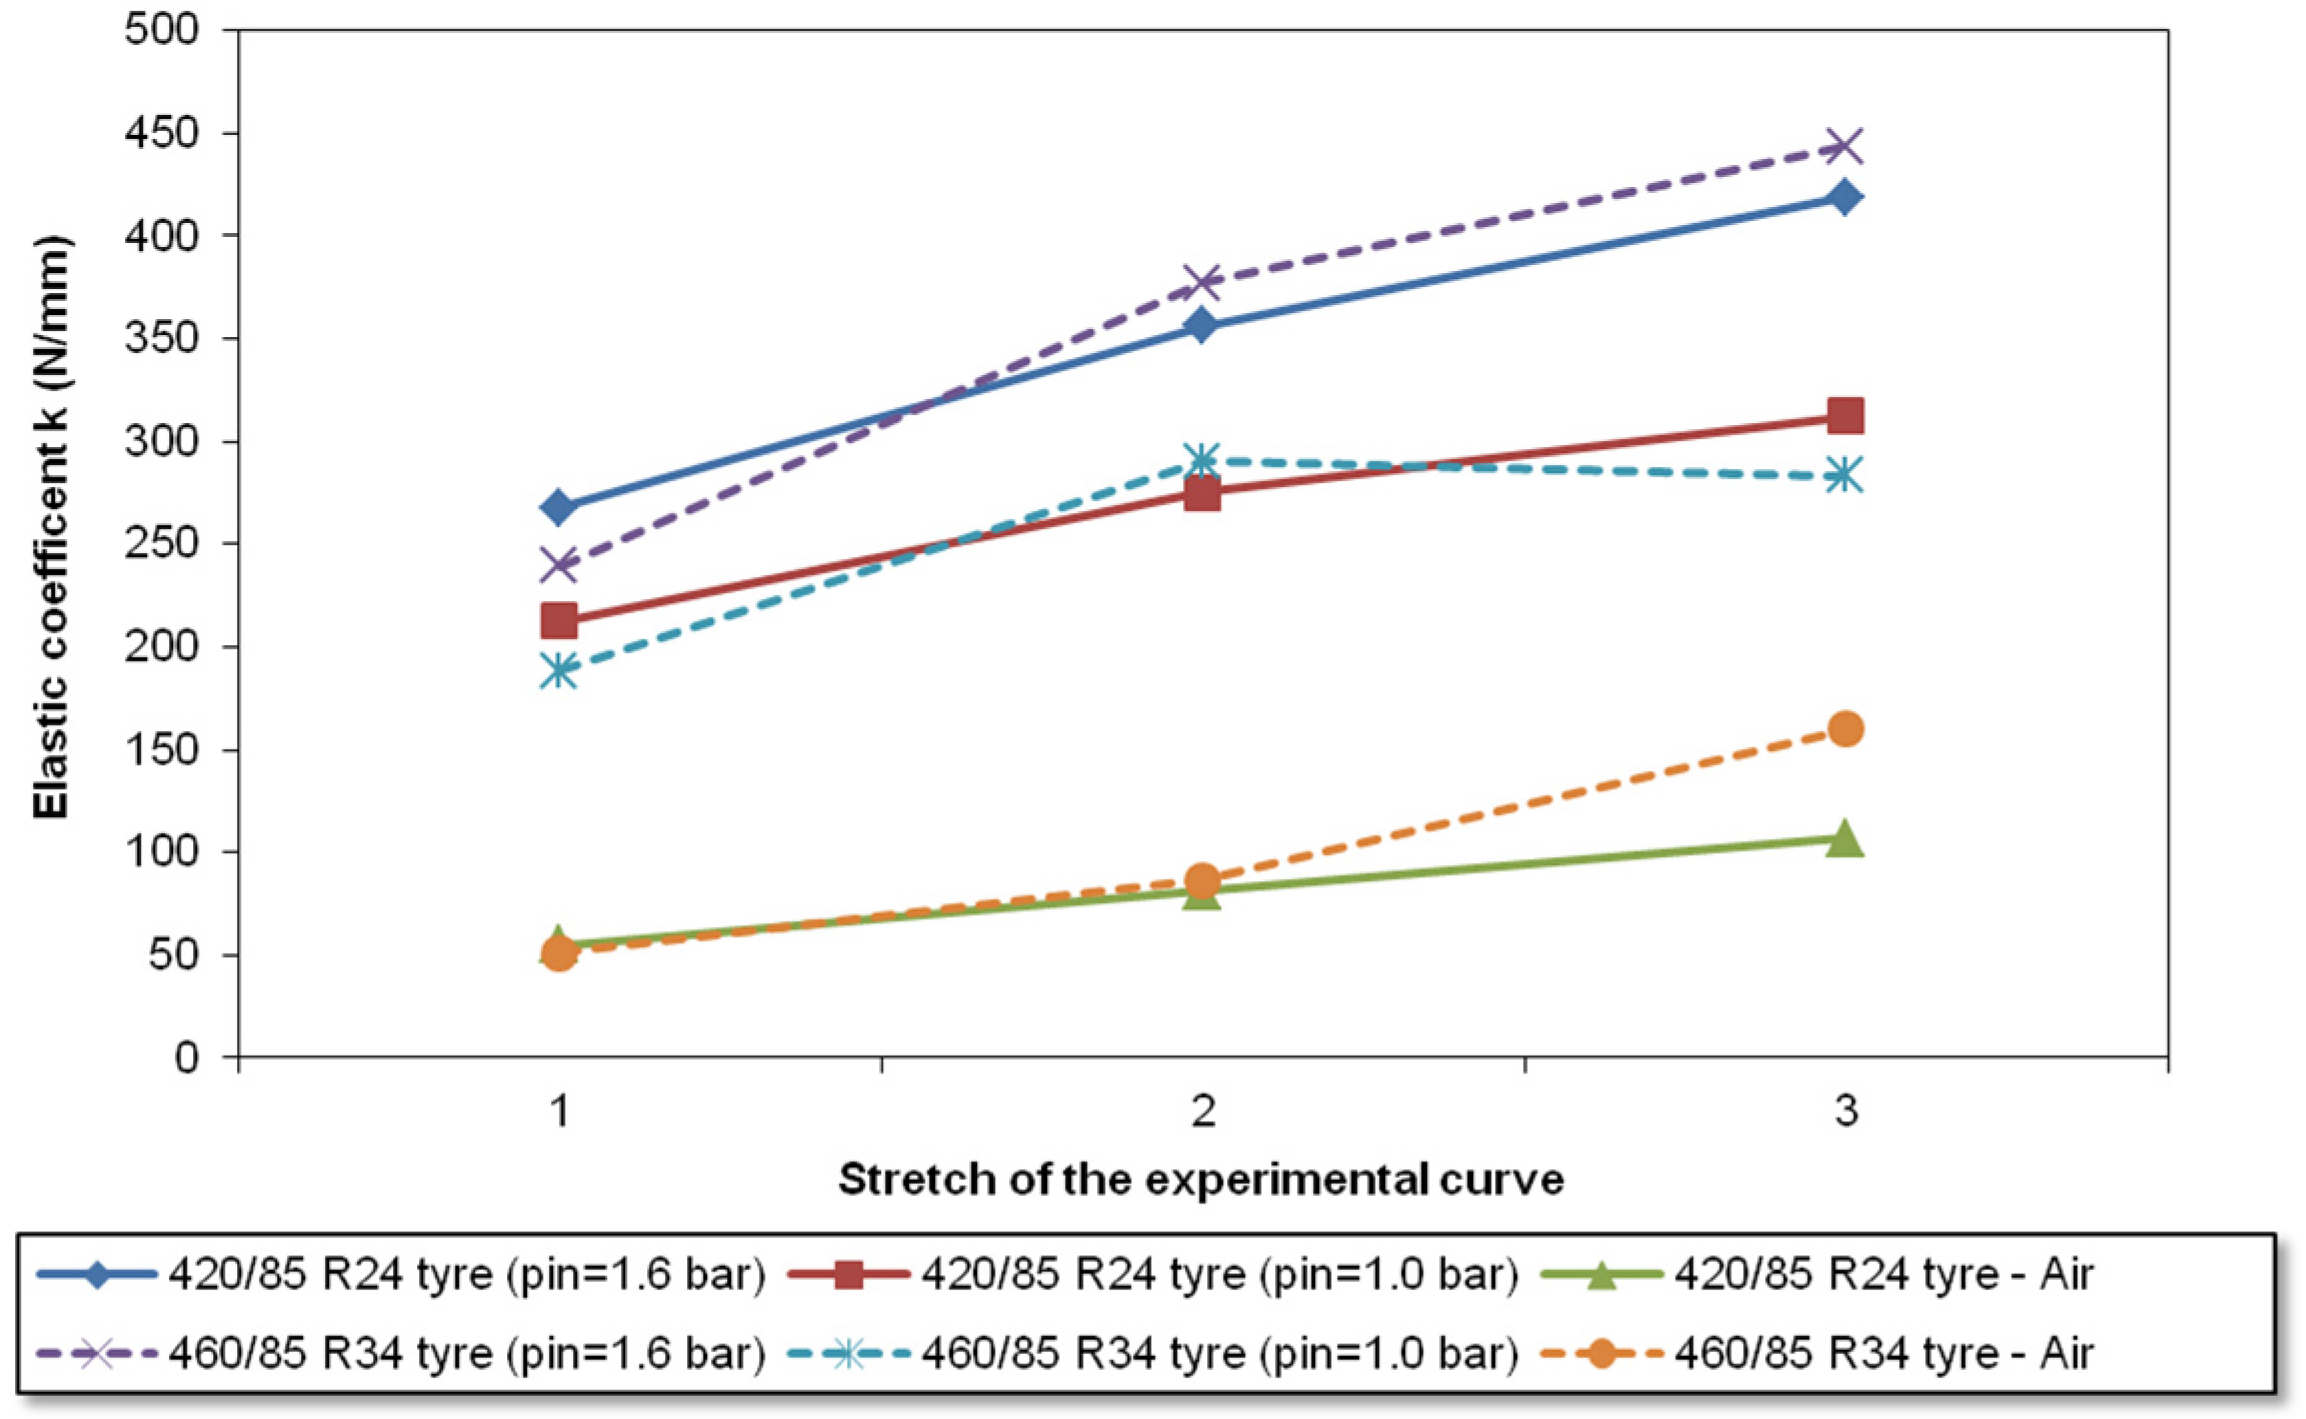
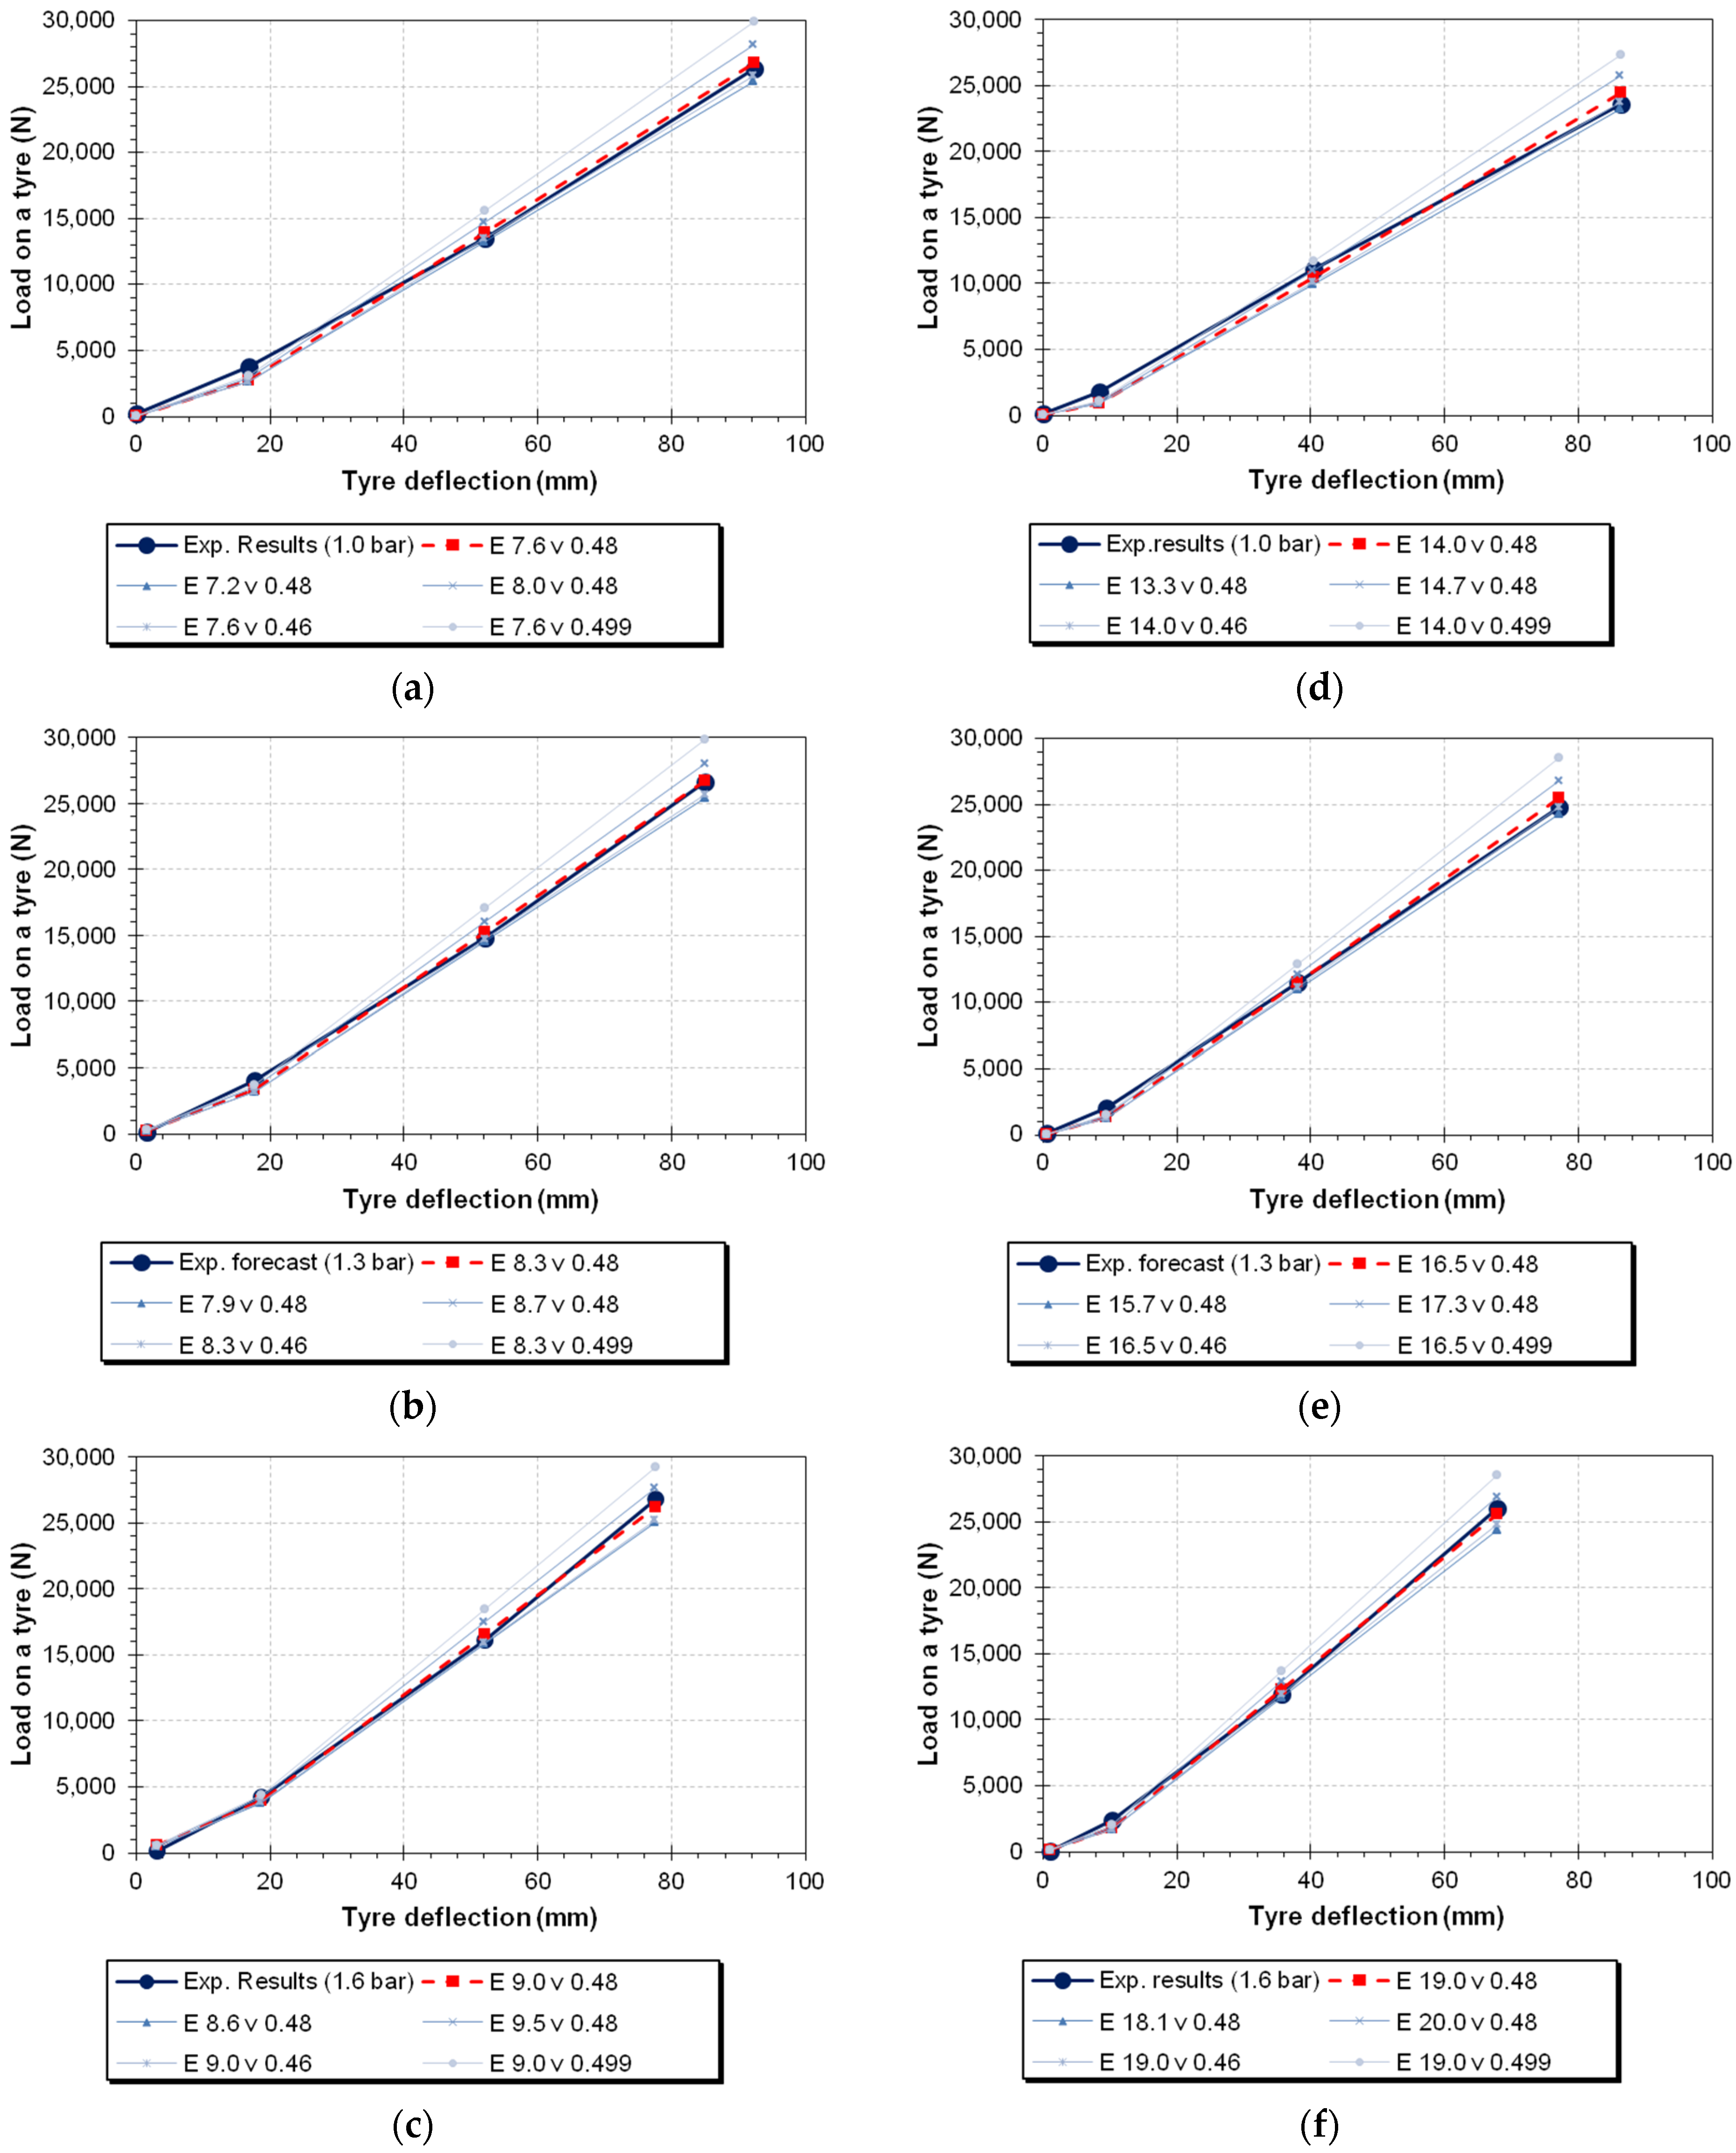
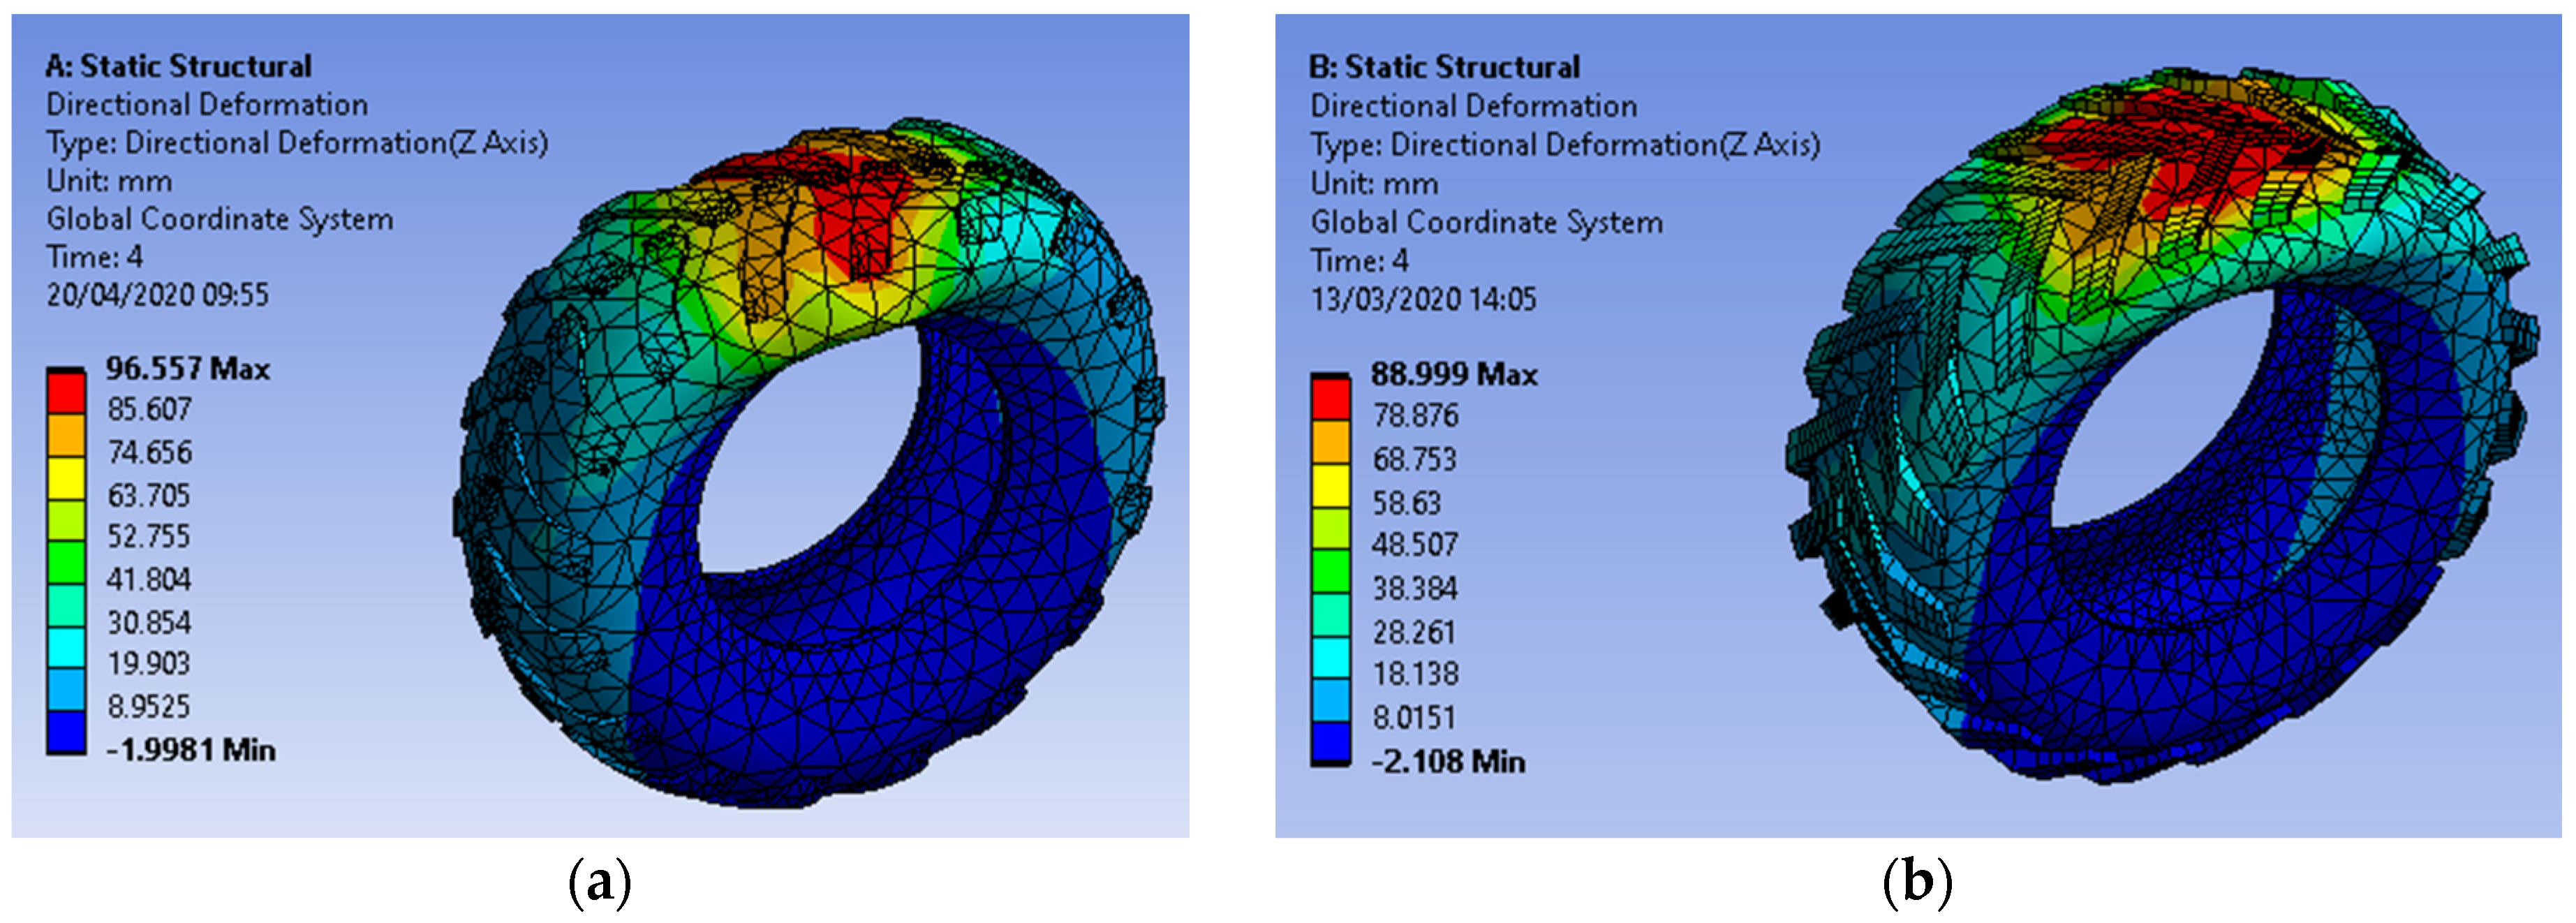
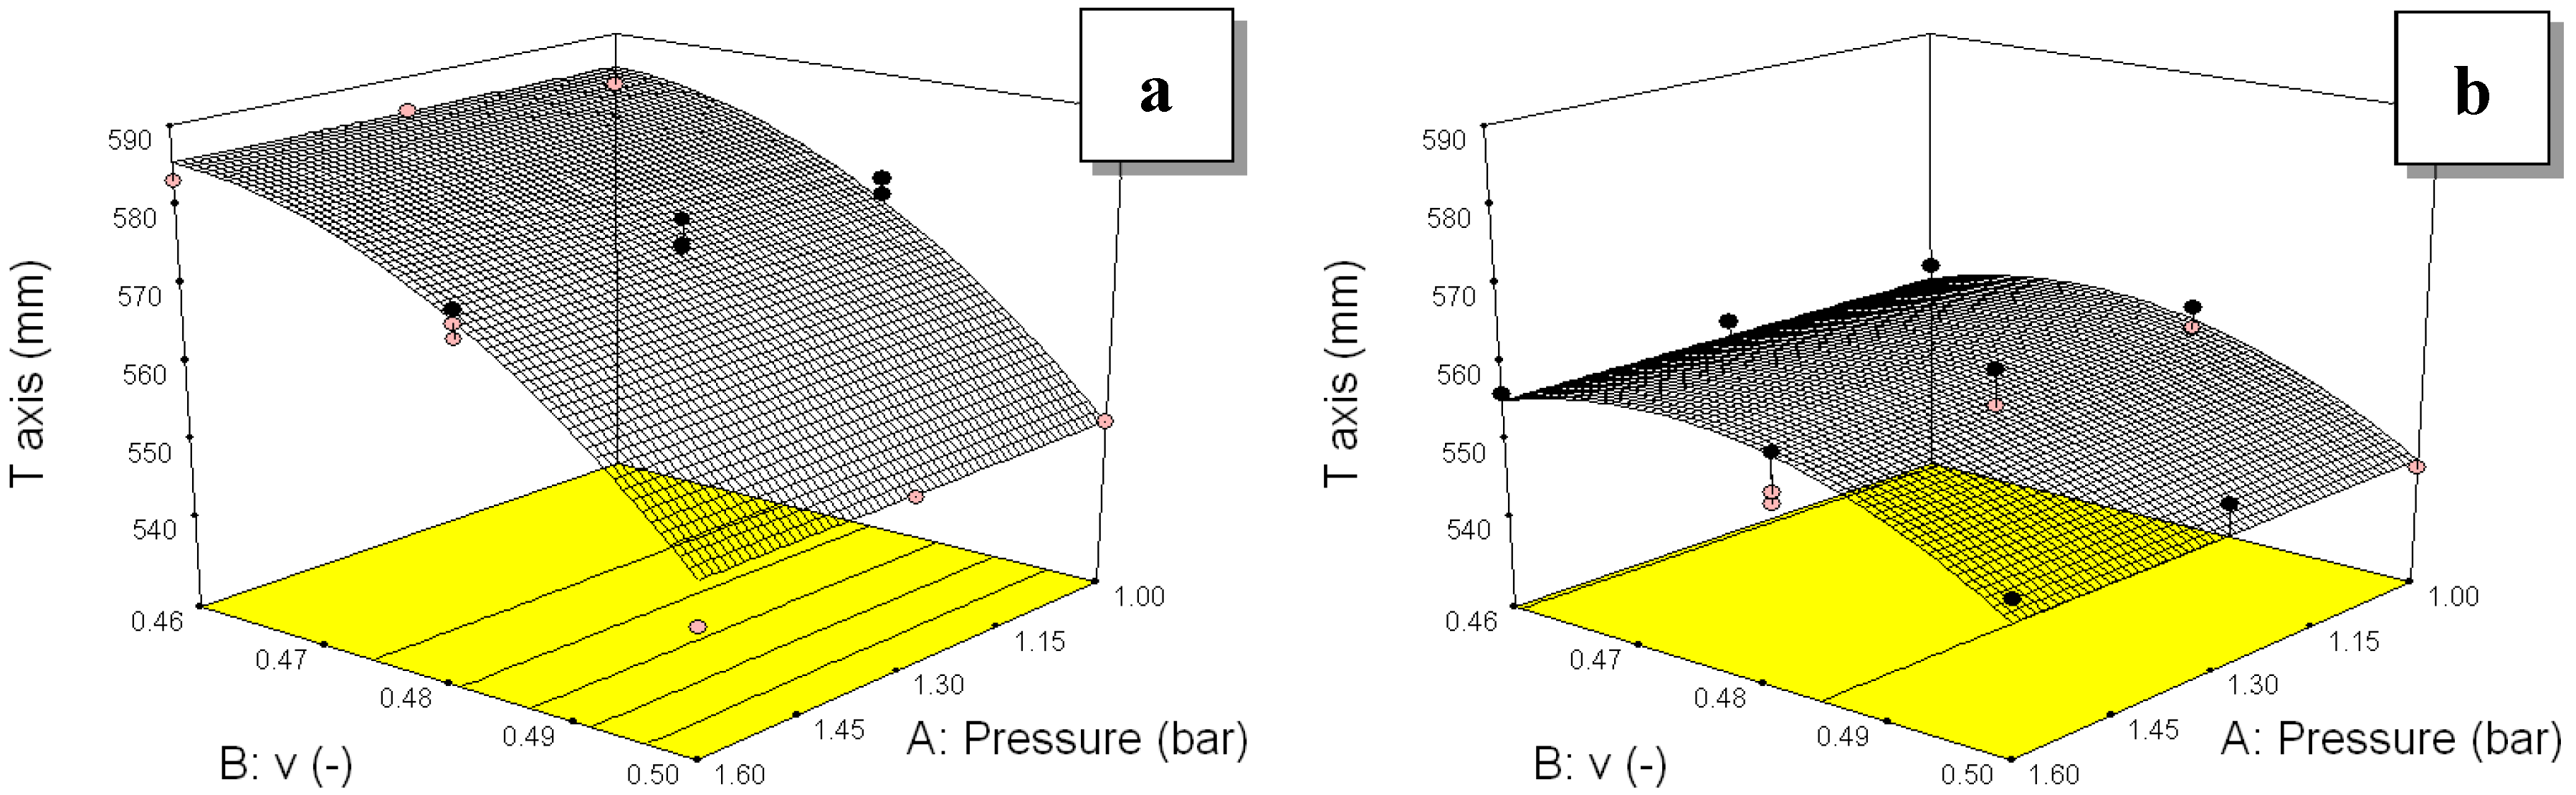
The aim of this work is to study the elastic behaviour of an agricultural tractor tyre under a vertical load to identify which physical parameters (inflation pressure, mechanical characteristics of the tyre, geometry and dimensions) most influence the overall elastic coefficients of the tyre. In addition, the mathematical development of the global elastic force-vertical displacement response has been investigated to determine whether this development can be considered linear, linear in stretches or non-linear. In particular, the proposed approach does not require any preliminary destructive inspection of the tyre structure and it is based on the vertical elastic characterisation of the tyre in the laboratory, the mathematical statistical analysis of the tyre elastic coefficients and the subsequent creation of an FE model to develop a structurally-homogeneous three-dimensional model which exhibits the same deformation of the corresponding real system (i.e., the same flattening). Such a tuned model is useful for predicting the main footprint dimensions and for any simulation including this elastic medium, e.g., to foresee the soil compaction or calculate the attitude of a vehicle on uneven or inclined grounds. Finally, the response surface methodology was applied to find two mathematical regression models by means of ANOVA tests, useful in studying the variations of the tyre footprint dimensions while varying the tyre type.

2. Materials and Methods

In this study, a mixed experimental–numerical approach was proposed: after some experimental trials, a simplified FE model of the tyre (i.e., structurally homogeneous, without the subparts present in real tyres) was iteratively tuned by acting on the material properties (Young’s modulus—E, Poisson’s ratio—ν). By doing so, it was possible to find two values (for E and ν) that include the contribution of all the different parts that compose the tyre, not all made of rubber. The application of the proposed methodology led to the definition of the above-mentioned elastic coefficients on two different tyres. A sensitivity analysis on Young’s modulus and on Poisson’s ratio was carried out. Thanks to the same FE model, it was also possible to verify a hypothesis of linearity of the flattening varying the pressure between the two operating limits investigated experimentally (1.0 bar, 1.6 bar), simulating the vertical loading of a tyre inflated at 1.3 bar, and the linearity of the deflections of the FE model varying its elastic coefficients, using elastic coefficients derived from the coefficients at 1.0 bar and 1.6 bar. Moreover, it was also possible to calculate the maximum longitudinal and transversal dimensions of the footprint area on the ground, assuming an approximately elliptical shape, by varying the vertical load and the inflation pressure. Finally, the response surface methodology was applied to find two mathematical regression models, useful in studying the variations of the tyre footprint dimensions while varying type of tyre, inflation pressure and material properties.
The approach followed in this study to determine the elastic behaviour of an agricultural tractor tyre is shown in the flow diagram in Figure 1 and consists of three phases:
  • (Phase 1) “experimental phase” or “data generation and collection phase”; a series of experiments for the determination of vertical force-displacement diagrams of agricultural tyres were carried out on a full-scale vehicle (specifically, a farm tractor);
  • (Phase 2.1) “numerical phase” or “data interpretation phase”; the experimental data were suitably processed to highlight the tyre-flattening phenomenon trends and associate a characteristic value of the elastic coefficient;
  • (Phase 2.2) “simulation phase” or “virtual model tuning phase”; a three-dimensional model of a tyre was created, a static loading situation was applied and the coefficients that define the material were iteratively varied to have the simulation output aligned with what was found in the experimental tests.
All output parameters from phase 1 have been measured experimentally, whilst the parameters from Phase 2.1 have been calculated and those from Phase 2.2 have been derived from FE modelling.
Each phase corresponds to a series of activities, detailed in the following paragraphs.

2.1. Experimental Phase

The experimental measurement of the vertical stiffness of the tyres was carried out on two different agricultural tyres (see Table 1) and in two pressure conditions (100 kPa and 160 kPa, i.e., 1.0 bar and 1.6 bar), for a total of 4 different tyre-loading scenarios. The main characteristics of the tested tyres, which are stamped on the sidewalls of tyres using a technical information format compliant with ETRTO standard [41], are shown in Table 1. The indicated tyres have very different sizes and they have been chosen because each one can be considered as representative of a specific class of tyres usually equipping 4WD farm tractors (420/85 R24 for front tyres, 460/85 R34 for rear tyres).
In order to replicate the geometry with CAD software, the two indicated tyres were removed from their own rims and the transversal section was measured. As the tested tyres were worn, some of their dimensions differed from the nominal ones:
  • the 420/85 R24 tyre presented a radius index of 600 mm at 1.0 bar and of 602 mm at 1.6 bar with 1240 kgf of load;
  • the 460/85 R34 presented a radius index of 762 mm at 1.0 bar and of 765 mm at 1.6 bar with 1140 kgf of load.
The chosen load values for the elastic characterization spanned from 0 N (corresponding to an unladen tyre) to 23 kN (maximum load). The maximum load was chosen to be the same for the four samples and in order to reach at least 80% of the nominal load capacity indicated for the 460/85 R34 tyre. Two repetitions of the loading sequence were carried out in all four experimental cases.
The tyres were mounted on a “Laser 110 4WD” farm tractor by Same (Treviglio, Bergamo, Italy; [42]). The tractor was placed with the tyre to be tested over a weighing platform (M13 by Adda Bilance, Cassano d’Adda, MI, Italy) and a position transducer (PT1E by Celesco, Toronto, Canada) was connected with a cable to the wheel hub. The tractor axle with the tested tyre was lifted by a crane (ZKKE 16 t by Demag, Agrate Brianza, MB, Italy) in order to start in a condition of unloaded tyre. An acquisition system (DEWE-43A by Dewesoft, Roma, Italy) was set to start when the weight, measured by the platform, reached the value of 100 N. Once the tractor was completely released from the crane, the tractor rested on the floor (and hence, one of its wheel on the platform); an additional weight was then loaded on the axle of interest by pulling it down through a hydraulic cylinder (equipment developed by CREA-IT, Treviglio (BG), Italy) connected to the tractor hook. The load was applied with a medium speed of about 2 kN·s−1. The frequency of acquisition was set to 100 Hz. The experimental setup is reported in Figure 2.

2.2. Simulation Phase

The two tyres were modelled using finite elements after having obtained their geometries experimentally in the laboratory. All cross-section dimensions of the two tyres were measured and drawn in AutoCAD (by Autodesk, San Rafael, CA, USA). In particular, the cross-section of each tyre was measured at regular intervals of the tyre profile, thus allowing a careful 2D reconstruction of the shapes and of the thicknesses (Figure 3a). In addition, the lug sections of the tyres were also measured with respect to both the front view and the top view. Subsequently, the section drawn in AutoCAD was imported into SpaceClaim 2019 R3 (by Ansys, Canonsburg, Pennsylvania, USA). All tyre segments were chamfered with interpolation splines. The 3D models of the tyres were created from a revolution of each cross-section around the related tyre axis of rotation and the lug geometries were 3D-modelled separately and added as a matrix of objects (Figure 3b). As shown, the graphical comparison of the two images is very precise and the geometric model is very detailed and close to reality.
Figure 4 shows an example of one of the two tyres in section (Figure 4a), and the whole tyre (Figure 4b) as well. The model that is proposed is all-inclusive of all the components that make up a tyre, from the solid part of the rubber to the carcass, without modelling them separately. In the performed geometrical modelling, the smallest parts have not been considered and the level of detail, although quite high, has not dropped beneath geometries smaller than one centimetre, all this in order to simplify the subsequent calculation of deformations and stresses. However, the chosen geometric approximation does not generate any significant change in the tyre deformation characteristics compared to the actual geometry.
The tyre deformation configurations were simulated with Ansys Mechanical 2019 R3 software (Ansys, Inc., Canonsburg, PA, USA) using two models composed respectively of 21,130 nodes and 9381 tetrahedral elements for the 420/85 R24 tyre and 28,617 nodes and 8921 tetrahedral elements for the 460/85 R34 tyre. The strength of this work is the definition of a simplified model that can show the same deformations of the real physical system under the same loading conditions. To this end, the model of the tyre has been modelled as a homogeneous spatial continuum. Since the tyre internal belts and plies have not been modelled, a new material was defined in the FE software. The stress–strain curve was approximated with a linear trend similar to the low-strain Neo-Hookean model [43], and so it represents the simplest model that can be implemented. A quasi-static test was conducted [44]. Subsequently, the characteristics of the rubber were iteratively changed by trying to mediate the real conditions; thus, the texture and the metallic filaments, which are generally present in the tyre carcass, were also included in the elasticity parameters of the selected material. In particular, an average Poisson’s ratio of 0.48 was selected for all the tests [43] with different pressures and for both the tyres, in order to compensate for the presence of some metallic elements within the tyre mesh. Instead, the values of Young’s modulus were calculated for all the tests through a convergent iteration process so that the strain curve calculated with the FEM method coincided with the experimental one. For these reasons, the Poisson’s ratio and Young’s modulus set in the simulations can be properly named as equivalent Poisson’s ratio and equivalent Young’s modulus. Therefore, the proposed models are inclusive of all the materials that form a tyre, i.e., referring not only to the different solid parts that compose the tyre (e.g., the carcass) but also to the air that is contained within the tyre at different pressures for the different tests. Indeed, it was considered as a variation of Young’s modulus of elasticity. In other words, an increase in tyre inflation pressure was matched by an increase in Young’s modulus of the tyres.
Thanks to these FE models, it was possible to estimate the main dimensions of the tyre footprints (a major longitudinal axis, along the median plane of the tyre, and a minor transversal axis, along a plane containing the rotation axis of the tyre). Then, these values obtained from the FEM simulations were processed by using specific statistical software (Design-Expert 7.0.0 by Stat-Ease, Minneapolis, MN, USA). After a preliminary analysis of variance (ANOVA) aimed at highlighting the parameters of influence (factors) on the two tyre footprint dimensions (responses), a subsequent application of the response surface methodology (RSM) allowed the formulation of a polynomial interpolation model (with selected coefficients) fitting the FEM data [45]. This model has a mathematical form that is completely independent of the physics of the represented process, being mainly oriented to obtain a reliable prediction-capability for the models within the validity domains of the factors. For this reason, the explicit polynomial regression-functions obtained in this way can be used to study the trend of the real unknown function varying the factors [46,47,48,49,50,51].

3. Results and Discussion

3.1. Influence of the Physical Parameters on the Tyre Global Coefficient of Elasticity

3.1.1. Experimental Data Processing

Experimentally, the flattening (or, more precisely, the deflection) of a tyre is a quantity derived from the application of a load, and therefore, strictly speaking, a possible representation should have the applied load in abscissa and the deflection in ordinate. However, a representation was chosen with the axes exchanged with respect to the above statement (deflection in abscissa, load in ordinate; Figure 5), as it is more similar to the one usually given for elastic systems (springs, deformed materials). The elastic coefficients calculated from these data, therefore, have the usual graphic meaning of the (average or instantaneous) values of the slope of the deformation curves.
Observing the trend and the value of the first derivative, each load–deflection curve was divided into three stretches, each characterised by a substantially-constant slope of the curve related to the loading process. For each stretch, identified by a couple of points in the Cartesian load–deflection plane, the interpolation line at the least squares was calculated, and its linear coefficient (in N·mm−1) was then indicated as the elastic coefficient k related to that stretch of the experimental curve (Table 2).
The linear interpolation perfectly fits the three stretches of the load–deflection curves, as the minimum values of the R2 coefficient are all very high: 0.997 (420/85 R24, 1.0 bar), 0.998 (420/85 R24, 1.6 bar), 0.997 (460/85 R34, 1.0 bar), 0.997 (460/85 R34, 1.6 bar).
All the curves of Figure 5 show a hardening behaviour, i.e., the angular coefficient (i.e., the elastic coefficient k) of their three stretches increases as the deformation progresses. This is probably due to the progressive involvement of different parts of the tyre as the tyre flattens, e.g., the side walls and the belts. This evidence can also be seen from the graph plotted in Figure 6, plotting the values of the average elastic coefficients in correspondence with the three stretches of the load–deflection curves.
By comparing the deflections at two different air pressures, it is also possible to evidence the contribution of the air in sustaining part of the vehicle load. In particular, the air acts like a pneumatic spring that is in parallel with the rubber and the carcass (belt and body plies, i.e., radial cords) forming the inner structure of the tyre. With a simple subtraction, it is, therefore, possible to evidence an elastic constant due to increment of the air pressure at the different values of displacement (i = 1 to 3; see also Table 3):
{ k 1 . 6 bar , i = k s t r u c t , i + k a i r , 1 . 6 bar , i k 1 . 0 bar , i = k s t r u c t , i + k a i r , 1 . 0 bar , i k 1 . 6 bar , i k 1 . 0 bar , i = k a i r , 1 . 6 bar , i k a i r , 1 . 0 bar , i
The results related to the air have also been plotted in Figure 6. The air contribution also shows the same hardening trend of the carcass: even if a constant air pressure is assumed, as the deflection continues, the footprint on the ground increases and an increasing force is needed to further press the tyre.
Finally, another observation can be formulated: both the tyres have similar elastic coefficients, witnessed by the points of Figure 6, that are very close to one another in correspondence to each stretch.

3.1.2. FE Simulation

From the analysis of the experimental data of the tests on both tyres at the two pressures of 1.0 bar and 1.6 bar, three linear stretches with different slope of the load–deflection curves were identified; for this reason, three stretch phases were implemented in the FE model in terms of extremal points. Under the hypothesis of linearity of the tyre deflections with the inflating pressure values, the load–deflection curve was calculated and plotted at the intermediate pressure of 1.3 bar between the two values used in the experiments.
The experimental deflections at each phase and at the pressures of 1.0 bar, 1.3 bar, and 1.6 bar were then applied to the FE models and the resulting forces on the anchorages of the internal circular crown of the tyres were calculated. The contact that occurs during the flattening of the tyres on a plane was simulated by taking into consideration four lugs for the 420/85 R24 tyre and six lugs for the 460/85 R34 tyre. For both the tyres, differential displacements were given to the lugs in order to simulate the contact that gradually affects different areas of the tyres. The final coefficients (Young’s modulus, Poisson’s ratio) resulting from the iterative tuning process of the FE models at 1.0 bar and 1.6 bar are shown in Table 4. Instead, Young’s modulus and Poisson’s ratio corresponding to the pressure of 1.3 bar were calculated by averaging the value of those coefficients at 1.0 bar and 1.6 bar, thus hypothesizing that a linear variation of elastic coefficients produces a linear variations of deflections.
The load–deflection curves with different Young’s moduli, Poisson’s ratios and inflation pressures (1.0 bar, 1.3 bar, 1.6 bar) resulting from the FEM simulations are represented in Figure 7. In the same figure, the experimental curves for both the tyres at 1.0 bar and 1.6 bar and the calculated curve at 1.3 bar are also reported for proper comparison with the FEM outputs.
The curve in blue is the experimental curve, whilst the curve in red is the curve calculated through the FE model. As can be seen, except for the initial section, the two curves are superimposed.
From the analysis carried out through the FE modelling, it can be seen that an increase of 0.3 bar (i.e., 0.03 MPa) in the tyre inflation pressure corresponds to an increase in Young’s modulus of 0.7 MPa and 2.5 MPa for the 420/85 R24 and 460/85 R34 tyres, respectively. This means that Young’s modulus of elasticity of the tyres is about 10 times more sensitive in the case of the 420/85 R24 tyre and about 100 times more sensitive in the case of the 460/85 R34 tyre to variations of the initial inflation pressure (1.0 bar, 1.3 bar, 1.6 bar) than Poisson’s ratio. It can, therefore, be concluded that a change in the inflation pressure of the tyre greatly influences the elastic response of the tyre.
In order to study the effect of the variation of Young’s modulus and Poisson’s ratio on tyre deformation and contact pattern, the stress–strain curves corresponding to a variation of ±5% of Young’s modulus and ±5% of Poisson’s ratio were also calculated and plotted in blue shading in Figure 7 based on the best fitting condition of the curves represented in red. As can be seen for both the tyres, a variation of −5% of these coefficients (Young’s, Poisson’s) does not generally lead to an excessive deviation of the curves with respect to the experimental curve. On the contrary, a variation of +5% of the two coefficients leads to a significant variation of the elastic response of the tyre, in some cases almost equal to 5000 N. This effect is visible above all for the Poisson’s ratio because, when it is incremented by +5%, its value is close to 0.50, i.e., the typical value for rubber.

3.2. Predictions of the Tyre Footprint Dimensions

3.2.1. FE-Simulation

Once the coincidence of the FE model tyre flattening under load has been verified for all the considered pressure values, the focus moved on to other parameters of interest provided by the model. Figure 8 shows an example of the deformation of the FE model of the tyre in the direction of the vertical axis (z) for the inflation pressure of 1.0 bar and for both the tyres. The z-axis coincides with the application direction of the force vector, i.e., the z-axis is perpendicular to the support plane. As shown in the figure, the tyre deflection involves a large part of the tyre itself and its effects interest almost the entire carcass. The tyres selected during the experimentation are worn tyres, well representing real operating conditions, and the geometries shown in the FE model are close to reality. The 420/85 R24 tyre has less wear and, therefore, higher lugs; this gives a reinforcement of the contact area and, hence, a lower concavity in the central area of the tyre contact footprint. On the contrary, since the lugs of the 460/85 R34 tyre are more worn, the central area of the contact footprint is more concave.
Figure 9 shows the 3D FE model of the contact pattern when the inflation pressure is 1.0 bar for both the tyres. The figures also show a graduated scale for measuring the contact area; in particular, the geometry of the contact mark can be approximated to an ellipse with the edges coinciding with the boundaries of the green zone (coinciding with the flat zone of the tyre deformed by the static loads). For each case, a major longitudinal axis (i.e., along the median plane of the tyre) and a minor transversal axis of the contact area (i.e., along a plane containing the rotation axis of the tyre) were identified. In general, the dimensions of the contact marks of the 420/85 R24 tyre reach about 675 mm for the longitudinal axis and 575 mm for the transversal axis, whilst for the 460/85 R34 tyre they are about 935 mm for the longitudinal axis and 558 mm for the transversal axis. The dimensions comply with the measurements made on the actual tyre during the compression test and are in accordance with the dimensions obtained from simulations and literature formulas [52]. Indeed, the size of the longitudinal axis of the contact pattern coincides with the size of the tyre semi-diameter in the absence of deformation. In addition, the contact pattern for both the tyres does not vary much when the inflation pressure varies.
The dimensions of the contact marks in correspondence with different values for Young’s modulus and Poisson’s ratio were then analysed, and the results of these comparisons on the different lengths of the contact marks are reported as a function of the two cited coefficients in Figure 10 (for readability only the results at the pressure of 1.0 bar are reported; the trend and the conclusions relevant to the other pressure setting are similar). In those figures, the longitudinal and transversal dimensions of the FEM footprint axis of the 420/85 R24 tyre with different equivalent Young’s moduli (E) and Poisson’s ratios (ν) are represented. In each graph, the two percentage variations of the dimensions on the longitudinal and transversal axes of the tyre contact pattern are shown as ±5% of the modulus of elasticity given by the best approximation condition, represented by the red curves in Figure 7.
In general, as shown by the graphs, a variation of ±5% in Young’s modulus of elasticity does not correspond to a significant variation in both the longitudinal and the transversal dimension of the contact area, although there is a considerable variation in the deflection force, as shown in Figure 7. On the contrary, the dimensions of the contact area are much more significant in the case of the variation of the equivalent Poisson’s ratio. An increase in Poisson’s ratio corresponds to an increase in the longitudinal dimension of the contact pattern and a decrease in the transversal dimension of the contact pattern. Therefore, it can be concluded that an increase in the amount of metal fibres inside the tyre causes a decrease in the longitudinal dimension of the contact area, leading to a change of the footprint shape from a flattened rectangular to a square shape. The effect is more pronounced for the 420/85 R24 tyre than for the 460/85 R34.

3.2.2. Experimental Data Processing

An ANOVA showed that any variation of Young’s modulus (i.e., of the tyre elasticity/stiffness) has no statistically-significant effect on the estimated longitudinal dimension of the tyre footprint (L axis), obtained from the FEM simulations. The factors of influence are (Table 5): tyre inflation pressure (numeric factor), Poisson’s ratio (numeric factor), and type of tyre (categorical factor).
Then, the RSM was applied to the FEM data to develop a numerical model of the longitudinal axis as a function of the tyre type, the inflating pressure (in bar), known from experimentation, and Poisson’s ratio, obtained from the simplified FE model at the end of the model-tuning process based on the experimental data. Starting from a quadratic model (in accordance with the analysis results), a multilinear model was obtained (through a backward elimination process). The polynomial model is represented graphically in Figure 11 and it is composed of two equations (p: tyre inflation pressure in bar; ν: equivalent Poisson’s ratio) which differ depending on the tyre type, as visible in the following Equation (2) (adjusted R2 > 0.99):
{ 420 / 85   R 24 :   L a x i s = + 532.2 22.4 p + 354.1 ν 460 / 85   R 34 :   L a x i s = + 796.4 22.4 p + 354.1 ν
The effect of an increase in Poisson’s ratio toward the value of 0.50 (perfectly incompressible solid) is to extend the longitudinal dimension of the tyre footprint. Vice versa, as the pressure increases, the longitudinal dimension of the footprint of both the tyres shortens, as expected. The type of tyre only has an influence on the intercept value (Figure 11). This is principally due to the fact that the longitudinal dimension of the tyre footprint is determined mainly by the radius index.
The same approach used for the longitudinal dimension of the tyre footprint was also followed for the transversal dimension (T-axis), obtained from the FEM simulations. The ANOVA showed that any variation of the inflation pressure and of Young’s modulus (i.e., on the tyre equivalent elasticity/stiffness) has no statistically significant effect on this dimension (Table 6). Both these parameters have the corresponding p-values above the threshold of 0.05. Therefore, the only factors of influence are Poisson’s ratio (numeric factor) and type of tyre (categorical factor).
Then, the RSM was applied to the FEM data to develop a numerical model of the transversal axis as a function of the tyre type and of Poisson’s ratio (obtained from the simplified FE model, as a result of the iterative process of tuning). This model is a quadratic model and it is represented graphically in Figure 12 and Figure 13; it is composed by two equations (ν: equivalent Poisson’s ratio) which differ depending on the tyre type (adjusted R2 = 0.96):
{ 420 / 85   R 24 :   T   a x i s = 2958.4 + 15636.6 ν 17247.7 ν 2 460 / 85   R 34 :   T   a x i s = 3253.4 + 16217.5 ν 17247.7 ν 2
In this case, the analysis proposed a quadratic model as being most appropriate for the fitting (the linear model presented an adjusted R2 = 0.85).
As visible from Equation (3) and the graphs, the effect of an increase in Poisson’s ratio toward the value of 0.50 (i.e., a perfectly incompressible solid) is slightly different for the two tyres:
  • for the smaller one (420/85 R24), an increase in Poisson’s ratio shortens monotonically (but non linearly) the transversal dimension of the tyre footprint, thus showing an opposite behaviour as compared to the other dimension;
  • for the bigger one (460/85 R34), after a very small increase until the value of 0.475, a further increase in the Poisson’s ratio has the effect of shortening the transversal dimension of the tyre footprint.
The type of tyre has an influence only on the value of the transversal dimension of the tyre footprint at a Poisson’s ratio of 0.46, i.e., in determining a different vertical starting point of the graphs in a Cartesian plane (Figure 12) or space (Figure 13); instead, the difference between the values reached by the two tyres in correspondence to a Poisson’s ratio of 0.50 is very small (about 6 mm).

4. Conclusions

The complexity of the mechanical behaviour of an agricultural tyre is responsible for the many practical difficulties met in gaining useful information using a purely-experimental approach. Conversely, a purely-numerical approach might not be viable unless a destructive inspection of the tyre is carried out, if the exact geometry and composition of its various parts (carcass, belts, plies) are unknown. For these reasons, this work proposes a mixed experimental–numerical approach: after experimental trials, a simplified FE model of the tyre, structurally-homogeneous, without any subparts, as present in real tyres, is iteratively tuned by acting on the material properties (Young’s modulus—E, Poisson’s ratio—ν). By doing so, it is possible to find two values (for E and ν) that include the contribution of all the different parts that compose the tyre. The proposed methodology was carried out on two different tyres at two different pressures. Results highlighted that Young’s modulus was seen to be highly variable with the inflation pressure p of the tyres. A sensitivity analysis on Young’s modulus and Poisson’s ratio was also carried out, resulting in a high sensitivity of the model deformations to variations of Young’s coefficient. Thanks to the FE model, it was also possible to verify a hypothesis of linearity of the flattening by varying the pressure between the two operating limits investigated experimentally (1.0 and 1.6 bar), thereby simulating the vertical loading of a tyre inflated at 1.3 bar. Moreover, it was also possible to calculate the longitudinal and transversal dimensions of the footprint area on the ground, assuming an approximately elliptical shape, varying the vertical load and the inflation pressure. An ANOVA on the same data evidenced that any variation of Young’s modulus has no statistically-significant effect on either of the dimensions, and the pressure is statistically-influent only on the tyre footprint longitudinal dimension. Finally, the response surface methodology was applied to find two mathematical regression models (one bilinear in p and ν for the longitudinal axis, one quadratic in ν for the transversal axis), useful for studying the variations of the tyre footprint dimensions while varying type of tyre, inflation pressure and material properties.

Author Contributions

Conceptualization, A.S.A., M.B., and M.C.; methodology, M.B.; software, A.S.A.; validation, M.C.; formal analysis, A.S.A. and M.B.; investigation, M.C.; resources, M.C.; data curation, A.S.A. and M.B.; writing—original draft preparation, A.S.A., M.B., and M.C.; writing—review and editing, A.S.A., M.B., and M.C.; visualization, A.S.A., M.B., and M.C.; supervision, A.S.A., M.B., and M.C.; project administration, A.S.A., M.B., and M.C.; funding acquisition, A.S.A., M.B., and M.C. All authors have read and agreed to the published version of the manuscript.

Funding

This work was supported by the Italian Ministry of Agriculture (MiPAAF) through the “AGROENER” project (D.D. n. 26329, 1 April 2016) and the “Traclas” project, within the framework of the “BRIC 2017” call funded by INAIL (Istituto Nazionale per l’Assicurazione contro gli Infortuni sul Lavoro—Italian National Institute for Insurance against Accidents at Work).

Acknowledgments

The authors wish to thank Ivan Carminati, Gianluigi Rozzoni, Alex Filisetti, Elia Premoli, and Davide Sfregola for their valuable help in carrying out the measurements.

Conflicts of Interest

The authors declare no conflict of interest. The funders had no role in the design of the study; in the collection, analyses, or interpretation of data; in the writing of the manuscript, or in the decision to publish the results.

Nomenclature

AbbreviationSignificance
2D, 3Dtwo-dimensional, three-dimensional (referred to a model)
ADASAdvanced Driver-Assistance Systems
Adjusted R2Adjusted coefficient of determination
ANOVAAnalysis of Variance
ETRTOEuropean Tyre and Rim Technical Organization
FEFinite-Element (referred to a model)
FEMFinite-Element Method
IFImproved Flexion (tyre)
MEMechanical Elastic (wheel)
p-valueProbability value, i.e., the evidence against a null hypothesis
RSMResponse Surface Methodology
VFVery High Flexion (tyre)
SymbolSignificance, units
EYoung’s modulus (MPa)
kElastic coefficient (N mm−1)
L axis, T axisLength of the tyre footprint measured along the longitudinal (transversal) axis (mm)
p(inflating) pressure (bar)
zVertical axis, perpendicular to the tyre support plane (in the frame of reference of the tyre)
νPoisson’s ratio (-)

References

  1. Cole, H.; Myers, M.; Westneat, S. Chores at Times of Fatal or Serious Injuries Associated with Tractor Overturns with and without Rollover Protection. Safety 2016, 2, 18. [Google Scholar] [CrossRef] [Green Version]
  2. Cutini, M.; Brambilla, M.; Bisaglia, C. Whole-Body Vibration in Farming: Background Document for Creating a Simplified Procedure to Determine Agricultural Tractor Vibration Comfort. Agriculture 2017, 7, 84. [Google Scholar] [CrossRef] [Green Version]
  3. Xiong, Y.; Tuononen, A. A laser-based sensor system for tire tread deformation measurement. Meas. Sci. Technol. 2014, 25, 115103. [Google Scholar] [CrossRef]
  4. Kurkauskas, V.; Janulevicius, A.; Pupinis, G. Air pressure in tires effects on slippage of tractors. Eng. Rural Dev. 2015, 14, 67–71. [Google Scholar]
  5. Kurkauskas, V.; Janulevicius, A.; Pupinis, G. Influence of inflation pressure in tires on traction ratio 2WD and 4WD driving modes of tractor. Eng. Rural Dev. 2016, 2016, 448–455. [Google Scholar]
  6. Kurkauskas, V.; Janulevičius, A.; Pupinis, G.; Damanauskas, V. Interaction between driving wheel and road surface of all wheeled driven tractor. Eng. Rural Dev. 2013, 12, 27–33. [Google Scholar]
  7. Damanauskas, V.; Velykis, A.; Satkus, A. Dependence of fuel consumption of medium power tractor on different soil and tire deformations. In Engineering for Rural Development; Latvia University of Agriculture: Jelgava, Latvia, 2017; Volume 16, pp. 515–520. [Google Scholar]
  8. Bulgakov, V.; Pascuzzi, S.; Santoro, F.; Anifantis, A. Mathematical Model of the Plane-Parallel Movement of the Self-Propelled Root-Harvesting Machine. Sustainability 2018, 10, 3614. [Google Scholar] [CrossRef] [Green Version]
  9. Bulgakov, V.; Pascuzzi, S.; Anifantis, A.S.; Santoro, F. Oscillations Analysis of Front-Mounted Beet Topper Machine for Biomass Harvesting. Energies 2019, 12, 2774. [Google Scholar] [CrossRef] [Green Version]
  10. Guerrieri, A.S.; Anifantis, A.S.; Santoro, F.; Pascuzzi, S. Study of a Large Square Baler with Innovative Technological Systems that Optimize the Baling Effectiveness. Agriculture 2019, 9, 86. [Google Scholar] [CrossRef] [Green Version]
  11. Anifantis, A.S.; Pascuzzi, S.; Scarascia-Mugnozza, G. Geothermal source heat pump performance for a greenhouse heating system: An experimental study. J. Agric. Eng. 2016, 47, 164–170. [Google Scholar] [CrossRef] [Green Version]
  12. Russo, G.; Verdiani, G.; Anifantis, A.S. Re-use of agricultural biomass for nurseries using proximity composting. Contemp. Eng. Sci. 2016, 9, 1151–1182. [Google Scholar] [CrossRef]
  13. Anifantis, A.; Canzio, G.; Cristiano, G.; De Lucia, B.; Russo, G.; Vecchietti, L.; Immirzi, B.; Malinconico, M.; Santagata, G. Influence of the Use of Drip Irrigation Systems and Different Mulching Materials on Ornamental Sunflowers in Greenhouse Cultivation. Acta Hortic. 2012, 952, 385–392. [Google Scholar] [CrossRef]
  14. Anifantis, A.S. Performance assessment of photovoltaic, ground source heat pump and hydrogen heat generator in a stand-alone systems for greenhouse heating. Chem. Eng. Trans. 2017, 58, 511–516. [Google Scholar]
  15. Popescu, S.; Boruz, S.; Glodeanu, M.; Alexandru, T.; Loghin, F. Contributions to development and testing of centralized control system of inflation pressure in agricultural tractor tyres according to soil and working conditions. In Engineering for Rural Development; Latvia University of Agriculture: Jelgava, Latvia, 2011; pp. 229–233. [Google Scholar]
  16. Kuncoro, C.B.D.; Sung, M.F.; Kuan, Y. Der Battery charger prototype design for tire pressure sensor battery recharging. Sensors 2019, 19, 124. [Google Scholar] [CrossRef] [Green Version]
  17. Zhu, B.; Han, J.; Zhao, J. Tire-pressure identification using intelligent tire with three-axis accelerometer. Sensors 2019, 19, 2560. [Google Scholar] [CrossRef] [PubMed] [Green Version]
  18. Edeskär, T. Technical and Environmental Properties of Tyre Shreds Focusing on Ground Engineering Applications; Luleå tekniska universitet: Luleå, Sweden, 2004. [Google Scholar]
  19. Tiwari, V.K.; Pandey, K.P.; Pranav, P.K. A review on traction prediction equations. J. Terramech. 2010, 47, 191–199. [Google Scholar] [CrossRef]
  20. Schreiber, M.; Kutzbach, H.D. Influence of soil and tire parameters on traction. Res. Agric. Eng. 2008, 54, 43–49. [Google Scholar] [CrossRef] [Green Version]
  21. Ronai, D.; Shmulevich, I. Tire footprint characteristics as a function of soil properties and tire operations. J. Terramech. 1995, 32, 311–323. [Google Scholar] [CrossRef]
  22. Roth, J.; Darr, M. Measurement of Normal Stresses at the Soil-Tire Interface. Trans. ASABE 2012, 55, 325–331. [Google Scholar] [CrossRef]
  23. Kenarsari, A.E.; Vitton, S.J.; Beard, J.E. Creating 3D models of tractor tire footprints using close-range digital photogrammetry. J. Terramech. 2017, 74, 1–11. [Google Scholar] [CrossRef]
  24. Jacke, H.; Ebel, A. Pressure distribution under forestry tyres. Landtechnik 2006, 4, 188–189. [Google Scholar]
  25. Pytka, J.; Dąbrowski, J.; Zając, M.; Tarkowski, P. Effects of reduced inflation pressure and vehicle loading on off-road traction and soil stress and deformation state. J. Terramech. 2006, 43, 469–485. [Google Scholar] [CrossRef]
  26. Braghin, F.; Genoese, A.; Sabbioni, E.; Bisaglia, C.; Cutini, M. Experimental Evaluation of Different Suspension Systems for Agricultural Vehicles through Four-Poster Test Bench. In Proceedings of the 11th Mini Conference on Vehicle System Dynamics Identification and Anomalies, VSDIA 2008, Budapest, Hungary, 10–12 November 2008; pp. 491–498. [Google Scholar]
  27. Melzi, S.; Negrini, S.; Sabbioni, E. Numerical analysis of the effect of tire characteristics, soil response and suspensions tuning on the comfort of an agricultural vehicle. J. Terramech. 2014, 55, 17–27. [Google Scholar] [CrossRef]
  28. Singh, K.B. Vehicle Sideslip Angle Estimation Based on Tire Model Adaptation. Electronics 2019, 8, 199. [Google Scholar] [CrossRef] [Green Version]
  29. Chen, T.; Chen, L.; Xu, X.; Cai, Y.; Jiang, H.; Sun, X. Estimation of Longitudinal Force and Sideslip Angle for Intelligent Four-Wheel Independent Drive Electric Vehicles by Observer Iteration and Information Fusion. Sensors 2018, 18, 1268. [Google Scholar] [CrossRef] [Green Version]
  30. Li, H.; Zhao, Y.; Lin, F.; Xu, H. Integrated yaw and rollover stability control of an off-road vehicle with mechanical elastic wheel. J. Vibroeng. 2019, 21, 450–471. [Google Scholar]
  31. Franceschetti, B.; Lenain, R.; Rondelli, V. Comparison between a rollover tractor dynamic model and actual lateral tests. Biosyst. Eng. 2014, 127, 79–91. [Google Scholar] [CrossRef]
  32. Melzi, S.; Sabbioni, E.; Vignati, M.; Cutini, M.; Brambilla, M.; Bisaglia, C.; Cavallo, E. Multibody model of fruit harvesting trucks: Comparison with experimental data and rollover analysis. J. Agric. Eng. 2018, 49, 92–99. [Google Scholar] [CrossRef] [Green Version]
  33. Asaf, Z.; Shmulevich, I.; Rubinstein, D. Predicting soil-rigid wheel performance using distinct element methods. Trans. ASABE 2006, 49, 607–616. [Google Scholar] [CrossRef]
  34. Keller, T. A Model for the Prediction of the Contact Area and the Distribution of Vertical Stress below Agricultural Tyres from Readily Available Tyre Parameters. Biosyst. Eng. 2005, 92, 85–96. [Google Scholar] [CrossRef]
  35. Mendoza-Petit, M.F.; Garcia-Pozuelo, D.; Diaz, V.; Olatunbosun, O. A strain-based method to estimate tire parameters for intelligent tires under complex maneuvering operations. Sensors 2019, 19, 2973. [Google Scholar] [CrossRef] [Green Version]
  36. Baranowski, P.; Bogusz, P.; Gotowicki, P.; Małachowski, J. Assessment of Mechanical Properties of Offroad Vehicle Tire: Coupons testing and FE model development. Acta Mech. Autom. 2012, 6, 17–22. [Google Scholar]
  37. Arif, N.; Rosu, I.; Elias-Birembaux, H.L.; Lebon, F. Characterization and Simulation of a Bush Plane Tire. Lubricants 2019, 7, 107. [Google Scholar] [CrossRef] [Green Version]
  38. Biris, S.S.; Ungureanu, N.; Maican, E.; Murad, E.; Vladut, V. Fem model to study the influence of tire pressure on agricultural tractor wheel deformations. In Engineering for Rural Development; Latvia University of Agriculture: Jelgava, Latvia, 2011; pp. 223–228. [Google Scholar]
  39. Mohsenimanesh, A.; Ward, S.M.; Owende, P.O.M.; Javadi, A. Modelling of pneumatic tractor tyre interaction with multi-layered soil. Biosyst. Eng. 2009, 104, 191–198. [Google Scholar] [CrossRef]
  40. Yu, M.; Wu, G.; Kong, L.; Tang, Y. Tire-pavement friction characteristics with elastic properties of asphalt pavements. Appl. Sci. 2017, 7, 1123. [Google Scholar] [CrossRef] [Green Version]
  41. ETRTO—European Tyre and Rim Technical Organisation. Standards Manual 2020; ETRTO—European Tyre and Rim Technical Organisation: Brussels, Belgium, 2020. [Google Scholar]
  42. SDF Group SAME Tractors. Available online: https://www.same-tractors.com/en-gb (accessed on 3 April 2020).
  43. Song, H.S.; Jung, S.P.; Park, T.W. Simulation of temperature rise within a rolling tire by using FE analysis. J. Mech. Sci. Technol. 2018, 32, 3419–3425. [Google Scholar] [CrossRef]
  44. Baranowski, P.; Malachowski, J.; Janiszewski, J.; Wekezer, J. Detailed tyre FE modelling with multistage validation for dynamic analysis. Mater. Des. 2016, 96, 68–79. [Google Scholar] [CrossRef]
  45. Montgomery, D.C. Design and Analysis of Experiments; Wiley: Hoboken, NJ, USA, 2013; Volume 2. [Google Scholar]
  46. Bietresato, M.; Sartori, L. Technical aspects concerning the detection of animal waste nutrient content via its electrical characteristics. Bioresour. Technol. 2013, 132, 127–136. [Google Scholar] [CrossRef]
  47. Bietresato, M.; Pavan, S.; Cozzi, G.; Sartori, L. A numerical approach for evaluating and properly setting self-propelled forage harvesters. Trans. ASABE 2013, 56, 5–14. [Google Scholar] [CrossRef]
  48. Bietresato, M.; Carabin, G.; Vidoni, R.; Mazzetto, F.; Gasparetto, A. A parametric approach for evaluating the stability of agricultural tractors using implements during side-slope activities. Contemp. Eng. Sci. 2015, 8. [Google Scholar] [CrossRef] [Green Version]
  49. Bortolini, L.; Bietresato, M. Effect of seed-beds on the cultivation of Radicchio (Cichorium intybus L., Rubifolium group). Contemp. Eng. Sci. 2016, 9. [Google Scholar] [CrossRef]
  50. Maheshwari, N.; Balaji, C.; Ramesh, A. A nonlinear regression based multi-objective optimization of parameters based on experimental data from an IC engine fueled with biodiesel blends. Biomass Bioenergy 2011, 35, 2171–2183. [Google Scholar] [CrossRef]
  51. Bietresato, M.; Caligiuri, C.; Bolla, A.; Renzi, M.; Mazzetto, F. Proposal of a Predictive Mixed Experimental- Numerical Approach for Assessing the Performance of Farm Tractor Engines Fuelled with Diesel- Biodiesel-Bioethanol Blends. Energies 2019, 12, 2287. [Google Scholar] [CrossRef] [Green Version]
  52. Rashidi, M.; Jaberinasab, B.; Ranjbar, I.; Akhtarkavian, S.; Fatehirad, P.; Rafiee, K. Modeling of Radial-Ply Tire Contact Length Based on Tire Dimensions, Inflation Pressure and Vertical Load and Rotational Speed. Agric. Environ. Sci 2014, 14, 116–124. [Google Scholar]
Figure 1. Approach followed for the computation of the mean characteristics for the schematisation of a tyre (including the concurrent behaviour of rubber and air).
Applsci 10 03481 g001
Figure 2. Experimental setup for the measurement of the elastic properties of the tyres: (1) Tested tyre (in this case: 460/85 R34); (2) transducer; (3) weighing platform; (4) crane rope; (5) hydraulic cylinder; (6) acquisition system (connected to the laptop on the right side of the photograph, used to store the data collected).
Applsci 10 03481 g002
Figure 3. Example of a cross section of a tyre (here: a 420/85 R24 tyre); (a) exported by AutoCAD and (b) modelled in Ansys SpaceClaim 2019 R3.
Applsci 10 03481 g003
Figure 4. 3D tyre section (in this case: 420/85 R24) modelled in Ansys SpaceClaim 2019 R3 (a) and in Ansys SpaceClaim 2019 R3 (b).
Applsci 10 03481 g004
Figure 5. Experimental load–deflection curves at two different inflating pressures: (a) 420/85 R24 tyre; (b) 460/85 R34 tyre. Two trials were performed for each case.
Applsci 10 03481 g005
Figure 6. Values of the average elastic coefficients in correspondence with the different stretches of the loading curves of the 420/85 R24 and 460/85 R34 tyres.
Applsci 10 03481 g006
Figure 7. FEM load–deflection curves with different equivalent Young’s moduli and Poisson’s ratios of the rubber in comparison with the experimental tyre curves for 420/85 R24 (ac) and 460/85 R34 (df): (a,d) tyre inflation pressure of 1.0 bar; (b,e) tyre inflation pressure of 1.3 bar; (c,f) tyre inflation pressure of 1.6 bar.
Applsci 10 03481 g007
Figure 8. 3D FEM vertical deformations in direction of compression load i.e., for 420/85 R24 (a) and 460/85 R34 (b) at the inflation pressure of 1.0 bar.
Applsci 10 03481 g008
Figure 9. Examples of simulation of the 3D FEM tyre footprint for 420/85 R24 (a) and 460/85 R34 tyres (b) at the inflation pressure of 1.0 bar.
Applsci 10 03481 g009
Figure 10. Longitudinal and transversal dimensions of the FEM footprint axis of the 420/85 R24 tyre with different equivalent Young’s moduli (E; column on the left) and Poisson’s ratios (ν; column on the right): (a) E ± 5%, inflation pressure of 1.0 bar; (b) ν ± 5%, inflation pressure of 1.0 bar; and of the 460/85 R34 (c) E ± 5%, inflation pressure of 1.0 bar; (d) ν ± 5%, inflation pressure of 1.0 bar.
Applsci 10 03481 g010
Figure 11. 3D representation of the interpolation models for the footprint longitudinal axis of the two tested tyres (a: 420/85 R24; b: 460/85 R34) as a function of Poisson’s ratio and tyre inflating pressure.
Applsci 10 03481 g011
Figure 12. 2D representation of the interpolation models for the footprint transversal axis of the two tested tyres (black line: 420/85 R24; red line: 460/85 R34) as a function of Poisson’s ratio and at three tyre-inflating pressures: (a) 1.0 bar; (b) 1.3 bar; (c) 1.6 bar. FEM results are also represented in the pictures as round points.
Applsci 10 03481 g012
Figure 13. 3D representation of the interpolation models for the footprint transversal axis of the two tested tyres (a: 420/85 R24; b: 460/85 R34) as a function of Poisson’s ratio and the tyre-inflating pressure.
Applsci 10 03481 g013
Table 1. Nominal characteristics of the tested tyres.
Tested Tyre DenominationLoad and Speed Index (ETRTO)Tread Width (mm)Radius Index (mm)Load Capacity (kgf @ 160 kPa)
420/85 R24137-A8/134-B4296252120
460/85 R34147-A8/144-B4677752800
Table 2. Values of the elastic coefficients in the three stretches of a loading curve in the two experimental trials for a 420/85 R24 tyre inflated with an initial pressure of 1.0 bar.
Tyre, Inflation PressureQuantityStretch 1Stretch 2Stretch 3
420/85 R24 1.0 bark (N·mm−1)212275312
load int. (kgf)19.4/386.4386.4/1381.21381.2/2694.4
defl. int. (mm)−0.1/−16.8−16.8/−52.1−52.1/−92.4
420/85 R24 1.6 bark (N·mm−1)268356419
load int. (kgf)16.0/430.6430.6/1645.51645.5/2735.2
defl. int. (mm)−3.1/−18.7−18.7/−52.1−52.1/−77.7
460/85 R34 1.0 bark (N mm−1)188290284
load int. (kgf)14.1/180.0180.0/11331133.0/2404.4
defl. int. (mm)−0.1/−8.4−8.4/−40.4−40.4/−86.5
460/85 R34 1.6 bark (N mm−1)240377444
load int. (kgf)8.5/239.6239.6/1219.11219.1/2653.0
defl. int. (mm)−1.1/−10.4−10.4/−35.7−35.7/−67.9
Table 3. Differences between the elastic coefficients at 1.0 bar and 1.6 bar in the three stretches of a loading curve in the two experimental trials for the two tyres (in N·mm−1), according to Equation (1).
TyreUnitStretch 1Stretch 2Stretch 3
Ave. ValuesAve. ValuesAve. Values
420/85 R24N·mm−15581107
460/85 R34N·mm−15186160
Table 4. Values of Young’s moduli and Poisson’s ratios for the finite elements method (FEM) simulations. The coefficients related to 1.0 bar and 1.6 bar were obtained by converging experimental and FEM results; the coefficients at 1.3 bar are the average between the coefficients at the other pressures.
Tyrep = 1.0 bar (ref.)p = 1.3 bar (+30%)p = 1.6 bar (+60%)
E (MPa)ν (-)E (MPa)ν (-)E (MPa)ν (-)
420/85 R247.6 (ref.)0.488.3 (+9.2%)0.489.0 (+18.4%)0.48
460/85 R3414.0 (ref.)0.4816.5 (+17.9%)0.4819.0 (+35.7%)0.48
Table 5. ANOVA on the values of the longitudinal dimension of the tyre footprint referred to the four possible factors of influence.
SourceSum of SquaresdfMean SquareF Valuep-Value Prob > F
Model5.253E + 00541.313E + 00519,853.24<0.0001
A-Pressure219.741219.7433.22<0.0001
B-E3.1213.120.470.4986
C-ν701.251701.25106.00<0.0001
D-Type21,813.541218,13.543297.38<0.0001
Residual165.39256.62
Cor Total5.255E + 00529
Table 6. ANOVA on the values of the transversal dimension of the tyre footprint referred to the four possible factors of influence.
SourceSum of SquaresdfMean SquareF Valuep-Value Prob > F
Model3650.524912.6320.80<0.0001
A-Pressure2.5912.590.0590.8102
B-E0.3110.317.018E−0030.9339
C-ν1507.5411507.5434.35<0.0001
D-Type76.75176.751.750.1980
Residual1097.122543.88
Cor Total4747.6429

