Abstract
The study shows the first results of the column-integrated water vapor retrieved by the new ZEN-R52 radiometer. This new radiometer has been specifically designed to monitor aerosols and atmospheric water vapor with a high degree of autonomy and robustness in order to allow the expansion of the observations of these parameters to remote desert areas from ground-based platforms. The ZEN-R52 device shows substantial improvements compared to the previous ZEN-R41 prototype: a smaller field of view, an increased signal-to-noise ratio, better stray light rejection, and an additional channel (940 nm) for precipitable water vapor (PWV) retrieval. PWV is inferred from the ZEN-R52 Zenith Sky Radiance (ZSR) measurements using a lookup table (LUT) methodology. The improvement of the new ZEN-R52 in terms of ZSR was verified by means of a comparison with the ZEN-R41, and with the Aerosol Robotic Network (AERONET) Cimel CE318 (CE318-AERONET) at Izaña Observatory, a Global Atmosphere Watch (GAW) high mountain station (Tenerife, Canary Islands, Spain), over a 10-month period (August 2017 to June 2018). ZEN-R52 aerosol optical depth (AOD) was extracted by means of the ZEN–AOD–LUT method with an uncertainty of ±0.01 ± 0.13*AOD. ZEN-R52 PWV extracted using a new LUT technique was compared with quasi-simultaneous (±30 s) Fourier Transform Infrared (FTIR) spectrometer measurements as reference. A good agreement was found between the two instruments (PWV means a relative difference of 9.1% and an uncertainty of ±0.089 cm or ±0.036 + 0.061*PWV for PWV <1 cm). This comparison analysis was extended using two PWV datasets from the same CE318 reference instrument at Izaña Observatory: one obtained from AERONET (CE318-AERONET), and another one using a specific calibration of the 940-nm channel performed in this work at Izaña Atmospheric Research Center Observatory (CE318-IARC), which improves the PWV product.
1. Introduction
Water vapor induces a strong positive feedback in the climate system [1]. It is the largest contributor to the natural greenhouse effect [2,3], has a key role in tropospheric dynamics and aerosol growth, and has a large temporal and spatial variability. Therefore, water vapor observation still presents a challenge to the scientific community. Precipitable water vapor (hereafter referred to as PWV) is a common variable to quantify atmospheric water vapor content in climatological studies and is defined as the column-integrated water vapor contained in a vertical column of a unit cross section extending between any two specified levels (generally from the Earth’s surface to the top of the atmosphere). The estimation of PWV with high temporal and spatial resolution is of great importance not only for climate change research [4,5,6], but also for the validation of satellite PWV measurements [7,8] and PWV estimates performed by numerical weather prediction (NWP) models, weather forecasting and the assimilation of PWV measurements in NWP models [9,10]. PWV can be monitored with high precision through microwave radiometer profilers (MWPs) [11], the Global Climate Observing System (GCOS) Reference Upper-Air Network (GRUAN) correction algorithm for the Vaisala RS92 radiosondes (GRUAN RS92) [12] or ground-based Fourier Transform Infrared (FTIR) spectrometers [13]. Less precise devices for PWV monitoring such as Vaisala RS92 [14] and RS41 [15] radiosondes, Global Navigation Satellite System (GNSS) receivers [16,17,18], sun/moon/star photometers [19,20,21,22,23] or spectroradiometers [24,25] allow us to expand the spatial coverage of the PWV measurements, but with a lower precision, ranging from 7% to 20% and decreasing under dry conditions [13].
As one of the most important radiative forcing agents in the climate system, atmospheric aerosols have been extensively studied in recent decades [26]. They modify the Earth’s radiation budget and the hydrological cycle through aerosol–radiation and aerosol–cloud interactions [27]. Aerosol optical depth (AOD) is the single most comprehensive variable to remotely assess the aerosol load of the atmosphere [28] and the most important aerosol-related parameter for radiative forcing studies [29].
The global and long-term AOD and PWV monitoring in the atmosphere can be assessed only by means of satellite measurements. However, their poor temporal resolution, with a single daily quantitative observation in most cases, is a strong limiting factor for AOD and PWV diurnal variation monitoring. Moreover, as [30] suggested, satellite AOD retrievals are subject to important uncertainties due to radiometric calibration, a priori assumed aerosol properties, cloud contamination and surface reflectivity. It is especially important that the latter effect is properly accounted for in the case of bright land surfaces like deserts. In this case, the low aerosol detectability of satellite sensors operating in the visible spectral range further complicate the estimation of the aerosol contribution where the main sources of aerosols are located. As a result, the large uncertainties associated with satellite products prevent their use for model assimilation near source regions.
Despite the fact that satellite remote sensing is the most convenient tool for providing a global perspective of aerosols and PWV, ground-based photometric techniques also play an important role in climate studies. They are especially valuable for validating satellite AOD and PWV products, as well as powerful tools for model assimilation and evaluation. Sun photometers were primarily designed to characterize aerosol loading by measuring atmospheric transmission in the visible and near-infrared spectral range using interference filters. However, sun photometers also appear as one of the most suitable ground-based techniques for estimating near-real PWV time with high spatial coverage [31,32] because of the relatively low cost and easy deployment of this type of instrument. These characteristics have allowed the establishment of several global and international networks of sun photometers in the past decades: the World Meteorological Organization (WMO) Global Atmosphere Watch Precision Filter Radiometer (GAW-PFR) network [33], the China Aerosol Remote Sensing NETwork, (CARSNET) [34], SKYNET [35] and the Aerosol Robotic NETwork (AERONET) [36]. In particular, AERONET is currently the most widespread ground-based network, providing accurate, standard, and consistent PWV, AOD and inversion products (such as aerosol size distribution and refraction indices) over hundreds of stations around the world. However, photometer networks have some drawbacks, as they cannot provide products under cloudy skies and, more importantly, the observation sites are not evenly distributed around the globe (they are strongly biased toward populated regions). The difficulties in operating these types of photometers limit the number of stations located near the most important aerosol areas, restraining the representativeness of these networks for constraining global and relatively coarse-resolution models [27].
We present, in this paper, the new ZEN-R52 zenith-looking narrow-band radiometer, an improved version of the ZEN-R41 prototype previously presented in [37]. This is a radiometer specifically designed to expand ground-based aerosol load and PWV observations in remote areas, filling the current observational gaps in the current ground-based networks and therefore improving the capability for satellite product validation and aerosol model evaluation and assimilation. The results are focused on the improvement of the new ZEN-R52 in terms of Zenith Sky Radiance (ZSR), in addition to the capabilities of the new ZEN system to provide AOD and PWV by means of measurements performed at the Izaña high-altitude station over a 10-month period (August 2017 to June 2018). As far as we know, apart from the two types of ZEN radiometers, the objects of this study, there are no other filter instruments based on relatively simple but robust ZSR measurements to obtain AOD and PWV.
The experimental facility, the instruments used in this study, the methodologies developed to determine AOD and PWV with the ZEN-R52, the CE318, and the FTIR, as well the quality control procedures applied to ZEN-R52 measurements have been described in Section 2. The main results of the quality control and cloud screening procedures, ZSR, AOD and PWV products of the ZEN-R52 radiometer, together with corresponding comparisons with other collocated reference instruments (CE318 and FTIR) are shown in Section 3. A summary of this study and the main conclusions are provided in the last Section.
2. Materials and Methods
2.1. Test Site
Radiometric measurements have been performed at Izaña Observatory (IZO; http://izana.aemet.es/). IZO is a high-mountain GAW station located in Tenerife (Canary Islands, Spain) at 28.31°N, 16.49°W, at an altitude of 2400 meters above sea level. IZO is managed by the Izaña Atmospheric Research Center (IARC) from the State Meteorological Agency of Spain (AEMET), and is a WMO Commission for Instruments and Methods of Observations (CIMO) Testbed for Aerosols and Water Vapor Remote Sensing Instruments. Further information on IZO’s facilities and its activities can be found in [38].
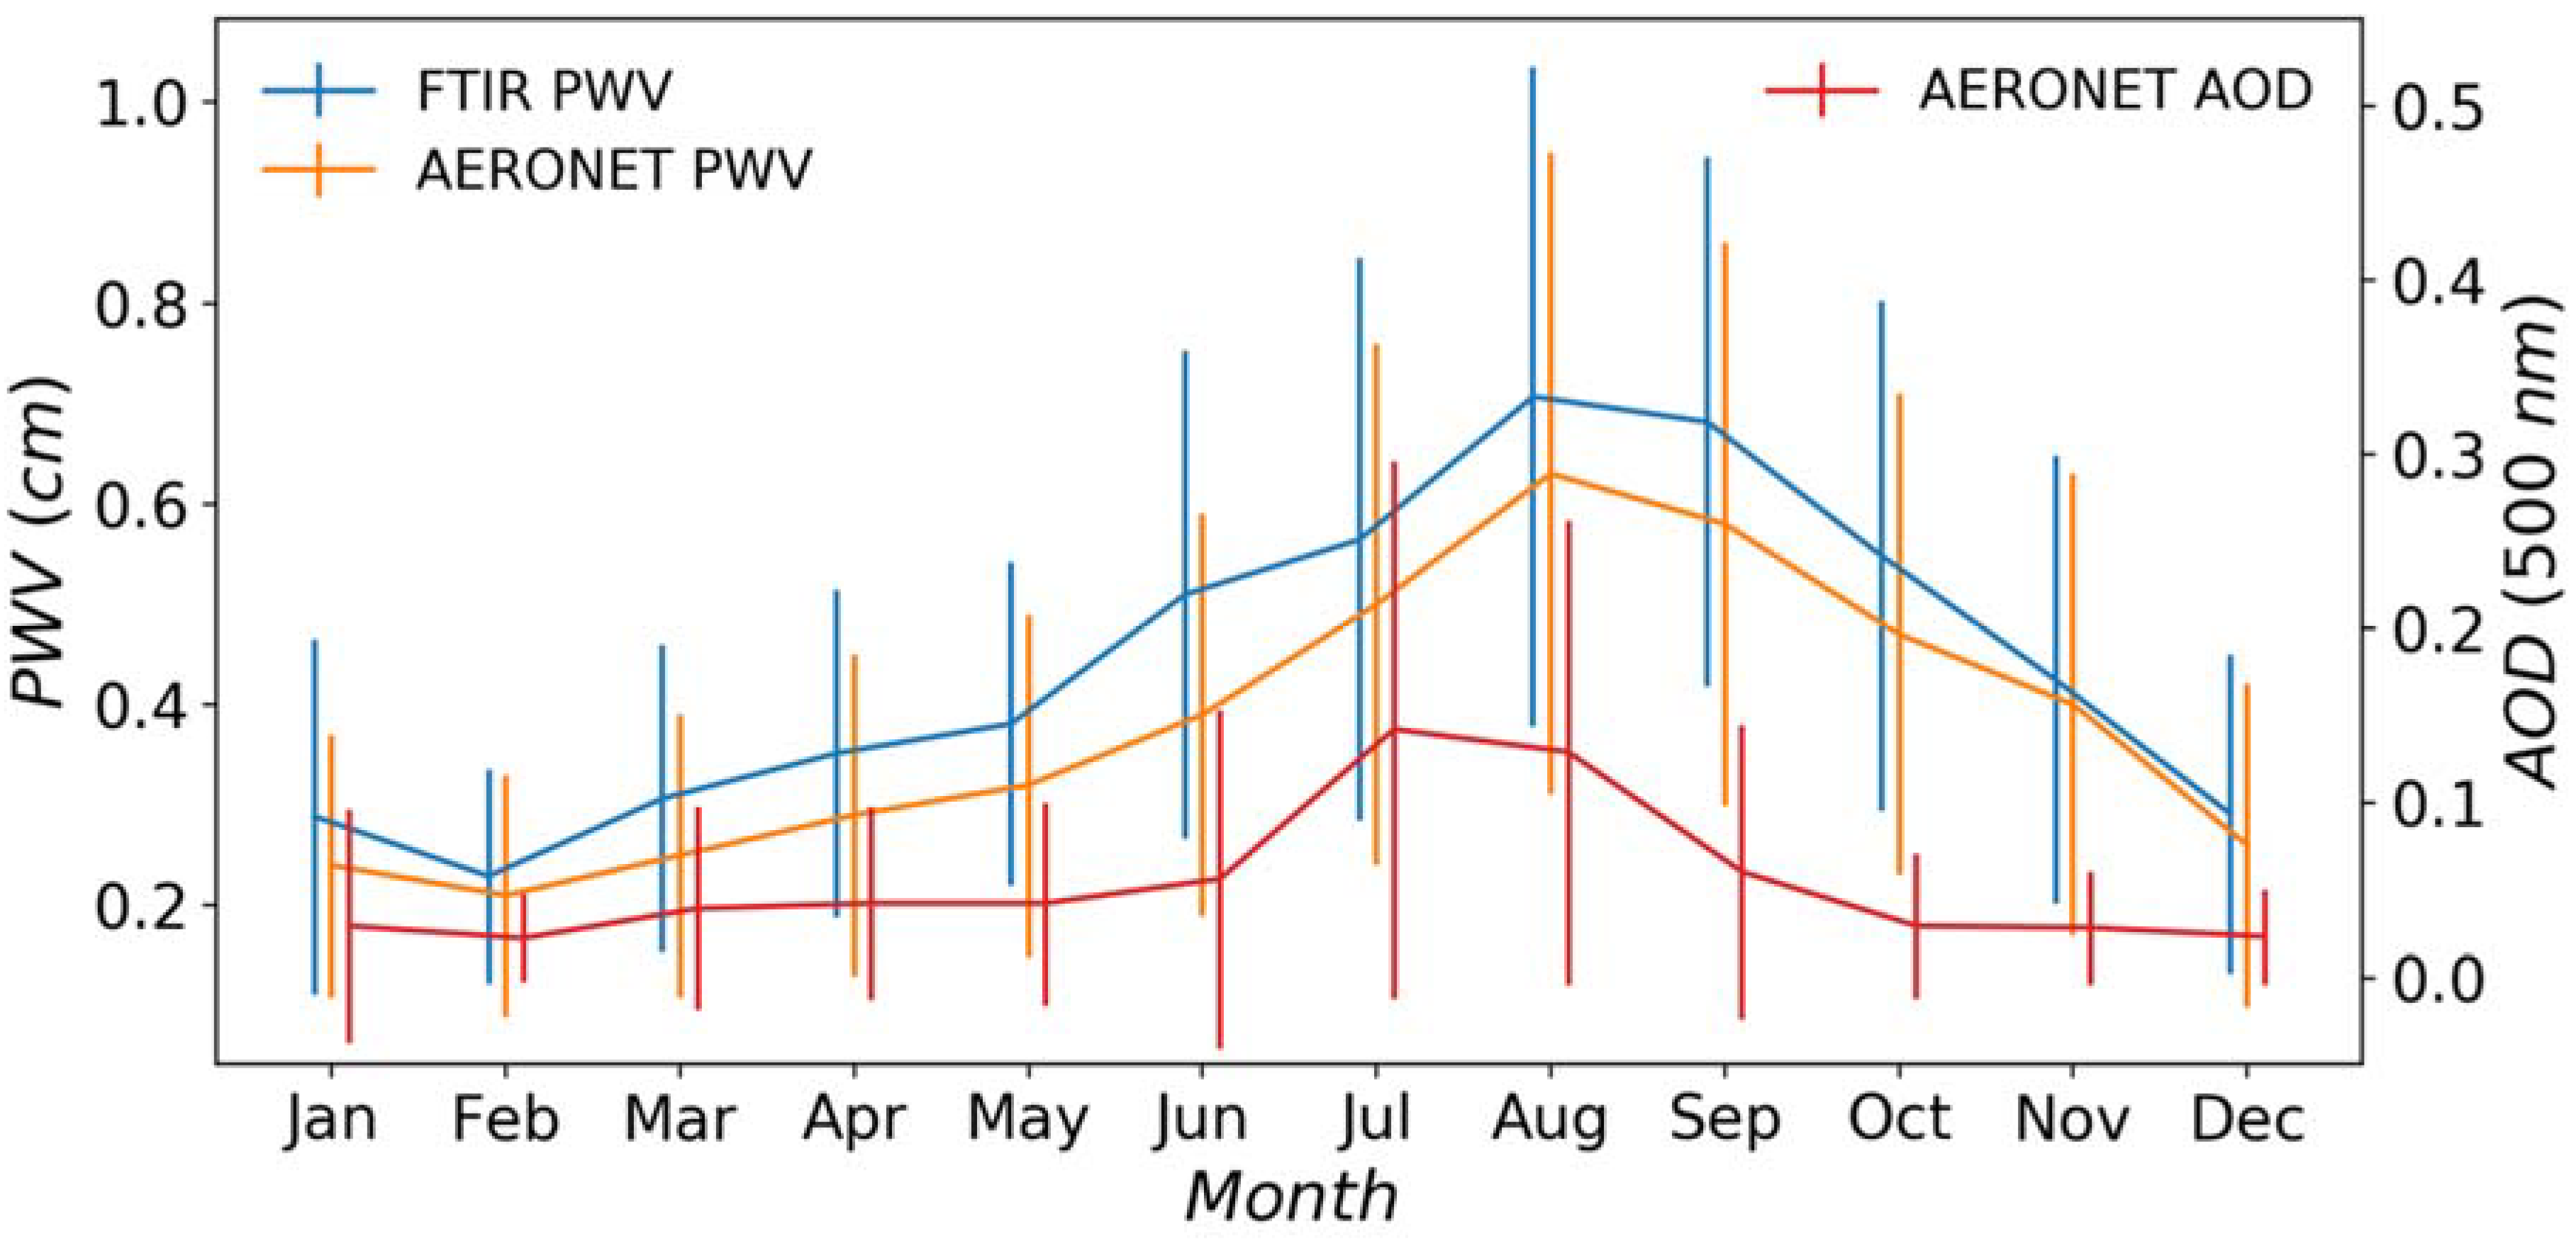
From a meteorological perspective, IZO is characterized by pristine skies, high atmospheric stability and rather low atmospheric humidity, as these conditions are required for radiometer calibration using the Langley technique [39]. These features make IZO a suitable site for background monitoring, representative of free troposphere conditions. As a consequence of the proximity with the Saharan desert, this site is also sporadically affected by dust transport from the Sahara, mainly in summer (see Figure 1), when the predominant conditions are associated to AOD675 >0.15 and large particles with Angstrom Exponent (α440_870) < 0.25 [40,41]. The prevalent conditions during most of the year imply AOD675<0.15. Regarding PWV, Izaña station is characterized by dry conditions, as a consequence of its altitude and its location in the descending branch of the subtropical Hadley’s cell, with the driest conditions occurring during winter, with a minimum PWV in February, while the wettest months occur in summer (maximum in August), coinciding with a higher frequency of dust outbreaks [19]. In Figure 1, the Total Column Carbon Observing Network (TCCON) FTIR and AERONET PWV averaged annual cycles are shown. It can be seen that both datasets follow a similar seasonal evolution, but with an appreciable bias between them, with a total average PWV of 0.48 cm (standard deviation of 0.28 cm) for TCCON FTIR, and 0.38 (standard deviation of 0.14) for AERONET. Other authors have shown that AERONET products underestimate the PWV compared with other techniques (see [13,23,42,43]), with mean differences ranging between −5% and −25%. An explanation for the observed differences will be given in Section 3.4.
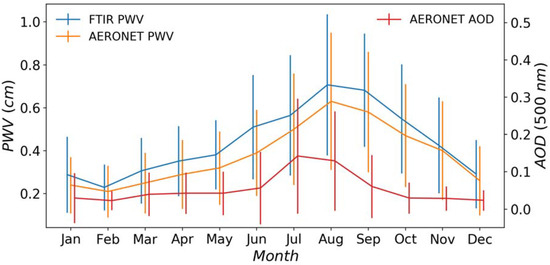
Figure 1.
Monthly precipitable water vapor (PWV) and aerosol optical depth (AOD)500 averages (solid lines) and corresponding standard deviations (error bars) at Izaña station. PWV annual cycle given by Total Column Carbon Observing Network (TCCON) Fourier Transform Infrared (FTIR) (blue line) has been calculated for 2007–2019. Aerosol Robotic Network (AERONET) PWV (orange line) and AOD500 (red line) have been calculated for 2005-2019.
2.2. Instrumentation
2.2.1. ZEN-R41 and ZEN-R52
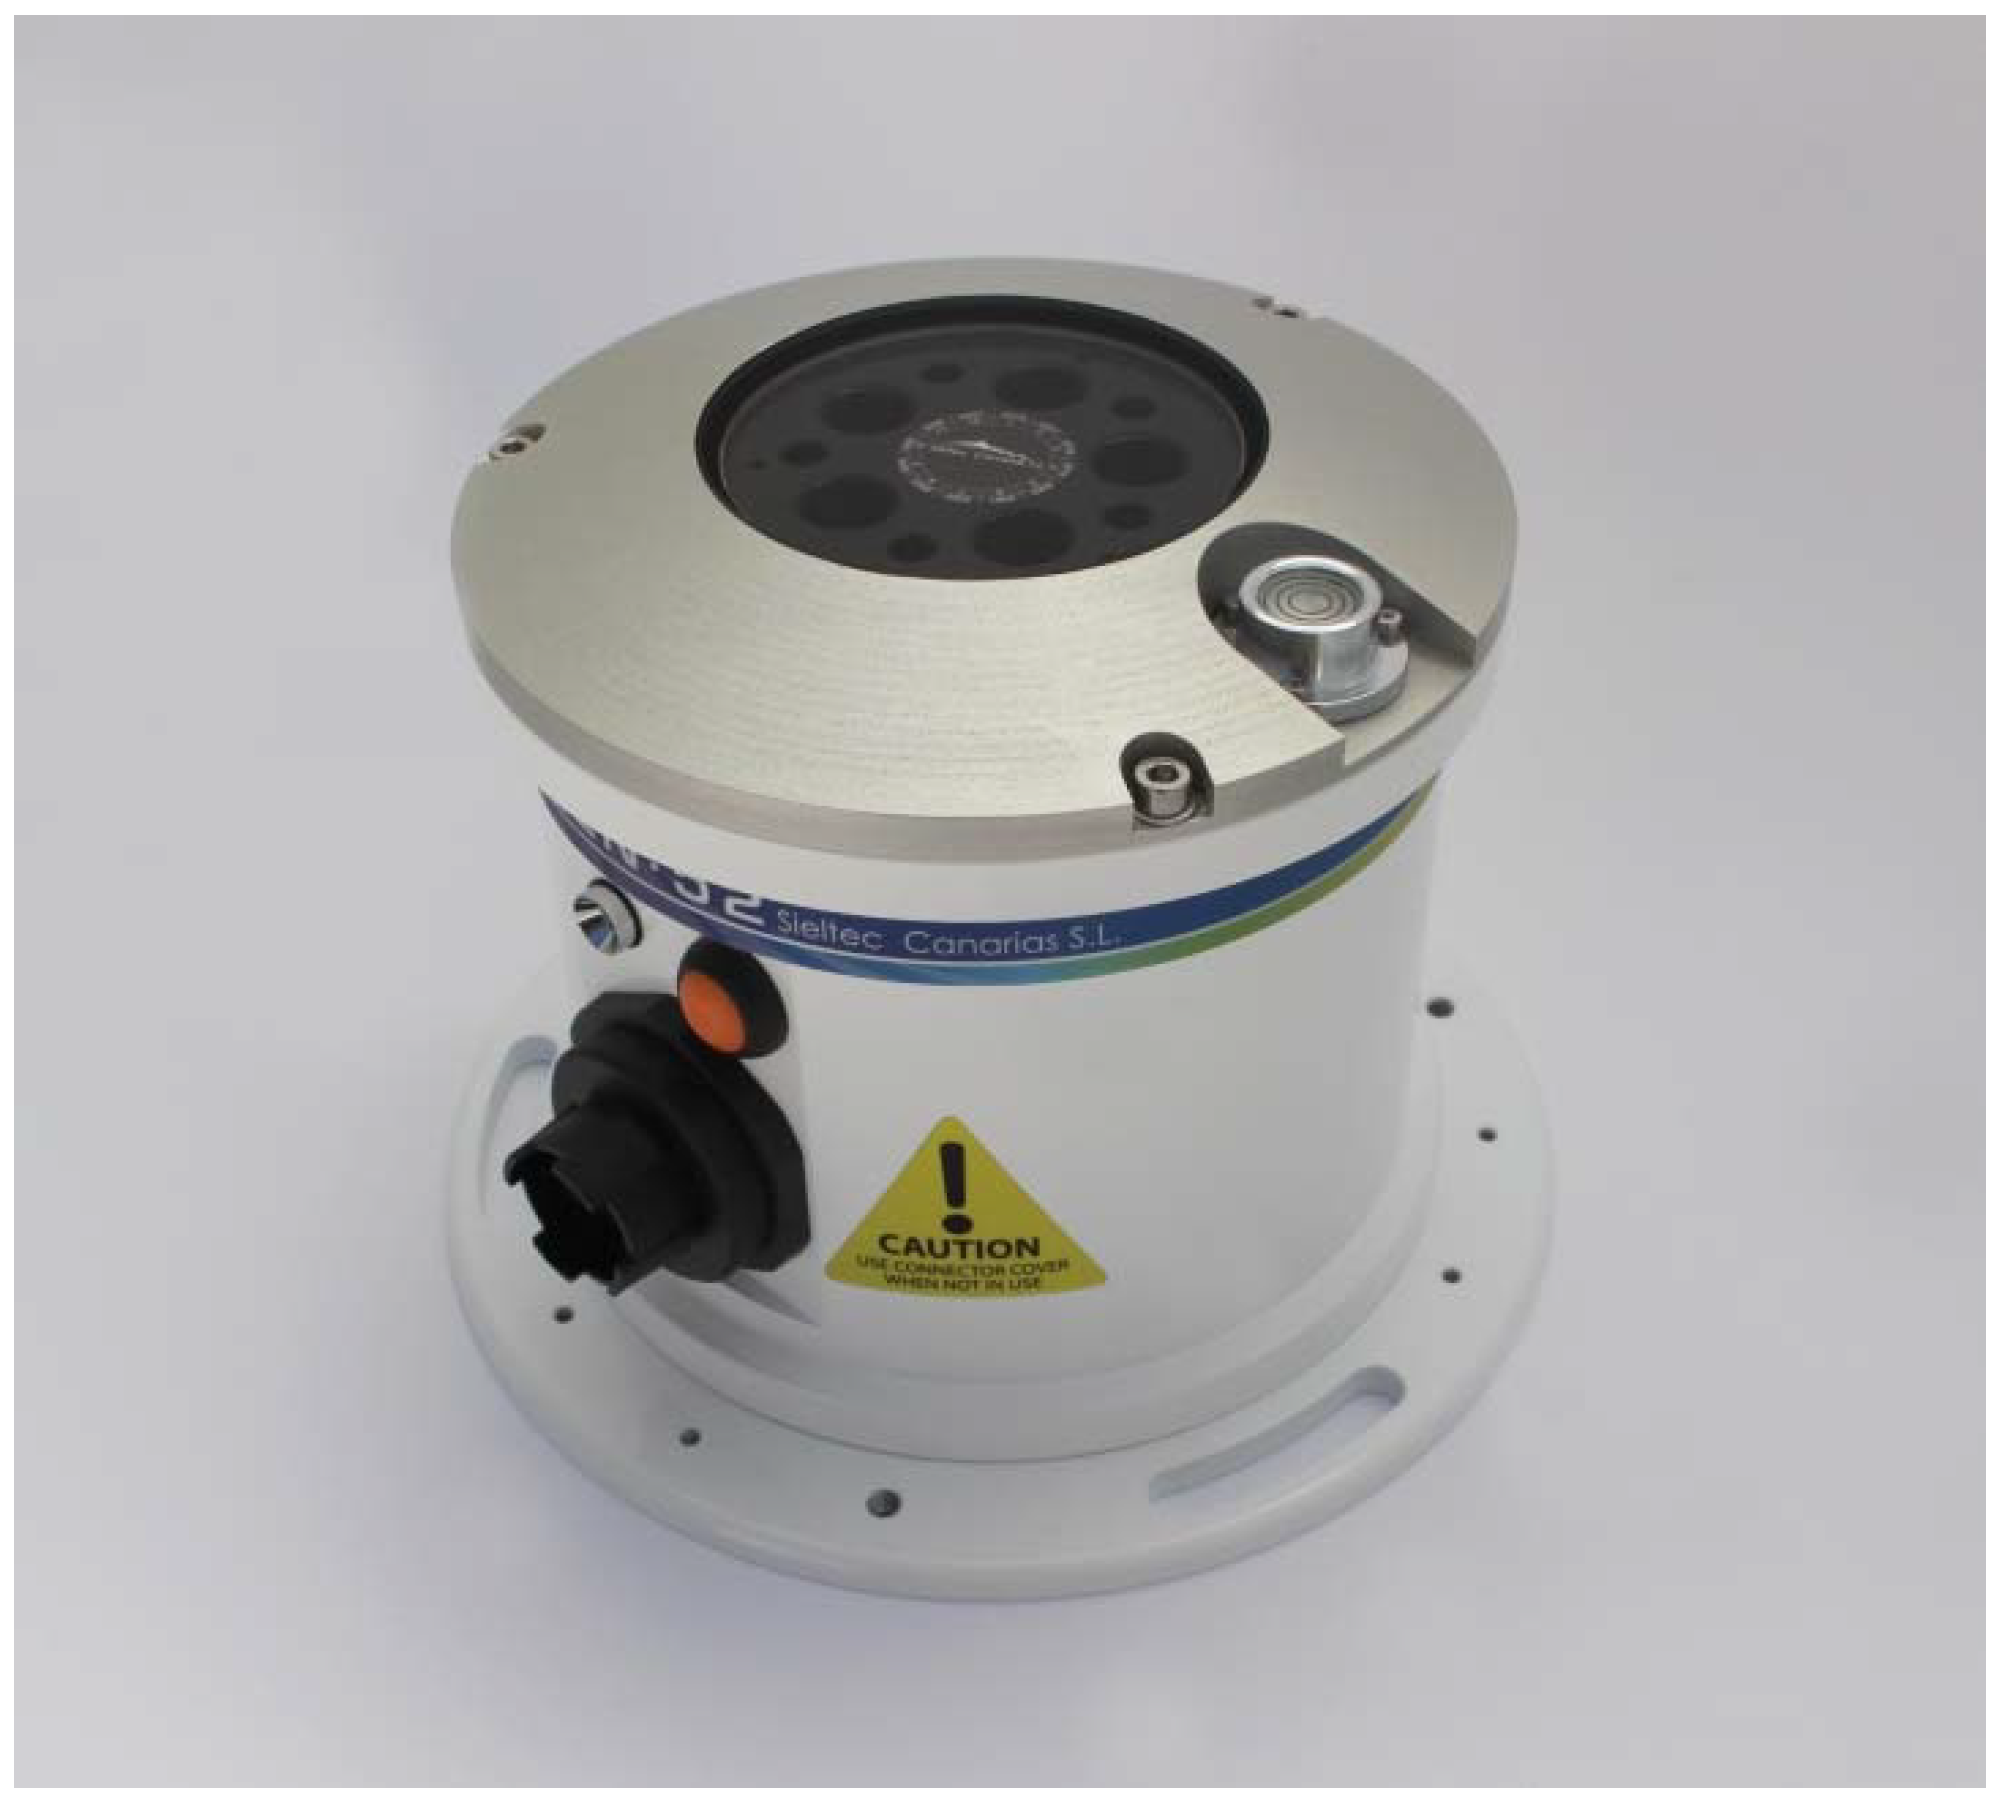
The ZEN-R41 is a radiometer jointly developed by Sieltec Canarias and the IARC, conceived to monitor AOD from sky radiance measurements at the zenithal direction and at different spectral bands. A complete description of the ZEN-R41 can be found in [37]. The ZEN-R52 (Figure 2) is a newer instrument version whose hardware and software have been significantly improved and optimized. Regarding the main differences of the hardware, both the inclusion of a new channel centered at 940 nm for PWV retrieval and a more powerful Single Board Computer (SBC) inside the instrument are remarkable. These improvements require a larger instrument housing box with cooling fins. Better coated lenses and a special treatment for internal baffles entail a Field of View (FOV) smaller than 2° and a better stray light rejection. Now, the ZEN-R52 uses five hard coated 10 nm Full Width at Half Maximum (FWHM) filters with nominal wavelengths centered at 440, 500, 675, 870 and 940 nm with an estimated precision of ±2 nm in the central wavelength (CWL), in combination with five silicon diodes (350–1050 nm) and a 16-bit resolution, over a high dynamic acquisition range. The choice of the optical filter’s spectral range was made based on a compromise between technical requirements, such as the detector’s spectral response, low atmospheric gas absorption (except for 940 nm) and commercial availability. A 1020-nm spectral band optical filter would be desirable in future ZEN versions to improve the estimation of AOD at longer wavelengths. The radiance measurements at all the channels are made simultaneously, with a rate of 1 minute (averaged from 30 samples). Moreover, the instrument also contains sensors for internal humidity, temperature and pressure monitoring.
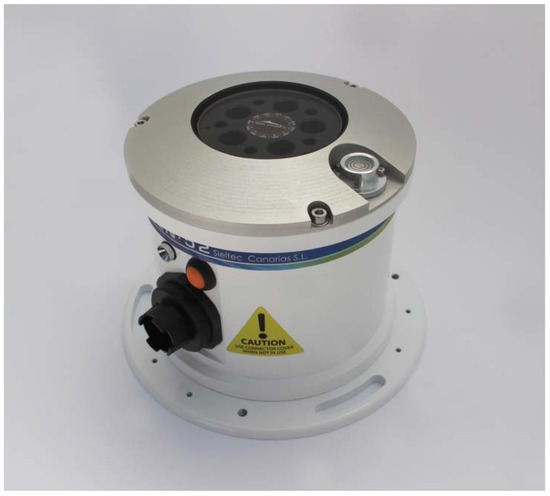
Figure 2.
ZEN-R52 picture.
Regarding software improvements, it is worth highlighting the renewed graphical interface, which allows for interactive data preview, database searches, data sending configuration (via FTP or HTTPs), time synchronization through Network Time Protocol (NTP) servers, and internal manual time configuration. Now, the user has the option to change the precomputed lookup table files or to change the radiometric calibration parameters. Access to the disk configuration and remote software updates are also possible.
The output signal of the instrument, which is provided in analogic-to-digital units (ADU), was transformed into radiance units (W m-2 sr-1 nm-1) by measuring a calibrated integrating sphere (Labsphere’s HELIOS 4-lamps 20’’ integrating sphere) at IARC facilities. The uncertainty involved in this calibration procedure was estimated to be 5% by [44]. Thus, we have assumed this estimation as the lower limit value for the radiance uncertainty.
2.2.2. Cimel CE318-AERONET
The CE318-AERONET permanent master at IZO was used in this work to validate the results obtained with the ZEN-R52 radiometer. This is a standard instrument used in AERONET which performs direct sun and diffuse sky measurements. Direct sun measurements are performed at nine different spectral bands to derive accurate AOD and PWV: 340, 380, 440, 500, 675, 870, 1020 and 1640 nm for AOD and 940 for PWV. AERONET version 3 Level 2.0 data were used in this study, which include near-real-time automatic cloud screening, automatic instrument quality controls and pre-field and post-field calibrations [45]. Diffuse sky radiance measurements are performed by means of two different routines to infer the aerosol optical and microphysical properties: the almucantar (ALM) and the principal plane (PPL) scenarios. With this information, AERONET provides microphysical and optical parameters, such as particle size distribution, refractive indices, single scattering albedo (SSA) or phase function [45,46]. Typical AOD uncertainty for reference instruments ranges between 0.002 and 0.009, with higher errors in the UV spectral range [39,46]. An excellent traceability of AOD from the AERONET-Cimel reference instruments to the world GAW-PFR AOD reference has been shown [40]. According to [45], the AERONET PWV product is accurate to about 10%. However, as [13] showed, PWV uncertainty for sun photometry is dependent on humidity conditions, ranging from 7% for humid conditions to 25% for very dry conditions (PWV ≤ 0.2 cm).
In order to simulate the ZEN performance, we have computed CE318-AERONET ZSR measurements (at 440, 500, 675, 870, 1020 and 1640 nm) by means of a linear interpolation of the PPL data to the zenith position. It is worth mentioning that CE318-AERONET does not provide PPL measurements at 940 nm.
2.2.3. Ground-Based FTIR
The FTIR solar measurements started at IZO in 1999 as the result of a collaboration between the IARC and the Institute of Meteorology and Climate Research—Atmospheric Trace Gases and Remote Sensing (IMK—ASF), belonging to the Karlsruhe Institute of Technology (KIT). Since then, two FTIR spectrometers have been operating at the observatory (an IFS 120M between 1999 and 2005 and an IFS 120/5HR from 2005 onwards) in the framework of the international atmospheric composition networks Network for the Detection of Atmospheric Composition Change (NDACC, since 1999) and TCCON (since 2007).
For this work, we use the TCCON FTIR PWV data, which were retrieved with the 2014 version of the GGG processing software [47] by evaluating the measured direct solar absorption spectra in the near-infrared spectral region (4000–9000 cm−1). These solar spectra are acquired at a spectral resolution of 0.02 cm−1. Several scans are co-added in order to increase the signal-to-noise ratio and, thus, the sampling frequency of TCCON FTIR PWV data is about 2 minutes. TCCON data have been calibrated using collocated meteorological radio soundings at globally distributed TCCON sites, from which a correction factor of 1.018 ± 0.004 (R2 = 0.993) was determined for the PWV [47]. The TCCON PWV data used here were already divided by this scale factor. Particularly at IZO, when comparing TCCON FTIR PWV values to those obtained from meteorological radiosondes launched on Tenerife island and processed according to the GRUAN scheme for the period 2008-2017, we further confirmed the high precision of the TCCON data used in this work. We document a mean bias (TCCON-GRUAN) of only −0.06 cm (1.33%) and a R2 of 0.939 (Omaira E. García, personal communication, 2020). Further details of the FTIR program at IZO are given in [13].
2.3. Methodology
2.3.1. AOD Calculation Method Description (ZEN–AOD–LUT)
The ZEN–AOD– lookup table (LUT) method previously described in [37] was used to retrieve AOD from zenith sky measurements. This method compares the ZSR measured at four of the five ZEN-R52 nominal wavelengths (440, 500, 675 and 870 nm) with a LUT of precomputed ZSRs at these wavelengths. This LUT is generated using the radiative transfer model LibRadtran (http://www.libradtran.org) [48,49], whose principal inputs are the solar zenith angle (SZA), the aerosol vertical profile and the surface reflectance. According to [37], a mix of aerosol components as well as their vertical profiles is defined to retrieve the optical properties needed to compute the LUT of ZSR values. Therefore, a set of AOD values is pre-calculated from every aerosol profile. Finally, the LUT estimates AOD by minimizing the normalized root mean squared differences (NRMSD or ) of computed and measured ZSRs defined by:
where Nλ is the number of nominal wavelengths considered and ZSRmλ is the measured radiance at the nominal wavelength λ, at zenith direction (θv = 0), with the SZA being θs. Similarly, ZSRcλ,l is the computed radiance at the nominal wavelength λ in the zenith direction, for the corresponding SZA and the aerosol vertical profile indicated by index l. The dependence of ZSRλ on surface reflectance, single scattering albedo, AOD, and aerosol phase function have been omitted for the sake of brevity.
In a sensitivity study carried out by [37], the authors showed that the uncertainty of the ZEN–AOD–LUT method increases with AOD, having a standard uncertainty ranging from 0.06 for AOD500 ≈ 0.5 to 0.15 for AOD500 ≈ 1.0, when an instrumental uncertainty of 5% is considered.
2.3.2. PWV Determination Method (ZEN-PWV-LUT)
In a similar manner to the ZEN–AOD–LUT, the ZEN-R52 PWV has been derived by means of the LUT technique (ZEN-PWV-LUT), which is, in fact, an extension of the ZEN–AOD–LUT, considering an ensemble of PWV values as inputs to the radiative model. Therefore, this ZEN-PWV-LUT has a size defined by the length of the ZEN–AOD–LUT (40 aerosol mass concentration values by 80 SZA values) multiplied by the length of the PWV array (20 values ranging from 0 to 2.3 cm). The upper limit of 2.3 cm was chosen as the maximum PWV value observed at Izaña station with FTIR during the period of this study (1.8 cm, plus 0.5 cm of margin). This method accounts for the absorption of ZSR due to the presence of atmospheric water vapor in the 940-nm spectral band. In addition to the water vapor absorption, other effects on ZSR such as those produced by surface reflectance, Rayleigh scattering and aerosol absorption and scattering, are considered. Surface reflectance and Rayleigh scattering are fixed inputs in the radiative transfer calculations, but the aerosol contribution is estimated from the ZEN–AOD–LUT. Once the aerosol’s profile has been estimated, PWV is calculated by minimizing the NRMSD between measured ZSR (ZSR940m) and computed ZSR (ZSR940c) in this spectral range using Equation (1).
It is also important to highlight that the water vapor transmission spectrum in this spectral range has a high number of narrow absorption lines. Considering the wide wavelength range of the optical filters of the instrument (FWHM≈10 nm), accurate knowledge of the filter transmission function is an important factor in the accurate determination of PWV. REPTRAN band parametrization [50] included in LibRadtran software package has been adopted in this study with a coarse resolution (15 cm−1) to reduce the high computing time required to simulate ZSR for such a high number of absorption lines in the 940 nm spectral band. The MT_CKD (MlawerTobinCloughKneizysDavies) model for the water vapor continuum absorption [51] is also included. With this band parametrization, only a few representative wavelengths are required to parametrize the desired spectral band. The simulated ZEN-R52’s 940-channel ZSRs are obtained by convolving the computed ZSRs at the representative wavelengths with the filter function provided by the manufacturer, which is supplied with a CWL precision of ± 2 nm.
2.3.3. ZEN Quality Control (ZEN-QC) Process
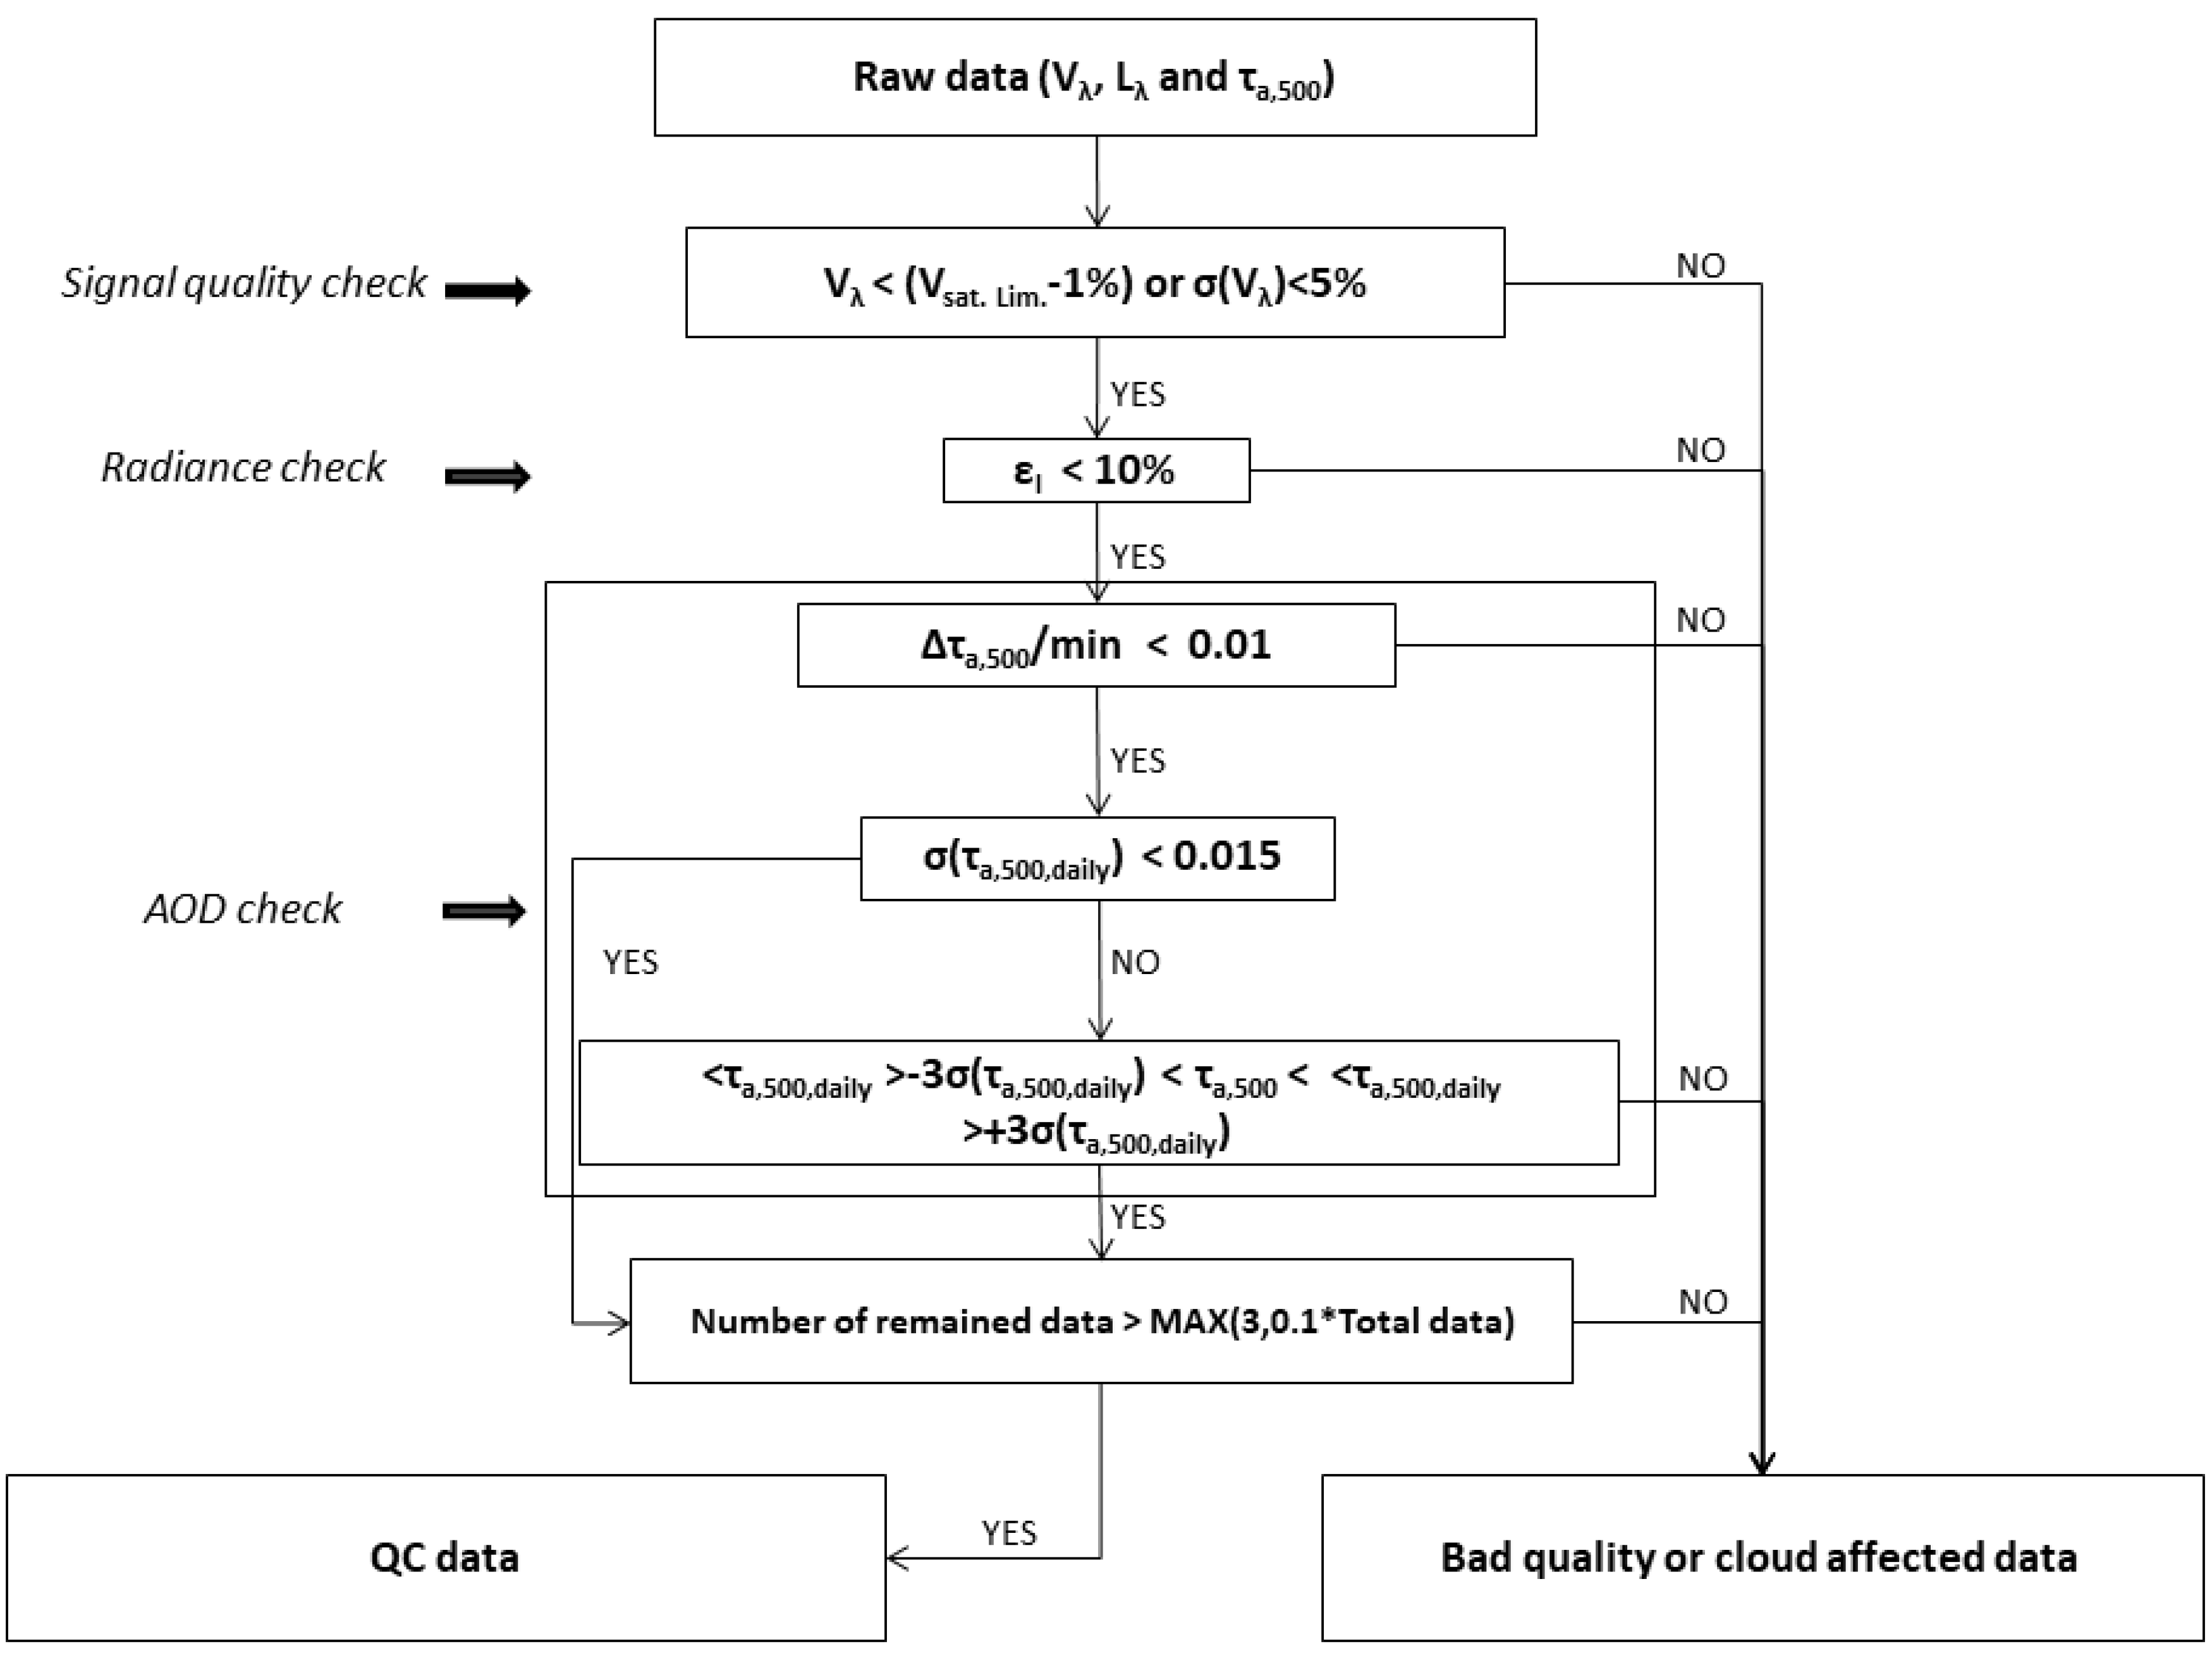
An algorithm was implemented in order to remove cloud-contaminated and erroneous data from the ZEN-R radiometers dataset. The algorithm includes the following steps (see Figure 3):
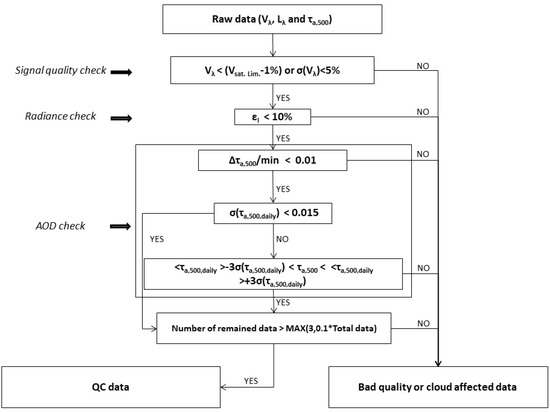
Figure 3.
ZEN quality control (ZEN-QC) scheme flowchart.
- Signal quality check: the ZEN-R devices perform 30 measurements in one minute, but only 1-minute voltage averages and their corresponding standard deviations (σV) are stored. High frequency noise is removed by analysing the signal, considering a threshold of 5% in σV, which was determined by empirically analysing aerosol condition data from clean and heavy dust outbreaks. Measurements larger than the saturation value with an error range of 1% were removed;
- Radiance check: the NRMSD of measured and estimated radiances used in the AOD (τa) retrieval process (ZEN–AOD–LUT) were analysed. We have determined a threshold of 10% for the value of , given in Equation (1), and data above this threshold were removed;
- AOD check: part of the AERONET cloud-screening quality control algorithm [45,52] has been adapted to the ZEN system. It consisted of three different steps:
- A smoothness check, to verify that cloud-contaminated data were removed by means of the τa,500 relative change rate. A threshold of 0.01 was considered;
- An AOD stability check, in which we assumed the criterion presented in [45] based on the standard deviation of the daily τa,500. Data were accepted if σ was < 0.015;
- After the two previous checks, a three-sigma check on τa,500 was performed.
- Finally, if the remaining data from a certain day were lower than three (or 10% of the total initial number, whatever is higher), data from this day were removed.
2.3.4. PWV Determination Method (CE318-IARC)
In addition to using the PWV AERONET product (see Section 2.2.2) in the comparisons, we also used the PWV obtained with the same CE318 instrument, but calculated using a specific calibration, which we called CE318-IARC PWV. The method followed to calculate the PWV is very similar to that of AERONET, differing only in the water vapor transmittance calculation, where we considered more specific conditions. The method is explained below.
As many authors have already proved ([13,33,34,35,36,37], sun photometric measurements at 940 nm can be used to derive PWV. In this case, the Beer–Lambert–Bouguer law, defined to be applied to regions with a smooth spectral variation in atmospheric transmittance inside the band pass, must be modified to account for the water vapor transmittance (Tw,λ):
where Vλ is the photometer voltage, V0,λ is the solar extraterrestrial voltage, m is the atmospheric air mass and τλ is the spectral optical depth of molecules and aerosols. The following exponential dependence of Tw,λ on PWV is well accepted ([31,53]):
where mw is the water vapor optical air mass ([54,55]) and “a” and “b” coefficients are filter-dependent and site-dependent constants, which have to be calculated by considering the central wavelength position, width, and shape of the photometer’s filter response and by other parameters such as the vertical distribution of the water vapor ([19]). These two parameters are determined by means of a spectral convolution of the weighted water vapor transmittances simulated using the LibRadTran radiative transfer model with the instrument’s response function at 940 nm. REPTRAN band parametrization [50] was adopted in this simulation, as well as the mid-latitude summer atmosphere and the altitude of Izaña (2.4 km height). A variation in mw between one and six was considered, in addition to a PWV variation between 0 cm and 2.3 cm, in order to cover the interval considered in this study.
Photometry-derived PWV values can be calculated by combining Equations (2) and (3) with the following equation, involving Rayleigh and aerosol optical depths (τR and τa) and air masses (mR and ma):
A calibration constant at 940 nm (V0,940) was determined by means of a modified Langley plot analysis [31] (following Equation (2)) over a 10-month period (August 2017 to June 2018). τa,500 was restricted to values below 0.015 to ensure clean and stable atmospheric conditions for the Langley analysis. A total of 27 V0,940 values were retrieved in this time period, with a coefficient of variation of 2.9%. The values obtained for the coefficients a and b are 0.536 and 0.638, respectively.
3. Results
3.1. ZEN-R52 Quality Control (ZEN-QC) Assessment
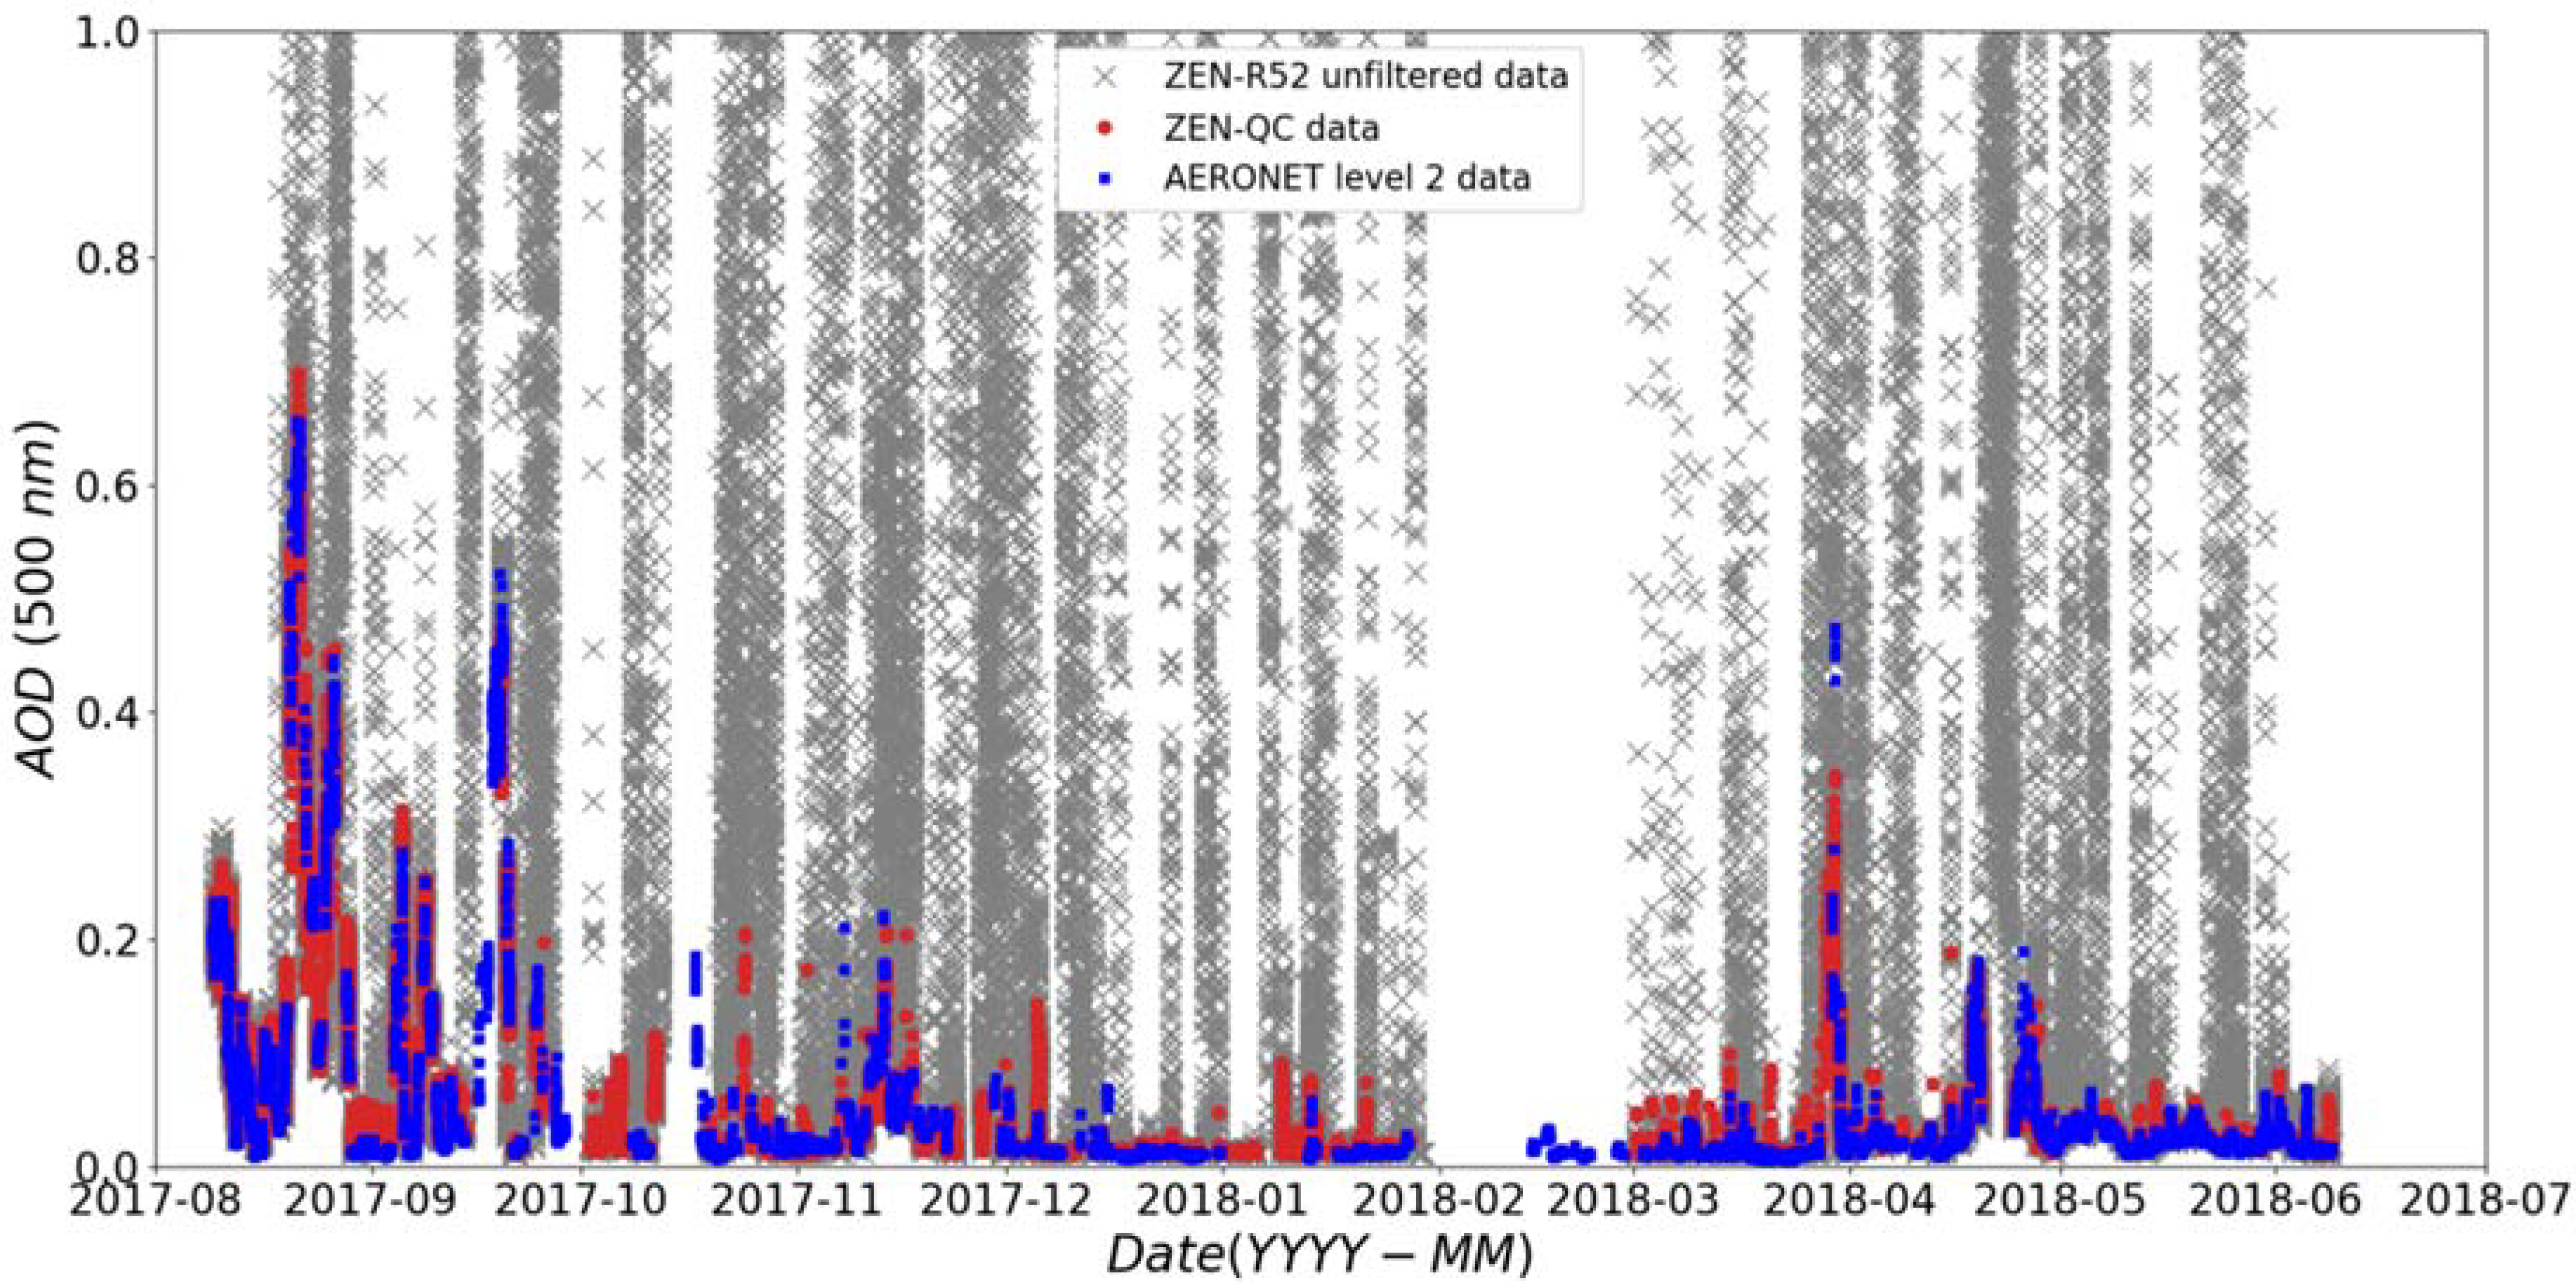
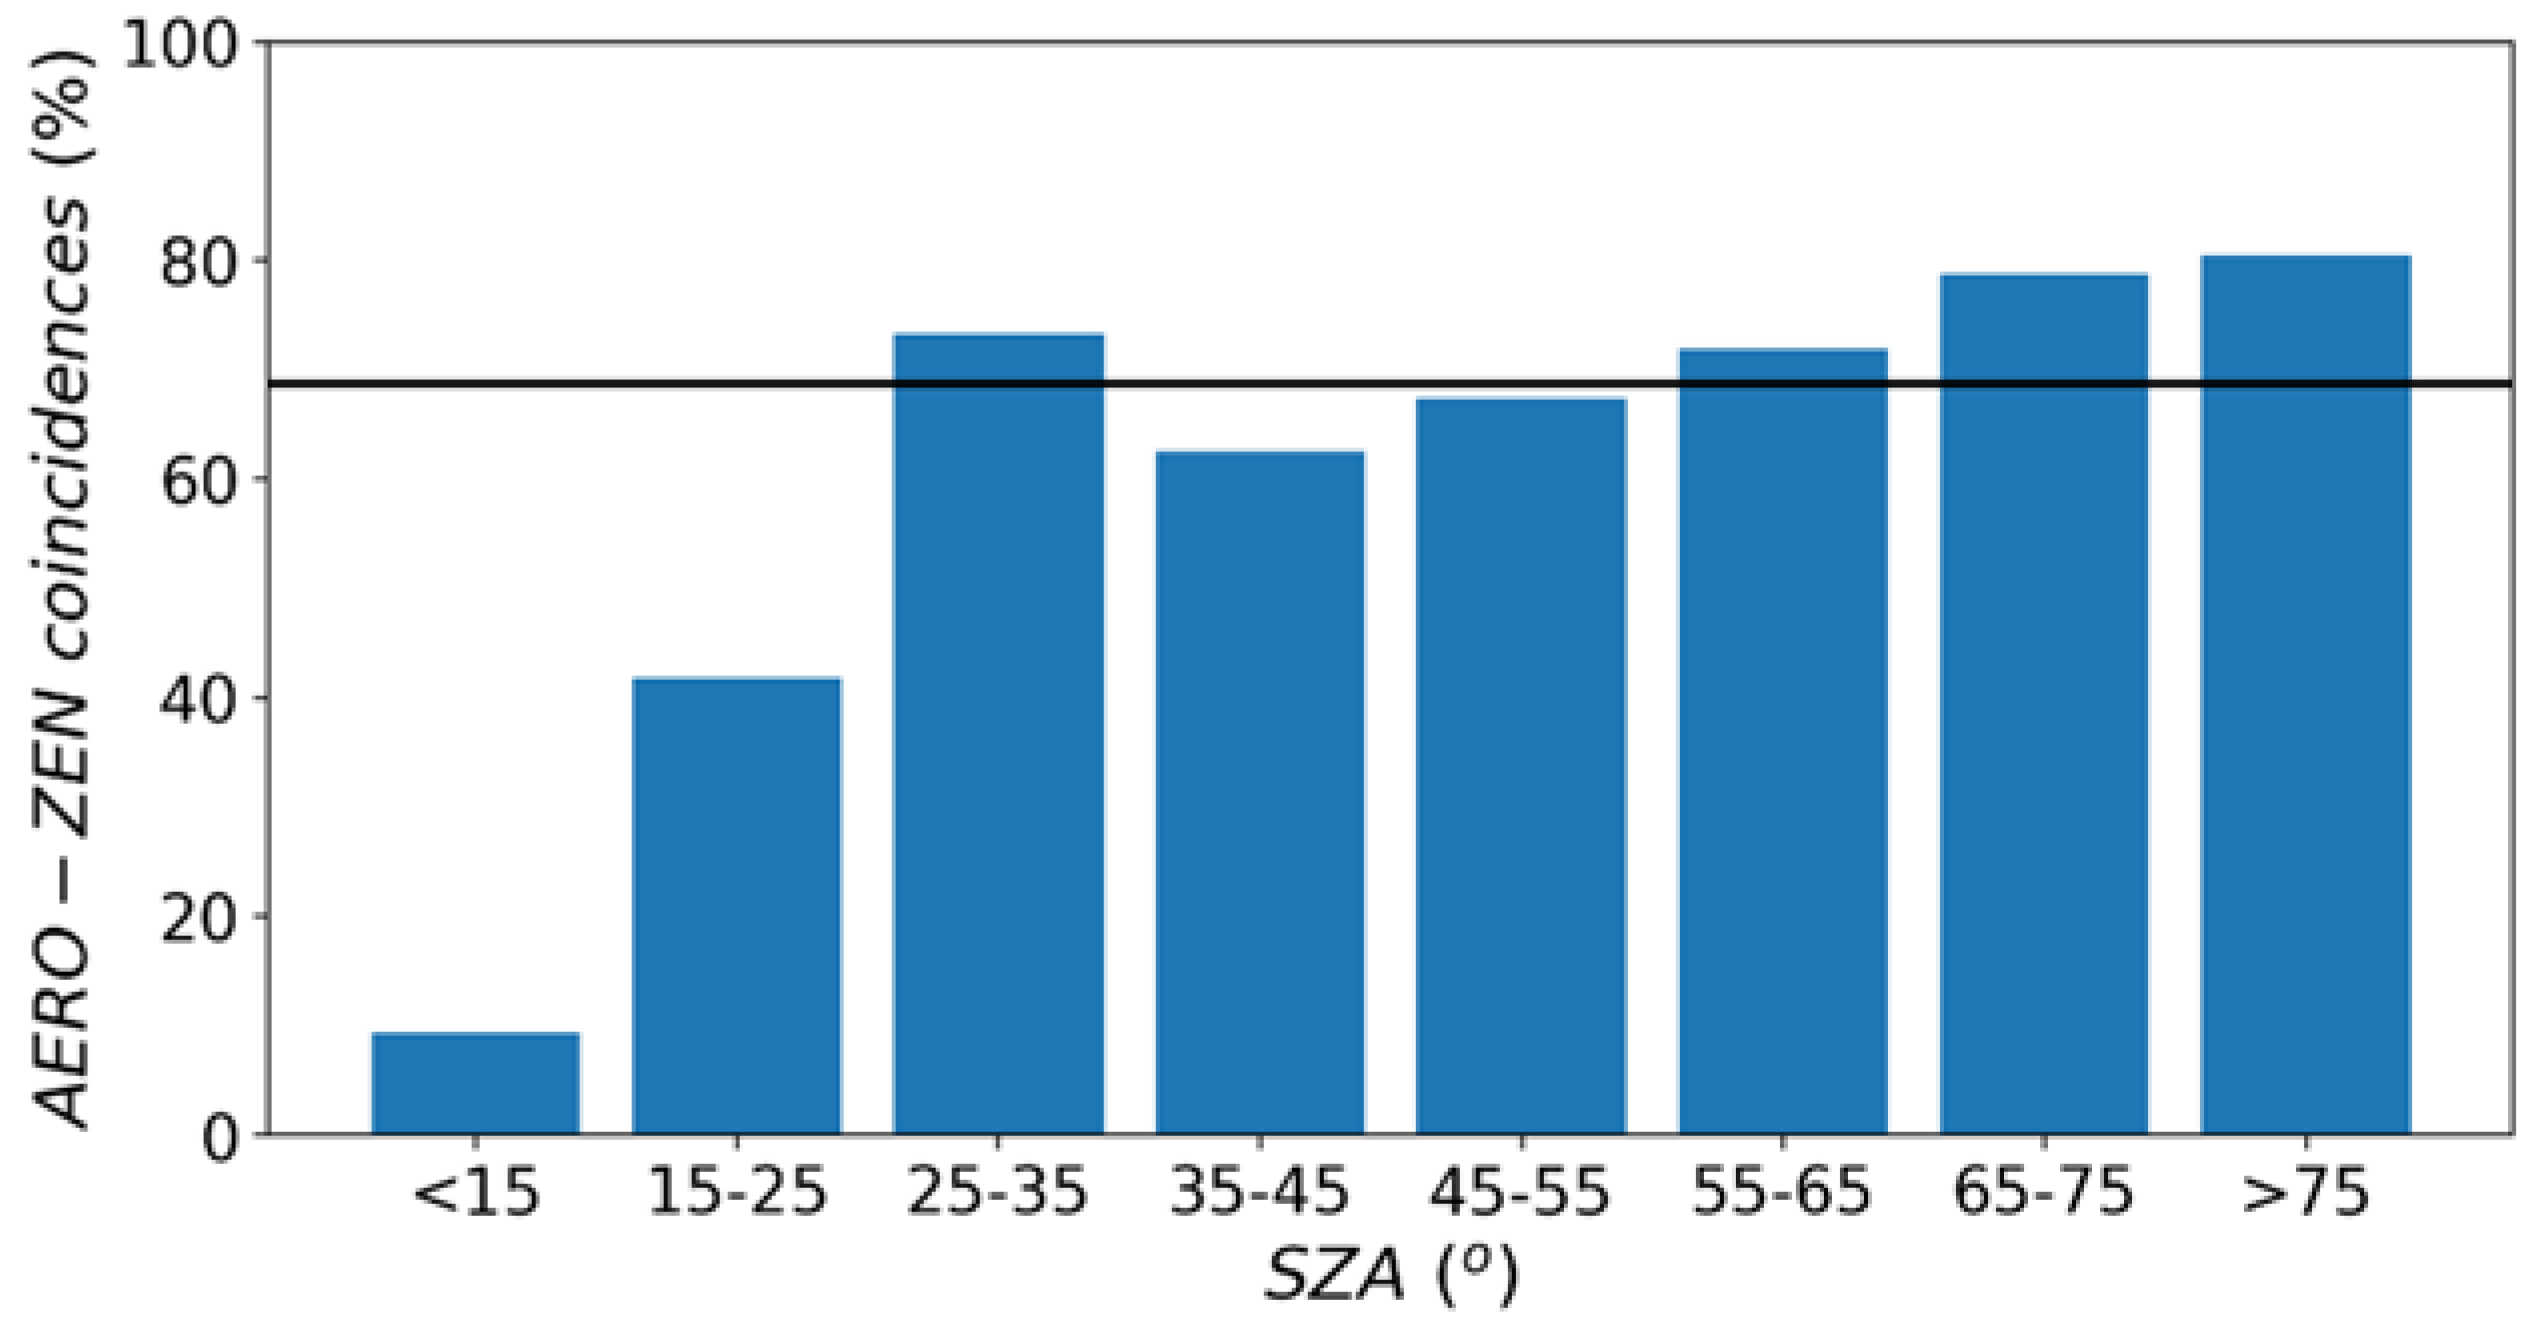
The ZEN-R52 quality control (ZEN-QC) method was applied to the ZEN-R52 data over a 10-month period (August 2017 to June 2018). The ratio of removed ZEN-R52 data in each step is shown in Table 1. The first two steps (signal quality and radiance checks) filter 24.0% and 23.4% of total data, respectively, due to both cloud-contaminated data and instrument anomalies. The third ZEN-QC step is an AOD check procedure to refine the cloud screening. This process is able to screen the final 2.2% of total data. Thus, nearly half of ZEN-R52 data were filtered in this three-step algorithm. We studied the number of coincidences with the AERONET (level 2.0 version 3) cloud-screening quality control algorithm (in %) by matching the closest pairs of records (ZEN-R52 and CE318-AERONET) with a time difference within ±30 seconds. According to [40], the natural AOD variability in this time period is negligible. The 10-month AOD evolutions at 500 nm for the two datasets are shown in Figure 4. The results shown in this figure demonstrate that the ZEN-QC filtering method is a suitable algorithm to screen instrumental errors and clouds, with an agreement of 68.8% with AERONET. The distribution of the coincidences between the two quality control algorithms depends on the solar elevation as shown in Figure 5. The agreement is especially poor for SZA < 15°, where the ZEN-QC rejects most of the ZEN-R52 data as a consequence of the presence of stray light on ZEN-R52 ZSR. However, the agreement is notably improved as SZA increases, especially for SZA > 25°, where the presence of stray light is cosiderably reduced.

Table 1.
Ratio (%) of ZEN-R52 filtered data at each step of the ZEN-QC algorithm.
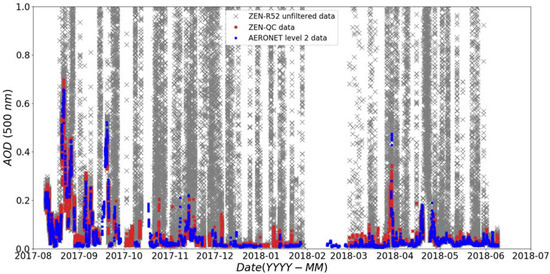
Figure 4.
AOD at 500 nm for a 10-month period (August 2017 to June 2018) at Izaña station obtained from ZEN-R52 and CE318-AERONET radiometers. Grey crosses represent ZEN-R52 unfiltered AOD data, red solid circles depict ZEN-R52 AOD after applying the ZEN-QC algorithm, and blue squares show CE318-AERONET level 2.0 AOD data.
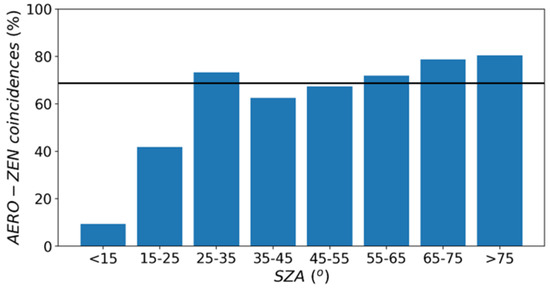
Figure 5.
Coincidences (%) between AERONET and ZEN quality control algorithms for eight solar zenith angle (SZA) intervals. The black line represents the average of 68.8% of the coincidences.
3.2. ZSR Comparisons
The ZSR measurements performed by ZEN-R41 and ZEN-R52 instruments were compared with the CE318 ZSRs derived from PPL sky radiance measurements. CE318 PPL measurements were done for a set of six nominal wavelengths (440, 500, 675, 870, 1020 and 1640 nm), with a duration of approximately 30 seconds for each spectral band. On the other hand, the ZEN-R’s data are 1-minute averaged for all the channels at the same time. All sets of ZEN-R data were screened with the ZEN-QC algorithm previously described in Section 2.3.3. In the case of the CE318 PPL data, we employed the algorithm described in [37], which is based on the smoothness of the PPL curve. The closest data pairs with a time difference within ±30 seconds for the four coincident spectral bands, i.e., 440, 500, 675 and 870 nm, were used for the intercomparison.
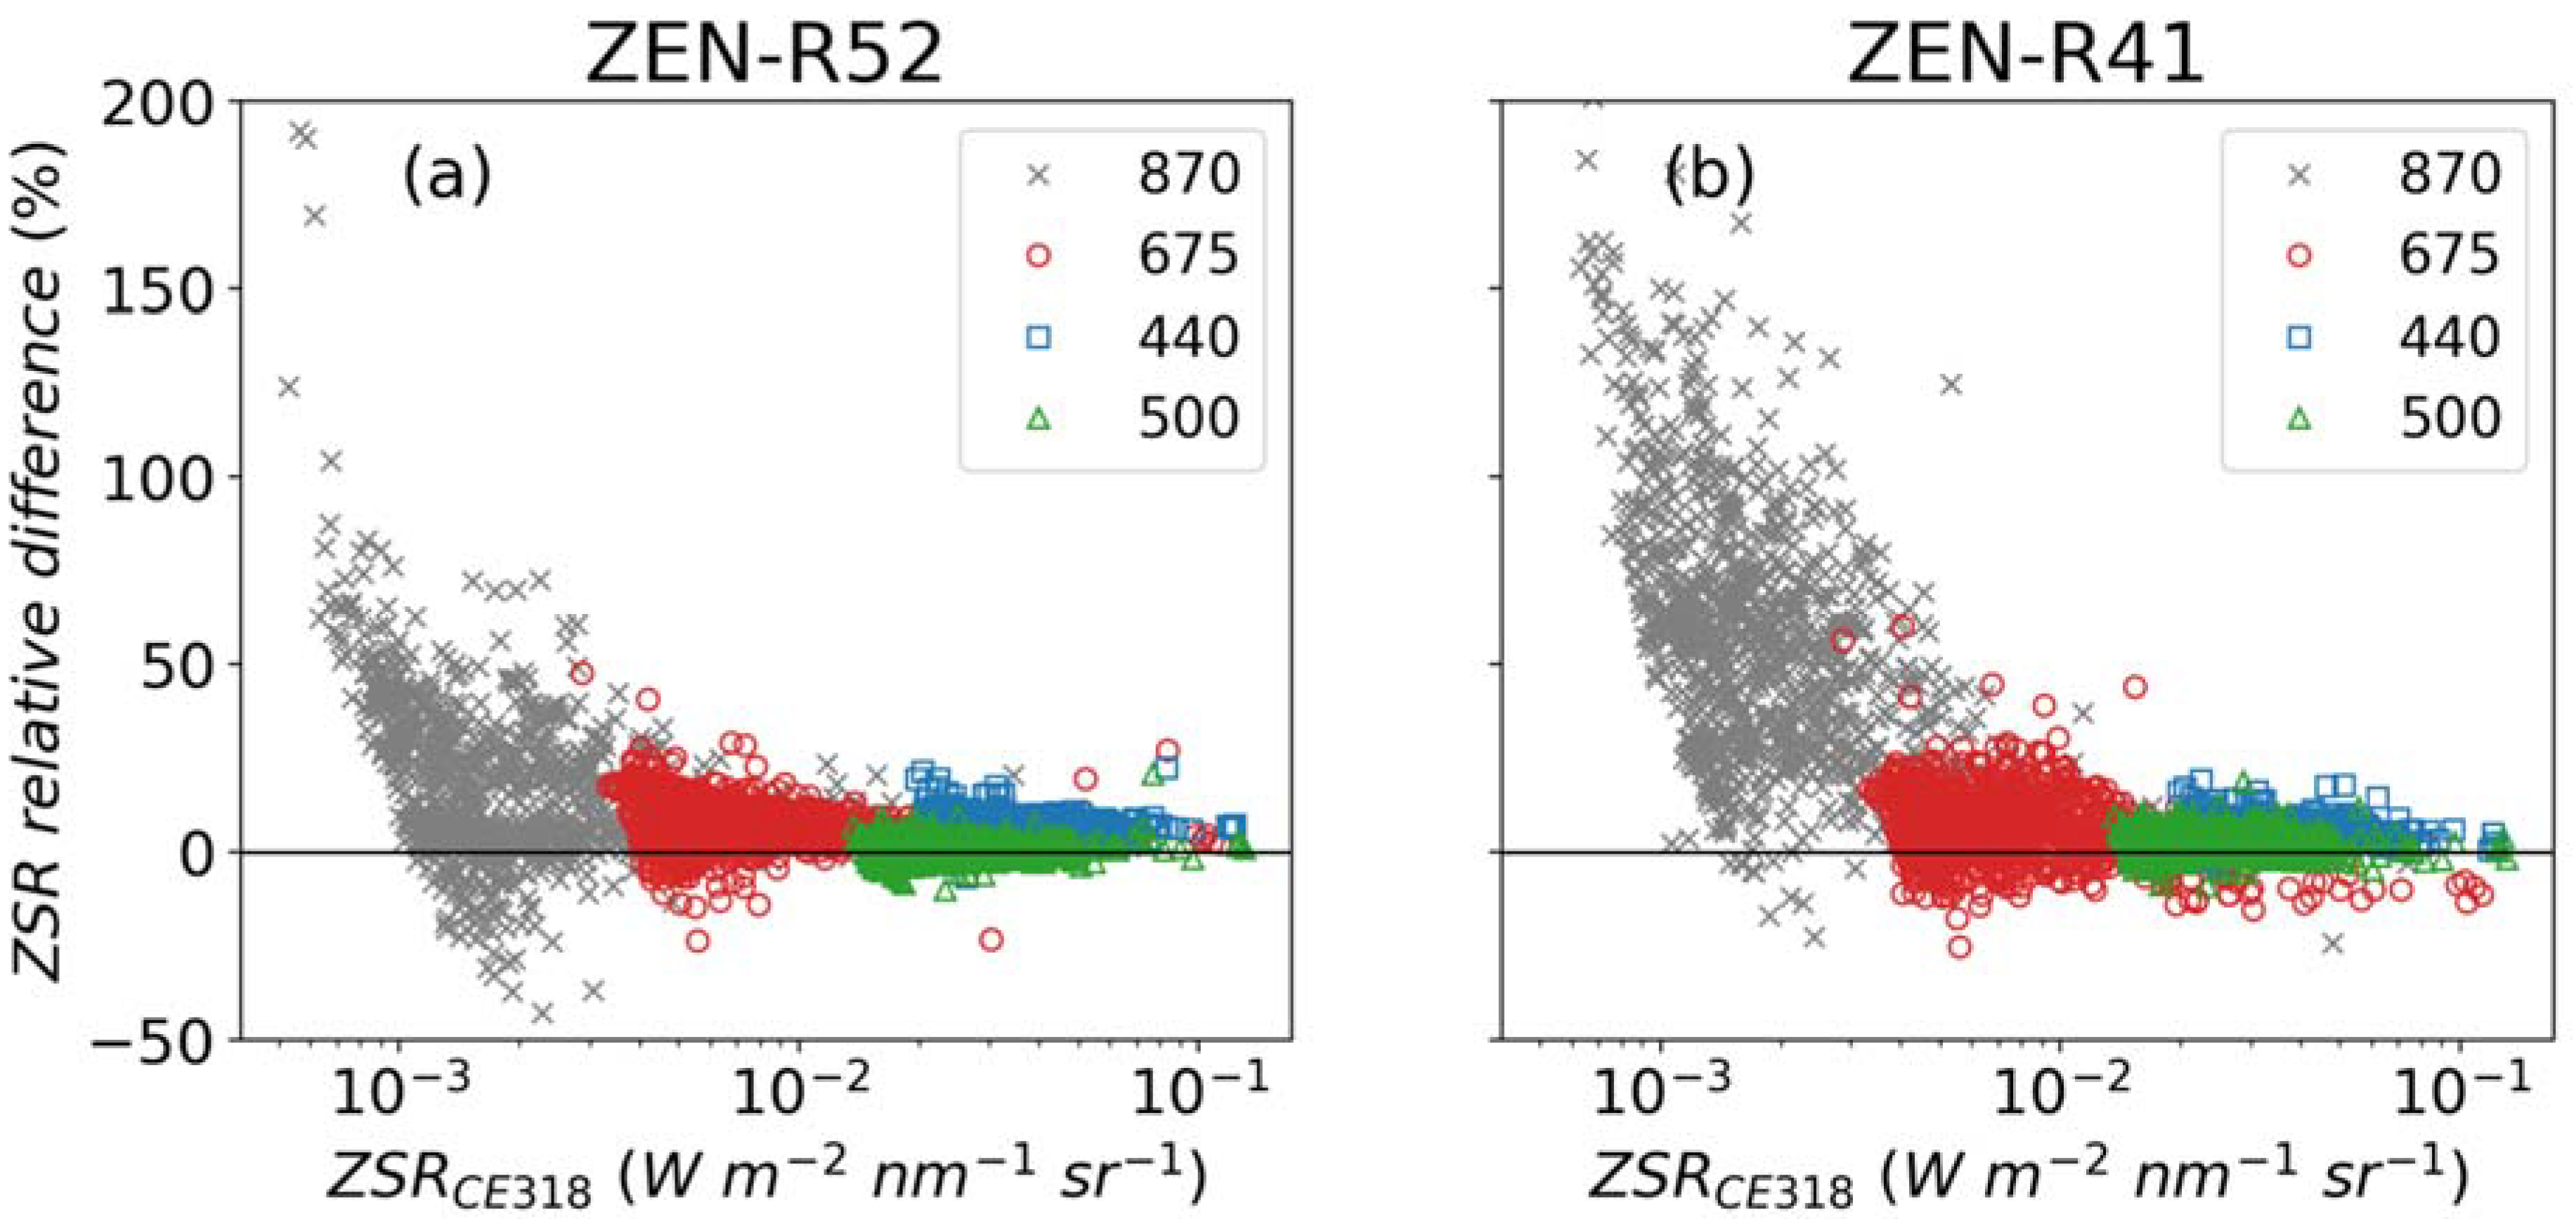
The main statistics of the ZSR comparison between CE318-AERONET and ZEN-R41/R52 are presented in Table 2. High coefficients of determination (R2 of 0.99) and low root mean squared errors (RMSE) for all wavelengths (between 0.0004 and 0.0009 W m−2 sr−1 nm−1) were observed for both ZEN systems. Relative differences were low for both instruments at 440 and 500 nm, with a mean and standard deviation of relative differences lower than 7%. In particular, in the case of ZEN-R52, the mean bias and standard deviations of relative differences of 6.9%, 2.5% and 0.9%, 2.3% were found, respectively, at these two wavelengths. However, these values were much higher for the longest wavelength channels, especially for ZEN-R41 at 870 nm, with a mean bias of 53.8% and a standard deviation of 39.8%. These values were reduced to 16.3% and 21.3%, respectively, in the case of the new ZEN-R52.

Table 2.
Radiance comparison statistics by instrument and wavelength, taking CE318-AERONET ZSR measurements as references, including the coefficient of determination (R2) and RMSE (W m−2 sr−1 nm−1). The Zenith Sky Radiance (ZSR) mean and standard deviation of the relative differences (here represented as <ΔZSR> and σ(ΔZSR)), and the number of data (N) are also shown.
The relative differences between ZEN-R and CE318 instruments for the four coincident wavelengths are plotted against the CE318 ZSR in Figure 6. It can be observed that the relative differences for ZEN-R versus CE318 increase as ZSRs decrease, which are lower at longer wavelengths. These results indicate that the low radiances measured at 870 nm are close to the detection limit of the ZEN-R, in addition to the presence of an offset signal or stray light, higher for the ZEN-R41, which is more significant for lower ZSR values at longer wavelengths in both systems. These results highlight the importance of increasing the signal-to-noise ratio and decreasing the stray light levels in future ZEN radiometer versions.
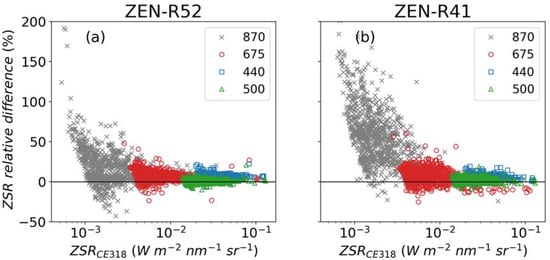
Figure 6.
ZSR relative differences between (a) ZEN-R52 and (b) ZEN-R41 against CE318-AERONET ((ZSRZEN-R-ZSRCE318)/ ZSRCE318) in logarithmic scale at the four coincident channels: 870 nm (grey crosses), 675 nm (red circles), 440 nm (blue squares), and 500 nm (green triangles).
3.3. AOD Results
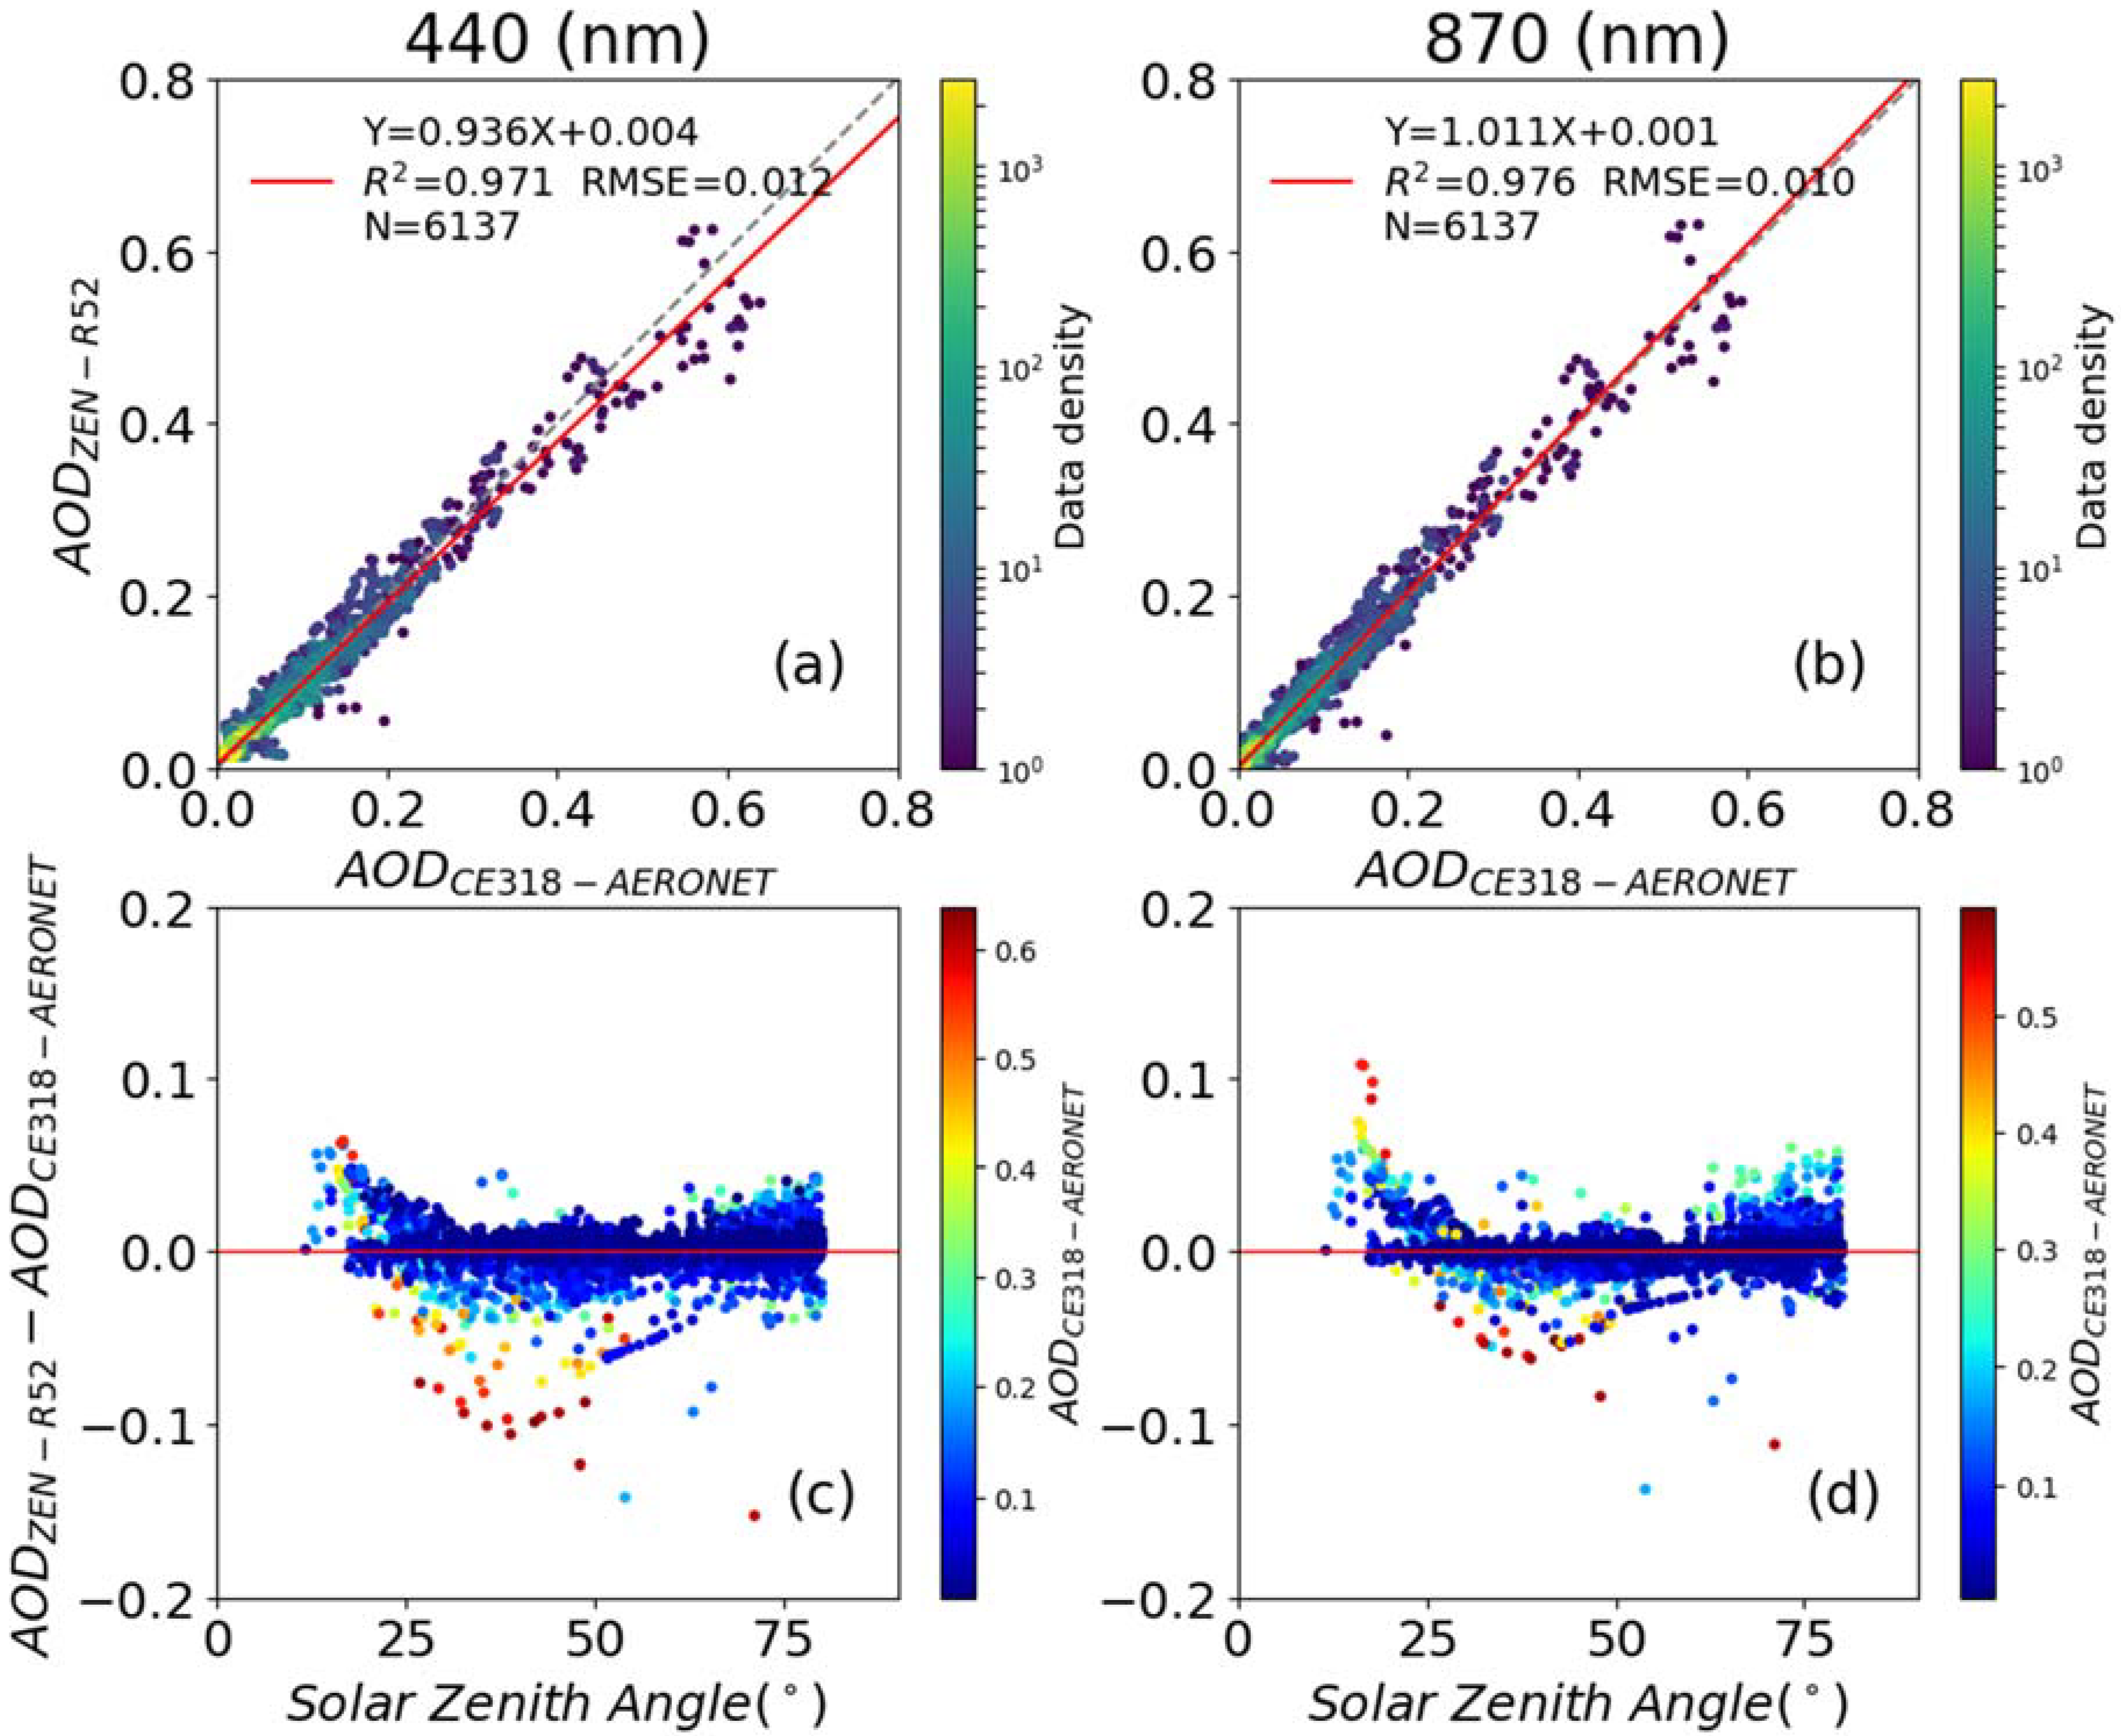
Quality-controlled ZEN-R52 AODs were compared to CE318-AERONET AOD version 3 level 2.0 data at IZO. The matching criterion was the same as the one defined in Section 3.2. CE318-AERONET versus ZEN-R52 AOD scatterplots at 440 and 870 nm are shown in Figure 7a,b. A good correlation between both datasets can be observed, with high coefficients of determination between 0.97 and 0.98 and a low RMSE (0.010 to 0.012).
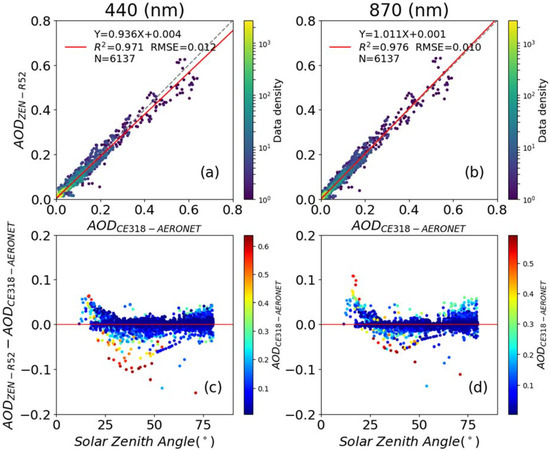
Figure 7.
AOD scatter plot between AERONET and ZEN-R52 at 440 nm (a) and 870 nm (b) nominal wavelengths. The red line shows the linear fit equation, the broken grey line shows the diagonal and the colour bar indicates the density of data. ZEN-R52–AERONET AOD differences against the solar zenith angle are shown in (c) for 440 nm and in (d) for 870 nm, where the colour bar indicates AERONET AOD.
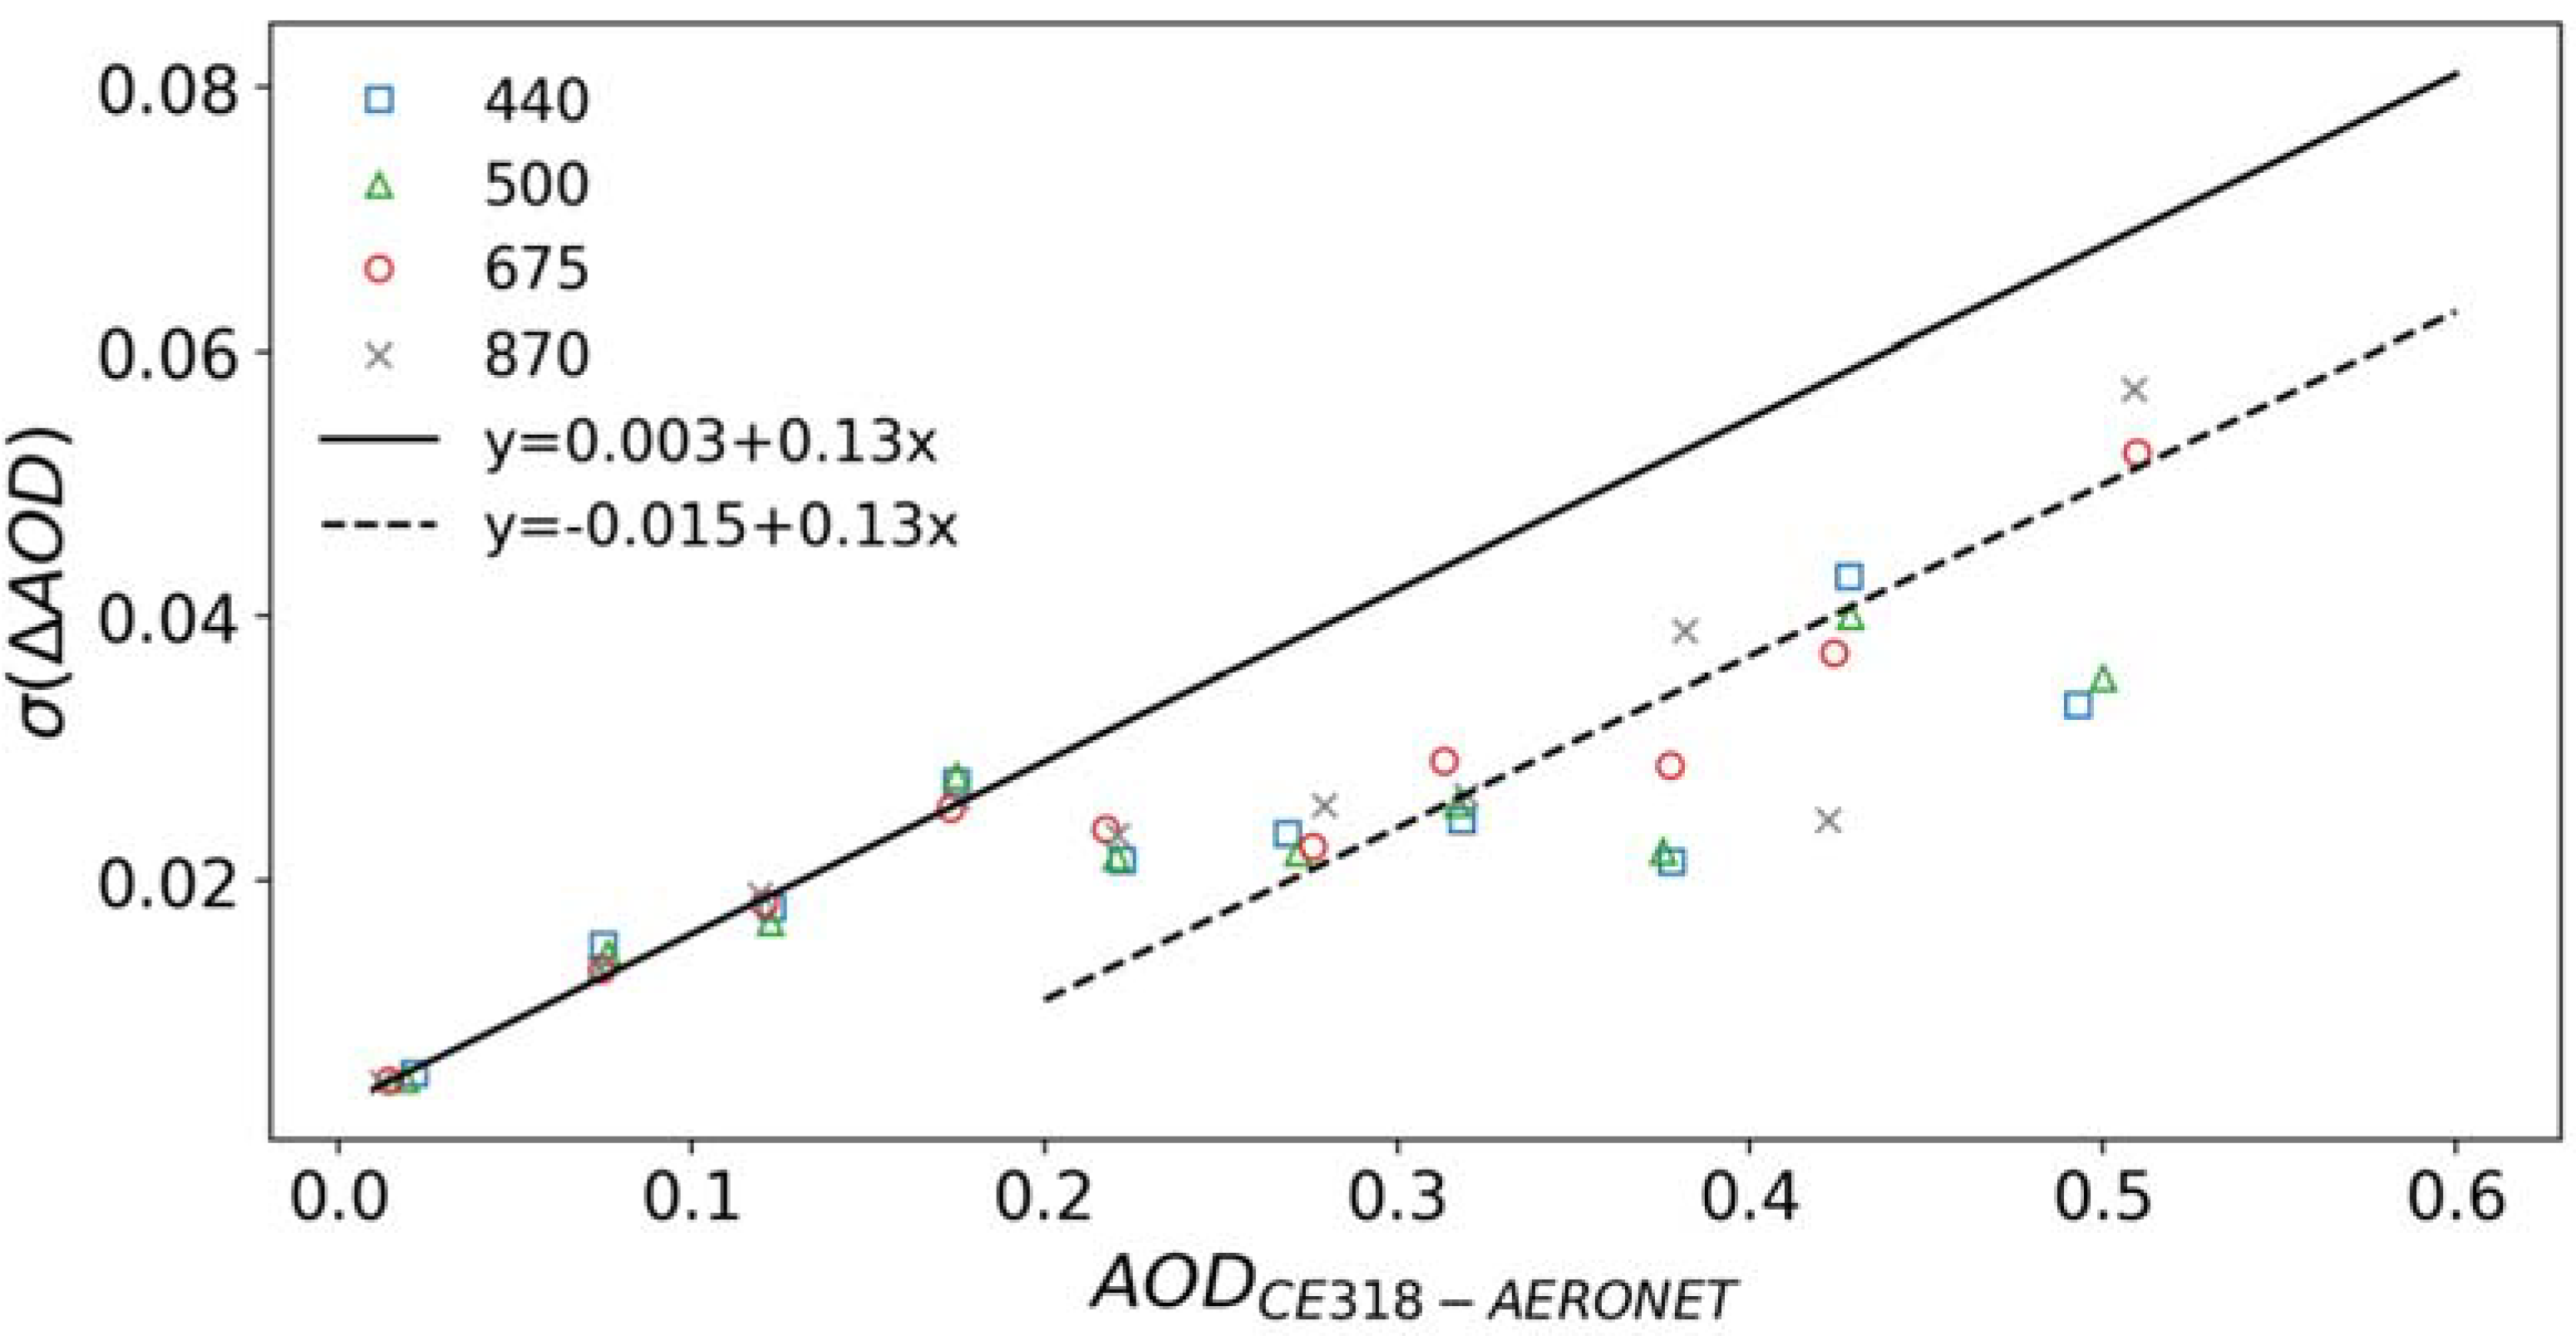
Figure 7c,d show the AOD differences (AODZEN-R52 - AODCE318) against SZA, indicating the dependence of AODZEN-R52 on the solar elevation. For low AOD values (AOD ≤ 0.2), the AOD differences show a smooth “smile-shape” curve with the SZA. For SZA > 60°, the higher scatter could be explained because the plane-parallel approach employed by the DIScrete ORdinate Radiative Transfer (DISORT) solver is not a good enough approximation [48,56], while for SZA < 30°, the higher observed differences could be accounted for by ZEN-R52 instrumental issues, like stray light (recall Section 3.1). For higher AOD values (AOD ≥ 0.2), this “smile-shape” behaviour is also identified, but the differences are more accentuated, likely because the multiple scattering processes are not fully solved in ZEN–AOD–LUT simulations. This becomes more critical at higher SZAs, when the radiative properties, especially the phase function, estimated from the imposed mixture of aerosol components, could largely deviate from the real properties as the aerosol load increases. This SZA dependence was also shown by [37], highlighting the importance of an accurate aerosol characterization and its impact on the modeling of aerosol scattering in the near-forward direction. Overall, the results presented in this paper are similar to those presented in [37] when the AOD from ZEN-R41 and CE318-AERONET were compared at Izaña. Those authors estimated the uncertainty of the ZEN–AOD–LUT method by means of a sensitivity study of values up to 0.06 (for AOD500 ~0.5) and up to 0.15 (for AOD500 ~1.0) when an instrumental error of 5% was considered. In this work, we empirically estimated the AOD uncertainty through the comparison of ZEN-R52 with CE318-AERONET, considering the latter as a reference. The standard deviation of the AOD differences for every channel at AOD intervals of 0.05 (between 0 and 0.6) are plotted in Figure 8. The standard deviation of the AOD differences was found to be linearly dependent on the AOD interval considered, with different intercepts (0.003 for the lower interval and -0.015 for the higher) and the same slope (0.13). Considering that CE318 AOD uncertainty is established to be around ±0.01, we estimate the ZEN-R52 AOD 1σ uncertainty to be ±0.01 ± 0.13*AOD.
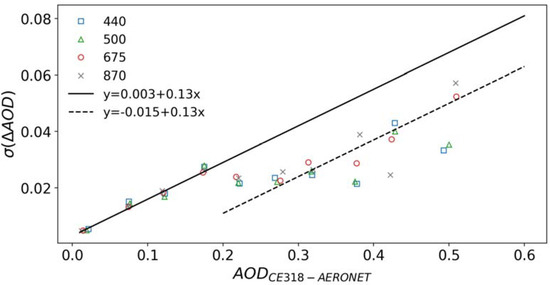
Figure 8.
Standard deviation of the AOD differences between CE318-AERONET and ZEN-R52 for different AOD intervals of 0.05 between zero and 0.6. Data at 440, 500, 675, and 870 nm, are represented by blue squares, green triangles, red circles, and grey crosses, respectively. The black solid line represents the fitting equation for the standard deviation of the AOD differences for AOD values between zero and 0.2, while the broken black line depicts the fitting equation for the standard deviation of the AOD differences for higher AOD values (0.25 to 0.55).
3.4. PWV Results
We have compared the ZEN-R52 PWV obtained at IZO with the PWV retrieved by means of a reference FTIR spectrometer. This comparison has been extended, including data from the CE318 master radiometer at IZO.
ZEN-QC and CE318-AERONET level 2.0 (version 3) data were used in this comparison.
With regard to the PWV measurement sequence, the ZEN–R52 performs 1-minute measurements, while CE318-AERONET PWV values were obtained approximately every 15 minutes when the local time was between 9 and 15 hours. Outside this period, the frequency is variable and depends on the air mass. FTIR provides PWV measurements roughly every two minutes. The comparison analysis in the case of PWV is similar to the one described in the previous section for AOD, performed by means of matching the closest pair of records to a time difference within ±30 seconds.
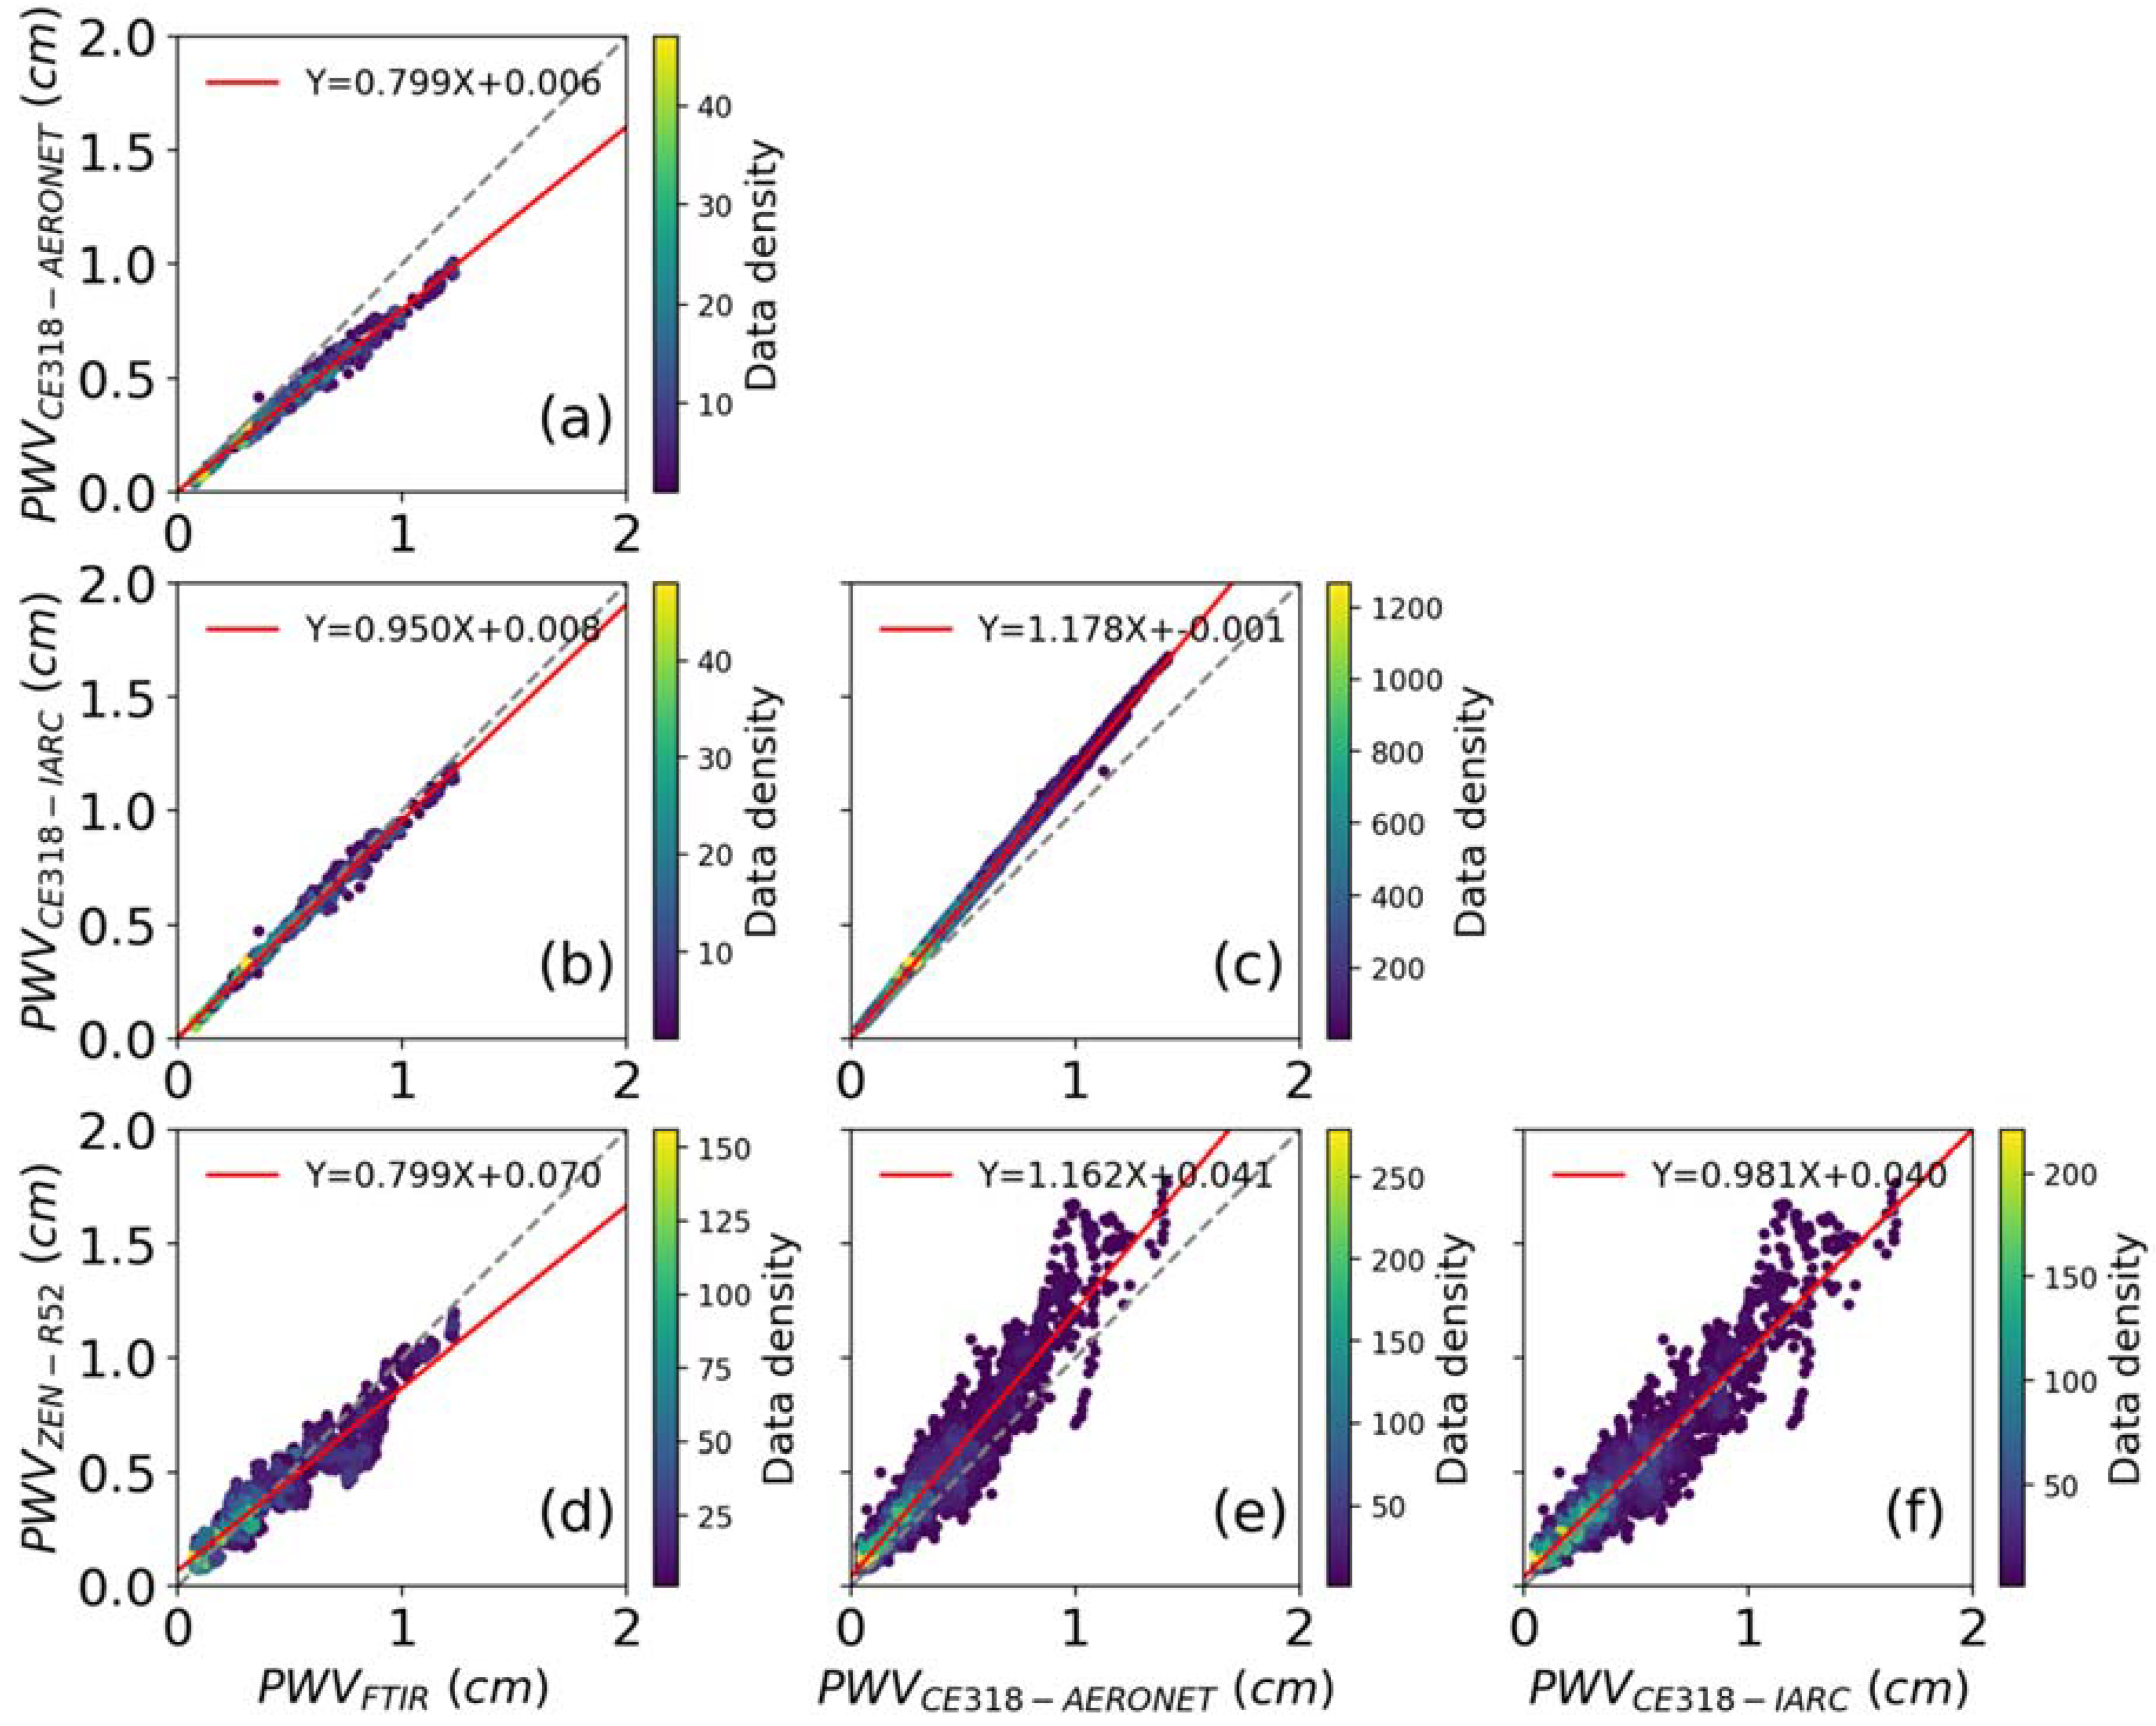
PWV scatterplots including FTIR, CE318 and ZEN-R52 are displayed in Figure 9, and the main statistics between the different datasets are shown in Table 3. In particular, the scatterplot of ZEN-R52 against FTIR PWV is shown in Figure 9d. Relatively high coefficients of determination (R2 = 0.91) and low RMSE (0.070 cm) between these two instruments are observed (Table 3), with a high standard deviation of PWV-relative differences (σ(ΔPWV/PWV) of 30.8%). Regarding the comparison between ZEN-R52 and CE318-AERONET, Figure 9e shows a lower intercept (0.04 cm), a similar R2 (0.91), but a higher RMSE (0.090 cm) and scatter (39.7%). In this case, important PWV relative differences (<ΔPWV>/PWV) of 40.1% were found.
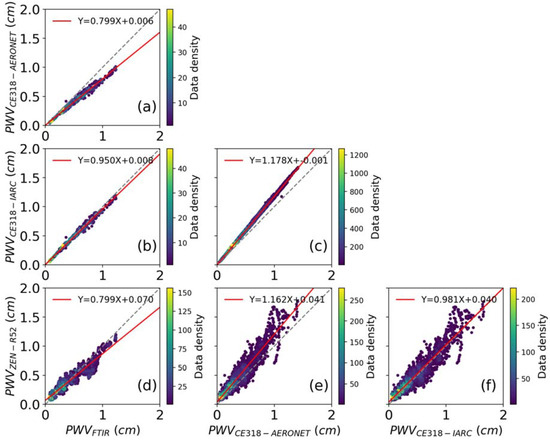
Figure 9.
PWV scatterplots between ZEN-R52, CE318-AERONET, CE318-IARC and FTIR at Izaña over a 10-month period (August 2017 to June 2018 a–f). The red line shows the linear fit equation, the broken grey line shows the diagonal and the colour bar indicates the density of data.

Table 3.
Comparisons statistics between PWV obtained from ZEN-R52, CE318-AERONET, CE318- Izaña Atmospheric Research Center (IARC) and FTIR. Mean and standard deviations of the PWV differences, in cm (here represented as <ΔPWV> and σ(ΔPWV)), are included, in addition to relative PWV differences (ΔPWV/PWV) and the standard deviation of relative PWV differences (σ(ΔPWV/PWV)), in %, taking the X dataset as a reference.
CE318-AERONET and FTIR PWV have also been compared (Figure 9a and Table 3) in order to analyze, in detail, the previous discrepancies. In this comparison, high R2 values (>0.99) and low RMSE (0.026 cm) indicate the good correlation of the data, and the low scatter between the two datasets is indicated by a low σ(ΔPWV/PWV) value of 6.1%. However, a mean PWV difference of -19.2% reveals a remarkable systematic CE318-AERONET PWV underestimation. A similar underestimation was noted previously in the work of [13] using the same instruments at Izaña. Despite the fact that different FTIR products are used in the present study, the high magnitude of this bias could point to the possible calibration inaccuracy of the CE318-AERONET PWV product. As [47] has pointed out, errors due to spectroscopic parameters dominate FTIR systematic uncertainty, but they are expected to cause systematic errors lower than 2%. In fact, as mentioned, the FTIR PWV values used here were re-calibrated following the TCCON protocols in order to minimize this wet bias to ~2%.
CE318 PWV data retrieved from the same AERONET master at Izaña, but with a self-computed calibration (CE318-IARC), were included in this study in order to understand the cause of this bias in AERONET PWV data in 2017 and 2018. The scatterplot of CE318-AERONET against CE318-IARC PWV (Figure 9c) shows a non-existent intercept and a slope of 1.178 from the regression analysis. A mean PWV difference of 17.9% (Table 3) in addition to the reduction in <ΔPWV> between FTIR and CE318-IARC (−3.4%) indicates that the specific calibration of the 940 nm channel significantly improves the PWV estimation compared with the standard AERONET PWV product. The regression analysis in Figure 9b,f shows a close-to-unit slope in the comparison of CE318-IARC versus FTIR and ZEN-R52 versus CE318-IARC, respectively. A similar scatter (5.7%), but a considerably lower bias (−3.4%) in the CE318-FTIR, when using the self-calibrated dataset, corroborates the better performance of the CE318-IARC calibration at 940 nm. These results are consistent with those reported in [13]. In this regard, using the CE318-IARC calibration, a mean bias of −0.016 cm is retrieved, much lower than that provided by CE318-AERONET in this study (−0.091 cm) and that found in [2] (−0.113 cm) when compared with the same AERONET product.
Regarding the ZEN-R52 PWV product, the intercept of the regression analysis close to 0.07 cm found when compared to FTIR, evidence there is not an important bias affecting PWV, but it is significant for very dry conditions (PWV ≤ 0.2 cm). The value of 0.089 cm for σ(ΔPWV) found for the full dataset between FTIR and ZEN-R52 can be used as a conservative estimator of the ZEN-R52’s PWV uncertainty, while <ΔPWV> values give an estimation of the instrument’s accuracy, between 9.1% (FTIR versus ZEN) and 17.1% (CE318-IARC versus ZEN).
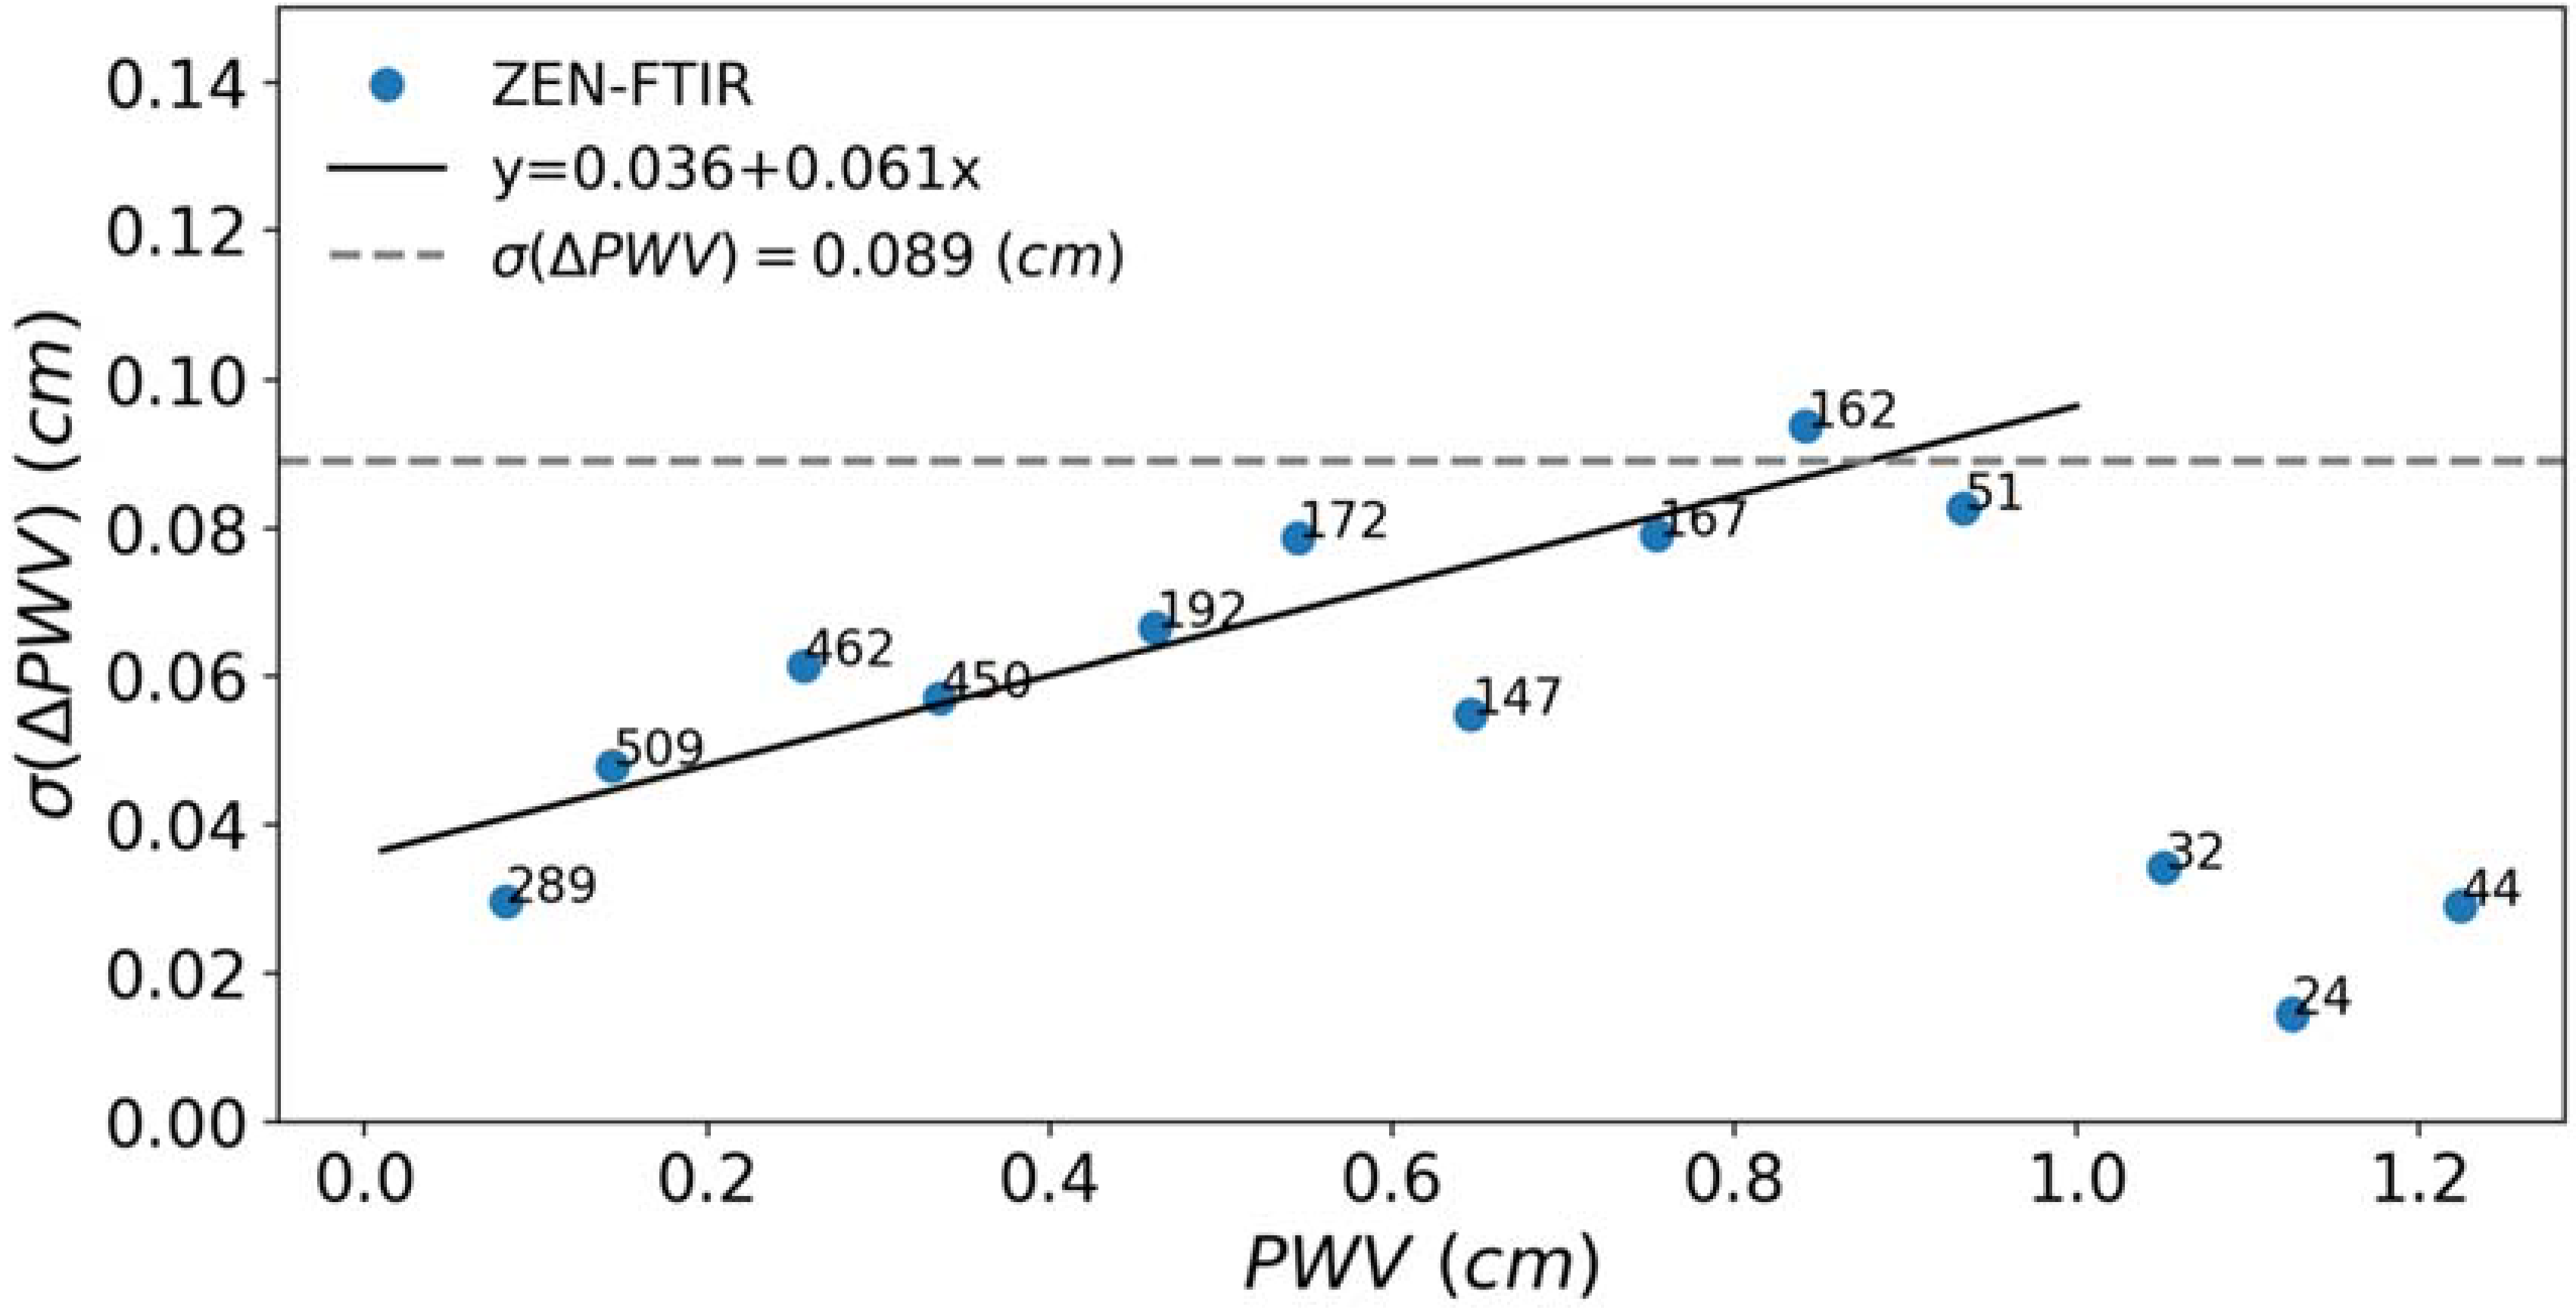
Analogously to Section 3.3, we can also analyse if the ZEN-R52 PWV uncertainty shows a dependency on the PWV values. For this purpose, in Figure 10, we show the standard deviation of the PWV differences between ZEN-R52 and FTIR for FTIR PWV intervals of 0.1 cm (between 0 and 1.3 cm). For a better interpretation of the significance of the different PWV intervals, the number of points for each PWV bin is also displayed in the figure. In a similar manner to AOD, two differentiated branches for the σ(ΔPWV) were found. For PWV < 1.0 cm, the standard deviation of the PWV differences show a clear lineal dependence (R2 = 0.73) on the PWV values and, thus, the uncertainty of the ZEN-R52 PWV can be estimated as: ±0.036 ± 0.061*PWV. Above the 1 cm limit, PWV observations are scarce, which prevents us from estimating the PWV uncertainty’s dependency on this range. Thus, we should assume that the standard deviation of the PWV differences, 0.089 cm, is a conservative value for the ZEN PWV uncertainty above 1 cm.
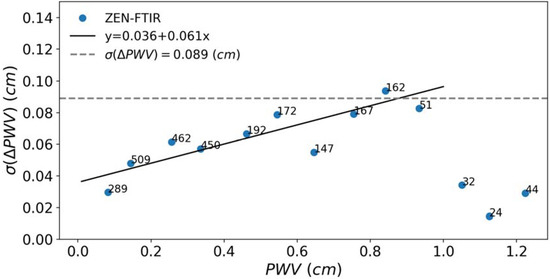
Figure 10.
Standard deviation of the PWV differences between FTIR and ZEN-R52 (blue dots) for PWV intervals of 0.1 cm between 0 and 1.3 cm approximately. Numbers near the dots indicate the number of data included in each interval. The black solid line represents the fitting equation for the standard deviation of the PWV differences for PWV values between 0.1 and 1.0 cm. The broken grey line depicts the standard deviation of PWV differences between FTIR and ZEN-R52 for the full dataset.
4. Summary and Conclusions
The new ZEN-R52 has been specifically designed to monitor aerosols and atmospheric water vapor with a high degree of autonomy and robustness. The most remarkable differences in comparison to the previous ZEN-R41 prototype presented in [37] are the reduced field of view (smaller than 2°), the increased signal-to-noise ratio, better stray light rejection and the additional channel at 940 nm for PWV retrieval.
A new LUT methodology was used to estimate PWV (ZEN-PWV-LUT) over a 10-month period (August 2017 to June 2018) at Izaña high-altitude station by minimizing the normalized mean squared differences of computed and measured ZSRs. The new ZEN-PWV-LUT is dependent on the AOD previously retrieved by means of the ZEN–AOD–LUT method. A quality control procedure (ZEN-QC) was specifically designed to remove cloud-contaminated and erroneous data from the ZEN-R52 radiometer dataset. This ZEN-QC was validated against AERONET level 2.0 (version 3) data, showing a good performance.
The validation analysis in terms of quasi-simultaneous (±30 s) ZSRs was carried out, considering CE318-AERONET ZSRs derived from PPL sky radiance measurements as a reference. Our results showed the improved performance of the ZEN-R52 compared with the ZEN-R41, but some effects of stray light are still discernible at longer wavelengths and lower SZA.
CE318-AERONET versus ZEN-R52 quasi-simultaneous AOD comparison showed a good correlation between both datasets (≈0.97) with low RMSE values (0.010 to 0.012). However, the presence of a systematic dependence of the AOD differences on SZA indicates the effect of inaccuracies on the radiative transfer modeling and on the instrumental measurements. This study also estimated the ZEN-R52 AOD uncertainty to be ±0.01 ± 0.13*AOD.
A quasi-simultaneous PWV comparison between FTIR and ZEN-R52 indicated the good performance of the ZEN-R52 LUT PWV product, with an RMSE of 0.07 cm, R2 of 0.91 and a mean PWV difference of 9.1%. Two different CE318 PWV datasets from the AERONET’s permanent master at Izaña Observatory have been used: one obtained from AERONET (CE318-AERONET) and another one using a specific calibration performed in this study (CE318-IARC) using on-site actual input atmospheric parameters for the water vapor transmittance modeling. This approach provides better PVW values than those provided by CE318-AERONET when compared with the FTIR results for reference, despite the fact that it is worth admitting that AERONET PWV is a standard and global product. Our results show that the new ZEN-PWV-LUT technique provides fairly good estimations of PWV, with mean PWV relative differences of 9.1% and 17.1% with FTIR and CE318-IARC, respectively. The expected uncertainty of this technique is estimated to be ±0.089 cm, which is an excellent result for a low-cost instrument. A subsequent uncertainty analysis estimated the PWV uncertainty to be linearly dependent on the PWV for PWV values < 1cm, following the equation ±0.036 ± 0.061*PWV.
The general conclusion is that the ZEN-R52 might be considered a useful tool to expand aerosol and water vapor monitoring from ground-based instrumentation in desert areas, thereby increasing the representativeness of ground measurements for constraining global and relatively coarse-resolution models. The ZEN-R52 might also improve our capabilities for satellite validation and aerosol model evaluation/assimilation in remote areas. The comprehensive validation performed in this paper in terms of ZSR, AOD and PWV against the CE318-AERONET reference instrument at Izaña observatory adds weight to the potential use of a ZEN network to expand aerosol and water vapor observations in remote areas. This study reveals that some improvements in future ZEN systems regarding their optical performance (signal-to-noise ratio and stray light) might be considered. Radiative transfer calculations, employing a higher resolution parametrization for water vapor absorption, which does not entail a greater computing time, would be a noticeable improvement. Finally, a new filter with a sixe of around 1020 nm would improve the AOD estimation at longer wavelengths, and therefore the PWV estimation.
Author Contributions
A.F.A., E.C., B.T. and Á.B. designed the structure and methodology of the paper and wrote the main part of the manuscript. A.F.A. computed all the calculations performed in the paper. R.D.G. participated in the simulations. A.B. and C.V.-M. contributed to the characterization of the ZEN system. O.E.G. responsible for the FTIR program at Izaña, providing the FTIR PWV data and contributing to the instrument’s description. Á.M.d.F. and V.E.C. provided interesting ideas used in this paper, and advised us based on their experience in radiometry. C.G.-F. and R.R. have performed the quality control of the CE318-AERONET at Izaña. M.M., C.L. and R.N. were in charge of ZEN design and hardware/software development, and they contributed to the instrument description. All authors discussed the results and contributed to the final paper. All authors have read and agreed to the published version of the manuscript.
Funding
This study has been performed thanks to regular funds from the State Meteorological Agency of Spain (AEMET) to the World Meteorological Organization (WMO) Commission for Instruments and Methods of Observations (CIMO) Izaña Testbed for Aerosols and Water Vapor Remote Sensing Instruments, dedicated resources from SIELTEC S.L., and the European Community Research Infrastructure Action under the FP7 ACTRIS grant, agreement no. 262254.
Acknowledgments
The authors are grateful to the LibRadtran team for their assistance with the radiative transfer simulations performed in this paper. We also acknowledge Izaña staff for maintaining the instrumentation, thus ensuring the quality of the data. This work has been developed within the framework of the activities of the World Meteorological Organization (WMO) Commission for Instruments and Methods of Observations (CIMO) Izaña Testbed for Aerosols and Water Vapor Remote Sensing Instruments. AERONET sun photometers at Izaña were calibrated within the AERONET Europe TNA, supported by the European Community Research Infrastructure Action under the FP7 ACTRIS grant, agreement no. 262254. The authors are grateful to the Spanish Ministry of Science, Innovation and Universities for its support through the ePOLAAR project (RTI2018-097864-B-I00).
Conflicts of Interest
The authors declare no conflict of interest.
References
- Myhre, G.; Shindell, D.; Bréon, F.-M.; Collins, W.; Fuglestvedt, J.; Huang, J.; Koch, D.; Lamarque, J.-F.; Lee, D.; Mendoza, B.; et al. Anthropogenic and natural radiative forcing. In Climate Change 2013: The Physical Science Basis. Contribution of Working Group I to the Fifth Assessment Report of the Intergovernmental Panel on Climate Change; Stocker, T.F., Qin, D., Plattner, G.-K., Tignor, M., Allen, S.K., Boschung, J., Nauels, A., Xia, Y., Bex, V., Midgley, P.M., Eds.; Cambridge University Press: Cambridge, UK; New York, NY, USA, 2013; pp. 659–740. ISBN 978-1-107-66182-0. [Google Scholar]
- Wagner, T.; Beirle, S.; Grzegorski, M.; Platt, U. Global trends (1996–2003) of total column precipitable water observed by Global Ozone Monitoring Experiment (GOME) on ERS-2 and their relation to near-surface temperature. J. Geophys. Res. Atmos. 2006, 111, D12102. [Google Scholar] [CrossRef]
- Chen, B.; Liu, Z. Global water vapor variability and trend from the latest 36 year (1979 to 2014) data of ECMWF and NCEP reanalyses, radiosonde, GPS, and microwave satellite. J. Geophys. Res. Atmos. 2016, 121, 11442–11462. [Google Scholar] [CrossRef]
- Intergovernmental Panel on Climate Change. Climate Change 2007: The Physical Science Basis. Contribution of Working Group I to the Fourth Assessment Report of the Intergovernmental Panel on Climate Change; Solomon, S., Qin, D., Manning, M., Chen, Z., Marquis, M., Averyt, K.B., Tignor, M., Miller, H.L., Eds.; Cambridge University Press: Cambridge, UK; New York, NY, USA, 2007. [Google Scholar]
- Allan, R.P.; Soden, B.J. Atmospheric warming and the amplification of precipitation extremes. Science 2008, 321, 1481–1484. [Google Scholar] [CrossRef]
- Zhang, L.; Wu, L.; Gan, B. Modes and mechanisms of global water vapor variability over the twentieth century. J. Clim. 2013, 26, 5578–5593. [Google Scholar] [CrossRef]
- Mieruch, S.; Noël, S.; Bovensmann, H.; Burrows, J.P. Analysis of global water vapour trends from satellite measurements in the visible spectral range. Atmos. Chem. Phys. 2008, 8, 491–504. [Google Scholar] [CrossRef]
- Mieruch, S.; Schröder, M.; Noël, S.; Schulz, J. Comparison of decadal global water vapor changes derived from independent satellite time series. J. Geophys. Res. Atmos. 2014, 119, 12489–12499. [Google Scholar] [CrossRef]
- Kunz, A.; Spelten, N.; Konopka, P.; Müller, R.; Forbes, R.M.; Wernli, H. Comparison of fast in situ stratospheric hygrometer (FISH) measurements of water vapor in the upper troposphere and lower stratosphere (UTLS) with ECMWF (re)analysis data. Atmos. Chem. Phys. 2014, 14, 10803–10822. [Google Scholar] [CrossRef]
- Jiang, J.H.; Su, H.; Zhai, C.; Wu, L.; Minschwaner, K.; Molod, A.M.; Tompkins, A.M. An assessment of upper troposphere and lower stratosphere water vapor in MERRA, MERRA2, and ECMWF reanalyses using Aura MLS observations. J. Geophys. Res. Atmos. 2015, 120, 11468–11485. [Google Scholar] [CrossRef]
- Cadeddu, M.P.; Liljegren, J.C.; Turner, D.D. The Atmospheric radiation measurement (ARM) program network of microwave radiometers: Instrumentation, data, and retrievals. Atmos. Meas. Tech. 2013, 6, 2359–2372. [Google Scholar] [CrossRef]
- Dirksen, R.J.; Sommer, M.; Immler, F.J.; Hurst, D.F.; Kivi, R.; Vömel, H. Reference quality upper-air measurements: GRUAN data processing for the Vaisala RS92 radiosonde. Atmos. Meas. Tech. 2014, 7, 4463–4490. [Google Scholar] [CrossRef]
- Schneider, M.; Romero, P.M.; Hase, F.; Blumenstock, T.; Cuevas, E.; Ramos, R. Continuous quality assessment of atmospheric water vapour measurement techniques: FTIR, Cimel, MFRSR, GPS, and Vaisala RS92. Atmos. Meas. Tech. 2010, 3, 323–338. [Google Scholar] [CrossRef]
- Miloshevich, L.M.; Vömel, H.; Whiteman, D.N.; Leblanc, T. Accuracy assessment and correction of Vaisala RS92 radiosonde water vapor measurements. J. Geophys. Res. Atmos. 2009, 114. [Google Scholar] [CrossRef]
- Jensen, M.P.; Holdridge, D.J.; Survo, P.; Lehtinen, R.; Baxter, S.; Toto, T.; Johnson, K.L. Comparison of Vaisala radiosondes RS41 and RS92 at the ARM Southern Great Plains site. Atmos. Meas. Tech. 2016, 9, 3115–3129. [Google Scholar] [CrossRef]
- Bevis, M.; Businger, S.; Herring, T.A.; Rocken, C.; Anthes, R.A.; Ware, R.H. GPS meteorology: Remote sensing of atmospheric water vapor using the global positioning system. J. Geophys. Res. Atmos. 1992, 97, 15787–15801. [Google Scholar] [CrossRef]
- Wang, J.; Zhang, L.; Dai, A.; Hove, T.V.; Baelen, J.V. A near-global, 2-hourly data set of atmospheric precipitable water from ground-based GPS measurements. J. Geophys. Res. Atmos. 2007, 112, D11107. [Google Scholar] [CrossRef]
- Alexandrov, M.D.; Schmid, B.; Turner, D.D.; Cairns, B.; Oinas, V.; Lacis, A.A.; Gutman, S.I.; Westwater, E.R.; Smirnov, A.; Eilers, J. Columnar water vapor retrievals from multifilter rotating shadowband radiometer data. J. Geophys. Res. Atmos. 2009, 114, D02306. [Google Scholar] [CrossRef]
- Halthore, R.N.; Eck, T.F.; Holben, B.N.; Markham, B.L. Sun photometric measurements of atmospheric water vapor column abundance in the 940-nm band. J. Geophys. Res. Atmos. 1997, 102, 4343–4352. [Google Scholar] [CrossRef]
- Schmid, B.; Michalsky, J.J.; Slater, D.W.; Barnard, J.C.; Halthore, R.N.; Liljegren, J.C.; Holben, B.N.; Eck, T.F.; Livingston, J.M.; Russell, P.B.; et al. Comparison of columnar water-vapor measurements from solar transmittance methods. Appl. Opt. 2001, 40, 1886–1896. [Google Scholar] [CrossRef]
- Torres, B.; Cachorro, V.E.; Toledano, C.; de Galisteo, J.P.O.; Berjón, A.; de Frutos, A.M.; Bennouna, Y.; Laulainen, N. Precipitable water vapor characterization in the Gulf of Cadiz region (southwestern Spain) based on Sun photometer, GPS, and radiosonde data. J. Geophys. Res. Atmos. 2010, 115, D18103. [Google Scholar] [CrossRef]
- Pérez-Ramírez, D.; Navas-Guzmán, F.; Lyamani, H.; Fernández-Gálvez, J.; Olmo, F.J.; Alados-Arboledas, L. Retrievals of precipitable water vapor using star photometry: Assessment with Raman lidar and link to sun photometry. J. Geophys. Res. Atmos. 2012, 117, D05202. [Google Scholar] [CrossRef]
- Pérez-Ramírez, D.; Whiteman, D.N.; Smirnov, A.; Lyamani, H.; Holben, B.N.; Pinker, R.; Andrade, M.; Alados-Arboledas, L. Evaluation of AERONET precipitable water vapor versus microwave radiometry, GPS, and radiosondes at ARM sites. J. Geophys. Res. Atmos. 2014, 119, 9596–9613. [Google Scholar] [CrossRef]
- Cachorro, V.E.; Utrillas, P.; Vergaz, R.; Durán, P.; de Frutos, A.M.; Martinez-Lozano, J.A. Determination of the atmospheric-water-vapor content in the 940-nm absorption band by use of moderate spectral-resolution measurements of direct solar irradiance. Appl. Opt. 1998, 37, 4678–4689. [Google Scholar] [CrossRef] [PubMed]
- Raptis, P.-I.; Kazadzis, S.; Gröbner, J.; Kouremeti, N.; Doppler, L.; Becker, R.; Helmis, C. Water vapour retrieval using the Precision Solar Spectroradiometer. Atmos. Meas. Tech. 2018, 11, 1143–1157. [Google Scholar] [CrossRef]
- Trenberth, K.E.; Jones, P.D.; Ambenje, P.; Bojariu, R.; Easterling, D.; Klein Tank, A.; Parker, D.; Rahimzadeh, F.; Renwick, J.A.; Rusticucci, M.; et al. Observations: Surface and Atmospheric Climate Change. In IPCC, 2007: Climate Change 2007: The Physical Science Basis. Contribution of Working Group I to the Fourth Assessment Report of the Intergovernmental Panel on Climate Change; Solomon, S., Qin, D., Manning, M., Chen, Z., Marquis, M., Averyt, K.B., Tignor, M., Miller, H.L., Eds.; Cambridge University Press: Cambridge, UK; New York, NY, USA, 2007. [Google Scholar]
- Boucher, O.; Randall, D.; Artaxo, P.; Bretherton, C.; Feingold, G.; Forster, P.; Kerminen, V.-M.; Kondo, Y.; Liao, H.; Lohmann, U.; et al. Clouds and aerosols. In Climate Change 2013: The Physical Science Basis. Contribution of Working Group I to the Fifth Assessment Report of the Intergovernmental Panel on Climate Change; Stocker, T.F., Qin, D., Plattner, G.-K., Tignor, M., Allen, S.K., Boschung, J., Nauels, A., Xia, Y., Bex, V., Midgley, P.M., Eds.; Cambridge University Press: Cambridge, UK; New York, NY, USA, 2013; pp. 571–658. ISBN 978-1-107-66182-0. [Google Scholar]
- Holben, B.N.; Tanré, D.; Smirnov, A.; Eck, T.F.; Slutsker, I.; Abuhassan, N.; Newcomb, W.W.; Schafer, J.S.; Chatenet, B.; Lavenu, F.; et al. An emerging ground-based aerosol climatology: Aerosol optical depth from AERONET. J. Geophys. Res. C Ocean. 2001, 106, 12067–12097. [Google Scholar] [CrossRef]
- Kazadzis, S.; Kouremeti, N.; Diémoz, H.; Gröbner, J.; Forgan, B.W.; Campanelli, M.; Estellés, V.; Lantz, K.; Michalsky, J.; Carlund, T.; et al. Results from the Fourth WMO Filter Radiometer Comparison for aerosol optical depth measurements. Atmos. Chem. Phys. 2018, 18, 3185–3201. [Google Scholar] [CrossRef]
- Li, Z.; Zhao, X.; Kahn, R.; Mishchenko, M.; Remer, L.; Lee, K.-H.; Wang, M.; Laszlo, I.; Nakajima, T.; Maring, H. Uncertainties in satellite remote sensing of aerosols and impact on monitoring its long-term trend: A review and perspective. Ann. Geophys. 2009, 27, 2755–2770. [Google Scholar] [CrossRef]
- Bruegge, C.J.; Conel, J.E.; Green, R.O.; Margolis, J.S.; Holm, R.G.; Toon, G. Water vapor column abundance retrievals during FIFE. J. Geophys. Res. Atmos. 1992, 97, 18759–18768. [Google Scholar] [CrossRef]
- Campanelli, M.; Mascitelli, A.; Sanò, P.; Diémoz, H.; Estellés, V.; Federico, S.; Iannarelli, A.M.; Fratarcangeli, F.; Mazzoni, A.; Realini, E.; et al. Precipitable water vapour content from ESR/SKYNET sun–sky radiometers: Validation against GNSS/GPS and AERONET over three different sites in Europe. Atmos. Meas. Tech. 2018, 11, 81–94. [Google Scholar] [CrossRef]
- Wehrli, C. GAWPFR: A network of aerosol optical depth observations with precision filter radiometers. In Proceedings of the WMOGAW Experts Workshop Global Surface Based Network Long Term Observations Column Aerosol Optical Properties, Davos, Switzerland, 8–10 March 2004; pp. 36–39. [Google Scholar]
- Che, H.; Zhang, X.-Y.; Xia, X.; Goloub, P.; Holben, B.; Zhao, H.; Wang, Y.; Zhang, X.-C.; Wang, H.; Blarel, L.; et al. Ground-based aerosol climatology of China: Aerosol optical depths from the China Aerosol Remote Sensing Network (CARSNET) 2002–2013. Atmos. Chem. Phys. 2015, 15, 7619–7652. [Google Scholar] [CrossRef]
- Takamura, T.; Nakajima, T. Overview of SKYNET and its Activities. Óptica Pura Apl. 2004, 37, 3303–3308. [Google Scholar]
- Holben, B.N.; Eck, T.F.; Slutsker, I.; Tanré, D.; Buis, J.P.; Setzer, A.; Vermote, E.; Reagan, J.A.; Kaufman, Y.J.; Nakajima, T.; et al. AERONET—A federated instrument network and data archive for aerosol characterization. Remote Sens. Environ. 1998, 66, 1–16. [Google Scholar] [CrossRef]
- Almansa, A.F.; Cuevas, E.; Torres, B.; Barreto, A.; García, R.D.; Cachorro, V.E.; de Frutos, A.M.; López, C.; Ramos, R. A new zenith-looking narrow-band radiometer-based system (ZEN) for dust aerosol optical depth monitoring. Atmos. Meas. Tech. 2017, 10, 565–579. [Google Scholar] [CrossRef]
- Cuevas, E.; Milford, C.; Bustos, J.J.R.; García, O.E.; García, R.D.; Gómez-Peláez, A.J.; Guirado-Fuentes, C.; Marrero, C.; Prats, N.; Ramos, L.; et al. Izaña Atmospheric Research Center Activity Report 2017–2018; Cuevas, E., Milford, C., Tarasova, O., Eds.; State Meteorological Agency (AEMET): Madrid, Spain; World Meteorological Organization: Geneva, Switzerland, 2019.
- Toledano, C.; González, R.; Fuertes, D.; Cuevas, E.; Eck, T.F.; Kazadzis, S.; Kouremeti, N.; Gröbner, J.; Goloub, P.; Blarel, L.; et al. Assessment of Sun photometer Langley calibration at the high-elevation sites Mauna Loa and Izaña. Atmos. Chem. Phys. 2018, 18, 14555–14567. [Google Scholar] [CrossRef]
- Cuevas, E.; Romero-Campos, P.M.; Kouremeti, N.; Kazadzis, S.; Räisänen, P.; García, R.D.; Barreto, A.; Guirado-Fuentes, C.; Ramos, R.; Toledano, C.; et al. Aerosol optical depth comparison between GAW-PFR and AERONET-Cimel radiometers from long-term (2005–2015) 1 min synchronous measurements. Atmos. Meas. Tech. 2019, 12, 4309–4337. [Google Scholar] [CrossRef]
- Basart, S.; Perez, C.; Cuevas, E.; Baldasano, J.M.; Gobbi, G.P. Aerosol characterization in Northern Africa, Northeastern Atlantic, Mediterranean Basin and Middle East from direct-sun AERONET observations. Atmos. Chem. Phys. 2009, 9, 8265–8282. [Google Scholar] [CrossRef]
- Andrey, J.; Cuevas, E.; Parrondo, M.C.; Alonso-Pérez, S.; Redondas, A.; Gil-Ojeda, M. Quantification of ozone reductions within the Saharan air layer through a 13-year climatologic analysis of ozone profiles. Atmos. Environ. 2014, 84, 28–34. [Google Scholar] [CrossRef]
- Gui, K.; Che, H.; Chen, Q.; Zeng, Z.; Liu, H.; Wang, Y.; Zheng, Y.; Sun, T.; Liao, T.; Wang, H.; et al. Evaluation of radiosonde, MODIS-NIR-Clear, and AERONET precipitable water vapor using IGS ground-based GPS measurements over China. Atmos. Res. 2017, 197, 461–473. [Google Scholar] [CrossRef]
- Walker, J.; Cromer, C.L.; McLean, J.T. Technique for improving the calibration of large-area sphere sources. In Calibration of Passive Remote Observing Optical and Microwave Instrumentation, Proceedings of the International Society for Optics and Photonics, Orlando, FL, USA, 4–5 April 1991; Guenther, B.W., Ed.; Society of Photo-Optical Instrumentation Engineers (SPIE): Bellingham, WA, USA, 1991; Volume 1493, pp. 224–230. [Google Scholar]
- Giles, D.M.; Sinyuk, A.; Sorokin, M.G.; Schafer, J.S.; Smirnov, A.; Slutsker, I.; Eck, T.F.; Holben, B.N.; Lewis, J.R.; Campbell, J.R.; et al. Advancements in the Aerosol Robotic Network (AERONET) Version 3 database–automated near-real-time quality control algorithm with improved cloud screening for Sun photometer aerosol optical depth (AOD) measurements. Atmos. Meas. Tech. 2019, 12, 169–209. [Google Scholar] [CrossRef]
- Eck, T.F.; Holben, B.N.; Reid, J.S.; Dubovik, O.; Smirnov, A.; O’Neill, N.T.; Slutsker, I.; Kinne, S. Wavelength dependence of the optical depth of biomass burning, urban, and desert dust aerosols. J. Geophys. Res. Atmos. 1999, 104, 31333–31349. [Google Scholar] [CrossRef]
- Wunch, D.; Toon, G.C.; Sherlock, V.; Deutscher, N.M.; Liu, C.; Feist, D.G.; Wennberg, P.O. Documentation for the 2014 TCCON Data Release (Version GGG2014.R0). CaltechDATA 2015. [Google Scholar] [CrossRef]
- Mayer, B.; Kylling, A. Technical note: The libRadtran software package for radiative transfer calculations–description and examples of use. Atmos. Chem. Phys. 2005, 5, 1855–1877. [Google Scholar] [CrossRef]
- Emde, C.; Buras-Schnell, R.; Kylling, A.; Mayer, B.; Gasteiger, J.; Hamann, U.; Kylling, J.; Richter, B.; Pause, C.; Dowling, T.; et al. The libRadtran software package for radiative transfer calculations (version 2.0.1). Geosci. Model Dev. 2016, 9, 1647–1672. [Google Scholar] [CrossRef]
- Gasteiger, J.; Emde, C.; Mayer, B.; Buras, R.; Buehler, S.A.; Lemke, O. Representative wavelengths absorption parameterization applied to satellite channels and spectral bands. J. Quant. Spectrosc. Radiat. Transf. 2014, 148, 99–115. [Google Scholar] [CrossRef]
- Clough, S.A.; Shephard, M.W.; Mlawer, E.J.; Delamere, J.S.; Iacono, M.J.; Cady-Pereira, K.; Boukabara, S.; Brown, P.D. Atmospheric radiative transfer modeling: A summary of the AER codes. J. Quant. Spectrosc. Radiat. Transf. 2005, 91, 233–244. [Google Scholar] [CrossRef]
- Smirnov, A.; Holben, B.N.; Eck, T.F.; Dubovik, O.; Slutsker, I. Cloud-Screening and quality control algorithms for the AERONET database. Remote Sens. Environ. 2000, 73, 337–349. [Google Scholar] [CrossRef]
- Halthore, R.N.; Markham, B.L.; Deering, D.W. Atmospheric correction and calibration during kurex-91. In Proceedings of the IGARSS ’92 International Geoscience and Remote Sensing Symposium, Houston, TX, USA, 26–29 May 1992; Volume 2, pp. 1278–1280. [Google Scholar]
- Schmid, B.; Thorne, K.J.; Demoulin, P.; Peter, R.; Mätzler, C.; Sekler, J. Comparison of modeled and empirical approaches for retrieving columnar water vapor from solar transmittance measurements in the 0.94-μm region. J. Geophys. Res. Atmos. 1996, 101, 9345–9358. [Google Scholar] [CrossRef]
- Kasten, F. A new table and approximation formula for the relative optial air mass. Arch. Für Meteorol. Geophys. Bioklimatol. Ser. B 1965, 14, 206–223. [Google Scholar] [CrossRef]
- Dahlback, A.; Stamnes, K. A new spherical model for computing the radiation field available for photolysis and heating at twilight. Planet. Space Sci. 1991, 39, 671–683. [Google Scholar] [CrossRef]
© 2020 by the authors. Licensee MDPI, Basel, Switzerland. This article is an open access article distributed under the terms and conditions of the Creative Commons Attribution (CC BY) license (http://creativecommons.org/licenses/by/4.0/).

