Forecasting the Environmental, Social, and Governance Rating of Firms by Using Corporate Financial Performance Variables: A Rough Set Approach


Abstract
:1. Introduction
2. Materials and Methods
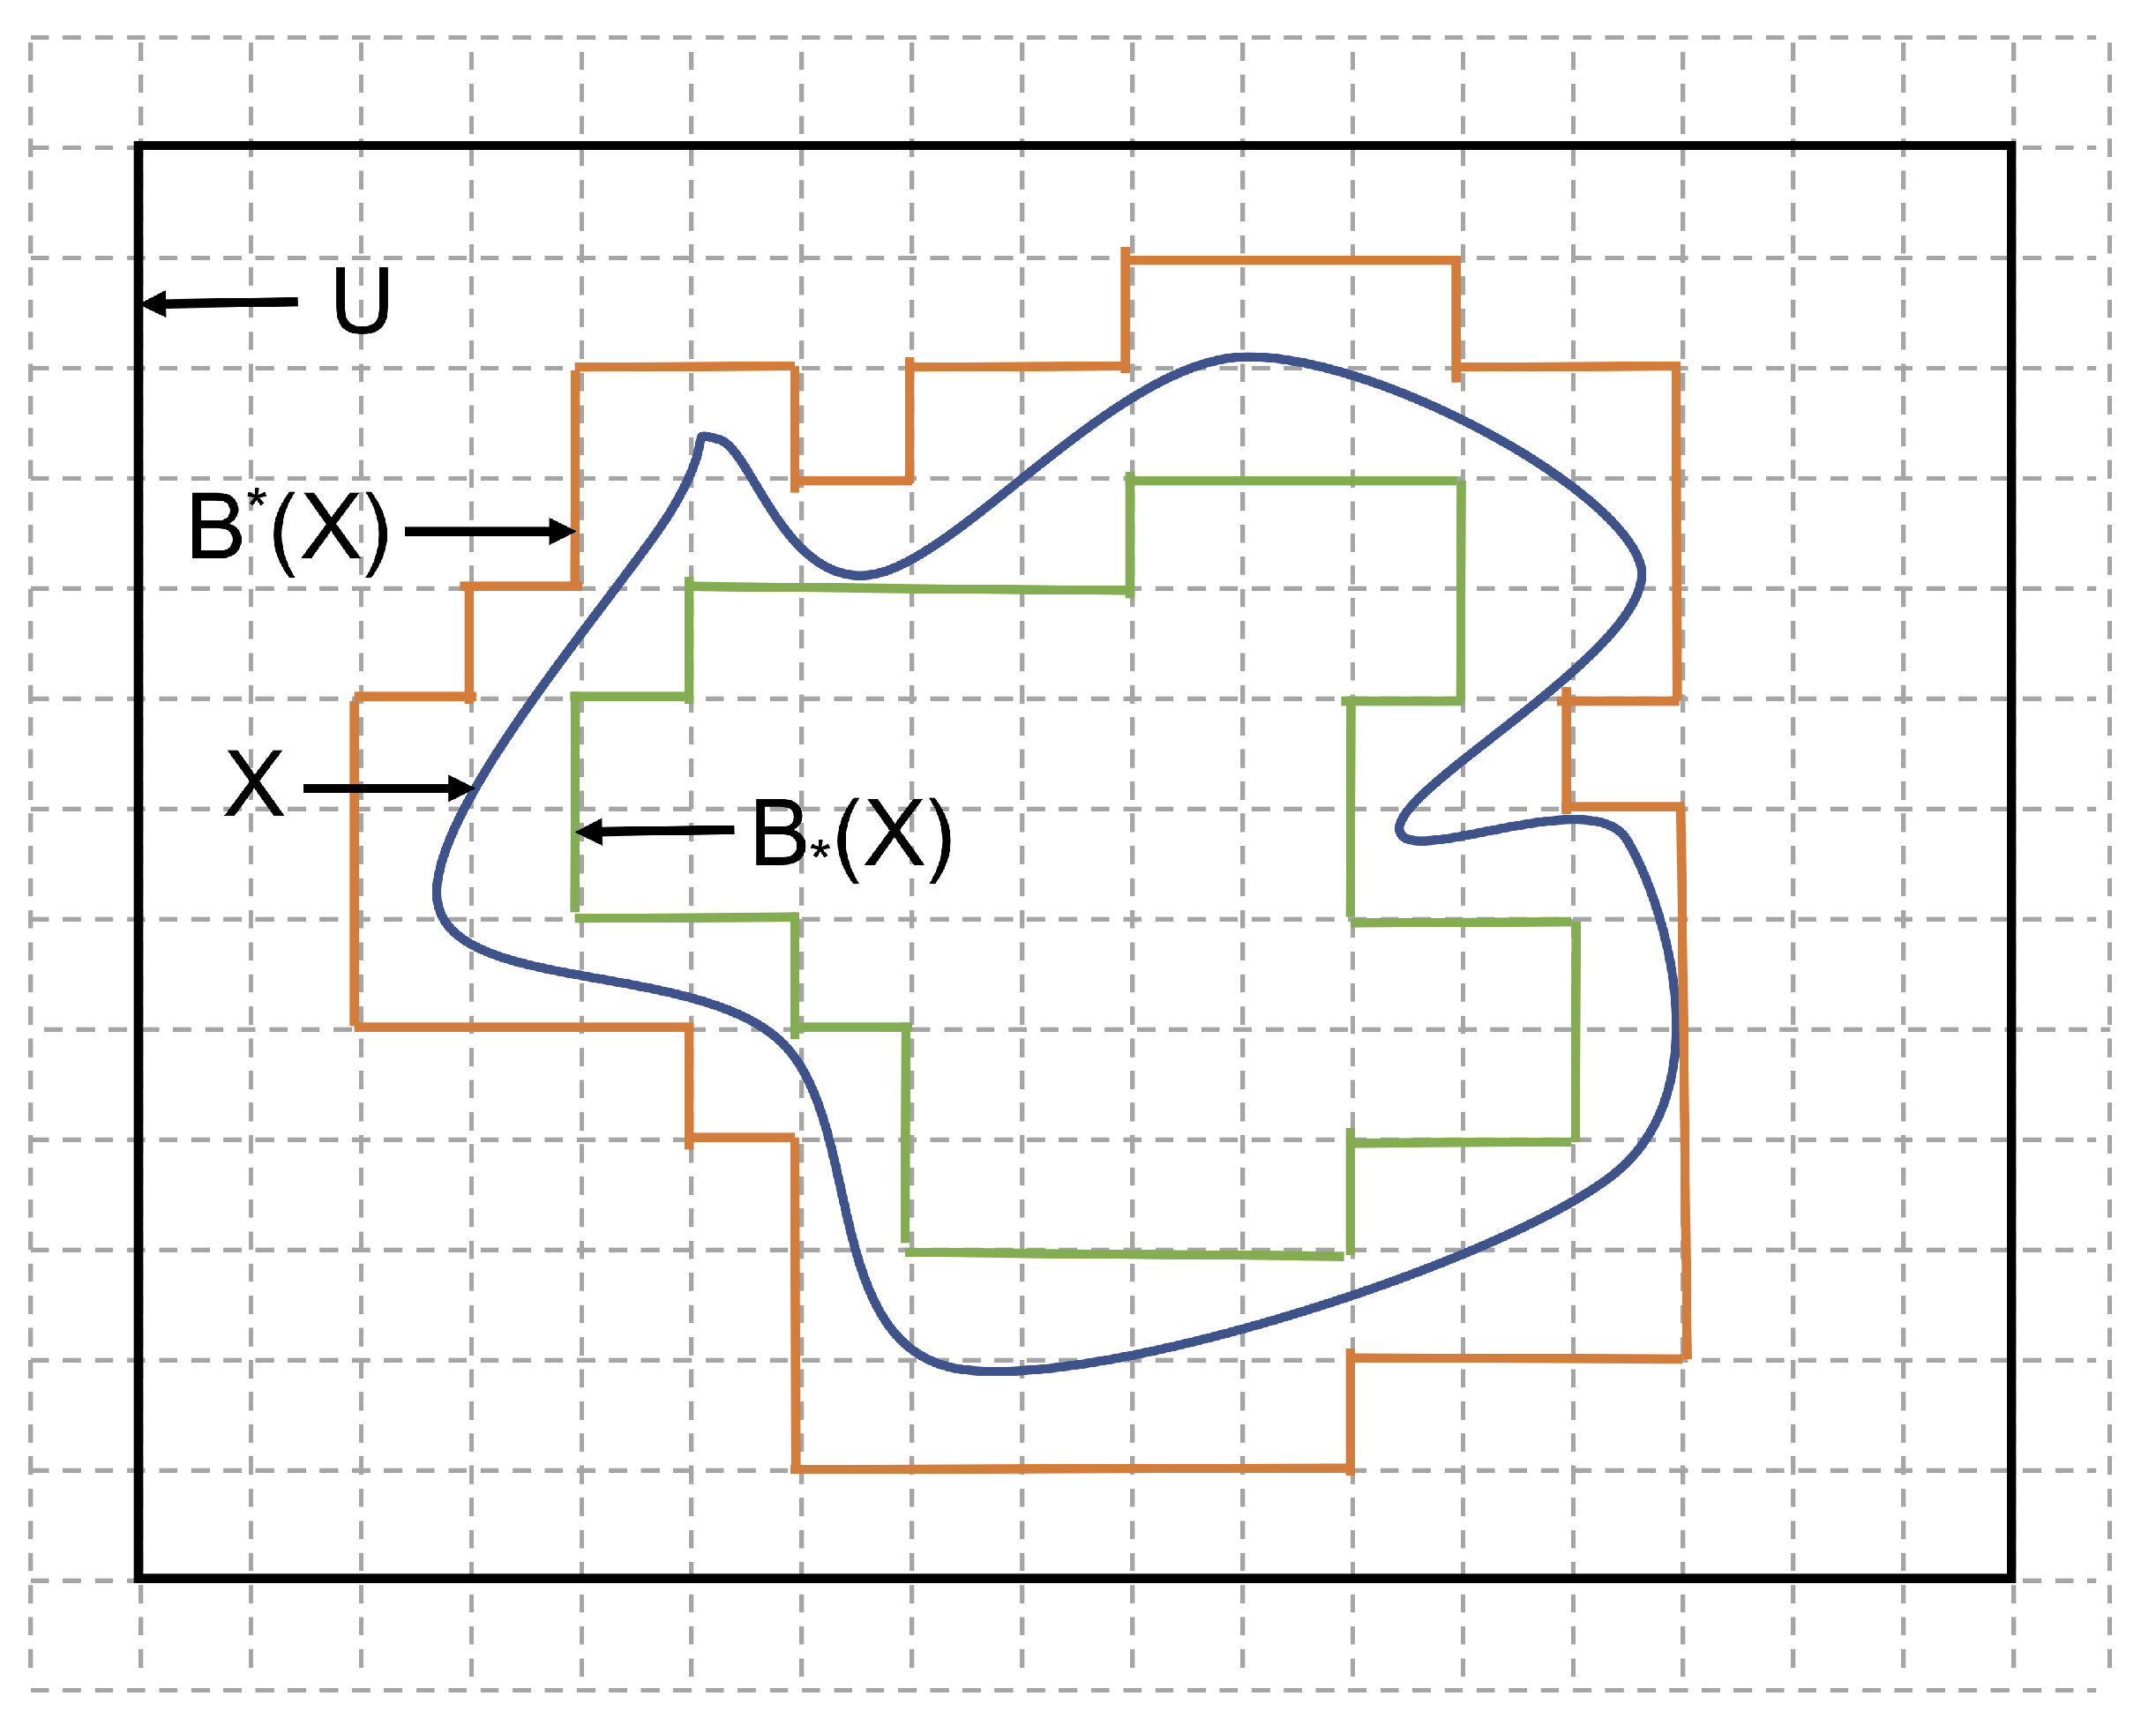
2.1. Rough Sets
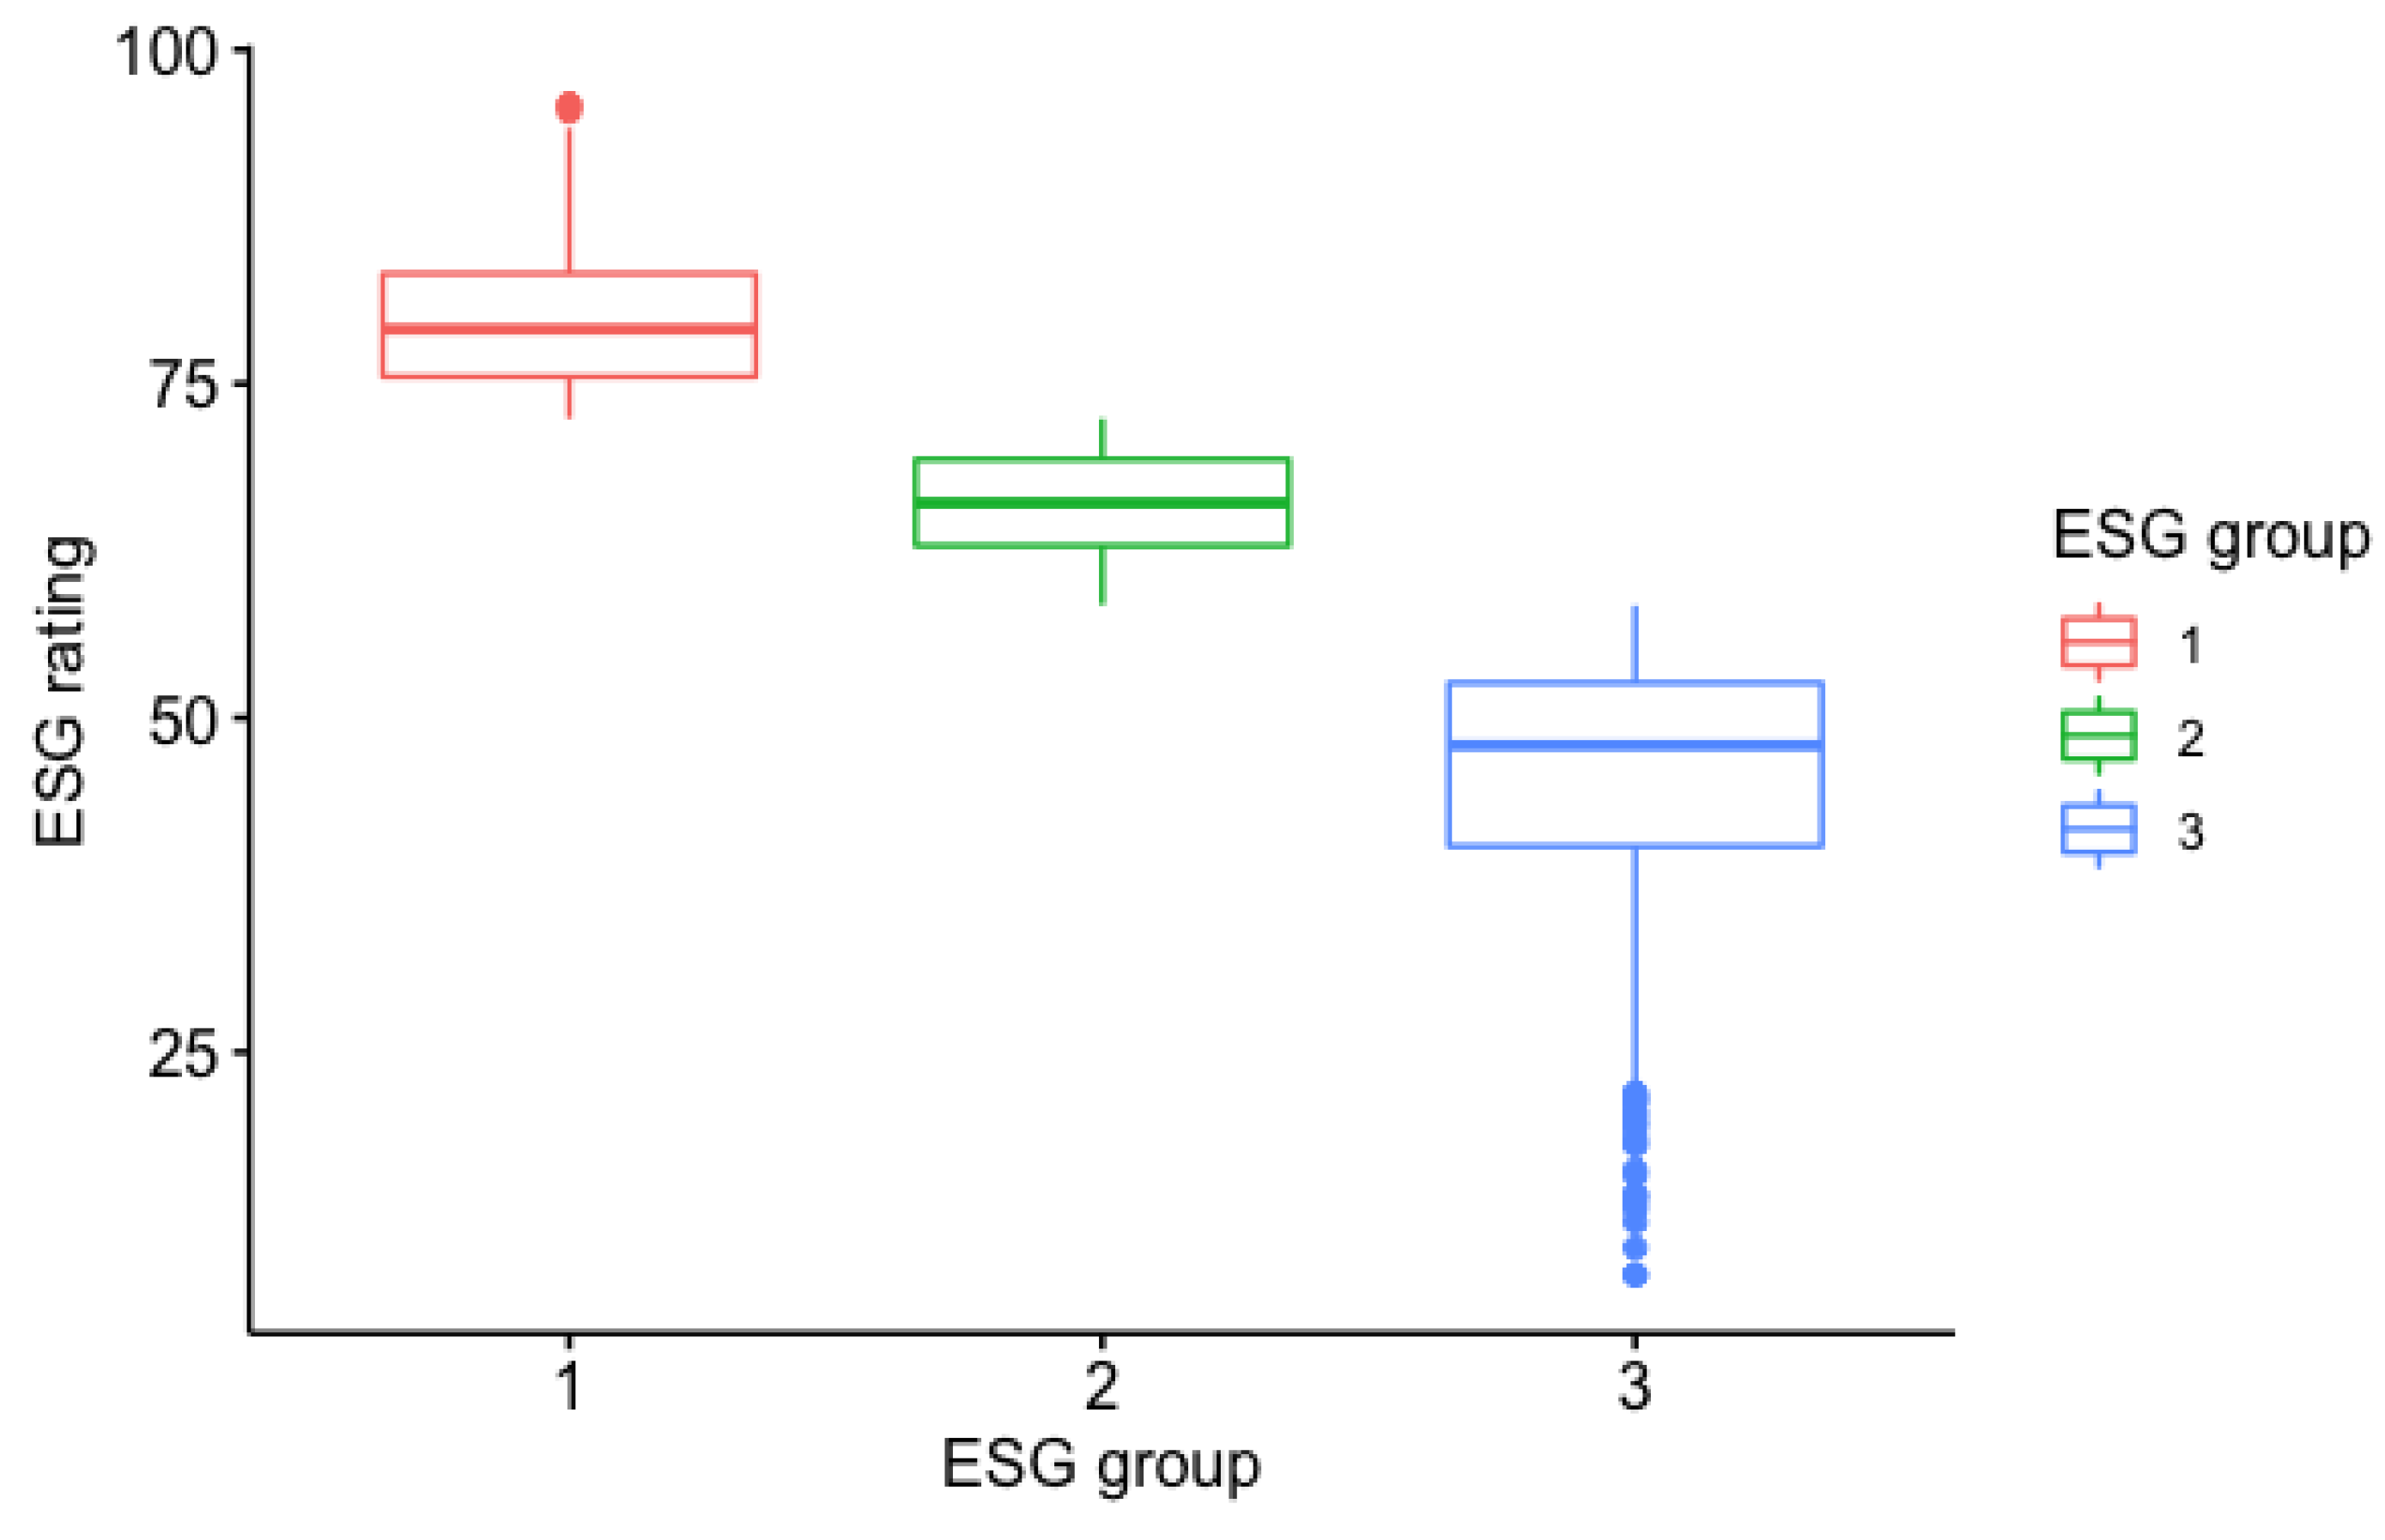
2.2. Data
- ROA: Return on assets
- EPS: Earnings per share
- Size: Market capitalization (in euros)
- D/E: Debt to equity ratio
- Beta: Coefficient Beta, which measures the stock’s volatility in relation to the market
- Vol: Trading volume, the amount of securities that were traded during the year
- Sector: Variable that indicates the firm sector
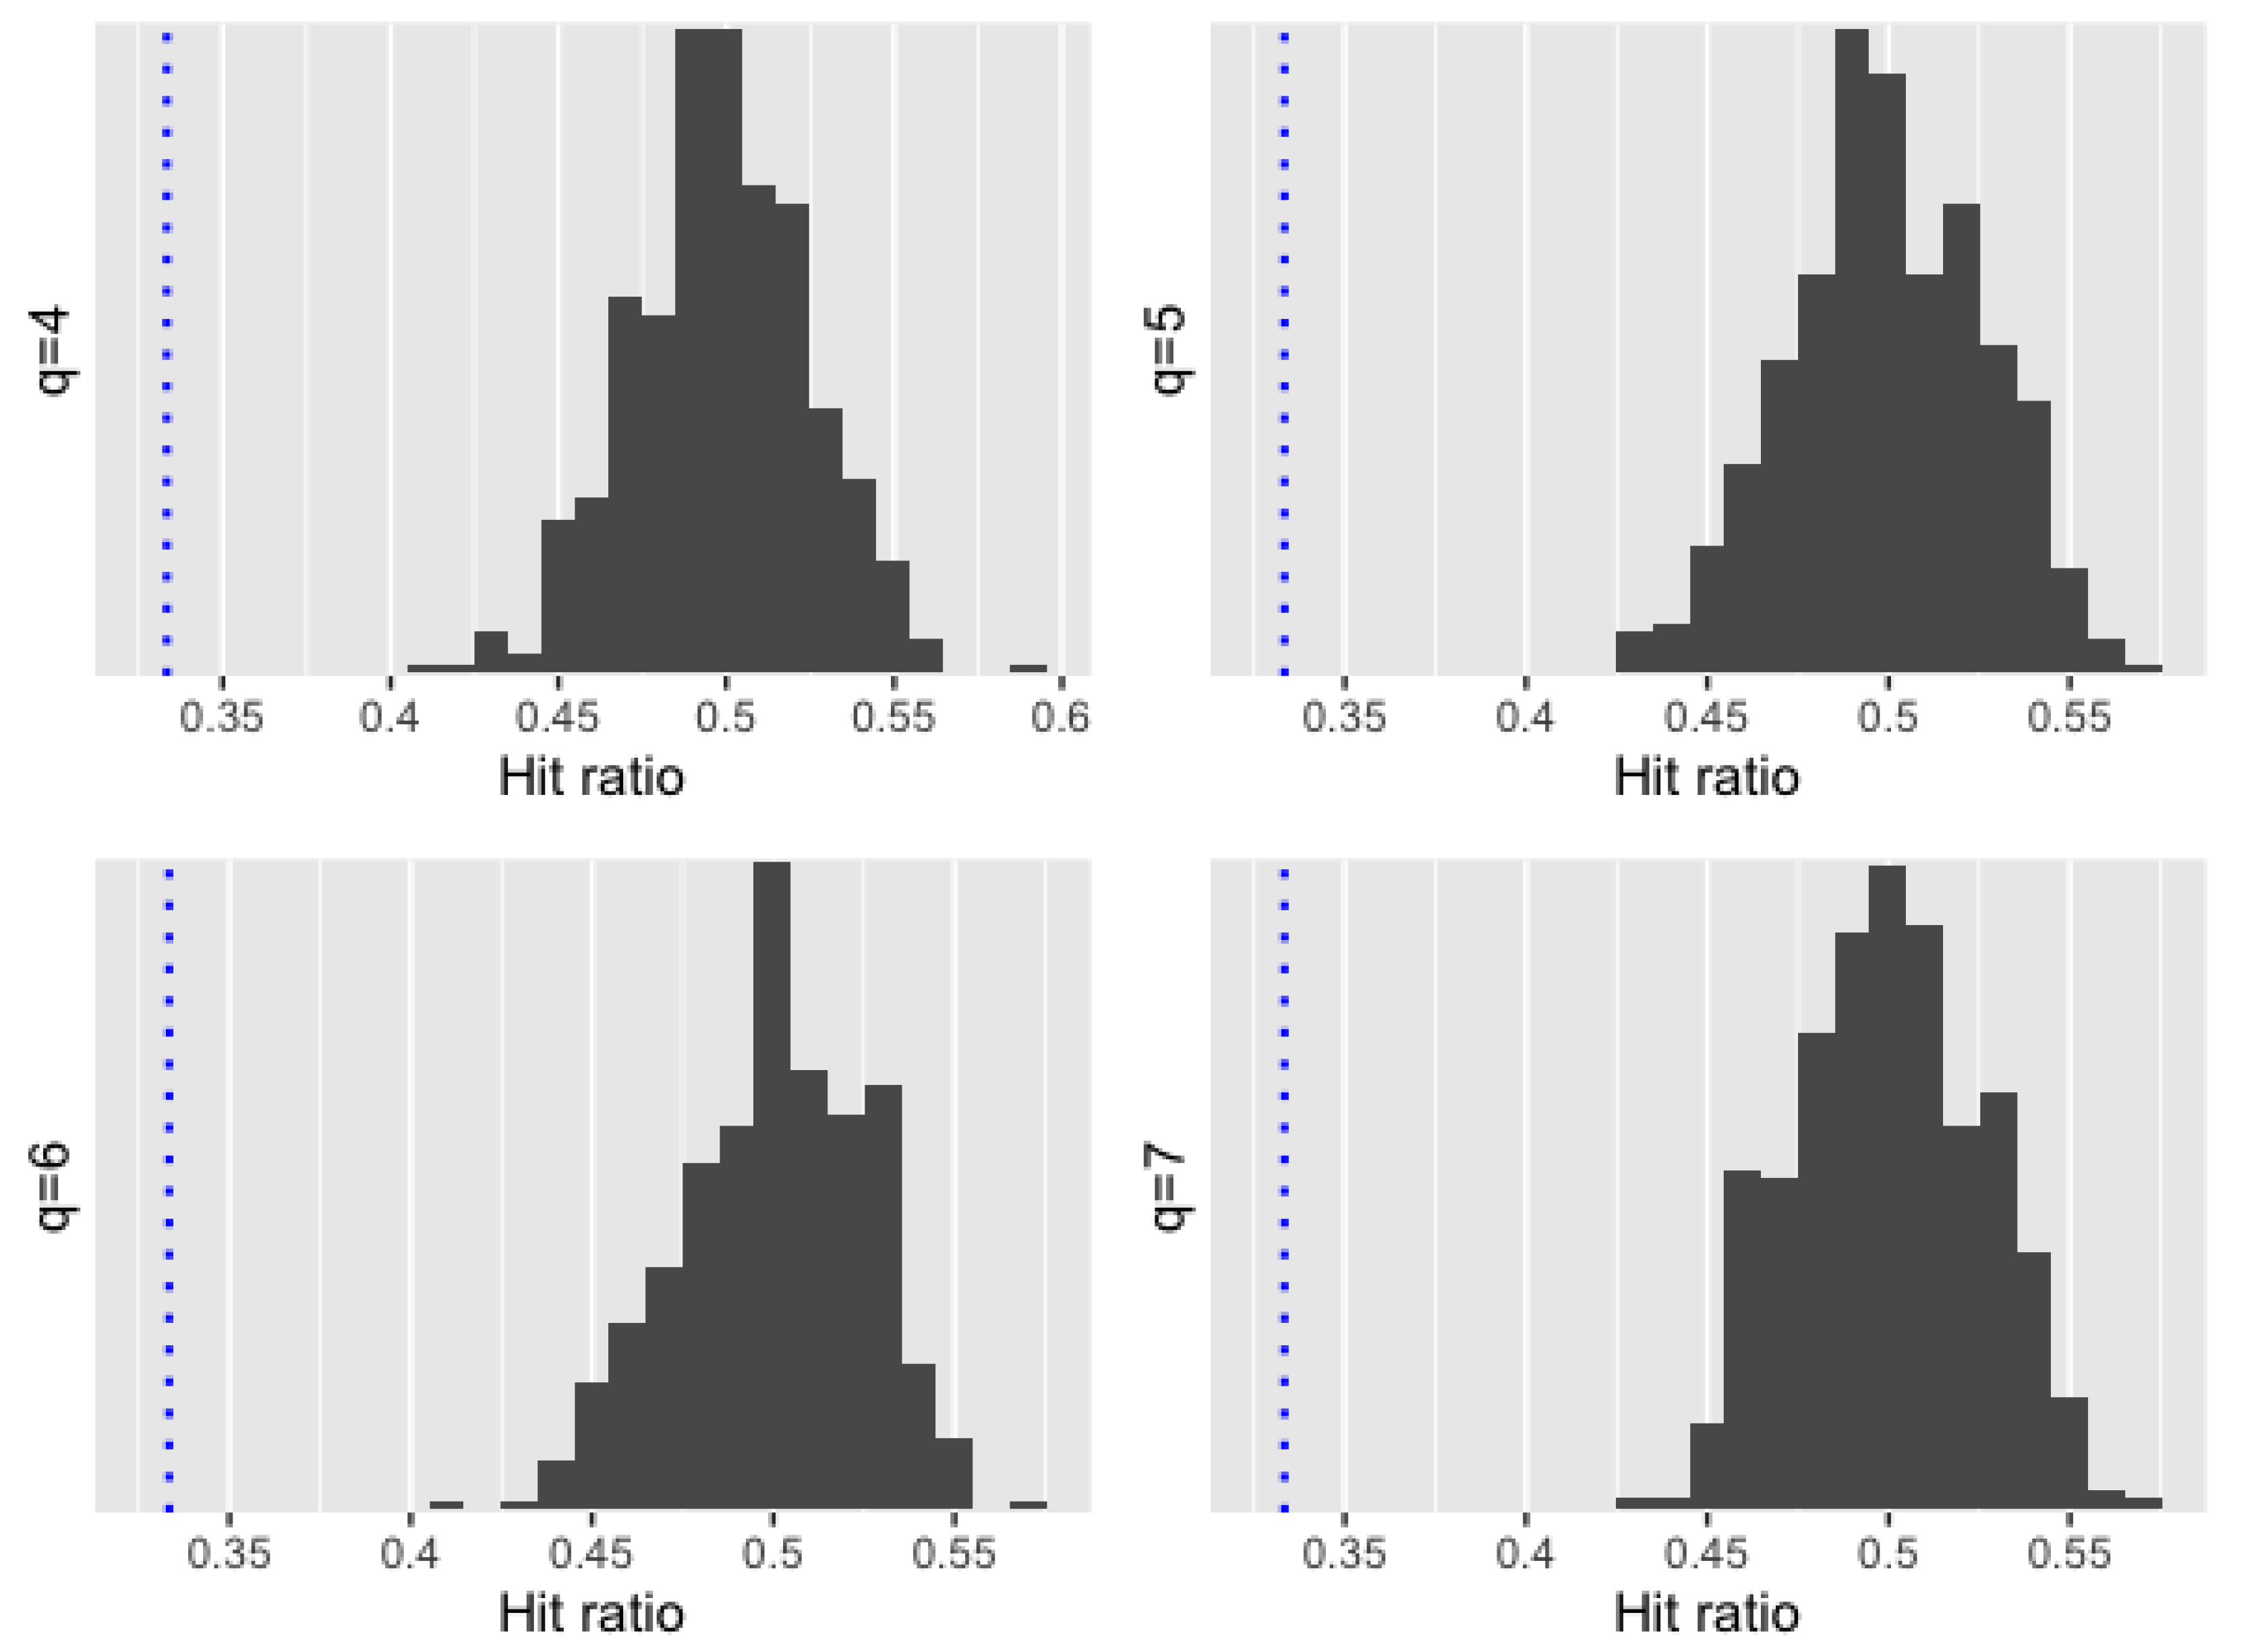
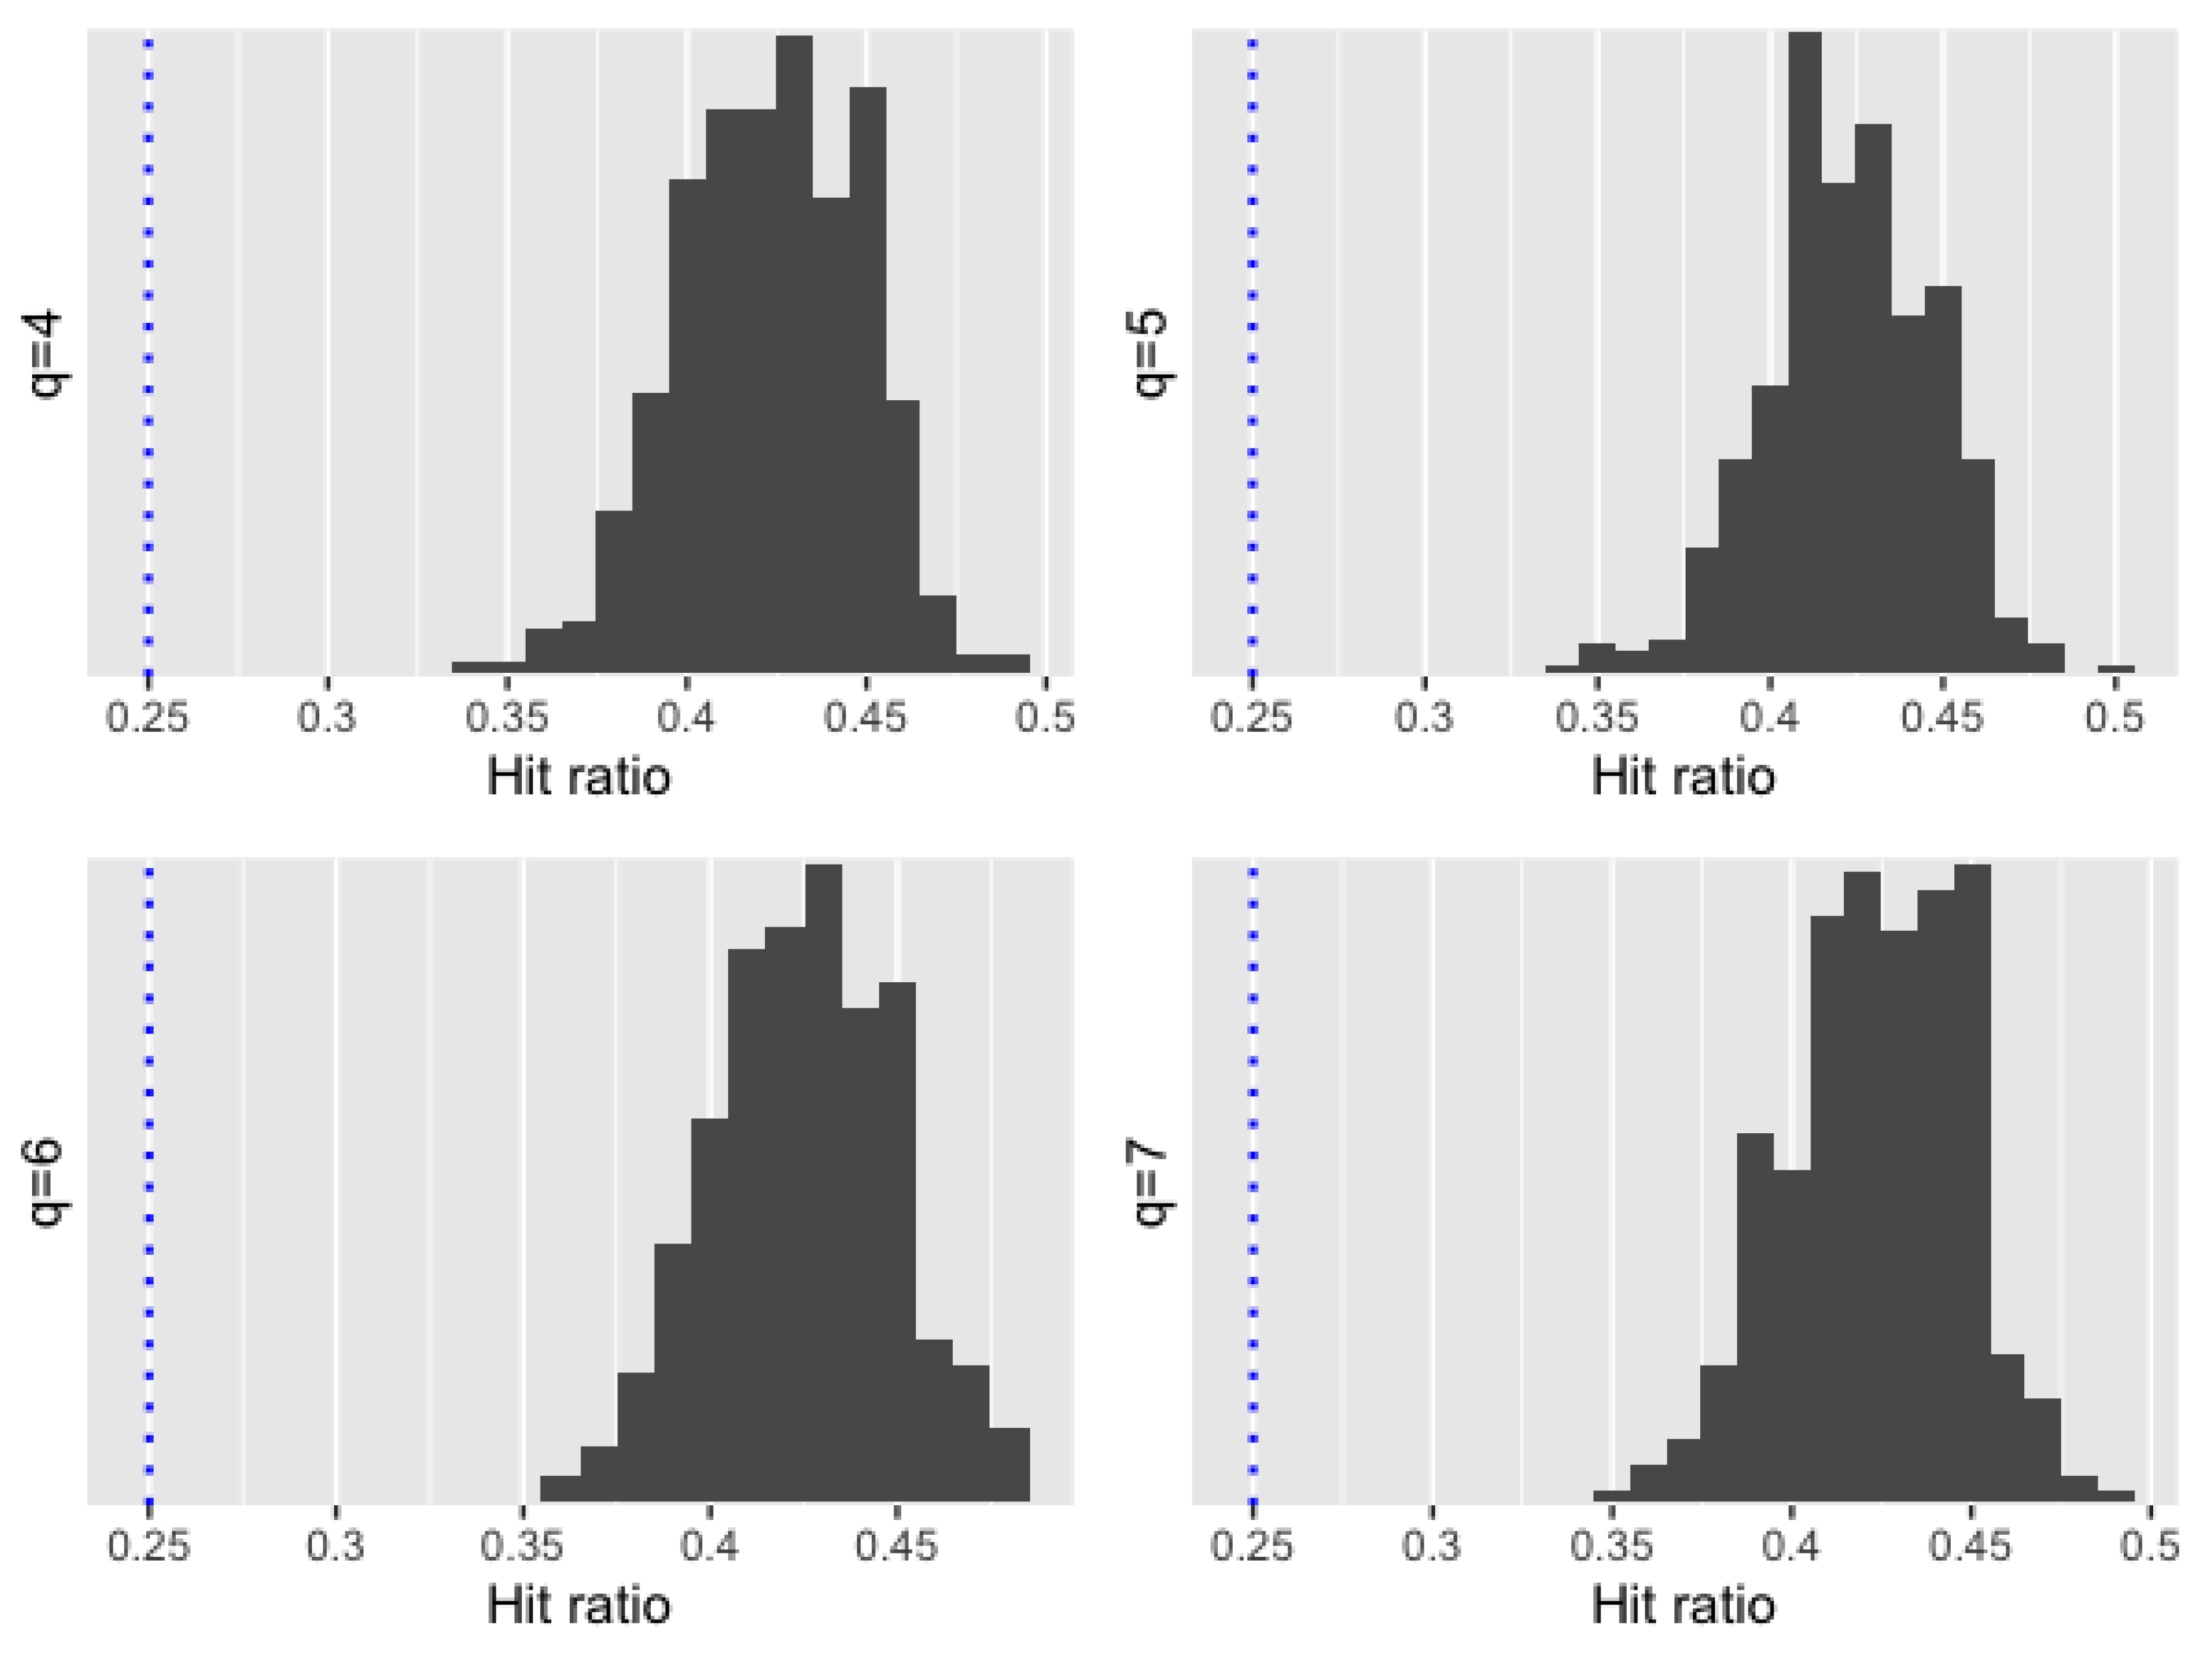
3. Results
4. Conclusions
Author Contributions
Funding
Conflicts of Interest
Abbreviations
| ESG | Environmental, social, and governance |
| CFP | Corporate financial performance |
| CSP | Corporate social performance |
| CSR | Corporate social responsibility |
| ROA | Return on assets |
| ROE | Return on equity |
| ROS | Return on sales |
Appendix A
- = logarithm of the market capitalization of the firm (in euros)
- .
- , with return of the firm i, with return of the market, covariance between the return of the firm i and the return of the market, and the variance of the returns of the market.
References
- García-Rodríguez, F.J.; García-Rodríguez, J.L.; Castilla-Gutiérrez, C.; Major, S.A. Corporate social responsibility of oil companies in developing countries: From altruism to business strategy. Corp. Soc. Responsib. Environ. Manag. 2013, 20, 371–384. [Google Scholar] [CrossRef]
- García, F.; González-Bueno, J.; Oliver, J.; Riley, N. Selecting Socially Responsible Portfolios: A Fuzzy Multicriteria Approach. Sustainability 2019, 11, 2496. [Google Scholar] [CrossRef] [Green Version]
- Arribas, I.; Espinós-Vañó, M.; García, F.; Tamosiuniene, R. Negative screening and sustainable portfolio diversification. Entrep. Sustain. Issues 2019, 4, 1566–1586. [Google Scholar] [CrossRef]
- Martínez-Ferrero, J.; Gallego-Álvarez, I.; García-Sánchez, I.M. A bidirectional analysis of earnings management and corporate social responsibility: The moderating effect of stakeholder and investor protection. Aust. Acc. Rev. 2015, 25, 359–371. [Google Scholar] [CrossRef]
- Garriga, E.; Melé, D. Corporate social responsibility theories: Mapping the territory. J. Bus. Ethics 2004, 53, 51–71. [Google Scholar] [CrossRef]
- Friedman, M. The social responsibility of business is to increase its profits. In Corporate Ethics and Corporate Governance; Springer: Berlin/Heidelberg, Germany, 1970; pp. 173–178. [Google Scholar]
- Jensen, M.C. Value maximization, stakeholder theory, and the corporate objective function. Bus. Ethics Q. 2002, 12, 235–256. [Google Scholar] [CrossRef]
- Charlo, M.J.; Moya, I.; Munoz, A.M. Sustainable development in spanish listed companies: A strategic approach. Corp. Soc. Responsib. Environ. Manag. 2017, 24, 222–234. [Google Scholar] [CrossRef]
- Hillman, A.J.; Keim, G.D. Shareholder value, stakeholder management, and social issues: What’s the bottom line? Strateg. Manag. J. 2001, 22, 125–139. [Google Scholar] [CrossRef]
- Mio, C.; Venturelli, A.; Leopizzi, R. Management by objectives and corporate social responsibility disclosure: First results from Italy. Acc. Audit. Account. J. 2015, 28, 325–364. [Google Scholar] [CrossRef]
- Venturelli, A.; Caputo, F.; Leopizzi, R.; Mastroleo, G.; Mio, C. How can CSR identity be evaluated? A pilot study using a Fuzzy Expert System. J. Clean. Prod. 2017, 141, 1000–1010. [Google Scholar] [CrossRef]
- Lii, Y.S.; Wu, K.W.; Ding, M.C. Doing good does good? Sustainable marketing of CSR and consumer evaluations. Corp. Soc. Responsib. Environ. Manag. 2013, 20, 15–28. [Google Scholar] [CrossRef]
- Sheikh, S.u.R.; Beise-Zee, R. Corporate social responsibility or cause-related marketing? The role of cause specificity of CSR. J. Consum. Mark. 2011, 28, 27–39. [Google Scholar] [CrossRef]
- Hermawan, A.; Gunardi, A. Motivation for disclosure of corporate social responsibility: Evidence from banking industry in Indonesia. Entrep. Sustain. Issues 2019, 6, 1297–1306. [Google Scholar] [CrossRef]
- Davis, K. Understanding the social responsibility puzzle. Bus. Horiz. 1967, 10, 45–50. [Google Scholar] [CrossRef]
- Labib Eid, N.; Robert Sabella, A. A fresh approach to corporate social responsibility (CSR): Partnerships between businesses and non-profit sectors. Corp. Gov. 2014, 14, 352–362. [Google Scholar] [CrossRef]
- Donaldson, T.; Dunfee, T.W. Ties that bind in business ethics: Social contracts and why they matter. J. Bank. Financ. 2002, 26, 1853–1865. [Google Scholar] [CrossRef]
- Jahn, J.; Brühl, R. How friedman’s view on individual freedom relates to stakeholder theory and social contract theory. J. Bus. Ethics 2018, 153, 41–52. [Google Scholar] [CrossRef]
- Sison, A.J.G. From CSR to corporate citizenship: Anglo-American and continental European perspectives. J. Bus. Ethics 2009, 89, 235–246. [Google Scholar] [CrossRef]
- Lee, J.W.; Tan, W.N. Global Corporate Citizenship: Cross-cultural Comparison of Best Practices in the Global Automotive Industry. J. Asian Financ. Econ. Bus. 2019, 6, 261–271. [Google Scholar] [CrossRef]
- Wartick, S.L.; Rude, R.E. Issues management: Corporate fad or corporate function? Calif. Manag. Rev. 1986, 29, 124–140. [Google Scholar] [CrossRef]
- Preston, L.E.; Post, J.E. Private management and public policy. Calif. Manag. Rev. 1981, 23, 56–62. [Google Scholar] [CrossRef]
- Shnayder, L.; Van Rijnsoever, F.J.; Hekkert, M.P. Motivations for Corporate Social Responsibility in the packaged food industry: An institutional and stakeholder management perspective. J. Clean. Prod. 2016, 122, 212–227. [Google Scholar] [CrossRef] [Green Version]
- Wartick, S.L.; Cochran, P.L. The evolution of the corporate social performance model. Acad. Manag. Rev. 1985, 10, 758–769. [Google Scholar] [CrossRef]
- Schwartz, M.S.; Carroll, A.B. Corporate social responsibility: A three-domain approach. Bus. Ethics Q. 2003, 13, 503–530. [Google Scholar] [CrossRef]
- Freeman, R.E. Strategic Management: A Stakeholder Approach; Cambridge University Press: Cambridge, UK, 2010. [Google Scholar]
- Cassel, D. Human rights and business responsibilities in the global marketplace. Bus. Ethics Q. 2001, 11, 261–274. [Google Scholar] [CrossRef]
- Özbağ, G.K. The Breath of Life: From Philanthropy to Global Corporate Citizenship. In Managerial Strategies for Business Sustainability During Turbulent Times; IGI Global: Hershey, PA, USA, 2018; pp. 258–276. [Google Scholar]
- Hart, S.L.; Ahuja, G. Does it pay to be green? An empirical examination of the relationship between emission reduction and firm performance. Bus. Strateg. Environ. 1996, 5, 30–37. [Google Scholar] [CrossRef]
- Hang, M.; Geyer-Klingeberg, J.; Rathgeber, A.W. It is merely a matter of time: A meta-analysis of the causality between environmental performance and financial performance. Bus. Strateg. Environ. 2019, 28, 257–273. [Google Scholar] [CrossRef]
- Espinós-Vañó, M.D.; García García, F.; Oliver-Muncharaz, J. The ethical index FTSE4Good Ibex as an alternative for passive portfolio strategies in Spain. Financ. Mark. Valuat. 2018, 4, 117–129. [Google Scholar]
- McWilliams, A.; Siegel, D. Corporate social responsibility: A theory of the firm perspective. Acad. Manag. Rev. 2001, 26, 117–127. [Google Scholar] [CrossRef]
- Luo, X.; Bhattacharya, C.B. Corporate social responsibility, customer satisfaction, and market value. J. Mark. 2006, 70, 1–18. [Google Scholar] [CrossRef]
- Seifert, B.; Morris, S.A.; Bartkus, B.R. Having, giving, and getting: Slack resources, corporate philanthropy, and firm financial performance. Bus. Soc. 2004, 43, 135–161. [Google Scholar] [CrossRef]
- Brammer, S.; Brooks, C.; Pavelin, S. Corporate social performance and stock returns: UK evidence from disaggregate measures. Financ. Manag. 2006, 35, 97–116. [Google Scholar] [CrossRef] [Green Version]
- Arribas, I.; Espinós-Vañó, M.D.; García, F.; Oliver, J. Defining socially responsible companies according to retail investors’ preferences. Entrep. Sustain. Issues 2019, 7, 1641–1653. [Google Scholar] [CrossRef]
- Arribas, I.; Espinós-Vañó, M.D.; García, F.; Morales-Bañuelos, P.B. The Inclusion of Socially Irresponsible Companies in Sustainable Stock Indices. Sustainability 2019, 11, 2047. [Google Scholar] [CrossRef] [Green Version]
- Baccaro, L.; Mele, V. For lack of anything better? International organizations and global corporate codes. Public Adm. 2011, 89, 451–470. [Google Scholar] [CrossRef]
- Chatterji, A.K.; Levine, D.I.; Toffel, M.W. How well do social ratings actually measure corporate social responsibility? J. Econ. Manag. Strateg. 2009, 18, 125–169. [Google Scholar] [CrossRef]
- Gangi, F.; Varrone, N. Screening activities by socially responsible funds: A matter of agency? J. Clean. Prod. 2018, 197, 842–855. [Google Scholar] [CrossRef]
- Utz, S.; Wimmer, M. Are they any good at all? A financial and ethical analysis of socially responsible mutual funds. J. Asset Manag. 2014, 15, 72–82. [Google Scholar] [CrossRef] [Green Version]
- Roberts, P.W.; Dowling, G.R. Corporate reputation and sustained superior financial performance. Strateg. Manag. J. 2002, 23, 1077–1093. [Google Scholar] [CrossRef]
- Julian, S.D.; Ofori-Dankwa, J.C. Financial resource availability and corporate social responsibility expenditures in a sub-Saharan economy: The institutional difference hypothesis. Strateg. Manag. J. 2013, 34, 1314–1330. [Google Scholar] [CrossRef]
- McGuire, J.B.; Sundgren, A.; Schneeweis, T. Corporate social responsibility and firm financial performance. Acad. Manag. J. 1988, 31, 854–872. [Google Scholar]
- Garcia-Castro, R.; Ariño, M.A.; Canela, M.A. Does social performance really lead to financial performance? Accounting for endogeneity. J. Bus. Ethics 2010, 92, 107–126. [Google Scholar] [CrossRef]
- Dupire, M.; M’Zali, B. CSR strategies in response to competitive pressures. J. Bus. Ethics 2018, 148, 603–623. [Google Scholar] [CrossRef]
- Lin, W.L.; Law, S.H.; Ho, J.A.; Sambasivan, M. The causality direction of the corporate social responsibility–Corporate financial performance Nexus: Application of Panel Vector Autoregression approach. N. Am. J. Econ. Financ. 2019, 48, 401–418. [Google Scholar] [CrossRef]
- Van Beurden, P.; Gössling, T. The worth of values–a literature review on the relation between corporate social and financial performance. J. Bus. Ethics 2008, 82, 407. [Google Scholar] [CrossRef] [Green Version]
- Espinós-Vañó, M.D. Socially responsible investment in Spain: Ethics and transparency. Financ. Mark. Valuat. 2016, 2, 73–89. [Google Scholar]
- Jankalová, M.; Jankal, R. The assessment of corporate social responsibility: Approaches analysis. Entrep. Sustain. Issues 2017, 4, 441–459. [Google Scholar] [CrossRef] [Green Version]
- Marom, I.Y. Toward a unified theory of the CSP–CFP link. J. Bus. Ethics 2006, 67, 191–200. [Google Scholar] [CrossRef]
- Arribas-Fernández, I.; Espinós-Vañó, M.D.; García García, F. The difficulty of applying exclusion criteria in ethical portfolios. Financ. Mark. Valuat. 2018, 4, 41–64. [Google Scholar]
- Chen, C.M.; Delmas, M. Measuring corporate social performance: An efficiency perspective. Prod. Oper. Manag. 2011, 20, 789–804. [Google Scholar] [CrossRef]
- Muñoz-Torres, M.J.; Fernández-Izquierdo, M.Á.; Rivera-Lirio, J.M.; Escrig-Olmedo, E. Can environmental, social, and governance rating agencies favor business models that promote a more sustainable development? Corp. Soc. Responsib. Environ. Manag. 2019, 26, 439–452. [Google Scholar] [CrossRef]
- Guijarro, F.; Poyatos, J. Designing a sustainable development goal index through a goal programming model: The Case of EU-28 Countries. Sustainability 2018, 10, 3167. [Google Scholar] [CrossRef] [Green Version]
- Guijarro, F. A Multicriteria Model for the Assessment of Countries’ Environmental Performance. Int. J. Environ. Res. Public Health 2019, 16, 2868. [Google Scholar] [CrossRef] [PubMed] [Green Version]
- Escrig-Olmedo, E.; Fernández-Izquierdo, M.Á.; Ferrero-Ferrero, I.; Rivera-Lirio, J.M.; Muñoz-Torres, M.J. Rating the raters: Evaluating how ESG rating agencies integrate sustainability principles. Sustainability 2019, 11, 915. [Google Scholar] [CrossRef] [Green Version]
- Mattingly, J.E. Corporate social performance: A review of empirical research examining the corporation–society relationship using Kinder, Lydenberg, Domini Social Ratings data. Bus. Soc. 2017, 56, 796–839. [Google Scholar] [CrossRef]
- Landi, G.; Sciarelli, M. Towards a more ethical market: The impact of ESG rating on corporate financial performance. Soc. Responsib. J. 2019, 15, 11–27. [Google Scholar] [CrossRef]
- Martínez-Ferrero, J.; Frías-Aceituno, J.V. Relationship between sustainable development and financial performance: International empirical research. Bus. Strateg. Environ. 2015, 24, 20–39. [Google Scholar] [CrossRef]
- Grewatsch, S.; Kleindienst, I. When does it pay to be good? Moderators and mediators in the corporate sustainability–corporate financial performance relationship: A critical review. J. Bus. Ethics 2017, 145, 383–416. [Google Scholar] [CrossRef]
- López, M.V.; Garcia, A.; Rodriguez, L. Sustainable development and corporate performance: A study based on the Dow Jones sustainability index. J. Bus. Ethics 2007, 75, 285–300. [Google Scholar] [CrossRef]
- Kang, C.; Germann, F.; Grewal, R. Washing away your sins? Corporate social responsibility, corporate social irresponsibility, and firm performance. J. Mark. 2016, 80, 59–79. [Google Scholar] [CrossRef]
- Waddock, S.A.; Graves, S.B. The corporate social performance–financial performance link. Strateg. Manag. J. 1997, 18, 303–319. [Google Scholar] [CrossRef]
- Chin, M.; Hambrick, D.C.; Treviño, L.K. Political ideologies of CEOs: The influence of executives’ values on corporate social responsibility. Admin. Sci. Q. 2013, 58, 197–232. [Google Scholar] [CrossRef]
- Chung, S.A.; Pyo, H.; Guiral, A. Who is the beneficiary of slack on corporate financial performance and corporate philanthropy? Evidence from South Korea. Sustainability 2019, 11, 252. [Google Scholar] [CrossRef] [Green Version]
- El Ghoul, S.; Guedhami, O.; Kwok, C.C.; Mishra, D.R. Does corporate social responsibility affect the cost of capital? J. Bank. Financ. 2011, 35, 2388–2406. [Google Scholar] [CrossRef]
- Mishra, S.; Modi, S.B. Positive and negative corporate social responsibility, financial leverage, and idiosyncratic risk. J. Bus. Ethics 2013, 117, 431–448. [Google Scholar] [CrossRef]
- Cheng, B.; Ioannou, I.; Serafeim, G. Corporate social responsibility and access to finance. Strateg. Manag. J. 2014, 35, 1–23. [Google Scholar] [CrossRef]
- Bhuiyan, M.B.U.; Nguyen, T.H.N. Impact of CSR on cost of debt and cost of capital: Australian evidence. Soc. Responsib. J. 2019, in press. [Google Scholar] [CrossRef]
- Brammer, S.; Millington, A. Corporate reputation and philanthropy: An empirical analysis. J. Bus. Ethics 2005, 61, 29–44. [Google Scholar] [CrossRef]
- Sparkes, R.; Cowton, C.J. The maturing of socially responsible investment: A review of the developing link with corporate social responsibility. J. Bus. Ethics 2004, 52, 45–57. [Google Scholar] [CrossRef]
- Hudson, R. Ethical investing: Ethical investors and managers. Bus. Ethics Q. 2005, 15, 641–657. [Google Scholar] [CrossRef]
- Oikonomou, I.; Brooks, C.; Pavelin, S. The effects of corporate social performance on the cost of corporate debt and credit ratings. Financ. Rev. 2014, 49, 49–75. [Google Scholar] [CrossRef]
- Sahut, J.M.; Mili, M.; Ben Tekaya, S.; Teulon, F. Financial impacts and antecedents of CSR: A PLS path modelling approach. Econ. Bull. 2016, 36, 736–751. [Google Scholar]
- Zwiebel, J. Dynamic capital structure under managerial entrenchment. Am. Econ. Rev. 1996, 86, 1197–1215. [Google Scholar]
- Kotchen, M.; Moon, J.J. Corporate social responsibility for irresponsibility. BE J. Econ. Anal. Policy 2012, 12. [Google Scholar] [CrossRef]
- Flammer, C. Corporate social responsibility and shareholder reaction: The environmental awareness of investors. Acad. Manag. J. 2013, 56, 758–781. [Google Scholar] [CrossRef] [Green Version]
- Godfrey, P.C.; Merrill, C.B.; Hansen, J.M. The relationship between corporate social responsibility and shareholder value: An empirical test of the risk management hypothesis. Strateg. Manag. J. 2009, 30, 425–445. [Google Scholar] [CrossRef]
- Lins, K.V.; Servaes, H.; Tamayo, A. Social capital, trust, and firm performance: The value of corporate social responsibility during the financial crisis. J. Financ. 2017, 72, 1785–1824. [Google Scholar] [CrossRef] [Green Version]
- Bouslah, K.; Kryzanowski, L.; M’Zali, B. Social performance and firm risk: Impact of the financial crisis. J. Bus. Ethics 2018, 149, 643–669. [Google Scholar] [CrossRef] [Green Version]
- Koh, P.S.; Qian, C.; Wang, H. Firm litigation risk and the insurance value of corporate social performance. Strateg. Manag. J. 2014, 35, 1464–1482. [Google Scholar] [CrossRef]
- Drempetic, S.; Klein, C.; Zwergel, B. The influence of firm size on the ESG score: Corporate sustainability ratings under review. J. Bus. Ethics 2019, 1–28. [Google Scholar] [CrossRef]
- Adams, C.A.; Hill, W.Y.; Roberts, C.B. Corporate social reporting practices in Western Europe: Legitimating corporate behaviour? Br. Acc. Rev. 1998, 30, 1–21. [Google Scholar] [CrossRef]
- Neu, D.; Warsame, H.; Pedwell, K. Managing public impressions: Environmental disclosures in annual reports. Acc. Organ. Soc. 1998, 23, 265–282. [Google Scholar] [CrossRef]
- Brammer, S.; Pavelin, S. Voluntary social disclosures by large UK companies. Bus. Ethics A Eur. Rev. 2004, 13, 86–99. [Google Scholar] [CrossRef]
- Haniffa, R.M.; Cooke, T.E. The impact of culture and governance on corporate social reporting. J. Acc. Public Policy 2005, 24, 391–430. [Google Scholar] [CrossRef]
- Surroca, J.; Tribó, J.A.; Waddock, S. Corporate responsibility and financial performance: The role of intangible resources. Strateg. Manag. J. 2010, 31, 463–490. [Google Scholar] [CrossRef]
- Pawlak, Z. Rough sets. Int. J. Comput. Inf. Sci. 1982, 11, 341–356. [Google Scholar] [CrossRef]
- Kim, Y.; Enke, D. Developing a rule change trading system for the futures market using rough set analysis. Expert Syst. Appl. 2016, 59, 165–173. [Google Scholar] [CrossRef]
- Podsiadlo, M.; Rybinski, H. Financial time series forecasting using rough sets with time-weighted rule voting. Expert Syst. Appl. 2016, 66, 219–233. [Google Scholar] [CrossRef]
- Chen, Y.S. Classifying credit ratings for Asian banks using integrating feature selection and the CPDA-based rough sets approach. Knowl. Based Syst. 2012, 26, 259–270. [Google Scholar] [CrossRef]
- Chen, X.; Zhang, X.; Zhou, J.; Zhou, K. Rolling Bearings Fault Diagnosis Based on Tree Heuristic Feature Selection and the Dependent Feature Vector Combined with Rough Sets. Appl. Sci. 2019, 9, 1161. [Google Scholar] [CrossRef] [Green Version]
- Liang, F.; Xu, Y.; Li, W.; Ning, X.; Liu, X.; Liu, A. Recognition algorithm based on improved FCM and rough sets for meibomian gland morphology. Appl. Sci. 2017, 7, 192. [Google Scholar] [CrossRef] [Green Version]
- Roy, B. Decision science or decision-aid science? Eur. J. Oper. Res. 1993, 66, 184–203. [Google Scholar] [CrossRef]
- Pawlak, Z. Rough Sets: Theoretical Aspects of Reasoning about Data; Springer: Berlin/Heidelberg, Germany, 2012; Volume 9. [Google Scholar]
- Sun, J.; Li, H.; Huang, Q.H.; He, K.Y. Predicting financial distress and corporate failure: A review from the state-of-the-art definitions, modeling, sampling, and featuring approaches. Knowl. Based Syst. 2014, 57, 41–56. [Google Scholar] [CrossRef]
- R Core Team. R: A Language and Environment for Statistical Computing; R Foundation for Statistical Computing: Vienna, Austria, 2019. [Google Scholar]
- Janusz, A.; Riza, L.S. RoughSets: Data Analysis Using Rough Set and Fuzzy Rough Set Theories, R Package Version 1.3.7; 2019. Available online: https://cran.r-project.org/web/packages/RoughSets/index.html (accessed on 15 January 2020).


| Attribute | Mean | St. Deviation | Min | Max |
|---|---|---|---|---|
| ROA | 0.041 | 0.055 | −0.401 | 0.480 |
| Ln(SIZE) | 22.59 | 1.337 | 15.79 | 26.18 |
| EPS | 5.325 | 76.125 | −128.543 | 3121.872 |
| D/E | 0.439 | 2.600 | 0.000 | 104.875 |
| Beta | 0.883 | 0.350 | −0.081 | 2.438 |
| Vol | 27.10 | 13.22 | 8.53 | 213.50 |
| Materials | 0.115 | 0.319 | 0 | 1 |
| Consumer | 0.227 | 0.419 | 0 | 1 |
| Financial | 0.165 | 0.371 | 0 | 1 |
| Healthcare | 0.069 | 0.254 | 0 | 1 |
| Industrial | 0.195 | 0.397 | 0 | 1 |
| Technology | 0.068 | 0.252 | 0 | 1 |
| Others | 0.165 | 0.367 | 0 | 1 |
| Attribute | ||||
|---|---|---|---|---|
| ROA | −0.401 | 0.022 | 0.054 | 0.480 |
| Ln(SIZE) | 15.791 | 22.046 | 23.134 | 26.177 |
| EPS | −14.885 | 1.420 | 3.732 | 3,121.872 |
| D/E | 0.000 | 0.199 | 0.426 | 104.875 |
| Beta | −0.081 | 0.731 | 0.967 | 2.438 |
| Vol | 8.529 | 20.866 | 28.801 | 213.500 |
| Attribute | Rule 1 | Rule 2 | Rule 3 | Rule 4 |
|---|---|---|---|---|
| ROA | [−0.401, 0.022) | [−0.401, 0.022) | [−0.401, 0.022) | [0.022, 0.054) |
| Ln(SIZE) | [15.791, 22.046) | [15.791, 22.046) | [15.791, 22.046) | [15.791, 22.046) |
| EPS | [−14.885, 1.420) | [−14.885, 1.420) | [−14.885, 1.420) | [−14.885, 1.420) |
| D/E | [0.000, 0.199) | [0.000, 0.199) | [0.000, 0.199) | [0.000, 0.199) |
| Beta | [0.731, 0.967) | [0.731, 0.967) | [0.967, 2.438] | [0.967, 2.438] |
| Vol | [20.866, 28.801) | [28.801, 213.500] | [28.801, 213.500] | [28.801, 213.500] |
| Materials | [0,1) | [0,1) | [0,1) | [1,1] |
| Consumer | [0,1) | [0,1) | [0,1) | [0,1) |
| Financials | [0,1) | [0,1) | [0,1) | [0,1) |
| Industrials | [0,1) | [0,1) | [0,1) | [0,1) |
| Technology | [0,1) | [0,1) | [0,1) | [0,1) |
| Others | [0,1) | [0,1) | [0,1) | [0,1) |
| ESG group | 2 | 2 | 2 | 1 |
| Estimate | Std. Error | t Value | p-Value | |
|---|---|---|---|---|
| (Intercept) | −65.649527 | 6.819537 | −9.627 | < *** |
| ROA | −46.243597 | 6.506146 | −7.108 | *** |
| ‘LN(SIZE)’ | 5.657986 | 0.285209 | 19.838 | < *** |
| EPS | 0.004602 | 0.004368 | 1.054 | 0.2922 |
| ‘D/EV’ | 0.188848 | 0.128607 | 1.468 | 0.1422 |
| BETA | 6.346268 | 1.066307 | 5.952 | *** |
| VOL | −0.060161 | 0.030450 | −1.976 | 0.0483 * |
| MAT | −0.990511 | 1.620322 | −0.611 | 0.5411 |
| CONS | 0.807097 | 1.452881 | 0.556 | 0.5786 |
| FINANC | −1.325852 | 1.525423 | −0.869 | 0.3849 |
| INDU | −1.075244 | 1.475448 | −0.729 | 0.4663 |
| TECH | 0.342110 | 1.815740 | 0.188 | 0.8506 |
| OTHERS | −1.845143 | 1.513648 | −1.219 | 0.2230 |
© 2020 by the authors. Licensee MDPI, Basel, Switzerland. This article is an open access article distributed under the terms and conditions of the Creative Commons Attribution (CC BY) license (http://creativecommons.org/licenses/by/4.0/).
Share and Cite
García, F.; González-Bueno, J.; Guijarro, F.; Oliver, J. Forecasting the Environmental, Social, and Governance Rating of Firms by Using Corporate Financial Performance Variables: A Rough Set Approach. Sustainability 2020, 12, 3324. https://doi.org/10.3390/su12083324
García F, González-Bueno J, Guijarro F, Oliver J. Forecasting the Environmental, Social, and Governance Rating of Firms by Using Corporate Financial Performance Variables: A Rough Set Approach. Sustainability. 2020; 12(8):3324. https://doi.org/10.3390/su12083324
Chicago/Turabian StyleGarcía, Fernando, Jairo González-Bueno, Francisco Guijarro, and Javier Oliver. 2020. "Forecasting the Environmental, Social, and Governance Rating of Firms by Using Corporate Financial Performance Variables: A Rough Set Approach" Sustainability 12, no. 8: 3324. https://doi.org/10.3390/su12083324