Article

Public Preferences in a Shifting Energy Future: Comparing Public Views of Eight Energy Sources in North America’s Pacific Northwest

by
Shawn Olson Hazboun
1,* and
Hilary Schaffer Boudet
2
1
Graduate Program on the Environment, The Evergreen State College, Olympia, WA 98505, USA
2
School of Public Policy, Oregon State University, Corvallis, OR 97331, USA
*
Author to whom correspondence should be addressed.
Energies 2020, 13(8), 1940; https://doi.org/10.3390/en13081940
Submission received: 1 February 2020 / Revised: 3 April 2020 / Accepted: 5 April 2020 / Published: 15 April 2020
(This article belongs to the Special Issue Social Acceptability of Alternative Energy Technology)

Abstract

:
The U.S. and Canada continue to face major changes in energy production. Mounting awareness of the climate crisis has placed increasing importance on developing renewable energy sources, however, advances in fossil fuel extraction technology have opened vast domestic reserves of oil and natural gas. Public preferences for energy policy play a role in determining energy futures, but researchers rarely simultaneously compare public views across multiple renewable and non-renewable energies or across country boundaries. Here, we used a 2019 online survey sample (n = 1500) to compare predictors of support for eight fuel sources for electricity generation in British Columbia, Canada, and Washington and Oregon, USA. Results indicate the highest support overall for renewables (wind, solar, wave/tidal energy, geothermal) and the lowest for fossil fuels (coal and natural gas), nuclear, and hydropower. Mixed-effects regression modeling indicates that views on climate and the balance between environment and economy were consistent predictors of support across most energy types, while political ideology was less consistent. Perceived local importance of both extractive and renewable energy industries were significant predictors of support for some, but not all, energy sources, as were education and gender. Overall, our research suggests that while divisions persist in public energy preferences for both renewable and non-renewable sources, there is the broadest support for renewable energy technologies.

1. Introduction

Many factors underlie energy policy decisions at state and federal levels, of which public opinion is one [1,2,3]. A growing body of social science literature examines public preferences for various energy sources [2,4,5,6,7,8,9], but studies rarely measure public opinion on more than a few energy sources in the same survey effort (with some exceptions [2,10]), complicating a full picture of preferences across renewable and non-renewable options. They also rarely incorporate populations from more than one country. Many energy policy decisions are made at sub-national (rather than federal) levels of government (e.g., U.S. State or Canadian Province) [11,12,13,14,15], and previous research has indicated significant geographic variation in public opinion at these scales [16,17]. This suggests that research examining public opinion at regional or smaller scales is particularly relevant. In the present research, we compared public support across eight sources of energy for electricity generation (coal, natural gas, nuclear, hydroelectric, wind, solar, wave/tidal, and geothermal) in the northwestern region of the U.S. and Canada, and we assessed the relative influence of various factors on support for those energies. We begin by briefly discussing electricity production in both countries (Section 1.1), then cover past research on public energy preferences (Section 1.2), and finally introduce the present research and region of focus (Section 1.3).

1.1. Electricity Production and the Energy Transition in the U.S. and Canada

As with other countries in the world, the U.S. and Canada continue to face challenging choices about future energy resources. Mounting awareness of the climate crisis has placed increasing importance on reducing greenhouse gas emissions by proliferating renewable energy facilities and discontinuing carbon-emitting technologies such as coal-burning power plants. However, the transition away from fossil fuels has been slow, slower than in many other developed countries such as those in West Europe [11], and slower than climate scientists say is necessary to prevent catastrophic climate change [18,19,20]. The U.S. and Canada remain the top greenhouse gas emitters worldwide. The slow pace away from fossil fuels is in part due to the availability of cheap natural gas, thanks to the technological advances of the ‘shale revolution’ in the late 2000s as well as the development of Canadian oil sands. Indeed, just as the climate movement has strengthened its messages about leaving fossil fuels ‘in the ground’ in favor of renewable resources, natural gas production in the U.S. is historically unprecedented and oil production is at an all-time high in both countries [21,22,23].
One fossil fuel that is decidedly on the decline in both countries is coal. Growing emphasis on reducing CO2 emissions, the economics of costly coal-plant upgrades, and perhaps most importantly, the availability of abundant, cheap, natural gas has spurred a trend of replacing coal-fired power plants with natural gas-fired power plants. For example, in the U.S. between the years 2005 and 2016, 334 coal power units (at 138 facilities) were decommissioned, while 612 new natural-gas-fired units came online [24], and this trend is holding through 2019, with larger and larger facilities being shut down [25]. The remaining coal plants in the Pacific Northwest region have nearing retirement dates, and soon the entire region will generate all its electricity without burning coal. Similarly, Canada is planning a full phase-out of coal by 2030 [26,27], substituting this portion of electricity generation largely with natural gas facilities [28].
In contrast, the use of certain renewable resources to produce electricity is growing at a sharp rate in both countries. Electricity production from wind power tripled in the U.S. between 2009 and 2019 [29], and provides over 6% of the electricity demand in both countries [27,30] with projections suggesting it will continue to comprise more and more of the energy portfolio. Solar energy growth rates have been even sharper, but currently, solar energy makes up just 1.5% of electricity production in the U.S. and less than 1% in Canada. Newer renewable energy technologies such as wave energy and tidal energy are, for the most part, still in the early stages of development, but hold potential in both the U.S. and Canada for contributing to a carbon-free grid. Geothermal energy, though not new, is still relatively rare, due in part to its dependence on a fixed geographic source. Overall, about 7% of electricity in Canada [27] and about 10% in the U.S. [30] come from non-hydropower renewable energy (like solar and wind).
Hydropower comprises 60% of electricity production in Canada, but only 7% in the U.S [30]. However, hydropower is regionally significant in our study, accounting for 90%, 39%, and 52% of electricity generation in British Columbia, Oregon, and Washington, respectively [31,32]. Hydropower is sometimes classified as a renewable energy resource. Although it is a resource that replenishes itself and produces no greenhouse gas emissions, some argue that hydropower should not be considered as ‘renewable’, since it poses other concerning impacts on the environment including being a contributing factor in the decline of Pacific Northwest salmon species [33]. In fact, environmental activism and public pressure have led to the decommissioning of several major dams in the Pacific Northwest. While it is unlikely that many new large-scale hydroelectric dams will be built in either country in the future, opportunities for smaller-scale hydropower are expanding [34]. In the U.S., hydropower counts toward state-level renewable portfolio standards (RPS) in some states, but not others.
Nuclear power remains a relatively significant contributor to the electricity grid, comprising 19% of electricity production in the U.S. and 15% in Canada. Like hydropower, nuclear energy may be viewed either as environmentally favorable or unfavorable. While uranium is a non-renewable resource that requires mining and produces waste, electricity from nuclear power produces no greenhouse gases and is considered by many to be a critical component of decarbonizing major energy economies like the U.S. and Canada [35]. However, nuclear power is highly contentious amongst members of the public [36]. Intense controversies often develop around the siting of new nuclear facilities and waste repositories [37] as well as the environmental and public health risks borne by uranium mining and milling communities [38].

1.2. Public Opinion Research on Energy Preferences

Previous public opinion research on energy topics has found broad support for renewable energy [2,8,39] and more divided views on fossil fuels such as natural gas [7,40] and nuclear energy [36]. Generally, opinion polls have found a declining trend in public support for the use of fossil fuels, especially coal [2,4,9]. Natural gas presents an interesting case because it has been held up as a ‘bridge fuel’ to aid the transition to a cleaner energy system and thus propel climate mitigation [41,42]. The public is especially divided about the use of hydraulic fracturing or “fracking” to extract oil and natural gas [7,43], although it is unclear how opposition for this extraction technology interacts with public support for natural gas as a ‘bridge fuel’ away from coal.
Much of the research on the public’s views on renewable energy has focused on local level factors influencing proximate residents’ responses to new energy facilities [44,45,46,47,48]. These studies have found that local perception of renewable facilities can be more contentious than broad public opinion about renewable energy [3,49]. In this vein of research, emphasis is often placed on understanding locally-based opposition [50], though several recent studies have found nearby residents to be favorable or even indifferent toward renewable energy developments [48,51,52]. Public responses to wind and solar energy facilities are relatively well studied, but newer and less widespread renewable energies such as geothermal and wave/tidal energy are less studied. Rarely (if ever) have studies compared public support across a full suite of renewable technologies.
Across energy sources, several factors stand out as important in influencing public energy preferences. In a recent review article, Boudet [53] proposes a “technology, people, place, process” framework to categorize these factors and help order the state of knowledge on public perceptions of energy technologies. The technology category refers how the public perceives various factors related to the specific energy technology such as perceptions about its risks and benefits, the aesthetics and visibility of the technology, and its impact on energy production and pricing. The people component refers to sociodemographic and individual factors that can influence perceptions about energies such as the individuals’ norms, political views, and level of trust in government or industry as well as the influences of important others (e.g., elite cues, peer networks). The place category highlights how local context shapes public energy preferences including how the specific energy might impact landscape attachments or the local economy. Finally, the process component refers to procedural fairness, transparency, and public involvement in decision-making around energy development. Boudet’s framework captures the types of variables that are important in understanding public energy preferences, though it would be challenging for any one study to examine all four categories. Below, we discuss several of these factors in greater detail, specifically focusing on the people and place factors identified by Boudet.
First, in terms of “people” factors, political ideology, and party affiliation have consistently been shown to shape views about fossil fuels use in the U.S., with Republicans and conservatives being more supportive of using fossil fuels [7,40,54,55] and indicating preferences for lighter regulation of those sources [56,57] than Democrats and liberals. However, the two-party political system in the U.S. may account for some of this extreme polarization on energy and climate topics between political parties, and the effect of political ideology may be more nuanced in other countries with multiple political parties. For example, in a recent study from European Union countries, political ideology was a minor factor in predicting citizen policy priorities relevant to energy [58]. However, recent research from Canada—a three-party country—found significant divides in support for hydraulic fracturing based on political ideology, with conservatives being more supportive [59].
Global warming views are also relevant to energy preferences, in part because of the extreme political polarization over climate change, especially in the U.S. [60,61,62] with political leaders in many U.S. states (as well as the current U.S. president) frequently dismissing the threat of climate change and thwarting policy initiatives to phase out fossil fuels. Furthermore, the climate denial movement is well-documented (again, especially in the U.S.) including the network of think tanks and industry groups that have sought to limit the public’s concern about climate change and to discredit the work of climate scientists [63,64,65,66,67,68]. Public opinion polling about climate change is consistently less favorable in the U.S. than in Canada [69]. Recent estimates suggest that over 80% of the Canadian public thinks that global warming is happening and 60% say it is due mostly to human activities [17], while just 67% of the American public thinks climate change is happening and only 53% say it that it is mostly because of humans [16].
While global warming views are clearly relevant, it is not common practice to include this variable in the analyses of public energy preferences [55,70]. Past work with climate views included has found that believing that global warming is caused mostly by humans is significant for renewable energy support in some studies, but not in others [45,71,72], and that the public does consider emissions when weighing energy preferences [71]. Additionally, general environmental views have been found to influence energy preferences [4,5,10,73,74], though this is also not consistently measured across studies. Furthermore, environmental views and climate change beliefs may be more strongly related to support for fossil fuels-based energies than for renewable energies, which seem to be less polarizing overall. Though renewable energy is frequently construed as a climate mitigation strategy, it has other rationales that are less politically divisive such as local economic development, national energy security, and air pollution reduction [75,76,77]. In general, renewable energy has been found to be less divisive along partisan lines than fossil fuels, though this can be context-dependent [78]. In fact, renewable energy facilities have received strong support in politically conservative places [52,72,79,80,81] and tepid and/or hostile receptions in politically liberal areas, even from self-identified environmentalists [82,83].
Next, certain sociodemographic factors are commonly included in studies on public energy preferences. These typically include gender, race, age, education, and sometimes income. While research shows that gender is somewhat inconsistently related to general environmental views [84], it has a clearer relationship with risk perceptions about certain energy technologies (for example, hydraulic fracturing and nuclear energy) [7,54,55,85], with women perceiving greater risk and showing less support. A similar pattern has been shown for racial minorities [5]. Age, education, and gender have had mixed results, with different studies finding positive, negative, or non-significant relationships [40,43,74,85,86].
In terms of “place” factors, geographic and contextual factors influence public views about different energies. Spatial variation in public energy attitudes has been found relating to the prominence of energy industries in the local/regional economy [72,87], perceptions about the economic and/or cultural significance of those industries [88,89,90,91], and individuals’ distance from sites of energy extraction or production [92,93,94,95]. Generally, the literature has shown that proximity has a positive effect, that is, individuals living closer to sites of energy extraction and production are more supportive, though this relationship may not hold for proposed (as opposed to existing facilities) or renewable energy technologies and causality is unclear (i.e., does support precede or follow development?). Other place-based factors found in the literature to be significant with environment and energy views include place attachment [96], economic marginalization [85], and residence in a urban versus a rural area [97].
The main aim of this work was to compare public support for different energy technologies and to identify the factors that predict these views. We were especially interested in the relative influence of political ideology and global warming beliefs across the eight energies, given the intensely partisan divide on climate change, growing awareness of the climate crisis, and the influence of these dynamics on public energy debates in both countries. We also focused on the effect of perceived economic importance of local energy industries on support, which we propose is increasingly relevant to study, given the changing geographies of energy production [98].
Somewhat unsurprisingly, our results suggest the most support for renewable energy sources, specifically solar, wind, and wave/tidal energy, among our Pacific Northwest respondents, and the least support for nonrenewable energy sources, specifically coal, nuclear, and natural gas. Views on climate and the balance between environment and economy were consistent predictors of support across most energy types, while political ideology was less consistent. Perceived local importance of both extractive and renewable energy industries were significant predictors of support for some, but not all, energy sources, as were education and gender. We also found evidence of some homogeneity across British Columbia, Oregon, and Washington, but not within states/provinces, suggesting that certain (unspecified) local-level factors might be influencing public opinion. Overall, our research suggests that while divisions persist in public energy preferences for both renewable and non-renewable sources, there is broadest support for renewable energy technologies, especially those that are more familiar. However, we caution that even renewable energy sources in an environmentally progressive region are subject to division, with wind energy suffering from partisan divisions, and hydro linked to concerns about environmental impacts.

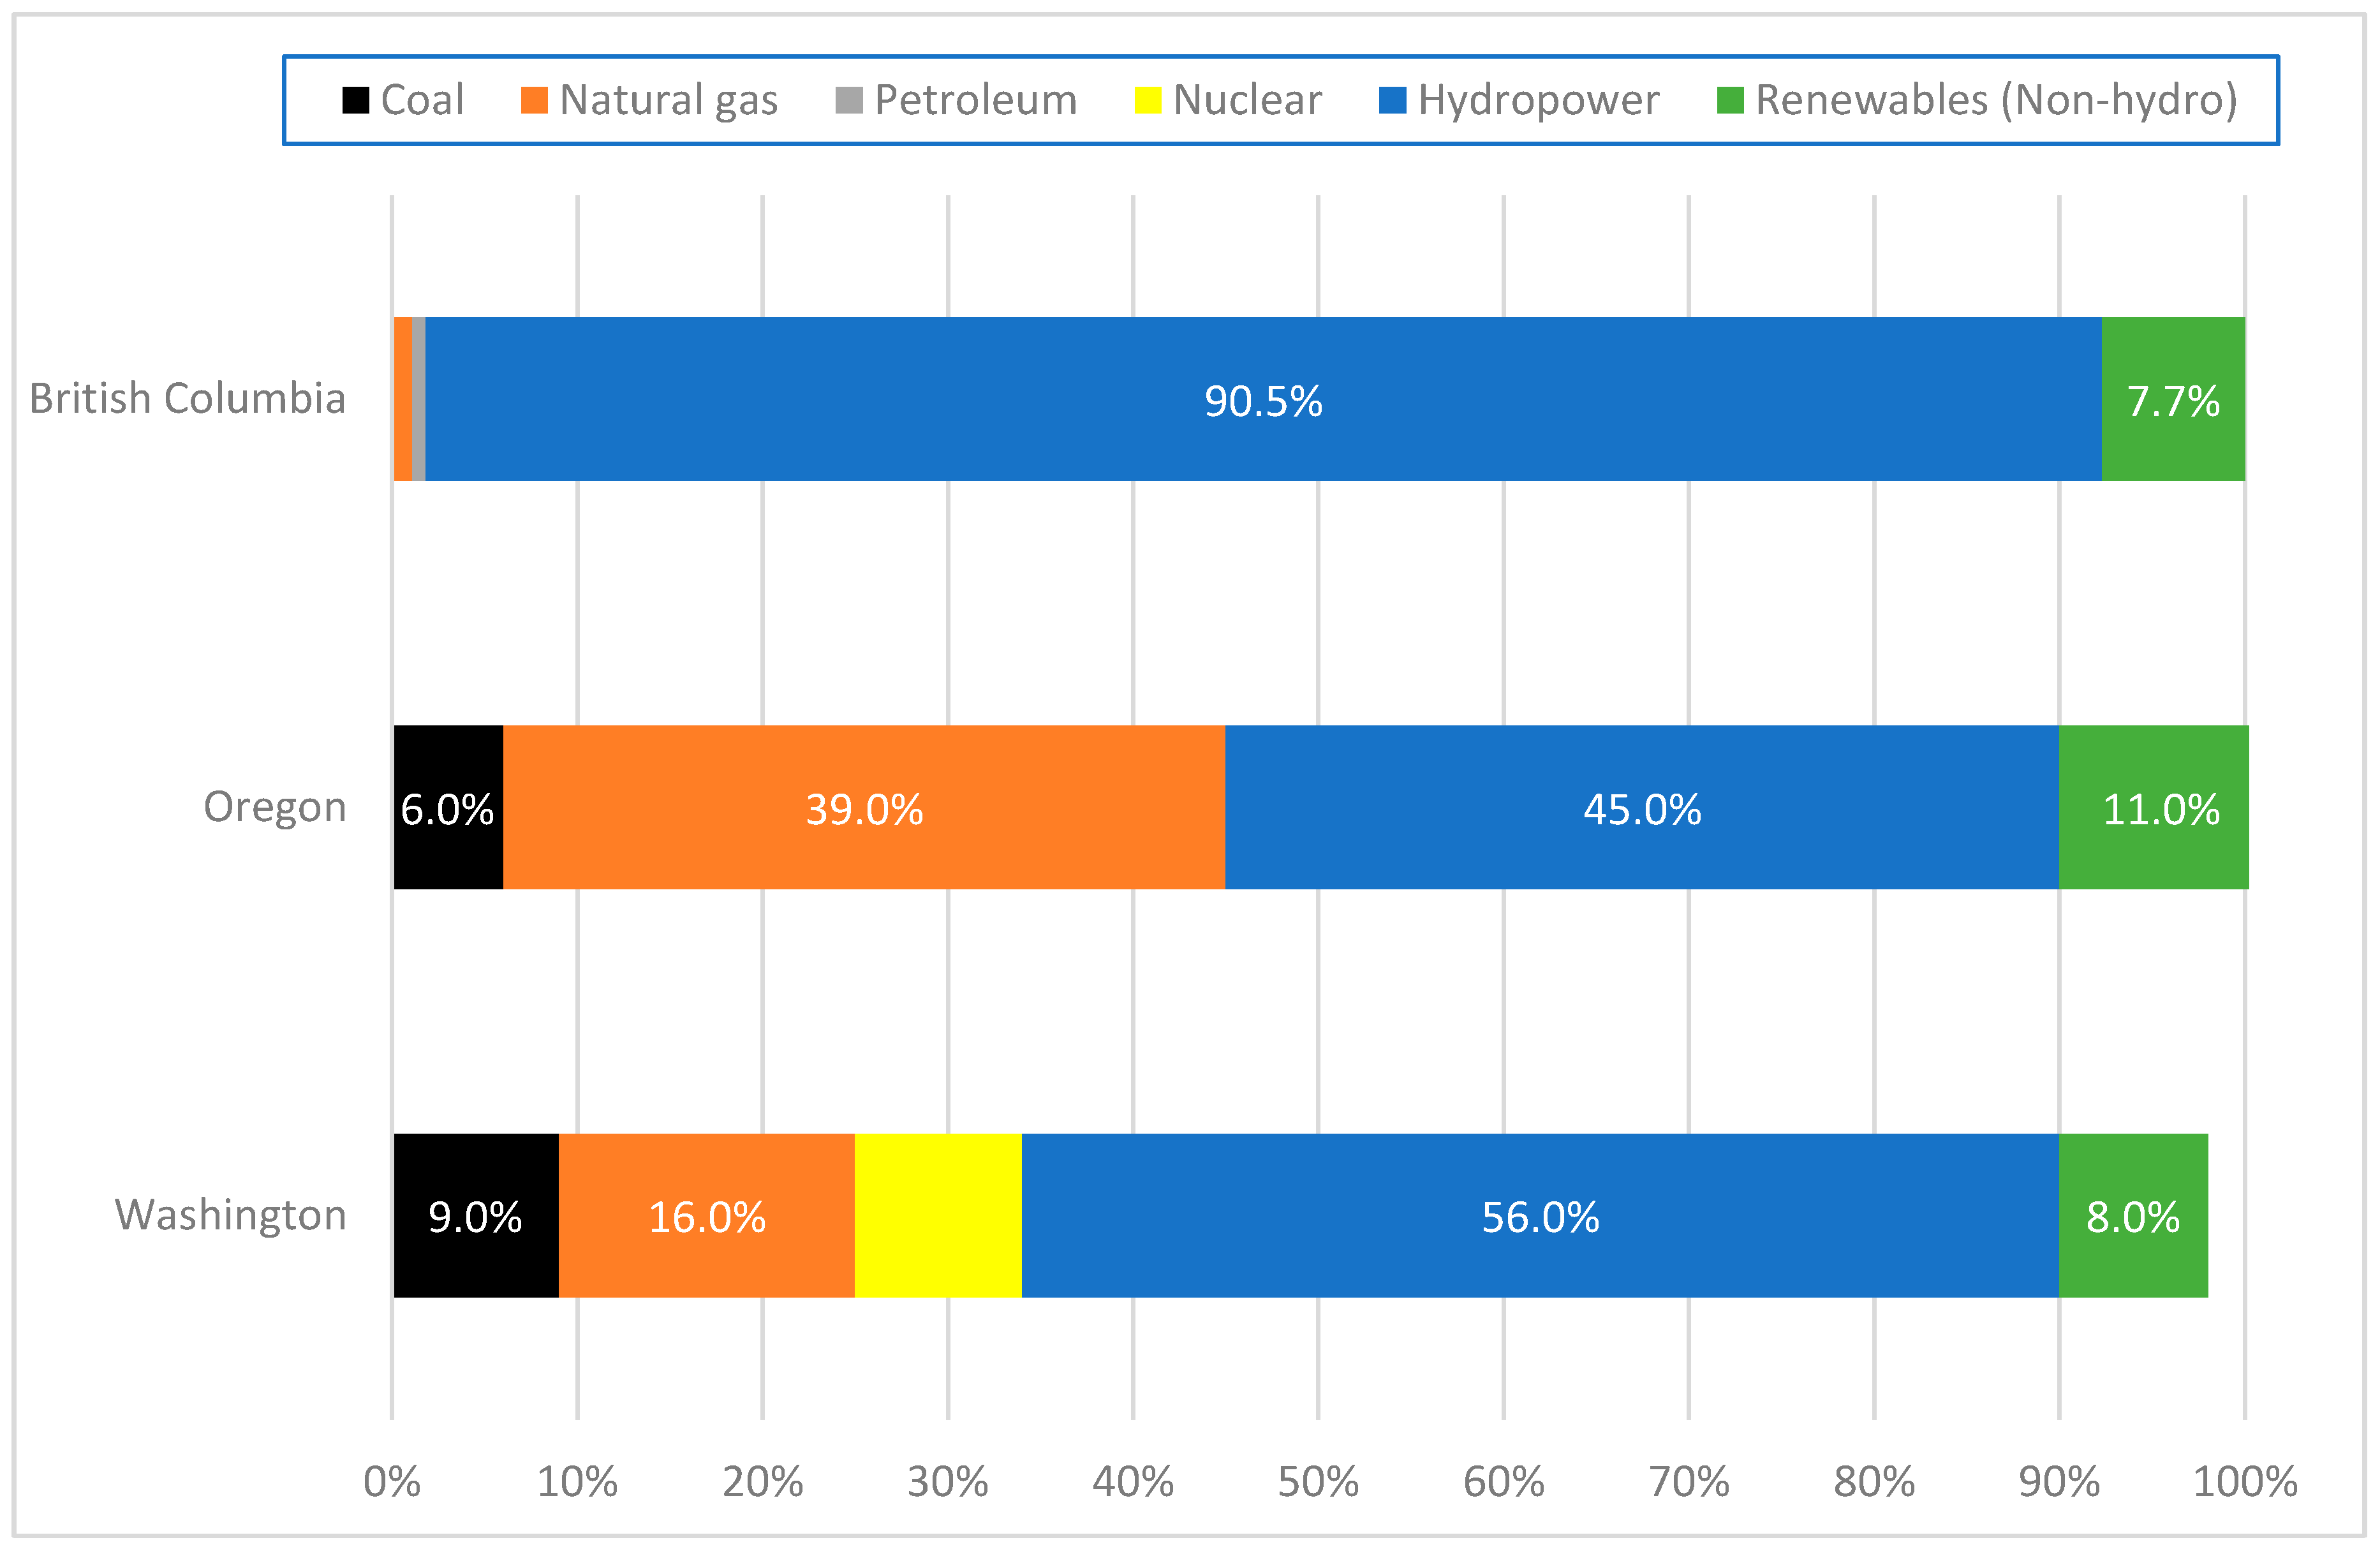
1.3. The Pacific Northwest

We utilized data from an online survey administered in September 2019 to residents of Washington (WA), Oregon (OR), and British Columbia (BC). This region is known as environmentally progressive, and the public from these states/province generally have higher levels of anthropogenic ascription to global warming and greater support for a carbon tax than some other parts of the U.S. and Canada [16,17]. Furthermore, WA, OR, and BC are at the leading edge of climate and energy policymaking, though this is facilitated in part by the region’s significant hydroelectric capacity (see Figure 1). In 2016, the state of Oregon passed legislation to double the state’s RPS to 50% and retire all coal-fired electricity by 2030 [99], and even more recently, Washington’s Governor passed legislation to aggressively reduce carbon emissions and attain 100% ‘clean’ electricity by 2045 [100]. Oregon’s last coal-fired power unit is slated to shut down in 2020; Washington’s in 2025. In BC, a 2010 rule required 93% of all electricity to come from ‘clean or renewable sources’ [101], and the province has surpassed that goal.
However, significant fossil fuel industries continue to thrive in each state and province. Though it has no coal, oil, or gas mining, Washington hosts five major crude oil refineries that are supplied by a network of pipelines and oil trains, comprising the fifth greatest capacity of any U.S. state to refine oil [104]. Oregon has a few natural gas reserves, but mostly imports natural gas from Canada and other U.S. states to power its natural gas fired units, which comprise the second-largest portion of the state’s electricity after hydro [105]. Both Oregon and Washington have hosted proposals for some of the most highly contentious fossil fuel export facilities nationwide [106,107,108]. Though BC gets no power from coal currently, coal mining is a major industry in the province, with most being exported to Asian markets [109]. Additionally, BC accounted for almost one-third of Canada’s natural gas production and almost 2% of crude oil [110].
Given the dual existence of pro-climate policies and major fossil fuels industries, we argue that this region is an especially interesting and relevant place to study public preferences for different sources of electricity production. A number of municipalities in this region have passed local ordinances or resolutions banning the construction of additional fossil fuels infrastructure facilities [111], in fact, the area as a whole has been dubbed the ‘thin green line’ of resistance between domestic fossil fuel extraction and overseas export and consumption [106,112], though such resistance is likely clustered in certain geographic parts of each state/province.
This paper turns next to the survey sampling, measurements, and analysis procedures, after which we present the results, a discussion of findings, and our conclusions and recommendations.

2. Materials and Methods

2.1. Sampling, Matching, and Weighting Procedures

We contracted YouGov, a global public opinion vendor frequently used in public opinion research, to recruit the sample and administer our survey. Online administration is widespread in contemporary survey research [113], in part due to its convenience and relative affordability [114], but also due to consistently declining response rates to more traditional survey modes such as mail, telephone, and in-person data collection. While all survey modes could be subject to low response rates and resulting non-response bias [115,116], online vendors can usually obtain the desired number of responses using an online platform because of their large respondent pools. Additionally, high quality vendors such as YouGov utilize strategies such as quota sampling and sample weighting to ensure that a convenience (nonprobability) sample best approximates a probability sample, leading to more robust results. A recent study by the Pew Research Center assessed the accuracy of online nonprobability samples [117]. Pew’s study showed that vendors using a more elaborate sampling procedure and weighted the data to an appropriate target demographic profile yielded the most accurate results. YouGov is known for its complex sample matching and weighting procedure that aims to select a representative sample from a non-randomly selected respondent pool.
We requested that YouGov recruit 500 respondents from Oregon, Washington, and British Columbia, with equal numbers from rural and urban counties/districts. YouGov originally interviewed 690 respondents for Oregon, 760 respondents for Washington, and 794 respondents for British Columbia (2224 total), with about half from rural and half from urban counties.
YouGov then reduced the sample to 1500 respondents using a matching and weighting procedure based on a sampling frame of gender, age, race, and education. This produced the final sample. For Oregon and Washington, the sampling frame was constructed using stratified sampling from the full 2017 American Community Survey (ACS) 1-year estimates using selection within strata by weighted sampling with replacements. For British Columbia, the frame was constructed using stratified sampling from the 2012 full Canada Internet Usage Survey sample using selection within strata by weighted sampling with replacements.
YouGov then weighted the matched cases to the sampling frame using propensity scores. The matched cases and the frame were combined and logistic regression was estimated for inclusion in the frame. The propensity score function included age, gender, race/ethnicity, years of education, region, and metro/non-metro. The propensity scores were grouped into deciles of the estimated propensity score in the frame and post-stratified according to these deciles.
YouGov included the sampling weights in the final dataset. For Oregon and Washington, the weights were post-stratified first by using the 2016 Presidential vote choice and a four-way stratification of gender, age (four categories), race (four categories), and education (four categories), then on metro/non-metro distribution from the November 2018 Current Population Survey (CPS) to produce the final weights. For British Columbia, the weights were first post-stratified on a four-way stratification of gender, age (four categories), race (four categories), and education (four categories), and then on metro/non-metro distribution from the 2018 Census.

2.2. Data Quality and Attention Check

YouGov analyzed the final survey data for quality, and respondents were removed or replaced who (1) indicated a patterned mode of response (e.g., those who chose only response options at the far-left side of a grid-set of questions), (2) clearly sped through the survey instrument, and (3) failed an attention check. The attention check was a singular item set in a grid of questions that asked, “No matter how you answered on the other items, for your answer to this item, please select strongly disagree.”

2.3. Question Measurement

The authors designed the survey instrument. Our dependent variables—support for eight energy sources—were measured by asking respondents the following question, which was the first in the survey instrument: “Consumers such as you have more and more say in how electricity is produced in the U.S. To meet the country’s electric power needs over the next 25 years, new power plants will have to be built. Companies and government agencies need to start planning today. How should we meet this demand? For each power source listed below indicate whether you feel the U.S. should REDUCE or INCREASE its use.” Power sources included Coal Power, Natural Gas Power, Nuclear Power, Hydroelectric power (dams), Wind Power, Solar Power, Wave or Tidal Power, and Geothermal Power. Respondents indicated their level of support for each energy resource by choosing from a five-point scale that ranged from “Reduce a Lot” [1] to “Increase a Lot” [5], with “Keep Same” [3] as the middle option. All dependent variables were collapsed into three categories (Reduce [0], Keep Same [1], Increase [2]) due to data sparsity in some categories (e.g., very few respondents answered “Reduce a Lot” for solar) and for ease of interpretation.
The survey instrument included a variety of factors discussed in the introduction section above and shown in past research to be significant in predicting public opinion on energy issues. These included sociodemographic characteristics (gender, age, race, and education) and whether the individual resided in an urban or rural county. We also measured political ideology, belief in anthropogenic warming, support for environmental protection over economic growth, and perceived importance of energy industries to the local economy. Table 1 describes specifically how each measure was constructed and coded, as well as presents raw (unweighted) descriptive statistics for each independent variable in our analysis.

2.4. Analysis

We first present the (weighted) descriptive results for the respondents’ levels of support for the eight energy sources and compared them across WA, OR, and BC. Next, we estimated eight random intercept mixed effects regression models (one per energy source) to analyze the significant predictors of support. Regression modeling is widely used in environmental survey research [55,87,92,112] because it provides a method for understanding how certain social characteristics (such as education or political ideology) may relate to individuals’ views on environmental topics. Using mixed effects modeling (also known as multilevel modeling) allowed us to account for possible unobserved heterogeneity at different spatial levels (known as random effects), in this case, county (or Canadian district) and state (or Canadian province). A mixed effects modeling approach helps account for similarities (if there are any) between respondents living in the same county/district or state/province [118] and is an increasingly common approach for analyzing spatially-dependent survey data [72,92,119,120,121,122,123]. We used ordinal logistic regression modeling instead of ordinary least squares linear regression modeling because our dependent variables were categorical and not normally distributed (Supplementary Materials). We estimated the multilevel ordered logistic regression models using Stata’s meologit command. Prior to running the regression models, we checked all variables for multicollinearity. In our results, we present the odds ratios for the fixed effects coefficients (independent variables) and analyze for random effects at both the county/district and state/province levels.

3. Results

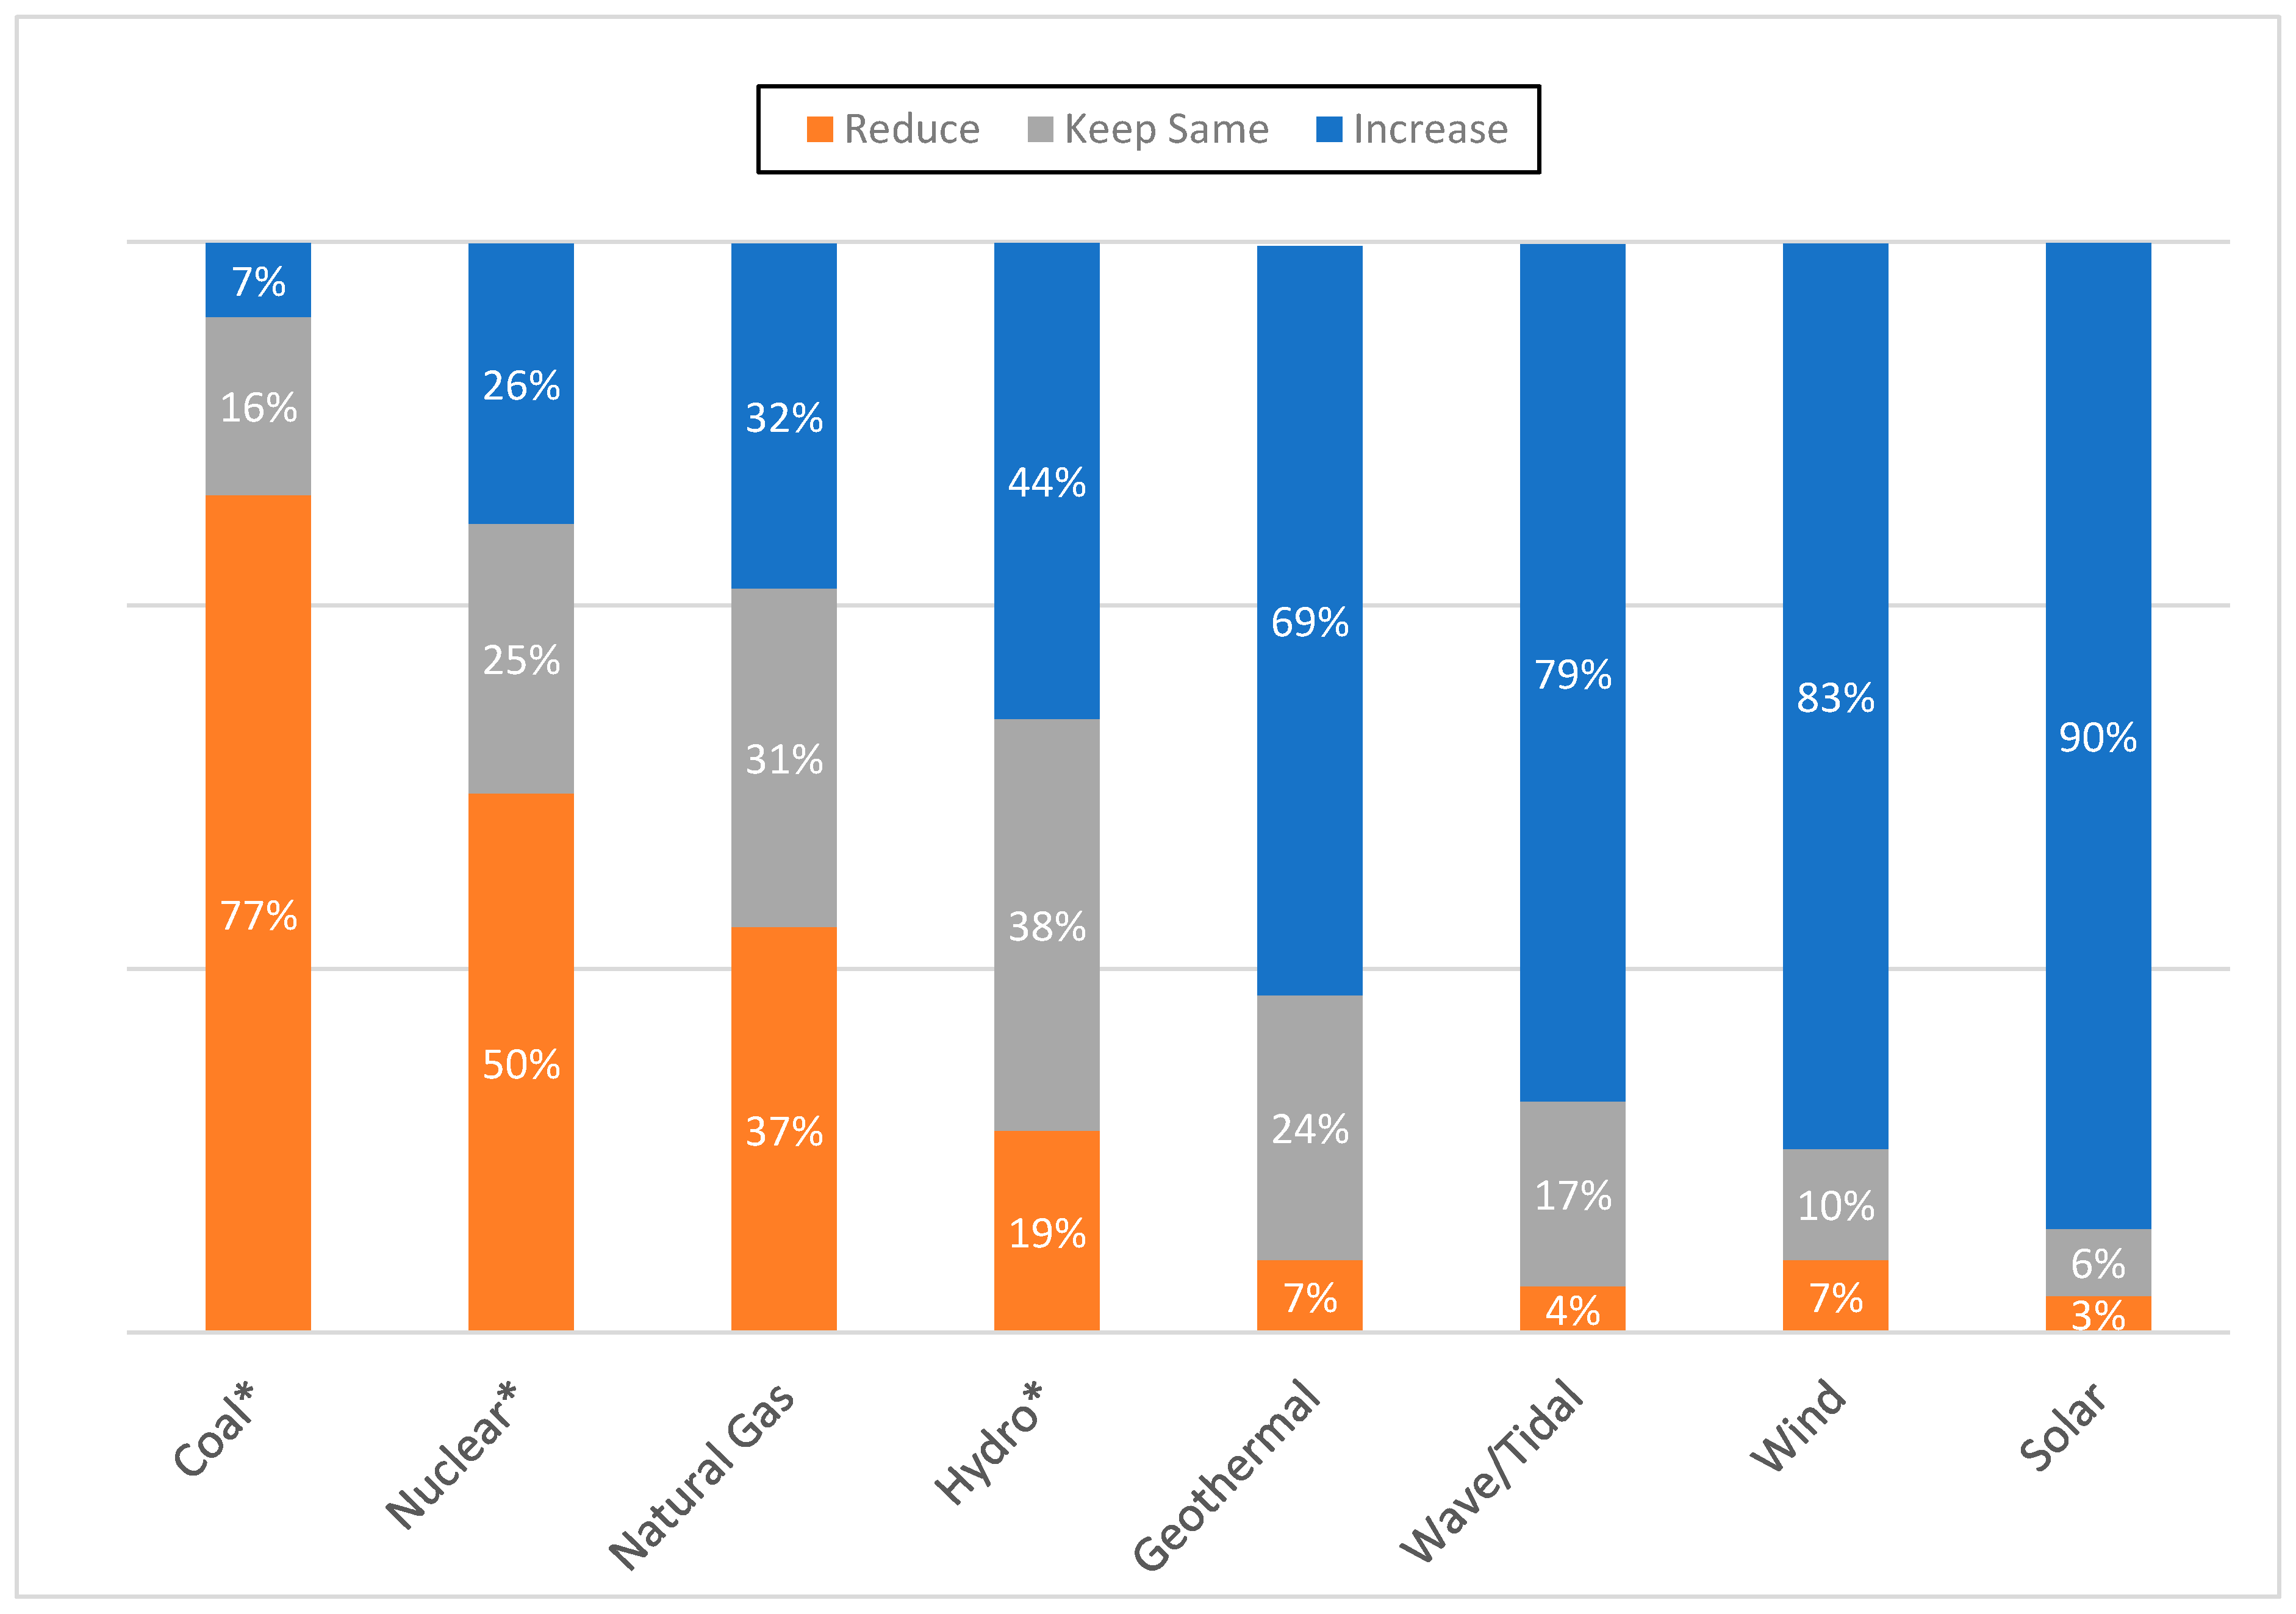
3.1. Respondent Support across Energies and Location

Figure 2 presents response frequencies for all dependent variables, ordered from least to most preferred. By far, coal had the least support, with 1152 out of 1500 respondents (77%) expressing support for reducing the use of coal. Natural gas and nuclear also had relatively low support compared with the other energies, with between a third to a half of respondents indicating they wished to phase out these energy sources. Respondents expressed the most neutral views for hydroelectric energy, with over a third saying they would like to maintain the status quo for this energy source. Renewable energies had by far the most support from respondents, with three-quarters of respondents saying they wished to see wind, solar, wave/tidal, and geothermal energy sources increased. Of these renewable energy sources, solar had the most support and the least neutral views; clearly, respondents overall favored solar over any other energy sources.
To test for significant differences by state/province, we calculated the Pearson chi-squared statistic for respondent support for each of the eight energy sources (using the same 3-category variable used in Figure 2 and in the regression analysis below). We found significant differences in respondent support by state/province for coal (X2 = 17.84, p < 0.001), nuclear (X2 = 23.95, p < 0.000), and hydropower (X2 = 34.53, p < 0.000). Overall, this analysis revealed that respondents in British Columbia were more opposed to the use of coal and nuclear than those in Oregon and Washington, and respondents in Oregon were more opposed to hydropower than those in Washington and British Columbia. Despite these differences, our results suggest a generally homogenous outlook on future energy sources throughout the region.

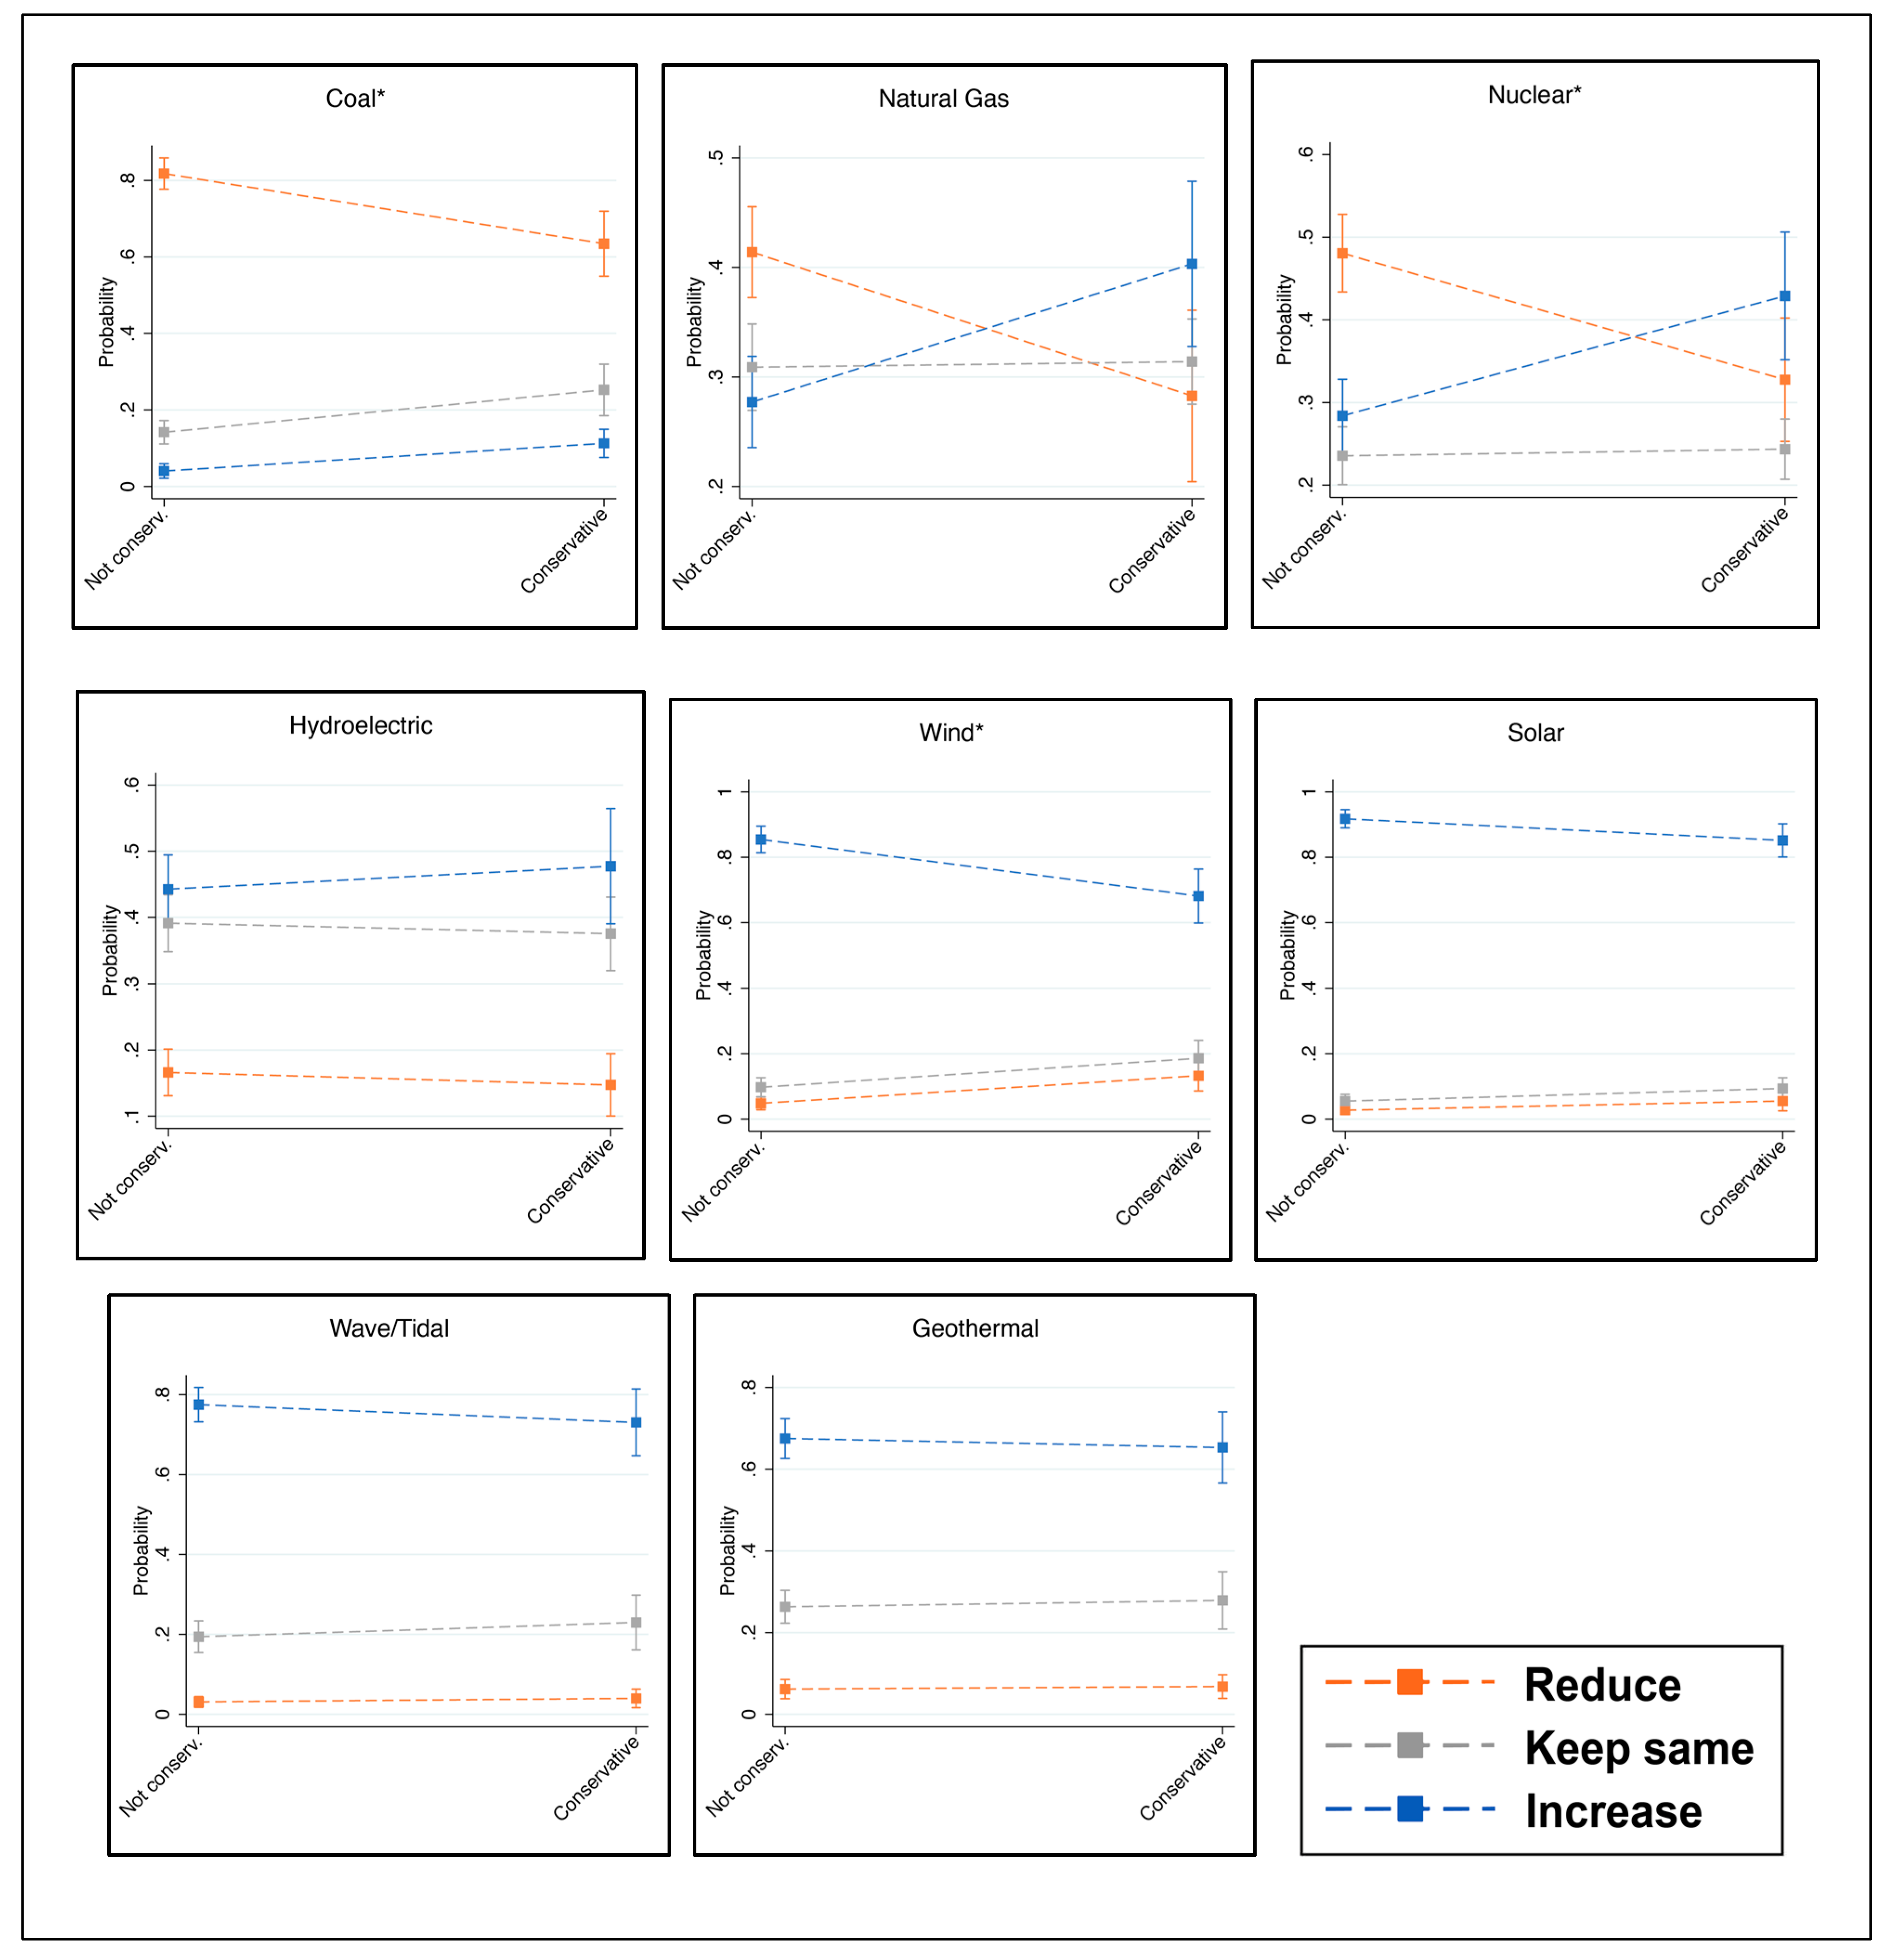
3.2. Multilevel Regression Modeling to Analyze Predictors of Support

We discuss the results by first comparing the effect of independent variables across the eight models, then by discussing the variance components to analyze random effects at the state/province and county/district levels (Table 2). We also compared the model fit to consider the relative predictive power of each model.
We first note the influence of the four sociodemographic variables. Odds ratios that are greater than one indicates higher odds of support as the independent variable increases; odds ratios less than one indicates lower odds of support as the independent variable increases. Gender had the most pronounced effect on support for nuclear energy, with the odds ratio indicating that males have about three times higher odds as females of being more supportive of nuclear energy (OR = 3.140, p < 0.001). Males also had about 73% higher odds than females of being more supportive of natural gas (OR = 1.735, p < 0.001) and about twice the odds as females of being more supportive of wave/tidal energy (OR = 1.997, p < 0.001) and geothermal energy (OR = 2.191, p < 0.001). Age was a statistically significant predictor of support for nuclear and geothermal energies, but we note that the odds ratios were very close to one, thus indicating an effect of little practical significance. Being white was a statistically significant predictor of support for two energy sources: the odds of supporting solar were two and a half times larger for white respondents than non-white (OR = 2.633, p < 0.001) and ten percent larger for nuclear. Education significantly predicted support for all energies except wave/tidal and nuclear. Compared to respondents without a Bachelor’s degree, those with a Bachelor’s degree had lower odds of supporting coal (odds ratio = 0.479, p < 0.05), natural gas (OR = 0.787, p < 0.001) and hydropower (OR = 0.812, p < 0.001), but about twice the odds of supporting wind (OR = 2.668, p < 0.001), solar (OR = 2.368, p < 0.001), and geothermal (OR = 1.771, p < 0.05). Finally, respondents living in an urban county had higher odds of supporting nuclear, twice as high as those in a rural county (OR = 2.040, p < 0.001), and about 25% lower for supporting geothermal (OR = 0.767, p < 0.05).
Next, political ideology was a statistically significant predictor in three models: coal, wind, and nuclear. The odds of being more supportive of coal were about three and a half times larger for respondents who identified as politically conservative than for those who did not (OR = 3.405, p < 0.001), and two times larger for nuclear (OR = 2.083, p < 0.05). Conservatives had notably lower odds of supporting wind energy, about 75% lower than those who did not identify as conservative (OR = 0.278, p < 0.01).
Environmental priority and anthropogenic warming were both statistically significant in many of the eight models, although anthropogenic warming was consistent in more models and had larger effect sizes. Respondents who indicated they prioritized environmental protection over economic development had higher odds of supporting wind, solar, and wave/tidal and lower odds of supporting nuclear, natural gas, and hydroelectric energy. Anthropogenic warming was a statistically significant predictor for all energies except geothermal; it was positively related to support for solar energy (OR = 5.615, p < 0.001), wind energy (OR = 3.090, p < 0.001), and wave/tidal energy (OR = 2.074, p < 0.01), and negatively related to support for coal (OR = 0.332, p < 0.001), nuclear (OR = 0.700, p < 0.01), natural gas (OR = 0.449, p < 0.05), and hydropower (OR = 0.754, p < 0.05).
In terms of the importance of local industries, we found statistically significant effects for both mining/refining/utilities and renewable industries. The odds of supporting coal were about 40% higher for respondents who felt mining/refining/utilities were important to the local economy than those who did not (OR = 1.428, p < 0.05) and 20% higher for supporting natural gas (OR = 1.201, p < 0.001), but 30–40% lower for wind (OR = 0.695, p < 0.001), solar (OR = 0.674, p < 0.001, wave/tidal (OR = 0.674, p < 0.001), and geothermal (OR = 0.766, p < 0.001). In terms of renewable industries, the odds of supporting increased use of solar energy were over 60% higher for respondents who felt these industries were locally significant (OR = 1.629, p < 0.001), 40% higher for wave/tidal (OR = 1.419, p < 0.05), and 20% higher for hydroelectric (OR = 1.190, p < 0.01) and geothermal (OR = 1.206, p < 0.001).
As odds ratios are difficult to interpret in terms of the effect sizes, we have produced a set of predictive margins plots for one explanatory variable to provide a clearer example of model effects. Figure 3 displays eight predictive plots (one per energy source) that compare the relative probabilities for conservatives’ and non-conservatives’ preferences that each energy source be reduced, kept at the same production rate, or increased (holding all other variables in the regression models constant). The plots for coal, natural gas, and nuclear show that conservatives have a lower probability of wanting reduced production of these three energies than non-conservatives, and a higher probability of wanting to increase the use of these three energies. Conservatives were also more likely to say they wanted to keep the use of coal at status quo levels, but this was not the case for natural gas or nuclear, where the two groups did not vary substantially. In the remaining five plots (hydroelectric, wind, solar, wave/tidal, and geothermal), conservatives and non-conservatives were more similar to each other; this is especially the case in the solar, wave/tidal, and geothermal plots where (as evidenced by the very flat lines between the two groups) conservatives and non-conservatives had fairly equal probabilities of indicating all three response options. These plots also show that all respondents had a high probability of wanting to increase the use of solar and a much lower probability of wanting to reduce or keep the use of these energies at the same level. The plot for wind, though similar, shows a slightly different story, with conservatives, compared with non-conservatives, having a lower probability of wanting to increase the use of wind and a higher probability of wanting to reduce wind energy or keep it at the same level. Still, the plot for wind showed that respondents as a whole had a higher probability of wanting to increase, rather than reduce, the use of wind energy. Finally, the plot for hydroelectric showed that conservatives had a higher probability of wanting to increase this energy source and slightly lower probabilities of wanting to reduce or keep the use of this energy the same.
Next, we examined the variance components of our regression models to assess the presence of random effects at state/province and county/district levels, essentially assessing the potential influence of local contextual effects on public opinion at different geographic levels. Level 3 variance components suggest that there was no pattern in public opinion based on what state or providence the respondents lived in. In contrast, Level 2 variance components suggest that opinion was patterned based on what counties/districts respondents resided in.
Finally, we assessed AIC and BIC as measures of relative model quality. Lower values of the AIC and BIC indicate models with a better fit. Thus, the values presented in Table 2 indicate that the solar, wind, wave, and coal models were better fit than those for nuclear, natural gas, hydro, and geothermal models, suggesting that there might be other variables not captured in this study that might better predict public opinion on the latter four energies.

4. Discussion

We used an online survey sample to measure public support for eight different sources of electricity in WA, OR, and BC. The highest support amongst respondents was for non-hydro renewable energy sources: wind, solar, wave/tidal, and geothermal. Coal by far had the least support, followed by nuclear, natural gas, and hydroelectric. Our regression modeling revealed that political divisions existed for some (but not all) energy sources, suggesting that some energy resources enjoy broader public appeal than others. Electricity sources that were politically polarized were coal, nuclear, and wind. Interestingly, other less prevalent renewable energy sources—solar, wave/tidal, and geothermal—did not show the same political divisiveness. Although natural gas showed relatively low respondent support compared with renewable resources, this support did not appear to be politically polarized. This finding suggests that political liberals may not have settled on a position about natural gas’s merit as a ‘bridge fuel’ to replace coal-fired energy, versus its own greenhouse gas contributions and other environmental impacts. That renewable energy sources were largely not politically polarized is consistent with the literature, though we note the political division over wind energy in our sample. It is possible that this stems from the pattern of wind energy development in this region, such that it is often built in more politically conservative rural counties, though we did not see the same divide between urban and rural residents. It could also be related to elite cues in the form of negative and politicized discourse about wind energy from leaders like the U.S. President Donald Trump and others [124].
Belief in anthropogenic warming was a more consistent predictor of support for different electricity sources than political ideology. In the case of natural gas, respondents who attributed warming to human activities were about half as likely to indicate support, suggesting that greenhouse gas emissions were a relevant factor in weighing the upsides and downsides of this resource. Anthropogenic warming was also a strong predictor of support for all renewable resources except geothermal energy, as was placing priority on environmental protection over economic development. Thus, even though we found evidence suggesting most renewable energies are not politically polarized, our respondents expressed deep divisions on the basis of environmental views, which themselves have long been politically polarized [61,125]. This finding is consistent with a 2015 study by Steel et al. in Oregon and Washington [74], which also found that environmental views mattered for all renewable energy sources except geothermal.
Our findings also suggest that nuclear energy is more politically divisive than hydropower, and nuclear also had less support overall. We are not surprised by this finding, given the history of contentious debate over the risks of nuclear energy, and in light of the region’s abundant hydroelectric resource and its reliance on hydropower to achieve clean energy goals. We were also not surprised that support for environmental protection was related to lower support for both energy sources. However, the finding that belief in anthropogenic warming was also related to lower support for both was puzzling, given that both energy sources are carbon-free. This result either highlights gaps in public knowledge about these energies or simply indicates that individuals who acknowledge human-based warming also have concerns about using nuclear and hydropower as a solution (and would likely prefer other renewable resources).
We found evidence suggesting that respondents from the same county/districts felt somewhat similarly toward the various energy sources, though our model did not account for what specific local factors might be responsible for this. Previous work has found that local significance of energy industries can favorably influence residents’ perceptions of those energy sources, and even unfavorable influence their perception of new or different energy sources [72,87,89,92]. In this study, we found that perceived local economic importance of energy industries was related to all energy types except nuclear, though we caution that our measure was based on respondent perception. Future research could refine this measure in various ways including tying it to the objective economic contributions of each energy source to different localities. Furthermore, though we did find some differences between respondents’ energy preferences in the bivariate analysis (British Columbia respondents were less favorable toward coal and nuclear, and Oregon respondents were less favorable toward hydropower), we did not see the same effects in our regression modeling once control variables were accounted for. This suggests that the two states and province make up a cohesive region, at least in terms of public energy preferences, and that region (even if it crosses national boundaries) is a worthwhile level of analysis. Our results also suggest that local-level factors may shape public preferences more than state or national factors.
The strong, positive effect of gender on support for wave/tidal, nuclear, natural gas, and geothermal energy is something worth examining in future studies. Previous work has found differences in male versus female support for risky technologies [55,84], and these four sources could be perceived as more risky than the other four either because they are unknown/new (in the case of wave/tidal and geothermal) or because they have been attributed as bearing risky effects (e.g., nuclear meltdown and hydraulic fracturing).
Some limitations to our study are worth mentioning. First, we focused on utility-scale electricity production and did not ask the respondents about their preferences for distributed or community-scale electrical generation. However, while our measures specifically asked about preferences for new power plants, some of our respondents may have answered favorably to solar energy (for example) because they support residential, rooftop solar. Thus, future studies should try to more specifically parse out preferences for both utility-scale and distributed energy generation. Second, though our dataset underwent complex matching and weighting procedures, we ultimately relied on convenience sampling rather than scientific random sampling, thus limiting generalizability. Furthermore, we acknowledge that there are likely missing explanatory factors, particularly related to process and place, that could be significantly related to public energy preferences. Finally, we asked about preferences for energy technologies that were likely less familiar to the majority of respondents (for example, wave/tidal and geothermal), and we did not control for respondents’ familiarity (although the literature consistently finds that the public is unfamiliar with energy technologies in general [53]). It remains to be seen how these more unfamiliar technologies will come to be represented (for example, the degree to which they are associated with climate mitigation or the degree to which they become politically polarized) as they become increasingly common in energy production.

5. Conclusions and Recommendations

Much remains to be determined about the future of energy in both the U.S. and in Canada, and public preferences will help shape that future. As coal phase-out continues in an effort to decarbonize electricity production, will coal continue to be largely replaced by natural gas-based electricity? Will renewable energy continue to proliferate at the same rate or faster, and how quickly will newer renewable energy technologies come online? Will nuclear and hydropower maintain their current share of non-greenhouse gas emitting electricity production, or will these sources decline as facilities reach their expiration dates and are not replaced due to unfavorable economics and public opposition?
These questions highlight some uncertainties about the future of electricity production in British Columbia, Oregon, and Washington. In this region, the continued shift toward carbon-free electricity production depends not only on ongoing renewable energy development, but also continued reliance on hydroelectric energy and, at least in Washington State, continued use of nuclear energy. Additionally, since the use of coal in this region is already set to fully phase out in the near future, a major uncertainty is how much electricity production will be generated from natural gas. Though past studies have found that the public is divided about natural gas extraction techniques [7], natural gas as an electricity source has been framed by industry and governments as a bridge fuel to a cleaner energy future (even a ‘clean fuel’ in some cases) [126]. At the same time, many climate activists see it as a ‘bridge to nowhere’ that impedes progress on renewables.
The purpose of the present research was to measure citizens’ energy preferences (and the predictors thereof) in a globally significant region that hosts progressive climate policy and politics alongside immense fossil fuel production (British Columbia) and export (Oregon and Washington) potential. Unlike most public opinion studies, our study incorporated both urban and rural areas, which is important given that much energy production and export takes place in periphery or rural areas. Furthermore, our study is unique in that we measured the energy preferences across a large suite of energy sources including renewable and nonrenewable sources as well as familiar and unfamiliar types of renewable energies such as wave/tidal and geothermal. We found the highest support for renewably generated electricity, and we note that respondents were not politically divided for three of the four non-hydro renewable energies, a significant finding given the substantial political divide on climate mitigation policy in the U.S., especially, but also in Canada. We note, however, that respondents were somewhat more ambivalent toward wave/tidal and geothermal energies, which could indicate less familiarity with these types of renewables. One recommendation to come out of this work is for energy changemakers and developers alike to pursue both greater use and wider communication about these less familiar renewable energy sources; indeed, our research suggests that diverse residents of this region are open to greater use of them.
Though we found the highest support for renewable sources of electricity, we caution that even these sources in an environmentally progressive region are subject to division, with wind energy suffering from partisan divisions and hydroelectric energy linked to concerns about environmental impacts. Thus, another recommendation based on this research is for policymakers and non-governmental organizations to work to depoliticize wind energy and seek to avoid polarization around other non-hydro renewables. One method of doing this could be to use non-climate based frames to discuss and justify further development of these resources; indeed, some other recent work has also come to similar conclusions [75,76,77].
Perhaps even more relevant to the future of a carbon-free energy transition are public attitudes about natural gas, nuclear, and hydropower, all of which had lower levels of support than the four renewable (non-hydro) energies, but which comprise a significant portion of the current electricity portfolio in this region and are likely important components of a renewable energy future to provide baseload support for more intermittent renewable energy generation. This finding suggests possibly bitter battles ahead in the Pacific Northwest (and other regions like it) as policymakers and energy planners seek to balance public preferences for non-hydro renewable sources with the everyday realities of meeting energy demand in the context of changing political and physical climates.

Supplementary Materials

The following are available online at https://www.mdpi.com/1996-1073/13/8/1940/s1.

Author Contributions

Conceptualization, S.O.H. and H.S.B.; data curation, S.O.H. and H.S.B.; funding acquisition, S.O.H. and H.S.B.; methodology, S.O.H. and H.S.B.; writing—original draft, S.O.H. and H.S.B.; writing—review & editing, S.O.H. and H.S.B. All authors have read and agreed to the published version of the manuscript.

Funding

This research was funded by The Evergreen State College, 2018 Sponsored Research Grant for Faculty and by Oregon Sea Grant (NA18OAR4170072).

Conflicts of Interest

The authors declare no conflicts of interest. The funders had no role in the design of the study; in the collection, analyses, or interpretation of data; in the writing of the manuscript, or in the decision to publish the results.

References

  1. Bolsen, T.; Cook, F.L. The Polls—TrendsPublic Opinion on Energy Policy: 1974–2006. Public Opin Q. 2008, 72, 364–388. [Google Scholar] [CrossRef]
  2. Stoutenborough, J.W.; Shi, L.; Vedlitz, A. Probing public perceptions on energy: Support for a comparative, deep-probing survey design for complex issue domains. Energy 2015, 81, 406–415. [Google Scholar] [CrossRef]
  3. Bell, D.; Gray, T.; Haggett, C.; Swaffield, J. Re-visiting the ‘social gap’: Public opinion and relations of power in the local politics of wind energy. Environ. Politics 2013, 22, 115–135. [Google Scholar] [CrossRef] [Green Version]
  4. Ansolabehere, S.; Konisky, D.M. Cheap and Clean: How Americans Think about Energy in the Age of Global Warming; The MIT Press: Cambridge, MA, USA, 2014. [Google Scholar]
  5. Ansolabehere, S.; Konisky, D.M. Public Attitudes Toward Construction of New Power Plants. Public Opin Q. 2009, 73, 566–577. [Google Scholar] [CrossRef]
  6. Ansolabehere, S.; Konisky, D.M. The American Public’s Energy Choice. Daedalus 2012, 141, 61–71. [Google Scholar] [CrossRef] [Green Version]
  7. Boudet, H.; Clarke, C.; Bugden, D.; Maibach, E.; Roser-Renouf, C.; Leiserowitz, A. “Fracking” controversy and communication: Using national survey data to understand public perceptions of hydraulic fracturing. Energy Policy 2014, 65, 57–67. [Google Scholar] [CrossRef]
  8. Leiserowitz, A.; Maibach, E.; Roser-Renouf, C.; Rosenthal, S.; Cutler, M. Politics and Global Warming, Spring 2016. Yale Program on Climate Change Communication; Yale University: New Haven, CT, USA, 2017. [Google Scholar]
  9. Gallup Most Americans Support Reducing Fossil Fuel Use. Available online: https://news.gallup.com/poll/248006/americans-support-reducing-fossil-fuel.aspx (accessed on 16 August 2019).
  10. Jobin, M.; Siegrist, M. We choose what we like-Affect as a driver of electricity portfolio choice. Energy Policy 2018, 122, 736–747. [Google Scholar] [CrossRef] [Green Version]
  11. Karapin, R. Federalism as a Double-Edged Sword: The Slow Energy Transition in the United States-Roger Karapin. J. Environ. Dev. 2019, 29(1), 26–50. [Google Scholar] [CrossRef]
  12. Komor, P. Renewable Energy Policy; Diebold Institute for Public Policy Studies, IUniverse: New York, USA, 2004; ISBN 978-0-595-31218-4. [Google Scholar]
  13. Warner, B.; Shapiro, J. Fractured, Fragmented Federalism: A Study in Fracking Regulatory Policy. Publius 2013, 43, 474–496. [Google Scholar] [CrossRef]
  14. Rabe, B.G.; Mills, S.B. State energy policy in the Trump Era: Insights from public opinion. J. Environ. Stud. Sci. 2017, 7, 535–539. [Google Scholar] [CrossRef]
  15. Hess, D.J.; Mai, Q.D.; Brown, K.P. Red states, green laws: Ideology and renewable energy legislation in the United States. Energy Res. Soc. Sci. 2016, 11, 19–28. [Google Scholar] [CrossRef] [Green Version]
  16. Marlon, J.; Howe, P.; Mildenberger, M.; Leiserowitz, A.; Wang, X. Yale Climate Opinion Maps 2019; Yale Program on Climate Change Communication; Yale University: New Haven, CT, USA, 2019. [Google Scholar]
  17. Mildenberger, M.; Howe, P. Canadian Climate Opinion Maps 2018; Yale Program on Climate Change Communication; Yale University: New Haven, CT, USA, 2019. [Google Scholar]
  18. United Nations Environment Programme. Emissions Gap Report 2018; United Nations Environment Programme: Nairobi, Kenya, 2018. [Google Scholar]
  19. Forster, P.M.; Maycock, A.C.; McKenna, C.M.; Smith, C.J. Latest climate models confirm need for urgent mitigation. Nat. Clim. Chang. 2020, 10, 7–10. [Google Scholar] [CrossRef]
  20. Peters, G.P.; Andrew, R.M.; Canadell, J.G.; Friedlingstein, P.; Jackson, R.B.; Korsbakken, J.I.; Le Quéré, C.; Peregon, A. Carbon dioxide emissions continue to grow amidst slowly emerging climate policies. Nat. Clim. Chang. 2020, 10, 3–6. [Google Scholar] [CrossRef]
  21. U.S. Energy Information Administration. For one week in November, the U.S. was a net exporter of crude oil and petroleum products. Available online: https://www.eia.gov/todayinenergy/detail.php?id=37772 (accessed on 24 March 2019).
  22. U.S. Energy Information Administration. U.S. liquefied natural gas export capacity to more than double by the end of 2019. Available online: https://www.eia.gov/todayinenergy/detail.php?id=37732 (accessed on 24 March 2019).
  23. U.S. Energy Information Administration. Annual Energy Outlook 2019 with Projections to 2050; United States Energy Information Administration: Washington, DC, USA, 2019; p. 83.
  24. Burney, J.A. The downstream air pollution impacts of the transition from coal to natural gas in the United States. Nat. Sustain. 2020, 3, 152–160. [Google Scholar] [CrossRef]
  25. Storrow, B. And Now the Really Big Coal Plants Begin to Close-Scientific American. E E News, 16 August 2019. [Google Scholar]
  26. Government of Canada Canada’s coal power phase-out reaches another milestone. Available online: https://www.canada.ca/en/environment-climate-change/news/2018/12/canadas-coal-power-phase-out-reaches-another-milestone.html (accessed on 11 January 2020).
  27. Natural Resources Canada Electricity facts, generation by source. Available online: https://www.nrcan.gc.ca/science-data/data-analysis/energy-data-analysis/energy-facts/electricity-facts/20068 (accessed on 16 January 2020).
  28. National Energy Board. NEB-Market Snapshot: Canada’s power generation: Switching from coal to natural gas. Available online: https://www.cer-rec.gc.ca/nrg/ntgrtd/mrkt/snpsht/2017/04-02cndpwrgnrtn-eng.html (accessed on 11 January 2020).
  29. American Wind Energy Association. Wind Energy Facts at a Glance. Available online: https://www.awea.org/wind-101/basics-of-wind-energy/wind-facts-at-a-glance (accessed on 16 January 2020).
  30. U.S. Energy Information Administration. What is U.S. electricity generation by energy source? Available online: https://www.eia.gov/tools/faqs/faq.php?id=427&t=3 (accessed on 11 January 2020).
  31. U.S. Energy Information Administration. Washington-State Energy Profile Overview. Available online: https://www.eia.gov/state/?sid=WA#tabs-4 (accessed on 17 January 2020).
  32. National Energy Board. NEB-Canada’s Renewable Power Landscape 2016-Energy Market Analysis: British Columbia. Available online: https://www.cer-rec.gc.ca/nrg/sttstc/lctrct/rprt/2016cndrnwblpwr/prvnc/bc-eng.html (accessed on 17 January 2020).
  33. Blumm, M.C.; Fry, J.L.; Jamin, O. Still crying out for a “major overhaul” after all these years-salmon and another failed biological opinion on Columbia Basin hydroelectric operations. Environ. Law 2017, 47, 287–333. [Google Scholar]
  34. Oregon Expands Opportunities for Small Hydropower. Available online: https://www.renewableenergyworld.com/2015/08/25/oregon-expands-opportunities-for-small-hydropower/ (accessed on 31 January 2020).
  35. Morgan, M.G.; Abdulla, A.; Ford, M.J.; Rath, M. US nuclear power: The vanishing low-carbon wedge. PNAS 2018, 115, 7184–7189. [Google Scholar] [CrossRef] [Green Version]
  36. Inc, G. 40 Years After Three Mile Island, Americans Split on Nuclear Power. Available online: https://news.gallup.com/poll/248048/years-three-mile-island-americans-split-nuclear-power.aspx (accessed on 16 January 2020).
  37. Ramana, M.V. Technical and social problems of nuclear waste. WIREs Energy Environ. 2018, 7, e289. [Google Scholar] [CrossRef]
  38. Malin, S.A. The Price of Nuclear Power: Uranium Communities and Environmental Justice; Rutgers University Press: New Brunswick, NJ, USA, 2015; ISBN 978-0-8135-6980-2. [Google Scholar]
  39. Nisbet, M.C.; Myers, T. The Polls—TrendsTwenty Years of Public Opinion about Global Warming. Public Opin Q. 2007, 71, 444–470. [Google Scholar] [CrossRef]
  40. Clarke, C.E.; Bugden, D.; Hart, P.S.; Stedman, R.C.; Jacquet, J.B.; Evensen, D.T.N.; Boudet, H.S. How geographic distance and political ideology interact to influence public perception of unconventional oil/natural gas development. Energy Policy 2016, 97, 301–309. [Google Scholar] [CrossRef]
  41. Rapier, R. Natural Gas is already a Bridge Fuel. Forbes, 2 September 2018. [Google Scholar]
  42. Delborne, J.A.; Hasala, D.; Wigner, A.; Kinchy, A. Dueling metaphors, fueling futures: “Bridge fuel” visions of coal and natural gas in the United States. Energy Res. Soc. Sci. 2020, 61, 101350. [Google Scholar] [CrossRef]
  43. Davis, C.; Fisk, J.M. Energy Abundance or Environmental Worries? Analyzing Public Support for Fracking in the United States. Rev. Policy Res. 2014, 31, 1–16. [Google Scholar] [CrossRef]
  44. Devine-Wright, P. Rethinking NIMBYism: The role of place attachment and place identity in explaining place-protective action. J. Community Appl. Soc. Psychol. 2009, 19, 426–441. [Google Scholar] [CrossRef]
  45. Olson-Hazboun, S.K.; Krannich, R.S.; Robertson, P.G. Public views on renewable energy in the Rocky Mountain region of the United States: Distinct attitudes, exposure, and other key predictors of wind energy. Energy Res. Soc. Sci. 2016, 21, 167–179. [Google Scholar] [CrossRef] [Green Version]
  46. Carlisle, J.E.; Solan, D.; Kane, S.L.; Joe, J. Utility-scale solar and public attitudes toward siting: A critical examination of proximity. Land Use Policy 2016, 58, 491–501. [Google Scholar] [CrossRef]
  47. Jacquet, J.B. Landowner attitudes toward natural gas and wind farm development in northern Pennsylvania. Energy Policy 2012, 50, 677–688. [Google Scholar] [CrossRef]
  48. Giordono, L.S.; Boudet, H.S.; Karmazina, A.; Taylor, C.L.; Steel, B.S. Opposition “overblown”? Community response to wind energy siting in the Western United States. Energy Res. Soc. Sci. 2018, 43, 119–131. [Google Scholar] [CrossRef]
  49. Bell, D.; Gray, T.; Haggett, C. The ‘Social Gap’ in Wind Farm Siting Decisions: Explanations and Policy Responses. Environ. Politics 2005, 14, 460–477. [Google Scholar] [CrossRef]
  50. Olson-Hazboun, S.K. “Why are we being punished and they are being rewarded?” views on renewable energy in fossil fuels-based communities of the U.S. west. Extr. Ind. Soc. 2018, 5, 366–374. [Google Scholar] [CrossRef]
  51. Firestone, J.; Kirk, H. A strong relative preference for wind turbines in the United States among those who live near them. Nat. Energy 2019, 4, 311–320. [Google Scholar] [CrossRef]
  52. Jacquet, J.B.; Fergen, J.T. The Vertical Patterns of Wind Energy: The Effects of Wind Farm Ownership on Rural Communities in the Prairie Pothole Region of the United States. J. Rural Community Dev. 2018, 13(2), 130–148. [Google Scholar]
  53. Boudet, H.S. Public perceptions of and responses to new energy technologies. Nat. Energy 2019, 4, 446–455. [Google Scholar] [CrossRef]
  54. Gravelle, T.B.; Lachapelle, E. Politics, proximity and the pipeline: Mapping public attitudes toward Keystone XL. Energy Policy 2015, 83, 99–108. [Google Scholar] [CrossRef]
  55. Pierce, J.J.; Boudet, H.; Zanocco, C.; Hillyard, M. Analyzing the factors that influence U.S. public support for exporting natural gas. Energy Policy 2018, 120, 666–674. [Google Scholar] [CrossRef]
  56. Malin, S.A.; Mayer, A.; Shreeve, K.; Olson-Hazboun, S.K.; Adgate, J. Free market ideology and deregulation in Colorado’s oil fields: Evidence for triple movement activism? Environ. Politics 2017, 26, 521–545. [Google Scholar] [CrossRef] [PubMed]
  57. Mayer, A.; Malin, S. How should unconventional oil and gas be regulated? The role of natural resource dependence and economic insecurity. J. Rural Stud. 2018, 65, 79–89. [Google Scholar] [CrossRef]
  58. Tosun, J.; Mišić, M. Conferring authority in the European Union: Citizens’ policy priorities for the European Energy Union. J. Eur. Integr. 2020, 42, 19–38. [Google Scholar] [CrossRef]
  59. O’Connor, C.D.; Fredericks, K. Citizen perceptions of fracking: The risks and opportunities of natural gas development in Canada. Energy Res. Soc. Sci. 2018, 42, 61–69. [Google Scholar] [CrossRef]
  60. Ballew, M.T.; Leiserowitz, A.; Roser-Renouf, C.; Rosenthal, S.A.; Kotcher, J.E.; Marlon, J.R.; Lyon, E.; Goldberg, M.H.; Maibach, E.W. Climate Change in the American Mind: Data, Tools, and Trends. Environ. Sci. Policy Sustain. Dev. 2019, 61, 4–18. [Google Scholar] [CrossRef]
  61. McCright, A.M.; Dunlap, R.E. The Politicization of Climate Change and Polarization in the American Public’s Views of Global Warming, 2001–2010. Sociol. Q. 2011, 52, 155–194. [Google Scholar] [CrossRef]
  62. Dunlap, R.E.; McCright, A.M.; Yarosh, J.H. The Political Divide on Climate Change: Partisan Polarization Widens in the U.S. Environ. Sci. Policy Sustain. Dev. 2016, 58, 4–23. [Google Scholar] [CrossRef]
  63. Dunlap, R.E.; McCright, A.M. Organized climate change denial. In The Oxford Handbook of Climate Change and Society; Dryzek, J.S., Norgaard, R.B., Schlosberg, D., Eds.; Oxford University Press: Oxford, UK, 2011; pp. 144–160. ISBN 978-0-19-956660-0. [Google Scholar]
  64. Dunlap, R.E.; Mccright, A.M. Climate change denial: Sources, actors and strategies. In Routledge Handbook of Climate Change and Society; Lever-Tracy, C., Ed.; Routledge: Abingdon-on-Thames, UK, 2010; pp. 270–290. [Google Scholar]
  65. Dunlap, R.E.; Jacques, P.J. Climate Change Denial Books and Conservative Think Tanks: Exploring the Connection. Am. Behav. Sci. 2013, 57, 699–731. [Google Scholar] [CrossRef] [PubMed] [Green Version]
  66. Farrell, J. Corporate funding and ideological polarization about climate change. PNAS 2016, 113, 92–97. [Google Scholar] [CrossRef] [PubMed] [Green Version]
  67. Farrell, J. Network structure and influence of the climate change counter-movement. Nat. Clim. Chang. 2016, 6, 370–374. [Google Scholar] [CrossRef]
  68. Brulle, R.J. Institutionalizing delay: Foundation funding and the creation of U.S. climate change counter-movement organizations. Clim. Chang. 2014, 122, 681–694. [Google Scholar] [CrossRef]
  69. Lachapelle, E.; Borick, C.P.; Rabe, B. Public Attitudes toward Climate Science and Climate Policy in Federal Systems: Canada and the United States Compared1. Rev. Policy Res. 2012, 29, 334–357. [Google Scholar] [CrossRef] [Green Version]
  70. Clarke, C.E.; Budgen, D.; Evensen, D.T.N.; Stedman, R.C.; Boudet, H.S.; Jacquet, J.B. Communicating About Climate Change, Natural Gas Development, and “Fracking”: U.S. and International Perspectives. Available online: https://oxfordre.com/climatescience/view/10.1093/acrefore/9780190228620.001.0001/acrefore-9780190228620-e-443 (accessed on 11 January 2020).
  71. Hamilton, L.C.; Bell, E.; Hartter, J.; Salerno, J.D. A change in the wind? US public views on renewable energy and climate compared. Energy Sustain. Soc. 2018, 8, 11. [Google Scholar] [CrossRef]
  72. Olson-Hazboun, S.K.; Howe, P.D.; Leiserowitz, A. The influence of extractive activities on public support for renewable energy policy. Energy Policy 2018, 123, 117–126. [Google Scholar] [CrossRef]
  73. Mukherjee, D.; Rahman, M.A. To drill or not to drill? An econometric analysis of US public opinion. Energy Policy 2016, 91, 341–351. [Google Scholar] [CrossRef]
  74. Steel, B.S.; Pierce, J.C.; Warner, R.L.; Lovrich, N.P. Environmental Value Considerations in Public Attitudes About Alternative Energy Development in Oregon and Washington. Environ. Manag. 2015, 55, 634–645. [Google Scholar] [CrossRef]
  75. Hazboun, S.O.; Briscoe, M.; Givens, J.; Krannich, R. Keep quiet on climate: Assessing public response to seven renewable energy frames in the Western United States. Energy Res. Soc. Sci. 2019, 57, 101243. [Google Scholar] [CrossRef]
  76. Feldman, L.; Hart, P.S. Climate change as a polarizing cue: Framing effects on public support for low-carbon energy policies. Glob. Environ. Chang. 2018, 51, 54–66. [Google Scholar] [CrossRef]
  77. Hart, P.S.; Feldman, L. Would it be better to not talk about climate change? The impact of climate change and air pollution frames on support for regulating power plant emissions. J. Environ. Psychol. 2018, 60, 1–8. [Google Scholar] [CrossRef]
  78. Walker, C.; Stephenson, L.; Baxter, J. His main platform is stop the turbines: Political discourse, partisanship and local responses to wind energy in Canada. Energy Policy 2018, 123, 670–681. [Google Scholar] [CrossRef]
  79. Jepson, W.; Brannstrom, C.; Persons, N. “We Don’t Take the Pledge”: Environmentality and environmental skepticism at the epicenter of US wind energy development. Geoforum 2012, 43, 851–863. [Google Scholar] [CrossRef]
  80. Hess, D.J.; Brown, K.P. Green tea: Clean-energy conservatism as a countermovement. Environ. Sociol. 2017, 3, 64–75. [Google Scholar] [CrossRef] [Green Version]
  81. Fergen, J.; Jacquet, J.B. Beauty in motion: Expectations, attitudes, and values of wind energy development in the rural U.S. Energy Res. Soc. Sci. 2016, 11, 133–141. [Google Scholar] [CrossRef]
  82. Warren, C.R.; Lumsden, C.; O’Dowd, S.; Birnie, R.V. ‘Green On Green’: Public perceptions of wind power in Scotland and Ireland. J. Environ. Plan. Manag. 2005, 48, 853–875. [Google Scholar] [CrossRef]
  83. Kimmell, K.; Stalenhoef, D.S. The Cape Wind Offshore Wind Energy Project: A Case Study of the Difficult Transition to Renewable Energy Offshore Energy Projects: New Priorities in the Wake of the BP Gulf Disaster. Gold. Gate U. Envtl. L.J. 2011, 5, 197–226. [Google Scholar]
  84. Xiao, C.; McCright, A.M. Explaining Gender Differences in Concern about Environmental Problems in the United States. Soc. Nat. Resour. 2012, 25, 1067–1084. [Google Scholar] [CrossRef]
  85. Howell, E.L.; Li, N.; Akin, H.; Scheufele, D.A.; Xenos, M.A.; Brossard, D. How do U.S. state residents form opinions about ‘fracking’ in social contexts? A multilevel analysis. Energy Policy 2017, 106, 345–355. [Google Scholar] [CrossRef] [Green Version]
  86. Larson, E.C.; Krannich, R.S. “A Great Idea, Just Not Near Me!” Understanding Public Attitudes About Renewable Energy Facilities. Soc. Nat. Resour. 2016, 29, 1436–1451. [Google Scholar] [CrossRef]
  87. Boudet, H.; Bugden, D.; Zanocco, C.; Maibach, E. The effect of industry activities on public support for ‘fracking. ’ Environ. Politics 2016, 25, 593–612. [Google Scholar] [CrossRef]
  88. Bell, S.E.; York, R. Community Economic Identity: The Coal Industry and Ideology Construction in West Virginia: Community Economic Identity. Rural Sociol. 2010, 75, 111–143. [Google Scholar] [CrossRef]
  89. Mayer, A. National energy transition, local partisanship? Elite cues, community identity, and support for clean power in the United States. Energy Res. Soc. Sci. 2019, 50, 143–150. [Google Scholar] [CrossRef]
  90. Evans, G.; Phelan, L. Transition to a post-carbon society: Linking environmental justice and just transition discourses. Energy Policy 2016, 99, 329–339. [Google Scholar] [CrossRef]
  91. Bell, S.E. Fighting King Coal: The Challenges to Micromobilization in Central Appalachia; MIT Press: Cambridge, MA, USA, 2016; ISBN 978-0-262-03434-0. [Google Scholar]
  92. Boudet, H.S.; Zanocco, C.M.; Howe, P.D.; Clarke, C.E. The Effect of Geographic Proximity to Unconventional Oil and Gas Development on Public Support for Hydraulic Fracturing. Risk Anal. 2018, 38, 1871–1890. [Google Scholar] [CrossRef]
  93. Goldfarb, J.L.; Buessing, M.; Kriner, D.L. Geographic proximity to coal plants and U.S. public support for extending the Production Tax Credit. Energy Policy 2016, 99, 299–307. [Google Scholar] [CrossRef]
  94. Swofford, J.; Slattery, M. Public attitudes of wind energy in Texas: Local communities in close proximity to wind farms and their effect on decision-making. Energy Policy 2010, 38, 2508–2519. [Google Scholar] [CrossRef]
  95. Zanocco, C.; Boudet, H.; Clarke, C.E.; Howe, P.D. Spatial Discontinuities in Support for Hydraulic Fracturing: Searching for a “Goldilocks Zone”. Soc. Nat. Resour. 2019, 32, 1065–1072. [Google Scholar] [CrossRef]
  96. Evensen, D.; Stedman, R. ‘Fracking’: Promoter and destroyer of ‘the good life’. J. Rural Stud. 2018, 59, 142–152. [Google Scholar] [CrossRef]
  97. Freudenburg, W.R. Rural-Urban Differences in Environmental Concern: A Closer Look*. Sociol. Inq. 1991, 61, 167–198. [Google Scholar] [CrossRef]
  98. Haggerty, J.H.; Kroepsch, A.C.; Walsh, K.B.; Smith, K.K.; Bowen, D.W. Geographies of Impact and the Impacts of Geography: Unconventional Oil and Gas in the American West. Extr. Ind. Soc. 2018, 5, 619–633. [Google Scholar] [CrossRef]
  99. Gray, D.; Bernell, D. Tree-hugging utilities? The politics of phasing out coal and the unusual alliance that passed Oregon’s clean energy transition law. Energy Res. Soc. Sci. 2020, 59, 101288. [Google Scholar] [CrossRef]
  100. Inslee, J. Energy & Environment | Governor Jay Inslee. Available online: https://www.governor.wa.gov/issues/issues/energy-environment (accessed on 17 January 2020).
  101. BC Ministry of Energy and Mines Renewable Energy - Province of British Columbia. Available online: https://www2.gov.bc.ca/gov/content/industry/electricity-alternative-energy/renewable-energy (accessed on 17 January 2020).
  102. U.S. Energy Information Administration (EIA) Oregon-State Energy Profile Analysis. Available online: https://www.eia.gov/state/analysis.php?sid=OR (accessed on 17 January 2020).
  103. Natural Resources Canada Electricity Facts. Available online: https://www.nrcan.gc.ca/science-data/data-analysis/energy-data-analysis/energy-facts/electricity-facts/20068#L1 (accessed on 27 February 2020).
  104. U.S. Energy Information Administration. U.S. Number and Capacity of Petroleum Refineries. Available online: https://www.eia.gov/dnav/pet/pet_pnp_cap1_dcu_nus_a.htm (accessed on 24 July 2019).
  105. U.S. Energy Information Administration (EIA). International and Interstate Movements of Natural Gas by State, Oregon, 2018. Available online: https://www.eia.gov/dnav/ng/NG_MOVE_IST_A2DCU_SOR_A.htm (accessed on 17 January 2020).
  106. Sightline Institute The Thin Green Line. Available online: https://www.sightline.org/research/thin-green-line/ (accessed on 24 March 2019).
  107. Tran, T.; Taylor, C.L.; Boudet, H.S.; Baker, K.; Peterson, H.L. Using Concepts from the Study of Social Movements to Understand Community Response to Liquefied Natural Gas Development in Clatsop County, Oregon. Case Stud. Environ. 2019, 1–7. [Google Scholar] [CrossRef]
  108. Boudet, H.S.; Trang, T.; Gaustad, B. The long shadow of unconventional hydrocarbon development: Contentious politics in liquefied natural gas (LNG) facility siting in Oregon. In Fractured Communities: Risks, Impact, and Protest Against Hydraulic Fracking in U.S. Shale Regions. E; Ladd, A.E., Ed.; Rutgers University Press: New Brunswick, NJ, USA, 2018. [Google Scholar]
  109. Ministry of Energy and Mines Overview of coal in BC-Province of British Columbia. Available online: https://www2.gov.bc.ca/gov/content/industry/mineral-exploration-mining/british-columbia-geological-survey/geology/coal-overview (accessed on 17 January 2020).
  110. National Energy Board, Government of Canada NEB-Provincial and Territorial Energy Profiles-British Columbia. Available online: https://www.cer-rec.gc.ca/nrg/ntgrtd/mrkt/nrgsstmprfls/bc-eng.html (accessed on 17 January 2020).
  111. Scruggs, G. FEATURE-On the road to zero carbon, Portland pinches off fossil fuels. Reuters, 3 October 2018. [Google Scholar]
  112. Hazboun, S.O. A left coast ‘thin green line’? Determinants of public attitudes toward fossil fuel export in the Northwestern United States. Extr. Ind. Soc. 2019, 6, 1340–1349. [Google Scholar] [CrossRef]
  113. Denissen, J.J.A.; Neumann, L.; van Zalk, M. How the internet is changing the implementation of traditional research methods, people’s daily lives, and the way in which developmental scientists conduct research. Int. J. Behav. Dev. 2010, 34, 564–575. [Google Scholar] [CrossRef]
  114. Campbell, R.M.; Venn, T.J.; Anderson, N.M. Cost and performance tradeoffs between mail and internet survey modes in a nonmarket valuation study. J. Environ. Manag. 2018, 210, 316–327. [Google Scholar] [CrossRef]
  115. Groves, R.M. Nonresponse Rates and Nonresponse Bias in Household Surveys. Public Opin Q. 2006, 70, 646–675. [Google Scholar] [CrossRef]
  116. Stedman, R.C.; Connelly, N.A.; Heberlein, T.A.; Decker, D.J.; Allred, S.B. The End of the (Research) World As We Know It? Understanding and Coping With Declining Response Rates to Mail Surveys. Soc. Nat. Resour. 2019, 32(10), 1139–1154. [Google Scholar] [CrossRef]
  117. Pew Research Center. Evaluating Online Nonprobability Surveys. Available online: https://www.pewresearch.org/methods/2016/05/02/evaluating-online-nonprobability-surveys/ (accessed on 17 January 2020).
  118. Garson, G.D. Multilevel Modeling: Applications in STATA®, IBM® SPSS®, SAS®, R, & HLMTM, 1st ed.; SAGE Publications, Inc.: Los Angeles, LA, USA, 2019; ISBN 978-1-5443-1929-2. [Google Scholar]
  119. Zanocco, C.; Boudet, H.; Nilson, R.; Satein, H.; Whitley, H.; Flora, J. Place, proximity, and perceived harm: Extreme weather events and views about climate change. Clim. Chang. 2018, 149, 349–365. [Google Scholar] [CrossRef]
  120. Howe, P.D.; Mildenberger, M.; Marlon, J.R.; Leiserowitz, A. Geographic variation in opinions on climate change at state and local scales in the USA. Nat. Clim. Chang. 2015, 5, 596–603. [Google Scholar] [CrossRef] [Green Version]
  121. Mildenberger, M.; Marlon, J.R.; Howe, P.D.; Leiserowitz, A. The spatial distribution of Republican and Democratic climate opinions at state and local scales. Clim. Chang. 2017, 145, 539–548. [Google Scholar] [CrossRef]
  122. Hamilton, L.C.; Keim, B.D. Regional variation in perceptions about climate change. Int. J. Climatol. 2009, 29, 2348–2352. [Google Scholar] [CrossRef] [Green Version]
  123. Hamilton, L.C.; Colocousis, C.R.; Duncan, C.M. Place Effects on Environmental Views. Rural Sociol. 2010, 75, 326–347. [Google Scholar] [CrossRef]
  124. Bowden, J. Trump rails against windmills: “I never understood wind”. The Hill, 22 December 2019. [Google Scholar]
  125. McCright, A.M.; Xiao, C.; Dunlap, R.E. Political polarization on support for government spending on environmental protection in the USA, 1974–2012. Soc. Sci. Res. 2014, 48, 251–260. [Google Scholar] [CrossRef] [PubMed]
  126. Hausfather, Z. Is natural gas a bridge fuel? Available online: https://www.yaleclimateconnections.org/2016/08/is-natural-gas-a-bridge-fuel (accessed on 24 March 2020).
Figure 1. Electricity production by source in British Columbia (BC), Oregon (OR), and Washington (WA), 2019 [31,102,103].
Energies 13 01940 g001
Figure 2. Respondent preferences for eight energy sources, ordered from the least to most preferred (n = 1500). * Indicates significant state/province differences in support (p < 0.001). Respondents in BC were more opposed to coal and nuclear than those in OR and WA. Respondents in OR were more opposed to hydropower than those in WA and BC.
Energies 13 01940 g002
Figure 3. Predicted margins plots for support for eight energy sources by political ideology, with 95% confidence intervals. Predictive margins plots hold all other variables in regression models constant. (* denotes that ideology was a statistically significant predictor variable in the regression model).
Energies 13 01940 g003
Table 1. Descriptive statistics for independent variables (n = 1500).
VariableQuestion / Response CategoriesFrequency (n) or Mean (sd)
MaleAre you male or female? (1) Male; (0) Female 42.2% (633) Male
AgeIn what year were you born? (Subtracted from survey year, 2019). Range = 18 to 9453.4 (16.2)
RaceWhat racial or ethnic group best describes you? (1) White; (2) Black; (3) Hispanic/Latino; (4) Asian; (5) Native American; (6) Mixed; (7) Other84.5% (1267) White, non-Hispanic
EducationWhat is the highest level of education you have completed? (1) 4-year college degree [bachelors]; (0) Less than 4-year college degree40.1% (602) Bachelors
MetroRespondents’ county classified as metro or nonmetro50% (750) Metro
Ideology In general, how would you describe your own political viewpoint? (1) Very liberal; (2) Liberal; (3) Moderate; (4) Conservative; (5) Very conservative. Variable collapsed to (0) Not Conservative; (1) ConservativeOriginal coding: 2.7 (1.2); Collapsed variable: 74.6% (1119) Not Conservative, 25.4% (381) Conservative
Environmental priorityWith which one of these statements do you most agree? (1) Protection of the environment should be given priority, even at the risk of curbing economic growth; (0) Economic growth should be given priority even if the environment suffers to some extent.72.5% (1087) Environment
Anthropogenic warmingAssuming global warming is happening, do you think it is: (1) Caused mostly by human activities; (0) Not caused mostly by human activities51.7% (775) Human activities
Community economic identity: MiningNow, we’d like to ask you some questions about your local economy. Please indicate if [Mining, refining, and utilities] is (1) not important at all; (2) a little important; (3) moderately important; (4) or very important to your area.30.8% (463) Not at all important; 38.3% (575) A little important; 19.8% (297) Moderately important; 11% (165) Very important
Community economic identity: RenewablesNow, we’d like to ask you some questions about your local economy. Please indicate if [Renewable energy production, like wind, solar, or hydroelectric] is (1) not important at all; (2) a little important; (3) moderately important; (4) or very important to your area.14.4% (216) Not at all important; 32.7% (490) A little important; 27.3% (410) Moderately important; 25.6% (384) Very important
Table 2. Weighted ordered logistic multilevel regression models predicting support for the eight energy sources.
VariableCoalGasNuclearHydroWindSolarWaveGeo
Male0.6451.735 ***3.140 ***1.1370.7270.8861.997 ***2.191 ***
Age0.9951.0220.990 ***0.9931.0060.9951.0021.009 **
White0.9080.7841.110 *0.7281.2772.633 ***1.4601.201
Bachelors0.479 **0.787 ***1.2600.812 ***2.668 ***2.368 ***1.6521.771 *
Metro 1.7210.8152.040 ***0.9951.3720.9890.7420.767 *
Conservative3.405 ***1.9892.083 ***1.2450.278 **0.4100.7110.897
Environmental priority0.2330.337 ***0.422 **0.580 ***3.851 ***2.528 **1.714 **1.078
Anthropogenic warming0.332 ***0.449 *0.700 **0.754 *3.090 ***5.615 ***2.074 **1.391
Mining1.428 *1.201 ***0.9160.9150.695 **0.617 **0.674 ***0.766 ***
Renewables0.9681.0380.8811.190 **1.2791.629 ***1.419 *1.206 ***
Model characteristics
n (level 1, individuals)14971496149614971496149714951493
n (level 2, county/district)105105105105105105105105
n (level 3, state/province)33333333
Level 2 variance (county/districts)0.3880.4790.6220.9391.8391.1032.0310.191
Level 3 variance (states)0.0000.0000.0000.1200.0000.0000.0000.000
AIC1605275928212894144199217202281
BIC16162775283229051457100317352297
Odds ratios reported. * p < 0.05; ** p < 0.01; *** p < 0.001.

