1. Introduction
Transformation-Induced Plasticity (TRIP) steel magnesium-partially stabilized zirconia (Mg-PSZ) composites are of great interest for various applications due to their high energy absorbing capacity, which they owe to transformation in present phases during deformation. The metastable austenitic phase in these materials transforms into martensite under applied strain, and the Mg-PSZ particles transform into a monoclinic phase from the tetragonal phase under applied stress [
1,
2,
3,
4]. This transformation in the material into more compact and harder phases during deformation strengthens the material by increased hardening while allowing the material to deform under applied external load [
5,
6].
Researchers in the past have worked extensively on the experimental investigation and understanding of the transformation phenomena in low and medium alloy steels. Due to low alloying, the Stacking Fault Energy (SFE) of the stabilized austenitic phase in such steels is low at room temperature, i.e., in the range of 10–12 mJ/m
2 [
7]. When these materials with low SFEs are deformed at room temperature, the stabilized Face Centered Cubic (FCC) austenitic phase transforms into the Body-Centered Cubic (BCC) ά-martensitic phase through the highly deformed Hexagonal Closest Packed (HCP) ε-martensitic phase [
8,
9]. Based on the experimental investigations, researchers have reported properties of the cast X8CrMnNi16-6-6 steel stacking faults [
10], the martensitic lath thickness [
11], the transformation behavior of the material [
12], the nano hardness measurement of different phases [
13], the evolution of the hardening coefficient of the material, and critical strains for transformation [
9,
14,
15].
On the one hand, this transformation of the soft phase into harder phases during deformation is of interest for high-end applications. On the other hand, its dependence on many chemical and physical material parameters adds complexity to developing a complete understanding of the phenomena. It hence restricts the material scientists from obtaining full control over material engineering during manufacturing [
16,
17,
18,
19,
20,
21,
22,
23,
24]. Many factors affect the formability of these materials; some of the major ones are the composition of the composite, grain size, orientation distribution, the employed manufacturing technique, working temperatures, the rate of deformation degree, and the strain rate adopted during deformation [
25,
26,
27,
28,
29,
30].
Researchers [
31] in an earlier in-situ tensile deformation analysis of X5CrNi18.10 and 5% Mg-PSZ composites showed that the zirconia particles are loosely attached to the matrix. During deformation, the interface decohesion occurs at as low as 1.6% of the total strain with eventual cracking of some particles at around 6% of the total stain. Other researchers [
9,
32] analyzed the behavior of X5CrMnNi15-6-6 and 5 vol. % Mg-PSZ composites under compressive load. The EBSD and X-Ray Diffraction (XRD) analysis of the tested samples at different compressive strains showed that the martensitic transformation within the TRIP steel is mainly responsible for the shape of the flow curve and higher plasticity, and they explained that martensite formation in the TRIP steel majorly occurs near the poles of embedded zirconia particles. The interdependence and complete understanding of these parameters are still not entirely understood, therefore, until now, the only reliable way to investigate the mechanical and structural properties of these components is through extensive experimentation, which is an expensive and slow path.
2. Micro-Mechanical Modeling
The development of an accurate numerical model incorporated with physical-based microstructural attributes can be beneficial [
27,
28,
29,
30]. Such a model can be used to understand the structure-property relationship of the material better. An open-source, crystal plasticity-based simulation framework, Düsseldorf Advanced Material Simulation Kit (DAMASK), was developed by the Max Planck Institute for Iron Research (MPIE) [
33]. The usage of the Fast Fourier Transform (FFT) approach for modeling and the prediction of micromechanical fields in polycrystalline materials was proposed [
34], and the DAMASK framework was extended to solve elastic–viscoplastic dislocation-based boundary value problems using the spectral solver in combination with various constitutive models [
35]. The spectral methods were developed further to predict the micro-mechanical behavior of plastically deforming heterogeneous materials [
36], i.e., multi-phase steels and composites.
A constitutive, physically based material model to capture the Transformation Induced Plasticity and Twinning Induced Plasticity (TRIP/TWIP) effect in high manganese steels at different temperatures was developed by Wong et al. [
37]. The model was incorporated in already developed crystal plasticity-based numerical simulation tool DAMASK. The SFE of high Manganese steels at room temperature is higher than 20 mJ/m
2 at room temperature. Therefore, they exhibit TRIP/TWIP phenomena, and with increasing temperature, the SFE increases more than 45 mJ/m
2, which results in dislocation glide only. The model was further developed by Madivala, and he showed the model to be working in the range of SFE 13−118 mJ/m
2 [
38]. The challenge is that the proposed model comprises of ~50 physical-based and fitting parameters. Although the coefficient values for the high manganese TRIP/TWIP steel model have been proposed and validated with experimental results, the identification and calibration of the fitting parameters for other materials of the same class is a challenge.
It is essential to identify the occurrence of each deformation and transformation phenomena independently for better understand and tuning of the material model. Recently, researchers showed the use of different characterization techniques for collecting and validating such data for X8CrMnNi16-6-6 cast TRIP steel [
12]. In the list of proposed methods, Acoustic Emission analysis (AE-analysis) of such materials is a viable technique for the in-situ measurement of twining, transformation, and dislocation glide data. These different microstructural deformation mechanisms were independently analyzed and compared with experimental observations [
39].
In this research, a small size benchmark Representative Volume Element (RVE) of 10 × 10 × 10 units containing 1000 elements having randomly assigned orientations were used for the parametric calibration of steel and composite. This technique was recently established [
40]. The identification of the TRIP/TWIP material model was carried out by matching simulation results with experimental observations. The flow curves, hardening coefficient, and martensitic transformation in the material observed from DAMASK numerical simulations were compared. Strain evolution from different phenomena is compared with AE cluster data previously published [
39].
The difference in the mechanical properties of martensite and austenite is substantial [
13]; therefore, in current research, martensite is considered as an elastic phase without differentiating ά-martensite and ε-martensite. The evolution of both phases is studied without differentiation, which makes it impossible to analyze the volume change of the individual phase. This assumption makes it easier to use the already developed TRIP/TWIP material model and tune the model parameters for low SFE and ΔG to match the numerical simulation results with experimental observations. The tuned material model is further used to run simulations for actual EBSD data of X8CrMnNi16-6-6 TRIP steel to analyze the evolution of local stresses, strains, and transformation in the microstructure qualitatively.
It has been pointed out by previous researchers that the mechanical properties of the Metal Matrix Composite (MMC) reinforced with Mg-PSZ are mainly controlled by the deformation of the matrix material, and zirconia particles undergo significantly less strain [
9]. Therefore, the zirconia particles in the current simulation models were assumed to be elastic and non-transformative to reduce the complexity of the model and bring down the computation time. The tuned material model for steel with slight modification was adopted for the simulation modeling of 10% composite. Full phase simulations with 2D EBSD data of MMC composite are run for applied tensile load in the horizontal direction to analyze the evolution of stress/strain partitioning, martensitic transformation, and dislocation density to better understand the interplay of these attributes at the local scale.
Details of material data, sample preparation, and testing to obtain experimental stress-strain (σ–ε) and transformation data are provided in
Section 3 and
Section 4.
Section 5 deals with the methodology, details of the numerical simulation model, and parametric identification method.
Section 6 presents the results of the study in comparison with experimental observations. It also contains full phase simulation results from 2D EBSD data. In
Section 7, results are discussed in comparison with state of the art, and insight into the outlook is provided. The study is concluded in
Section 8.
4. Experimentation
For tensile testing, flat samples with a total length of 50mm, a gauge length of 12 mm, and a cross-section of 5 × 2.5 mm² were manufactured. The samples were taken from the center area of the cast plate with the orientation perpendicular to the top surface. The samples were ground from both sides up to 250µm and polished to a final grade of 1µm before tensile testing. The macro tensile test was carried out on a screw-driven loading device at room temperature and a strain rate of 1 × 10⁻³ s−1.
To determine the volume fraction of deformation-induced martensite, the samples were analyzed using the technique of measuring the ferromagnetic phase fraction with a Ferritscope. Then, the volume fraction of martensite was calculated by multiplying the Fe% by the factor of 1.7 and by using the calibrated initial value. Details of the sample mentioned above preparation and characterization techniques are published in detail elsewhere [
12].
Acoustic emission data for the same material was measured and published earlier [
39]. Therefore, the data is being adopted to calibrate the numerical model and for validating the trends observed in the numerical simulation results. A differential wideband AE sensor 1045D by Fuji Ceramics (Japan) was attached to the shoulder part of the specimen using a rubber band. The signals from the sensor were amplified by 60 dB. A two-channel AE setup based on the 18-bit PCI-2 data acquisition board (Physical Acoustic Corporation, 195 Clarksville Rd, Princeton Jct, NJ 08550, USA) was used in a continuously streaming mode operating at 2 MHz. The data were further processed and clustered based on the frequency and the amplitude of the signal. The details of the method are published elsewhere [
39].
For EBSD analysis, the steel and composite samples were prepared. The sample surfaces for EBSD measurements were carefully ground and polished up to 1 µm grade. The final preparation step was vibration polishing (Buehler) for four hours using a colloidal SiO2 suspension with 0.02 µm particle size. EBSD scanning was done using a high-magnification field-emission SEM (MIRA 3 XMU, Tescan, Czech Republic), which is equipped with a retractable four-quadrant BSE detector and an EBSD/EDX system of EDAX/TSL (Ametek).
5. Numerical Simulation
The simulations were performed using the spectral solver implemented in DAMASK, which is an open-source crystal plasticity simulation framework [
33]. In the current work, the constitutive model developed using DAMASK, incorporating the dislocation glide, twinning, and martensite phase transformation was used. A description of the constitutive law is outlined with detailed theoretical discussion elsewhere [
37,
38].
A periodic representative volume element (RVE) with 10 × 10 × 10 voxels with each voxel assigned a random orientation distribution was constructed from a Voronoi tessellation on a grid. Such an RVE for single or multiphase materials has been shown to behave isotopically when loaded in any direction [
40]. The boundary conditions were chosen to represent uniaxial tension along the horizontal direction, which was prescribed through mixed boundary conditions shown in Equations (1) and (2).
Similarly, the first Piola-Kirchhoff stress corresponding to uniaxial tension in x-direction:
The boundary conditions imposed on the RVE were similar to the mechanical loading in the uniaxial tension experiments with the strain rate of 1 × 10
−3 s
−1, which is in the quasi-static strain range. The averaged stress and strain values at each increment obtained from the RVE simulations were compared with the experimental stress–strain (σ–ε) and the strain-hardening (dσ/dε–ε) behavior. The procedure for obtaining optimized constitutive model parameters for dislocation glide, twinning, and martensite transformation is explained elsewhere [
38]. The tuned material model is used to run numerical simulations on actual EBSD data of the material. In full phase simulations, the RVEs are simulated in-plane stress conditions. Under this assumption, the three-dimensional crystal model is compelled to undergo two-dimensional deformation. Due to this assumption, quantitative discussions of the results are not possible.
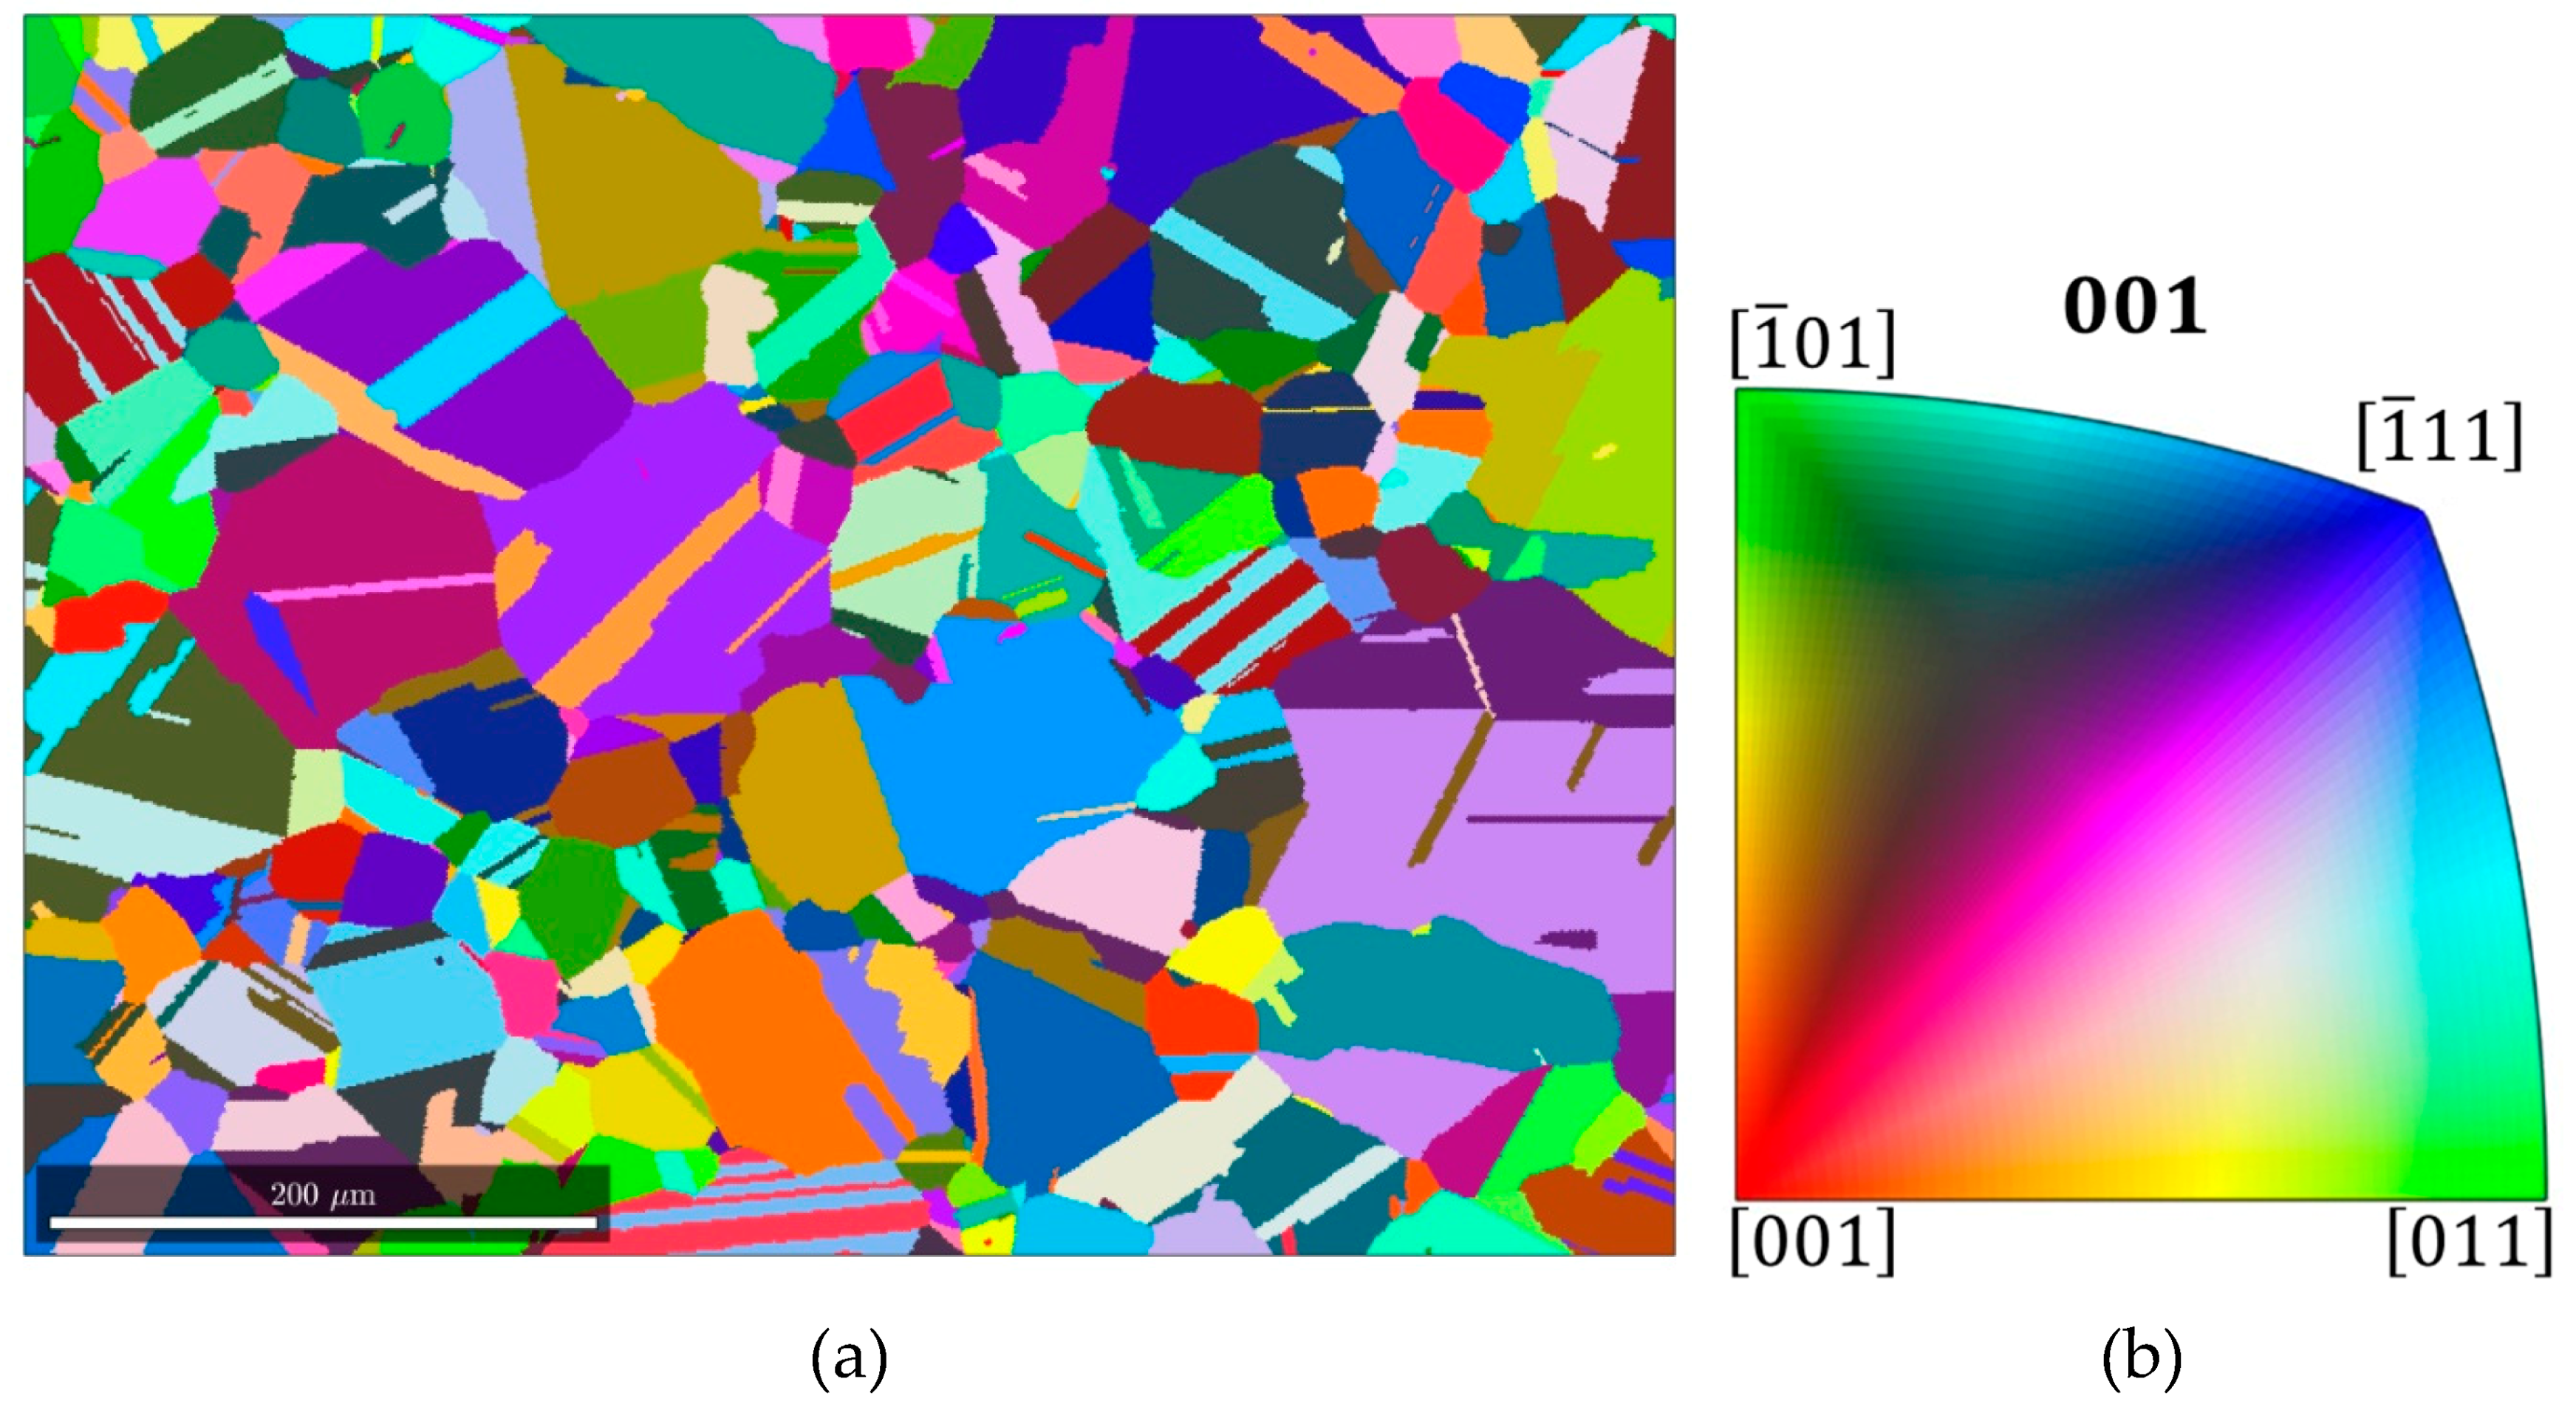
For a steel sample, the EBSD data were obtained in the middle of the prepared and polished sample. The data were later cleaned using HKL channel five software to remove any unidentified points considering five neighboring points and is shown in
Figure 1. The data were converted from tabular format into a geometry file using an already available subroutine.
The elasticity parameters used for austenite and martensite phases are shown in
Table 3. Due to the low Stacking Fault Energy of the current alloy, the austenitic iron phase (γ) passes through the dislocation-density-rich phase generally regarded as ɛ-martensite [
8] and transforms into
-martensite. However, considering the problem complexity and model limitations, for simplicity, both ɛ-martensite and
-martensite are treated as a single phase. As compared to γ-austenite, both these phases have high stiffness (at least 24% higher) [
13]. Therefore, the already developed model is adopted, which considers the HCP nature of martensitic transformation, and five elastic constants are considered to define HCP ɛ-martensite.
The physical-based parameters for the steel matrix were adopted from literature and proposed by Wong et al. [
37]. The solid solution strength was tuned to match the experimentally observed yielding. The calibration of fitting parameters is a challenging task and was carried out manually by adjustment of the flow curve and transformation volume evolution by iteratively comparing simulation results with experimental observations. The calibrated parameters for the steel matrix are presented in
Table 4. It is essential to mention that without physical sense, there might be limitless possible combinations of presented fitting parameters, which might yield a good correlation factor.
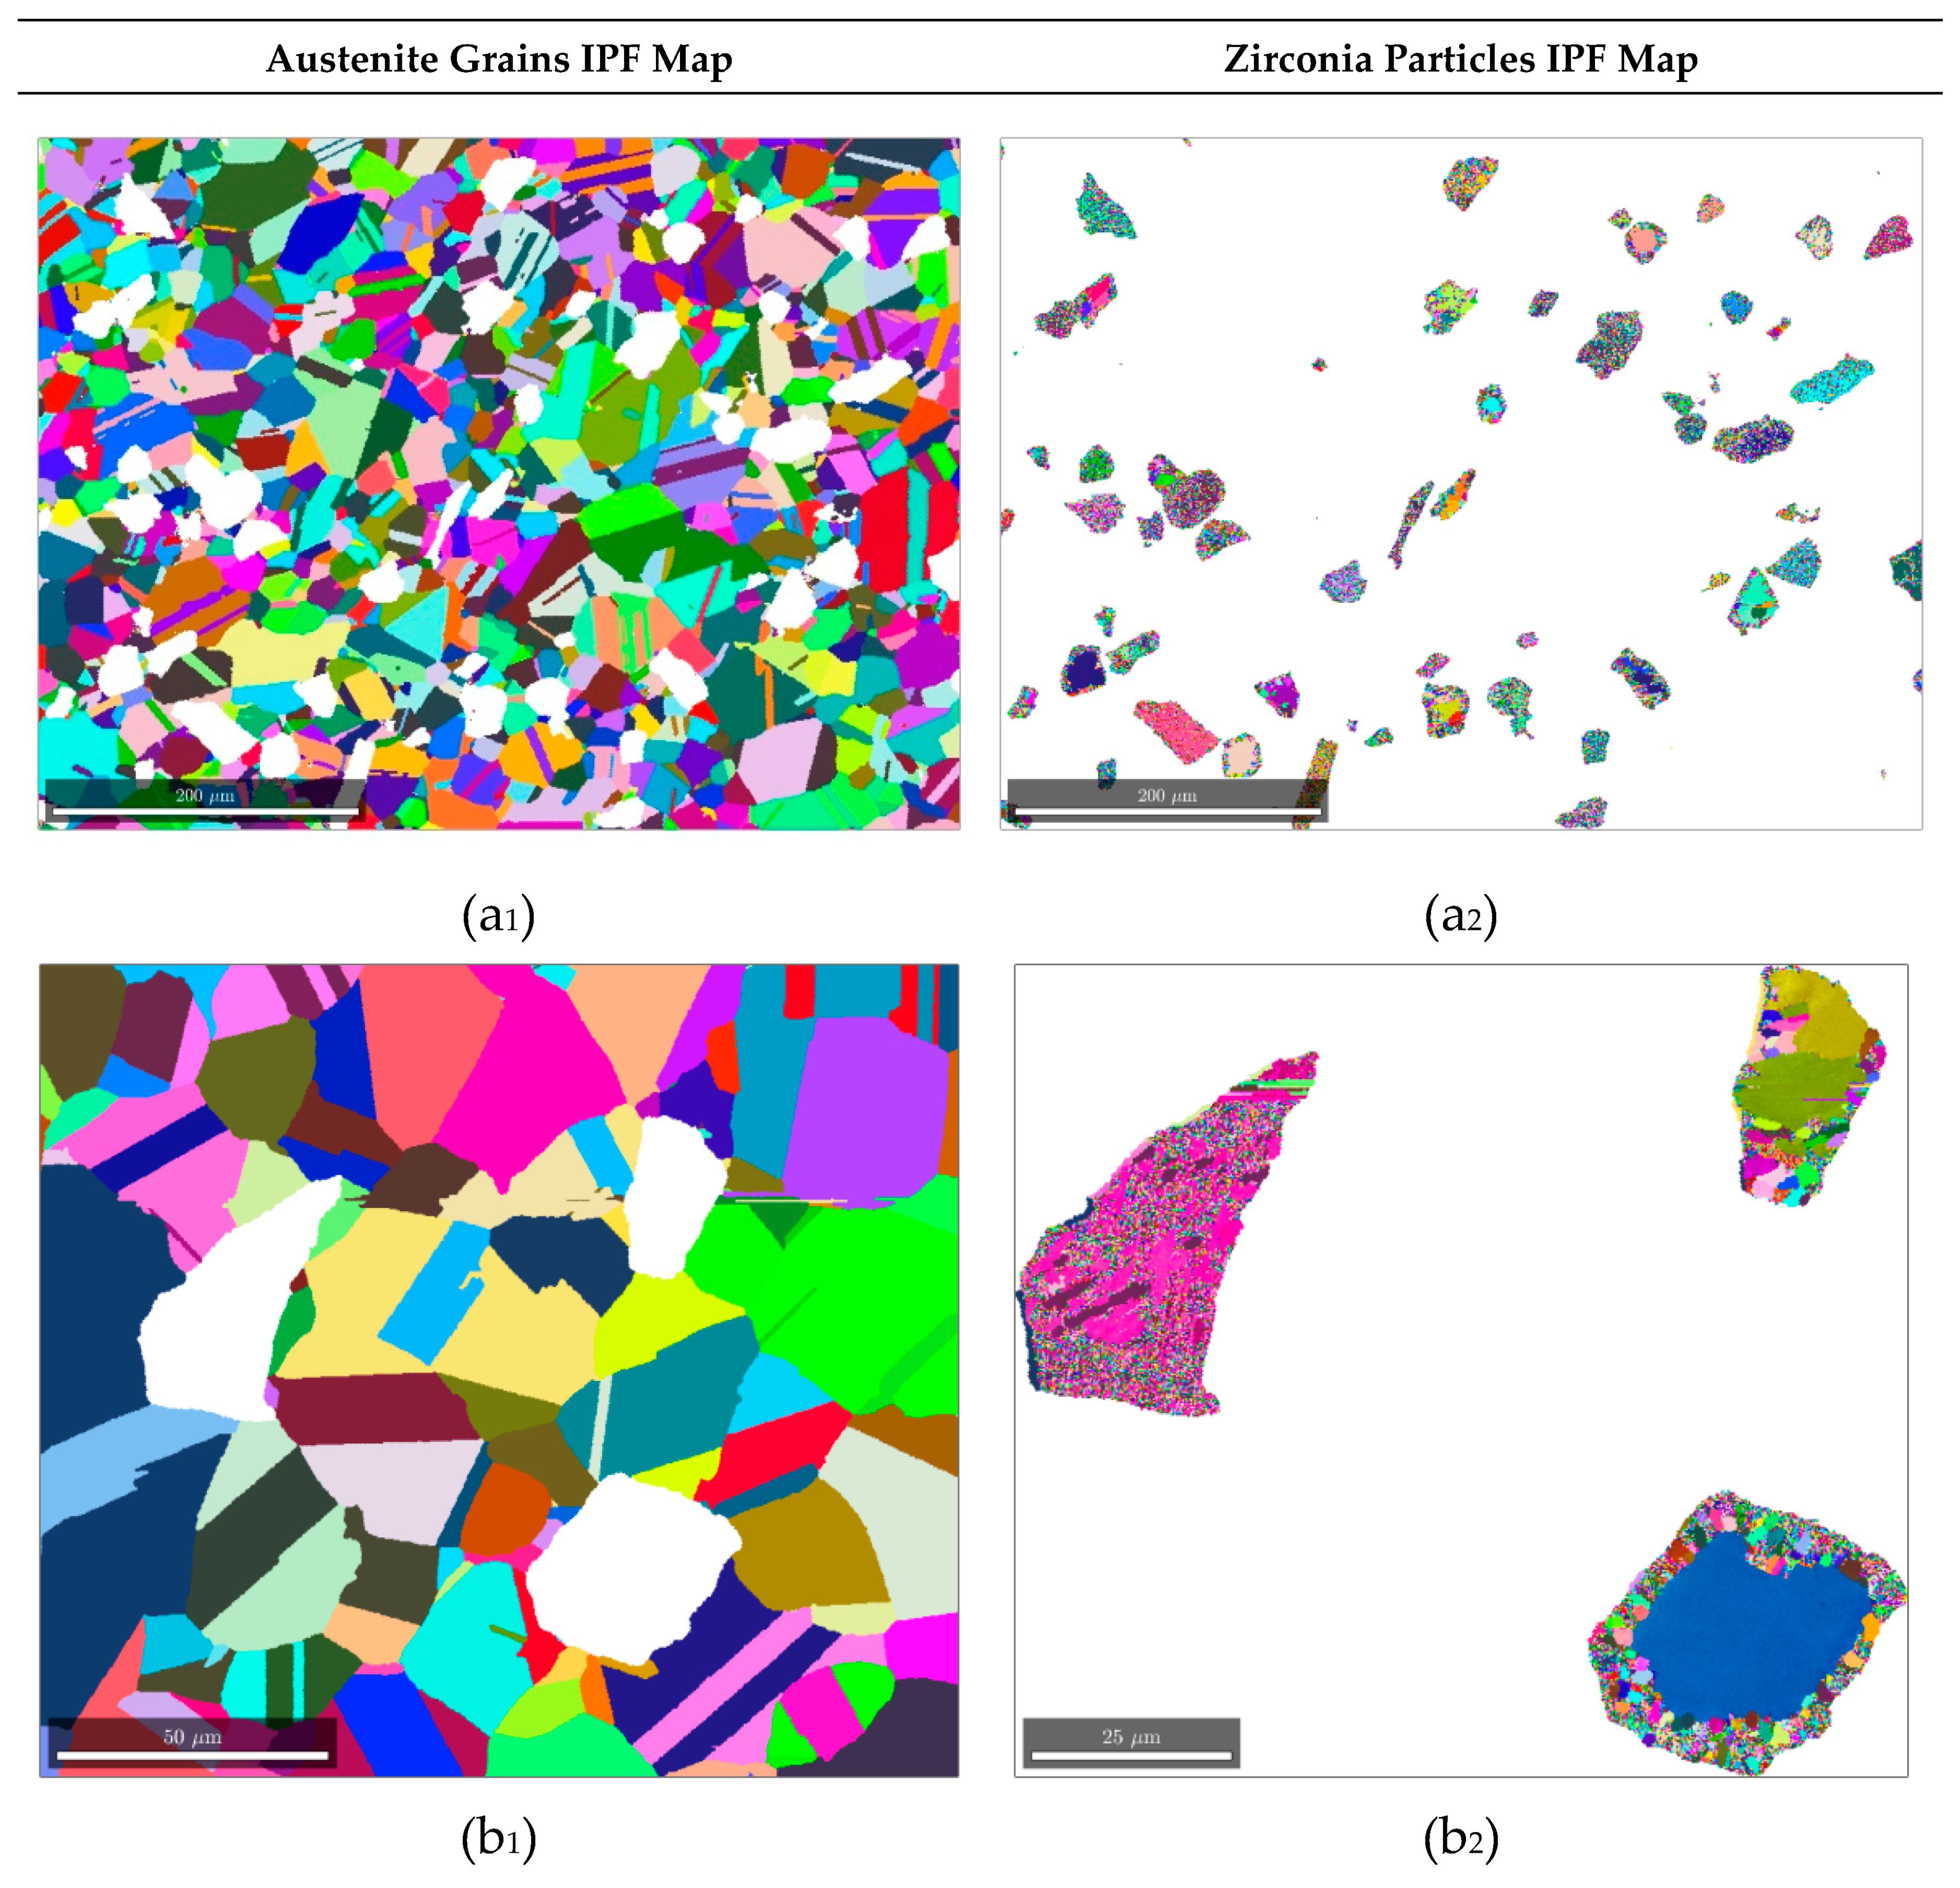
For the composite sample, the EBSD data were obtained in the middle of the prepared and polished sample. The data were later cleaned using HKL channel five software to remove any unidentified points considering five neighboring points and is shown in
Figure 2. High-magnification EBSD was recorded and processed from the same sample at a different location to run simulations; it is shown in
Figure 2b. A medium magnification simulation is better for getting a general overview of local material behavior. In contrast, high-magnification simulations are helpful in closeup analysis while keeping the computation time to optimal.
For modeling the deformation behavior of 10% Mg-PSZ composite, the zirconia particles were assigned elastic properties using three cubic elastic contacts, as shown in
Table 3. The fitting parameters already tuned for the austenite matrix were used, except a few dislocation glide and transformation parameters, which are presented in
Table 5. These few parameters need tuning when incorporating the second phase due to the assumption of perfect ceramic/matrix interface and incapability of the model to calculate the solid solution strengthening of the composite material internally.
The Orowan equation [
44] provides the shear rate on the slip system α in a dislocation-based system as:
The mean free path reduces due to the pileup of dislocation, twins, and martensitic transformation as follows:
where
The mean free bath between two obstacles seen by growing twin is computed as:
The mean free bath for martensite is computed as:
The probability of twin nuclei to bow out and form a twin is:
The probability of martensite lath to evolve is computed as:
For a description of the model in detail and a better understanding of the assumptions and limitations, readers are encouraged to read the constitutive law outlined with detailed theoretical discussion elsewhere [
37,
38].
It is essential to mention here that the EBSD data presented in
Figure 1 and
Figure 2 is of sintered X8CrMnNi16-6-6 TRIP steel and 10% Mg-PSZ composite, but is adopted to simulate and show how these materials behave locally under applied deformation. The EBSD data were cleaned considering the phase and orientation of five neighboring pixels. After cleaning the data and allocating unidentified points to a specific phase, the porosity of the samples is eliminated, which yields a cast-like material microstructure. A substantial number of annealing twins are observed in the initial microstructure, i.e., in
Figure 1 and
Figure 2 For the simplicity of the simulation model, they were assumed to be part of the austenitic matrix with default orientation.
It is also observed that the grain size in the cast samples is relatively larger when compared with sintered materials. The model is based on length scale-dependent physical parameters, i.e., average grain size, the width of martensitic lath, which are used in the model for calculating the volume percent evolution of martensite and twins and the eventual drop in the mean free path. Such calculations are carried out locally for each gaussian point, but the model remains unaware of the global dimensional scale of the input geometry. Due to the absence of dimensional scale in the simulation model and consideration of very small areas under analysis, this assumption does not play a very profound role. It will not significantly affect the output of the study
All the simulations were run by applying a horizontal tensile load using a small increment step size of 0.01 deformation/inc. The global simulations for steel and composite were run for 42% and 21% of true stain, whereas the full phase simulations for steel and composite were run for 33% and 17% of true strain, respectively. The simulation data were post-processed to analyze the stain due to dislocation glide, transformation, and twinning. The evolution of the stress, transformation, and dislocation density of the material was investigated. During post-processing, logarithmic strain tensor is calculated from the total deformation gradient by using already available subroutines in the DAMASK package. The strain is described as deformation in terms of the relative displacement of particles in the RVE. The strain tensors for each Lagrangian point are averaged using von Mises’ criteria. These averaged values of strain are plotted or presented graphically in the figures.
6. Results
In the first part of this research, the fitting parameters of the TRIP/TWIP material model were tuned for the X8CrMnNi16-6-6 cast TRIP steel. The simulation results match with the global stress/strain and transformation behavior of the material. The results of strain due to dislocation glide and transformation were also compared with already published acoustic emission data of the same material. This model was used to simulate the 2D EBSD data of X8CrMnNi16-6-6 cast TRIP steel to get a better understanding of the local stress, strain, dislocation density, and transformation behavior of the material. These obtained results are presented and discussed in the first part.
In the second part of this research, the tuned model for the matrix combined with elastic zirconia particles was used to model the 10% MMC behavior. The simulation’s result nicely matches the experimental observations. This tuned model was used to run full phase simulations on a 2D EBSD map of MMC at different magnifications, and the local evolution of stress and strain in both phases is presented in the second part. The local dislocation glide and transformation behavior of the matrix, especially in the close vicinity of the ceramic particles, is critically analyzed.
6.1. Deformation Behavior of Steel Samples
In this section, the results from global and local deformation behavior of steel samples are analyzed by comparing with experimentally observed trends from tensile and AE tests.
6.1.1. Global Behavior
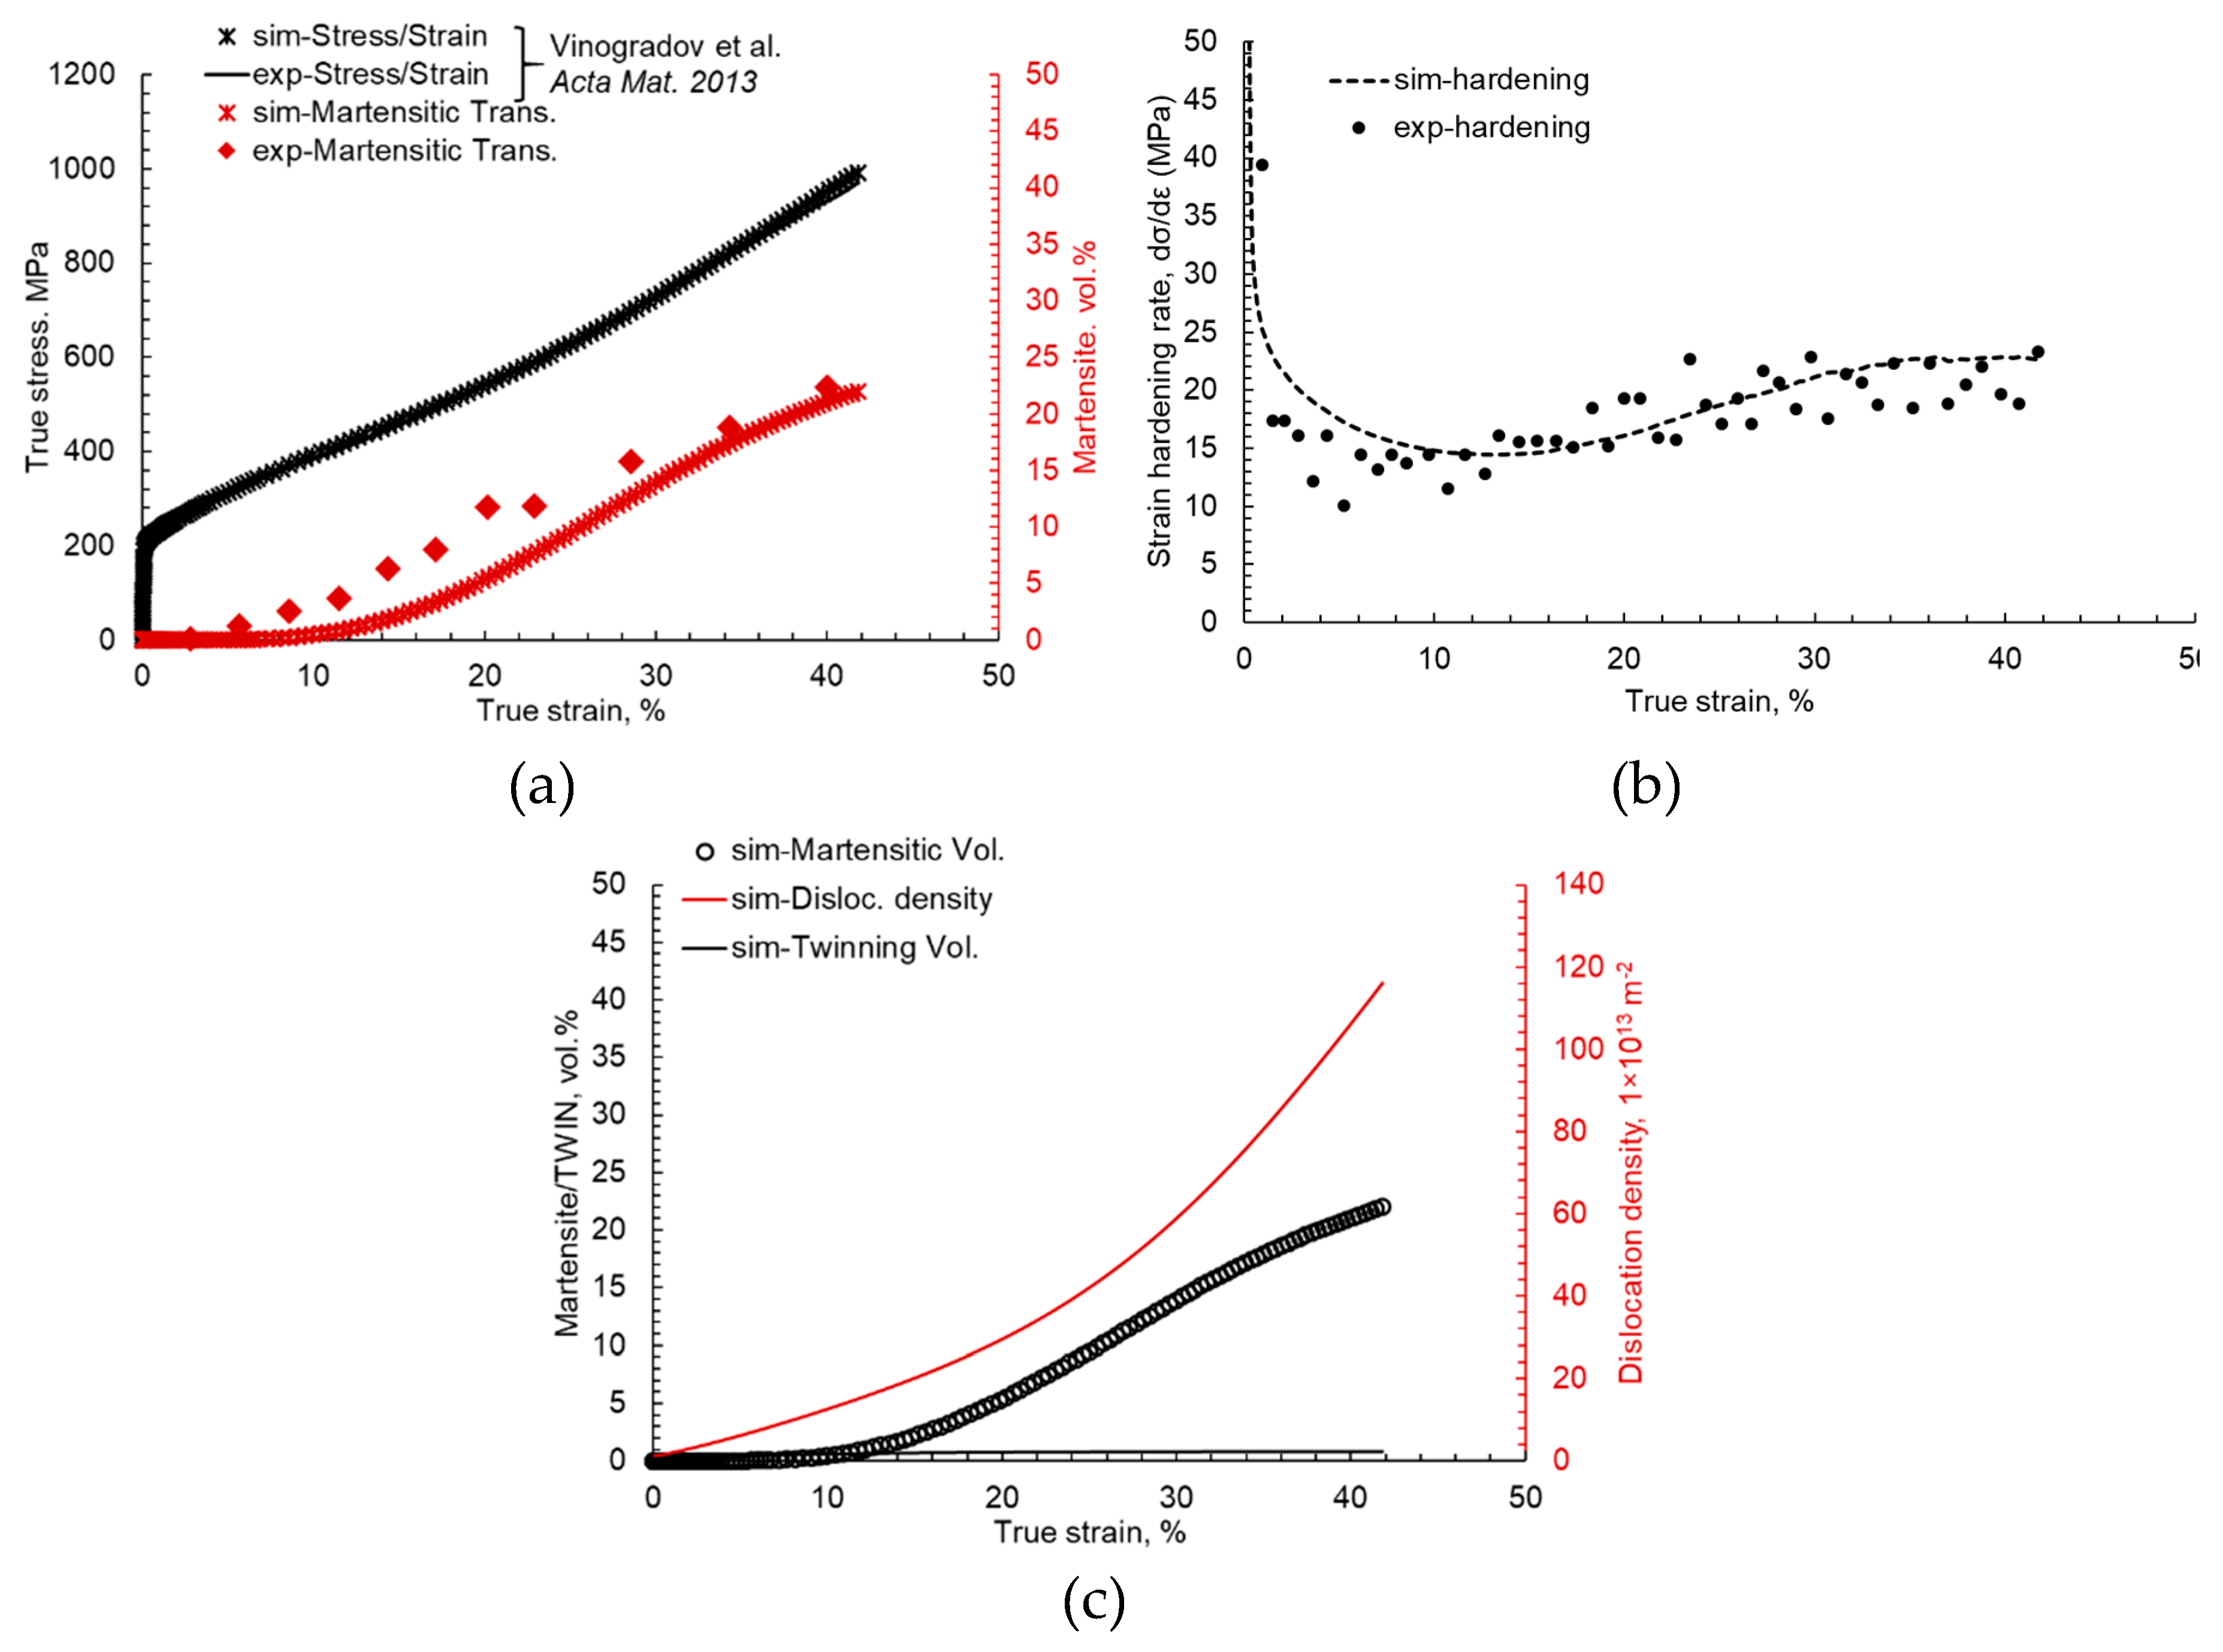
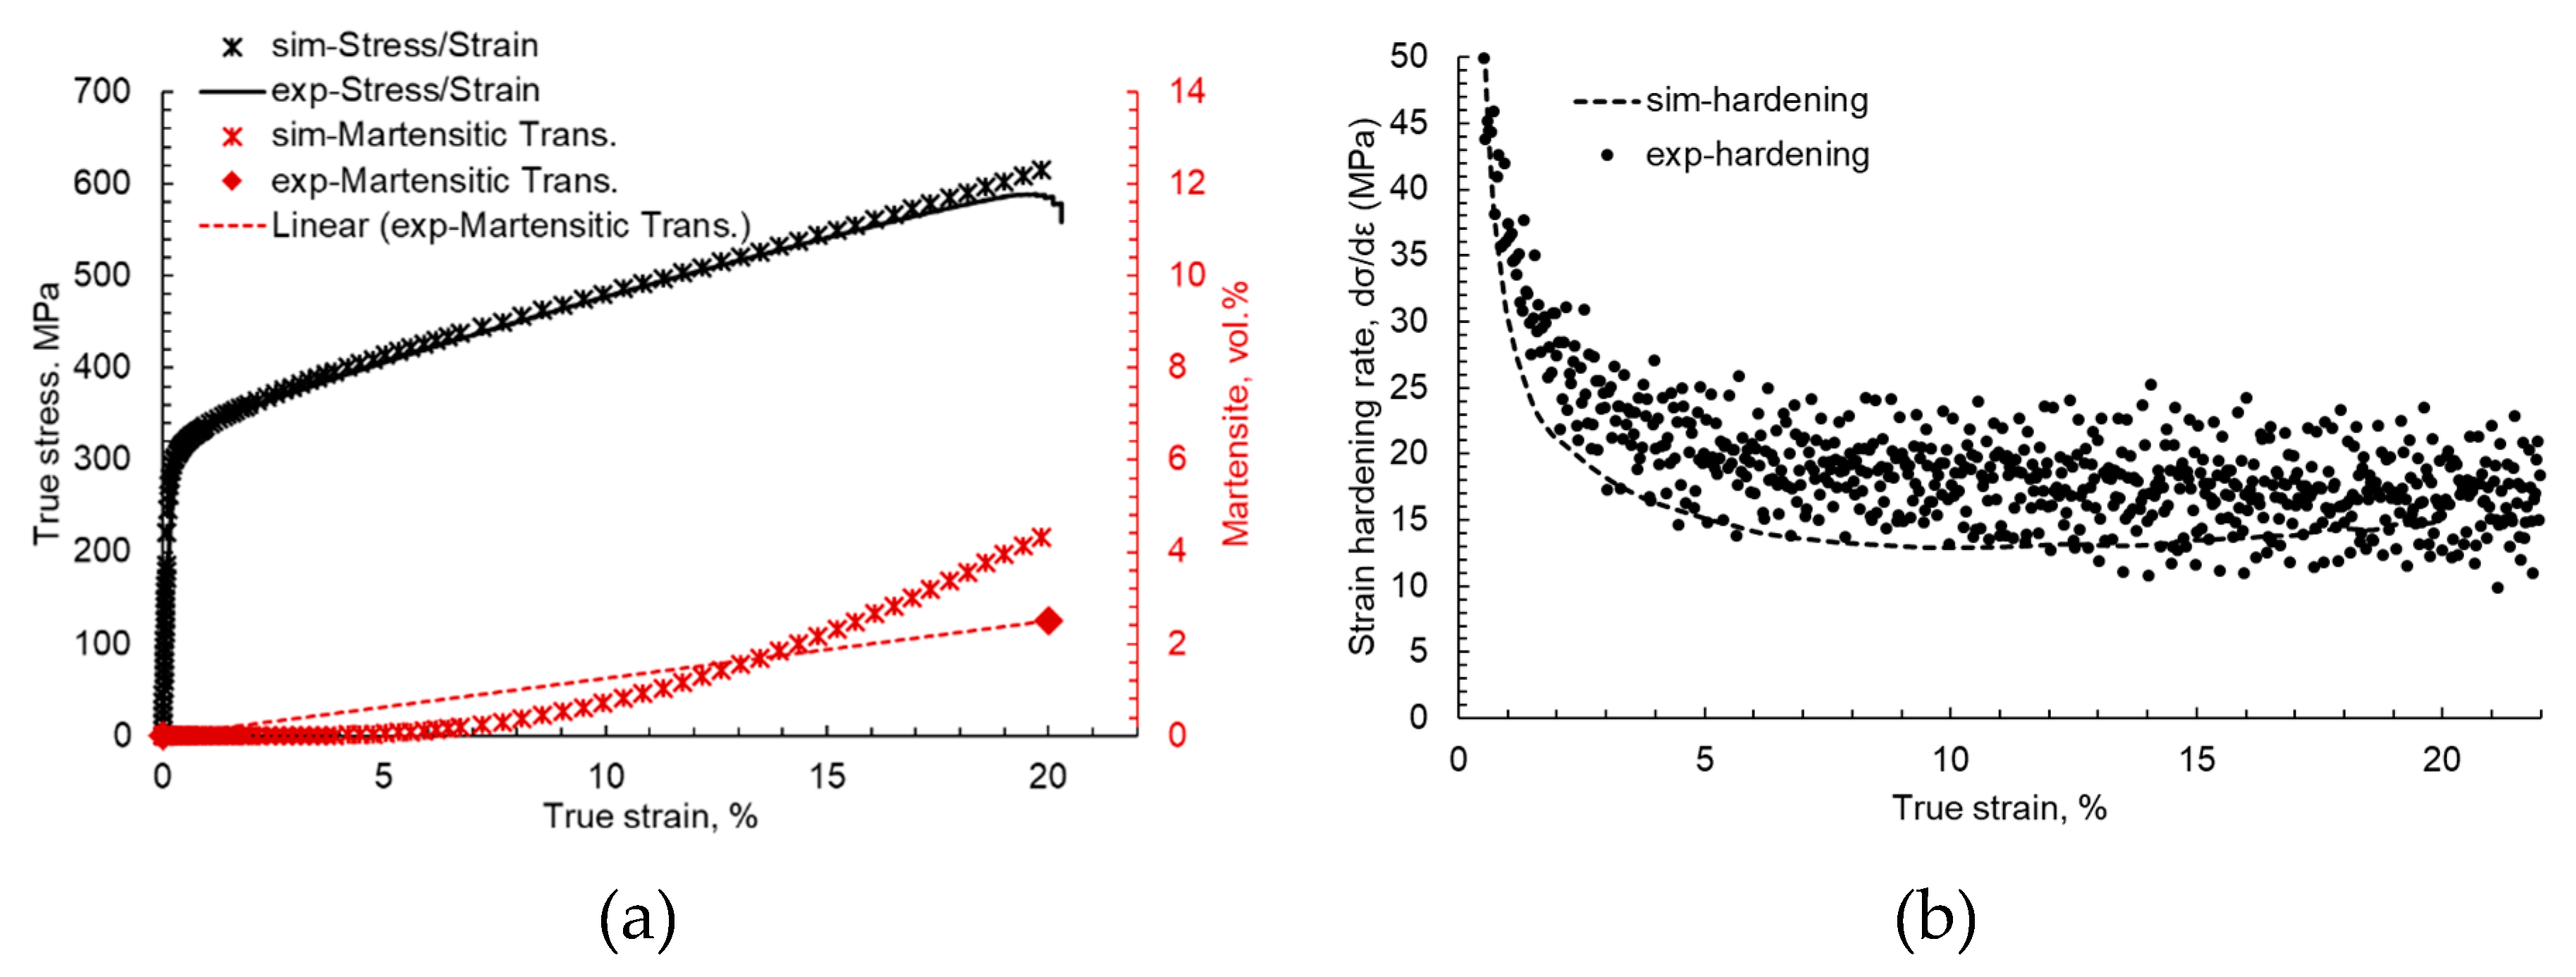
The experimental flow curve and measured transformation data [
39] in comparison with the averaged stress/strain and transformation data from the 1000-grain benchmark simulations are presented in
Figure 3a. It is observed that the tuned simulation model accurately captures the stress/strain behavior of the material with less than 1% error. The onset of martensitic evolution, its increase in volume, and the overall trend of evolution also correlate well with experimental observations. It is important to note here that the method of measuring martensite volume with a ferritoscope is not the most accurate. Hence, some errors might occur due to miscalculations during experimental measurements.
Figure 3b, the strain hardening rate is plotted against true strain in the material, and it is observed that the material hardens due to martensitic evolution after 20% of the true strain. This increase of hardening is associated with local dislocation pinning and martensitic growth (conversion of austenite to a harder phase) in the material, as can be observed in
Figure 3c. The dislocation density is observed to increase quadratically with increasing strain.
It is easy to understand that the dislocation density linearly increases up to 20% strain, after which there is an exponential increase in the dislocation density due to the high transformation which reduces mean free path for the dislocations to glide. This interplay of different phenomena in the material is better understood by full phase simulation results, which are discussed in
Section 6.1.2.
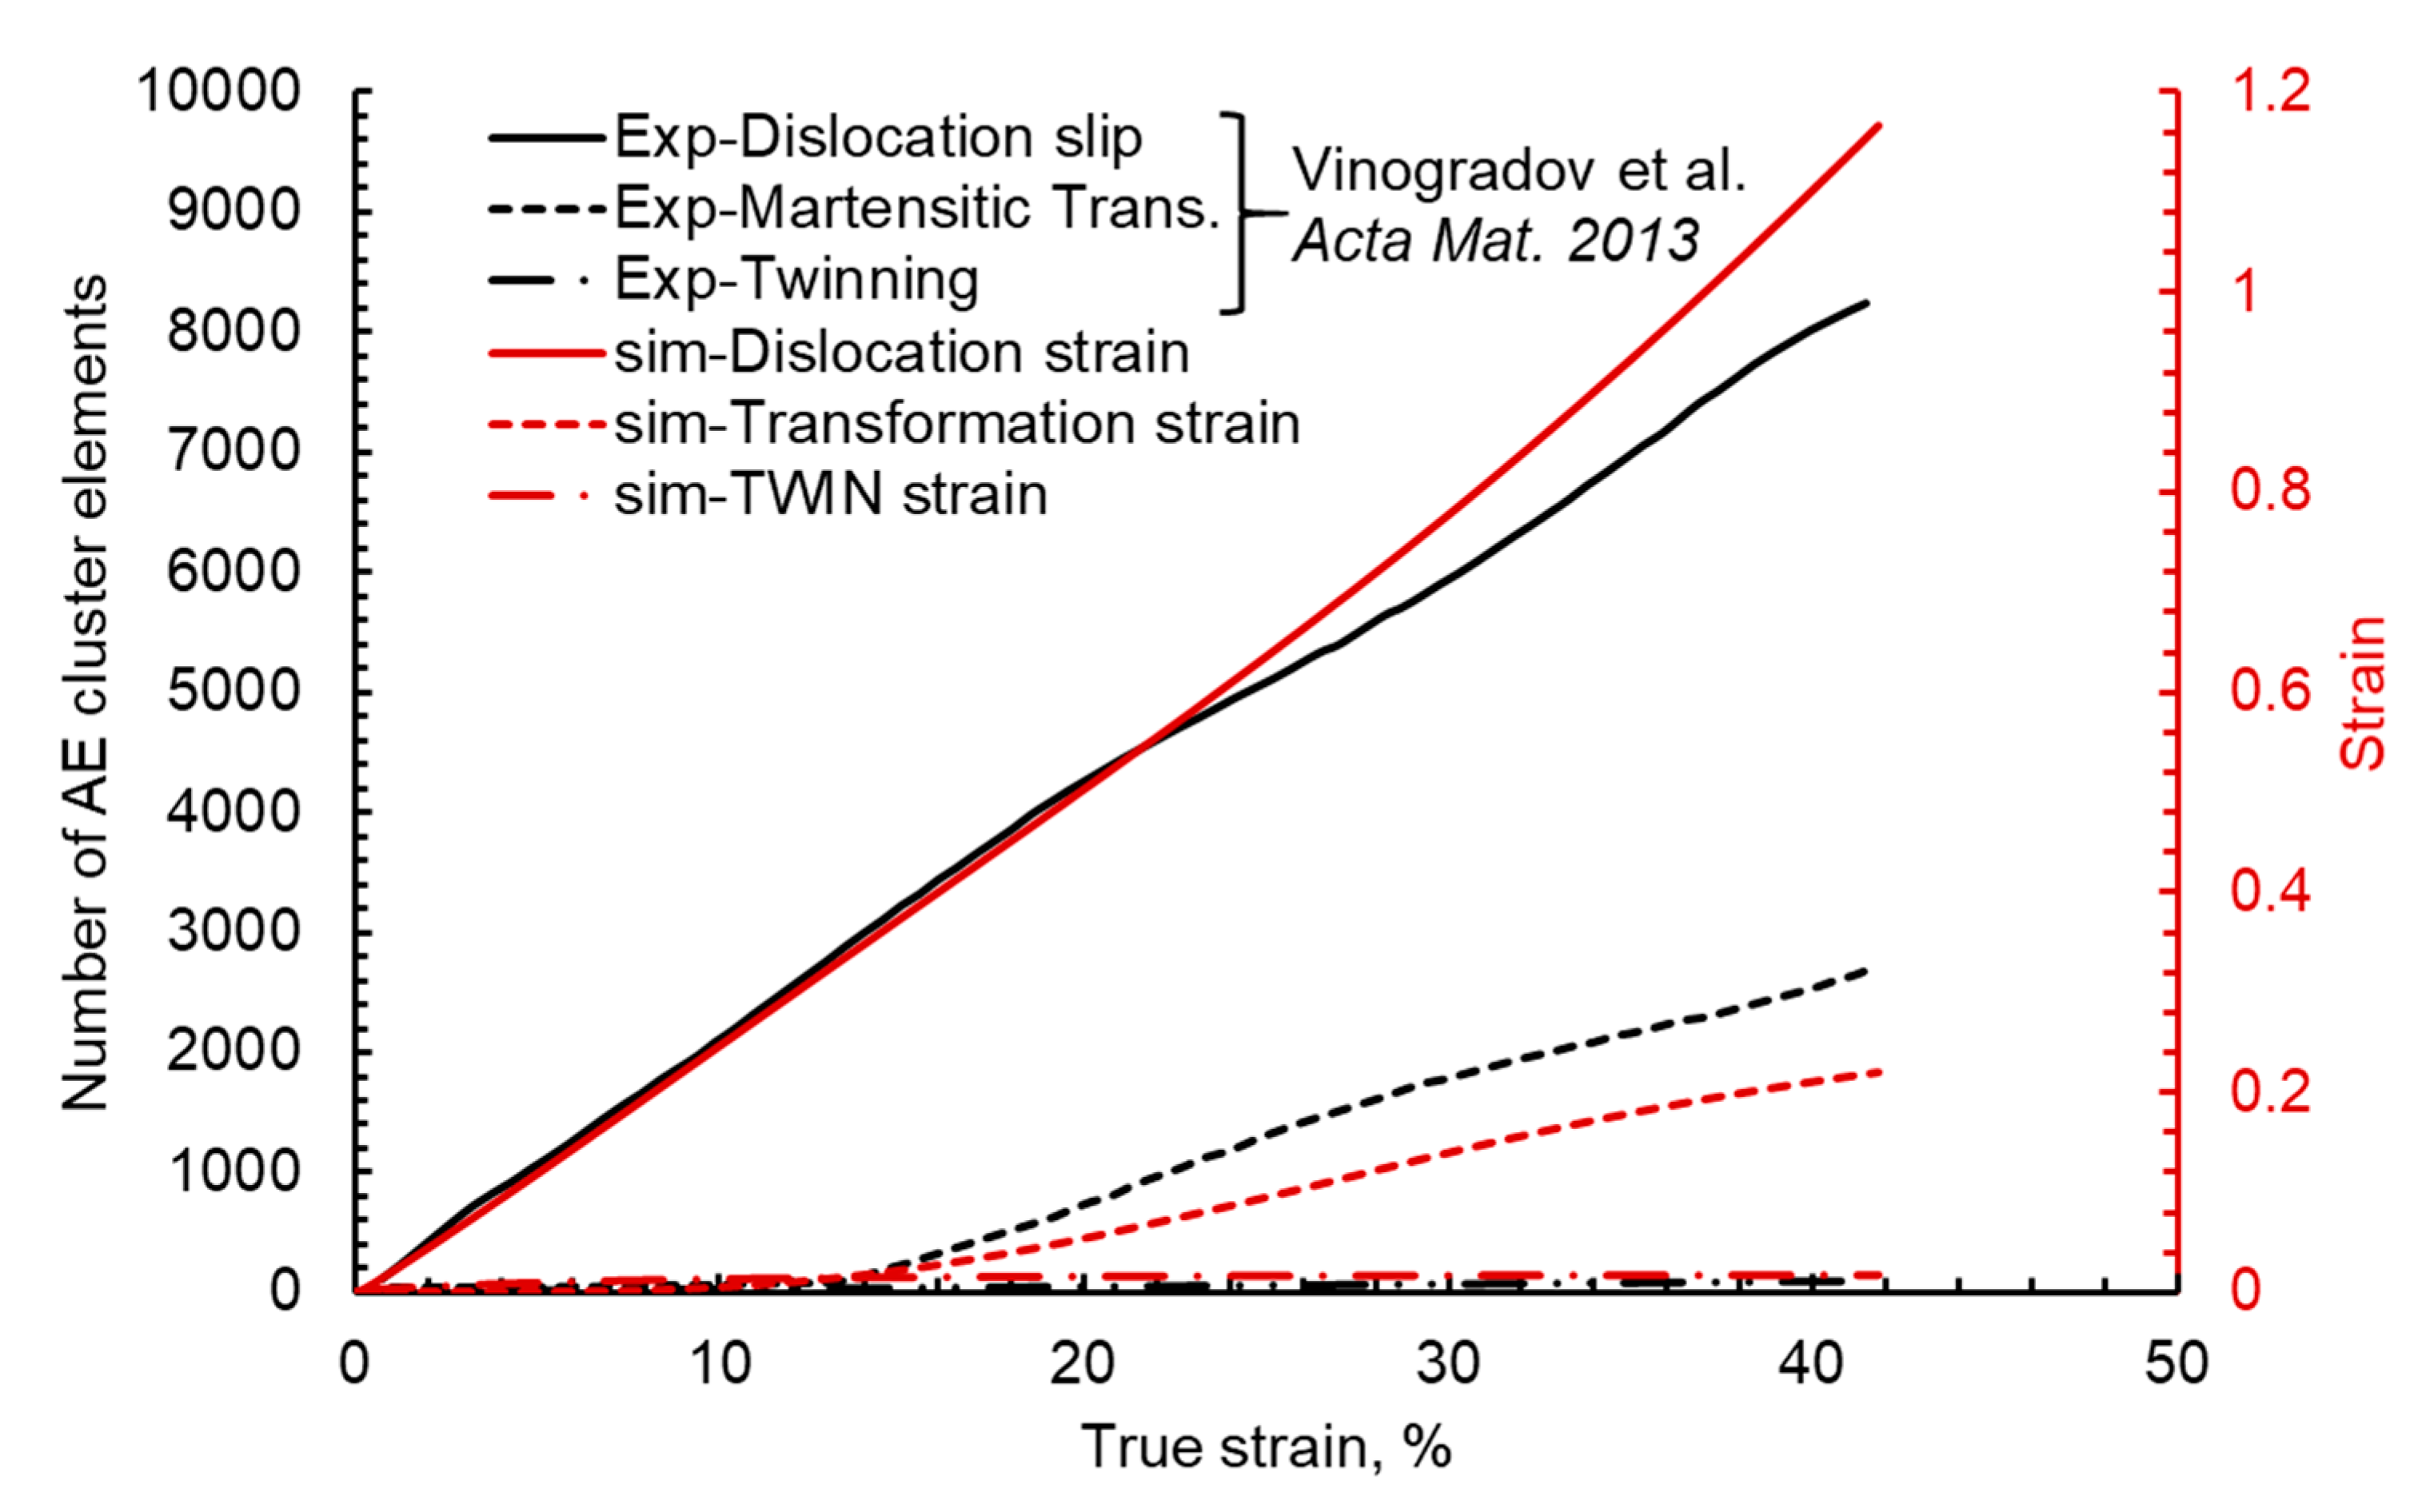
In the DAMASK TRIP/TWIP material model, total deformation is composed of an elastic part and a plastic part. The total plastic deformation is calculated by adding strain due to dislocation glide, twinning, and transformation. In the model, each deformation phenomenon is governed by its own set of deformation equations comprising of physical and fitting parameters. Therefore, the results of the simulation can be post-processed to decompose the total deformation into its components and can be plotted to see the evolution of different phenomena in the material. Such a plot for an accurately tuned model is presented in
Figure 4. As there is no twinning in the material, accumulated strain due to partial dislocations is almost zero. Strain accumulation due to transformation starts at 15% true strain and tends to saturate with increasing deformation. As observed, the strain due to dislocation glide starts with plastic deformation and increases almost linearly with total strain in the material to a maximum of 1.2.
Recently, researchers [
12,
39] developed and tuned the technique of using acoustic emission data to simultaneously record and analyze the deformation in TRIP steels in situ. This technique was shown to successfully yield useful information about transformation and dislocation dynamics in the form of increasing AE events. The limitation of this technique is that the output is in the form of AE events of different amplitudes and frequencies, which are amplified, filtered, clustered and added for every strain increment, it is the statistical data that do not correspond to the physical material deformation parameter. In
Figure 4, the numerical simulation results of the strain occurrence due to dislocation glide, transformation, and twinning is compared with the acoustic emission data of the same material. The onset of transformation at 15% of strain is accurately captured by the simulation model. The correlation between two measurements is based on the singular starting point and scaling of axis such that there is maximum correlation factor in strain due to dislocation motion.
The value of strain due to transformation with the same trend is under-predicted by the simulation model. This reduced strain due to transformation is compensated by the linear trend of strain (by dislocation motion). The slope of dislocation slip, AE elements, and strain due to dislocation glide in simulation is the same up to 23% of the true strain, after which the simulation model slightly over predicts this value.
6.1.2. Local Behavior
Based on the presented global results, it is evident that the numerical simulation with a tuned material model can be used to model material behavior in a broad strain range. Using this material model, full phase numerical simulations were run on EBSD data containing 310 grains. The orientation and position of information from 2D EBSD data presented in
Figure 1 were adopted for these simulations. The local strain evolution and its components at 5%, 15%, and 30% of true strain are shown in
Figure 5.
The analysis provided in
Figure 5 reveals that a substantial heterogeneity develops in the strain distribution (ranging from local strain values of 0.0–0.6) depending upon the grain orientation and position according to the neighboring grains, which is per earlier experimentally observed trends [
47]. It is observed in
Figure 5f that intensely strained zones in the microstructure enter into the plastic deformation regime first, followed by the formation of high strain channels between these zones.
For better understanding, the total strain component has been divided into its components. The strain due to twinning is neglected due to its small contribution. Total strain due to dislocation glide and strain due to martensitic transformation is plotted in
Figure 5b and
Figure 5d, respectively. It is observed that the primary contributing mechanism for the strain is dislocation glide, i.e., accumulated shear due to slip in
Figure 5b corresponds well with the true strain map in
Figure 5f.
Although martensitic transformation also contributes to the total strain in the material, the value is small (
Figure 5d). Moreover, those positions after transformation restrict the dislocation motion and hence are observed in areas with low total strain. In the material under consideration, at room temperature, the austenitic matrix starts transforming into martensite around 15% of the true strain (
Figure 5(c
2)). This martensitic evolution reduces the available mean free path for the dislocation glide, and hence the dislocation pinning occurs near these martensitic islands. This increasing dislocation pinning results in higher dislocation densities, which further reduces the plastic flow of the material in these zones and results in the global hardening of the material. These zones with a high transformed martensitic volume and a high dislocation density also bear the highest amount of stress during deformation. They are the most susceptible zones for void formation [
17,
18,
19,
48].
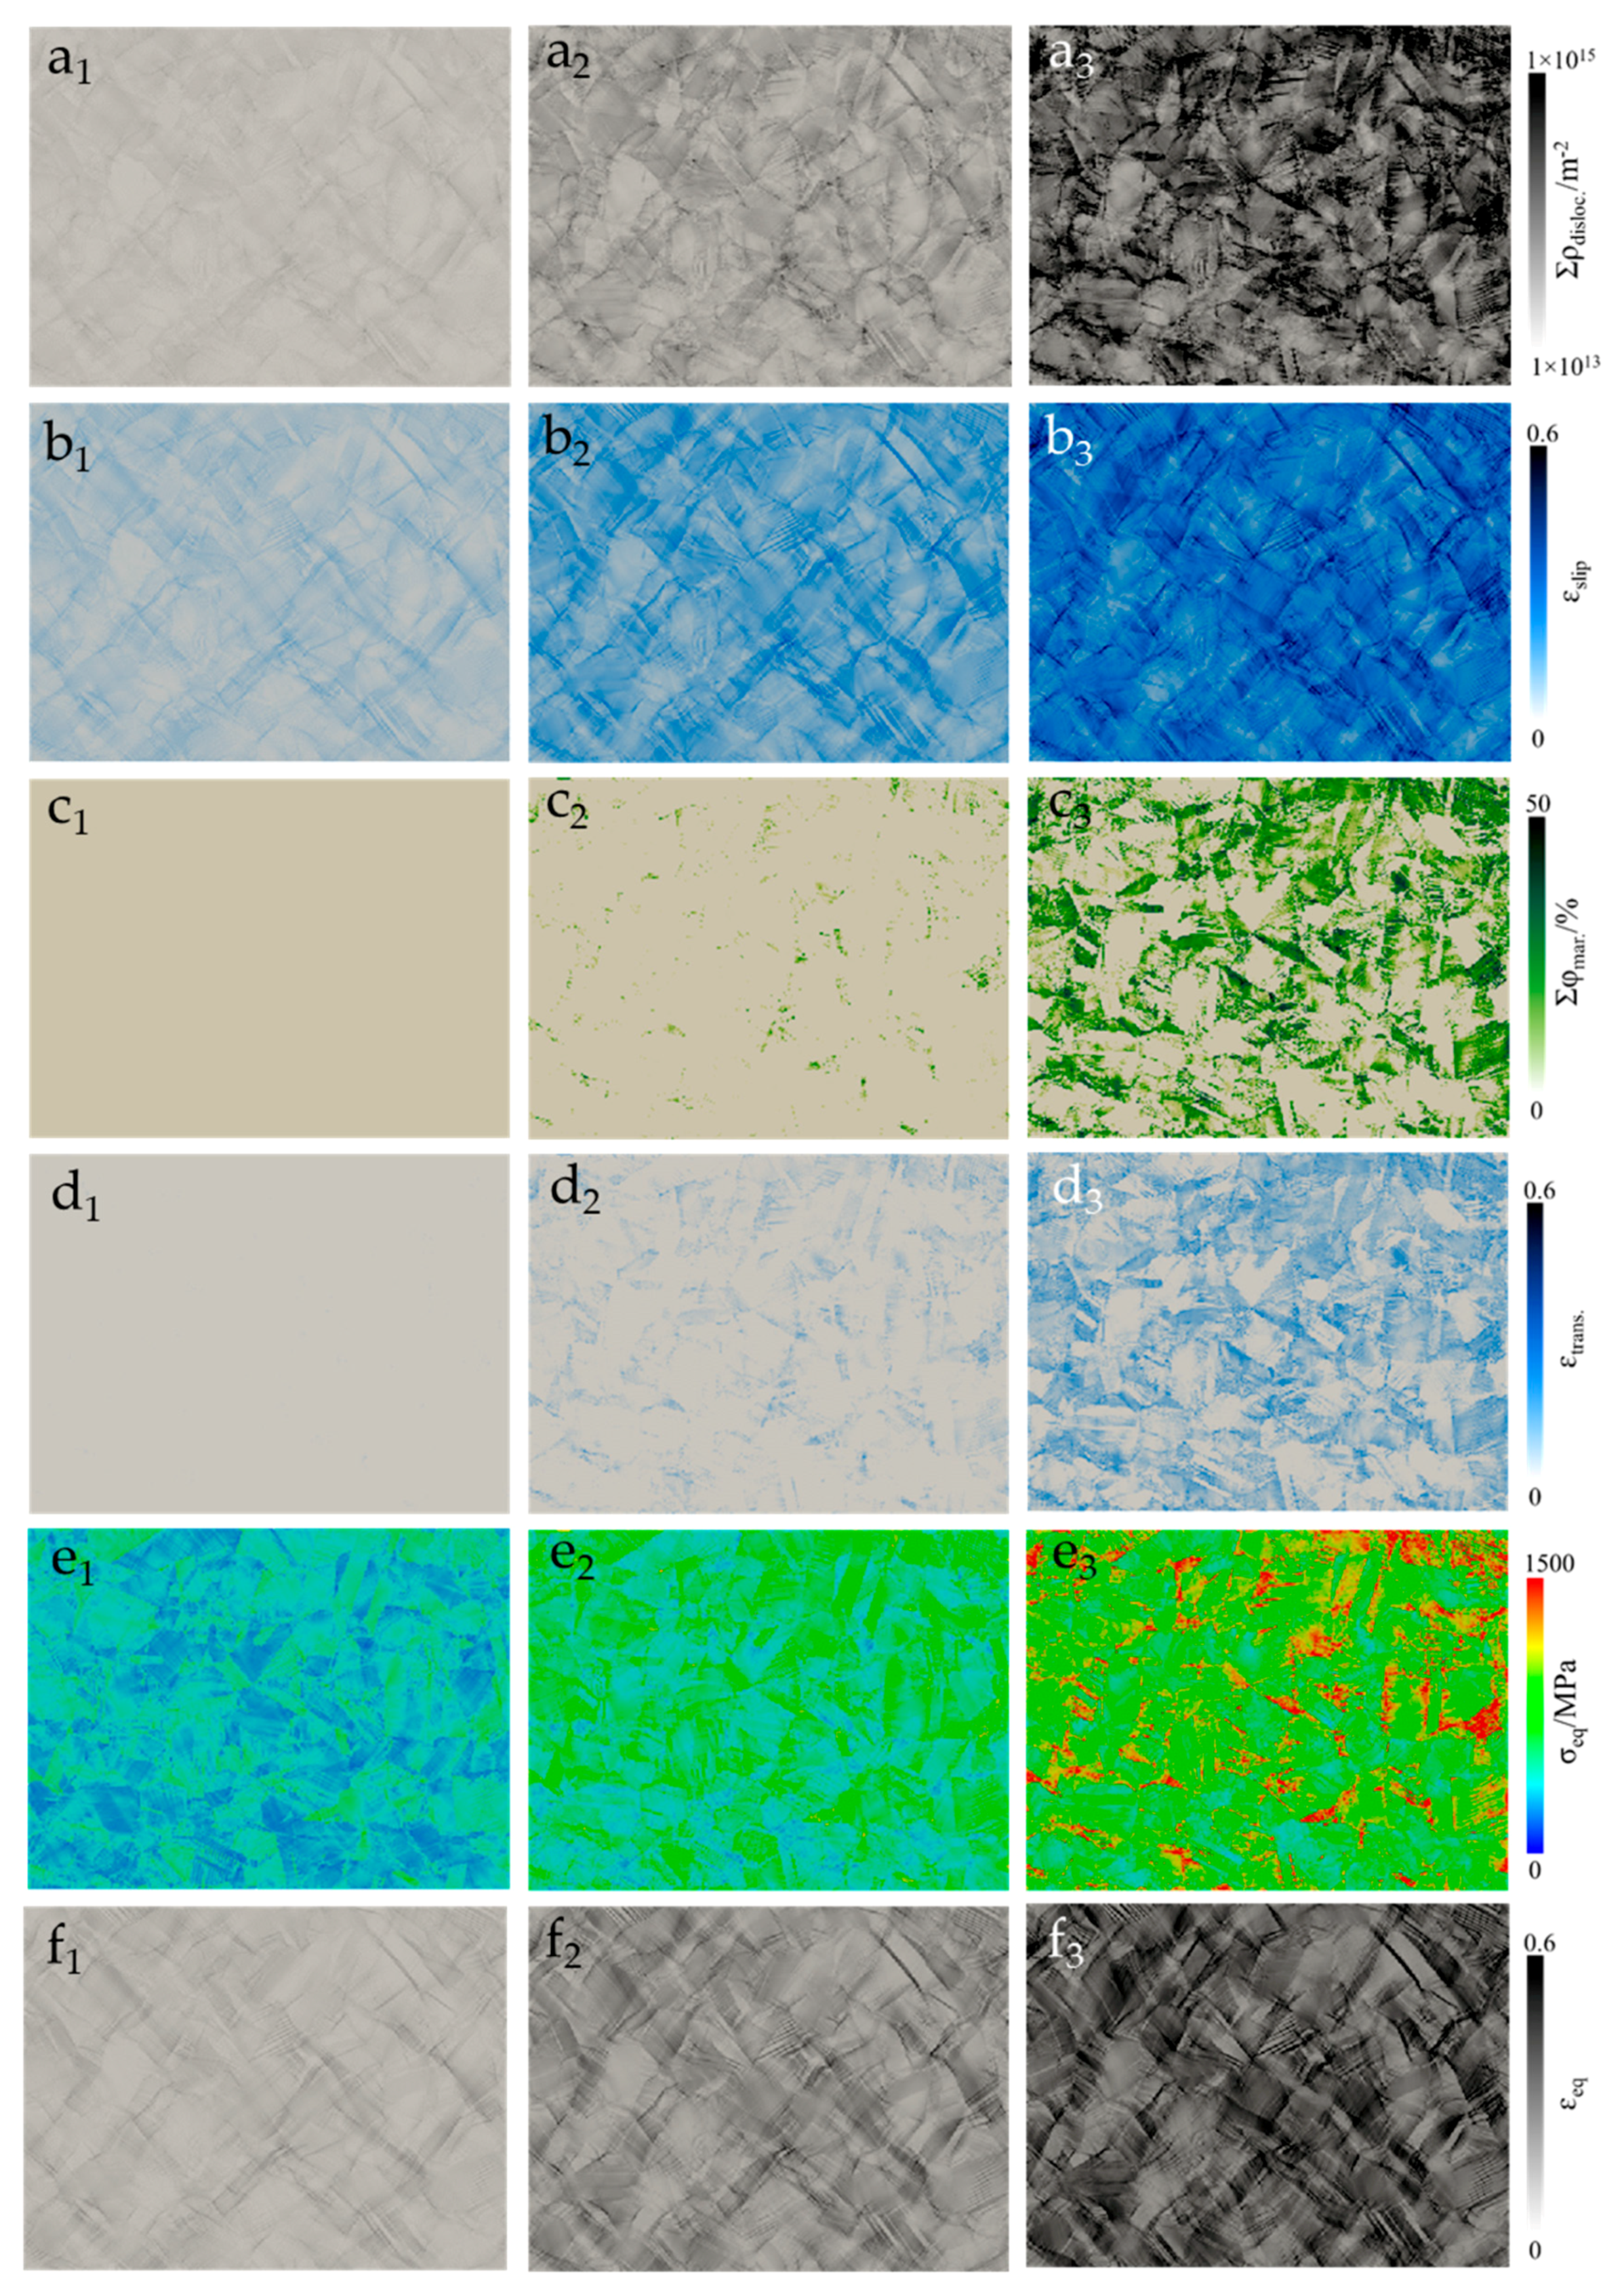
The evolution of dislocation density in the full phase model is shown in
Figure 5a. When compared with martensitic volume in
Figure 5c, it is observed that the high dislocation density zones and high martensite evolution zones are mostly the same. The dislocation density reached up to 1 × 10
15 m
−2 in areas of high martensite volume. Von Mises’ true stress evolution during deformation is shown in
Figure 5e. The stress is higher in areas of high martensite volume. The study of stress evolution reveals that, as expected, the martensite phase is carrying most of the applied stress when compared with austenitic zones.
6.2. Deformation Behavior of Composite Samples
In this section, the global and local deformation behavior in both phases of analyzed composite material is presented in comparison with experimental observations.
6.2.1. Global Behavior
The true stress/strain and transformation results obtained from the RVE simulations of the composite are compared with experimental observations in
Figure 6a. Due to accurate identification of the material parameters, the onset of yielding and plastic flow of the material is accurately captured with less than 2% error. The developed model does not have inclusive failure criteria; therefore, it is not able to capture the final necking and failure of the sample, as is observed in experimental data. The hardening of the material is found to drop exponentially by up to 7% percent of the strain and stays constant, as shown in
Figure 6b.
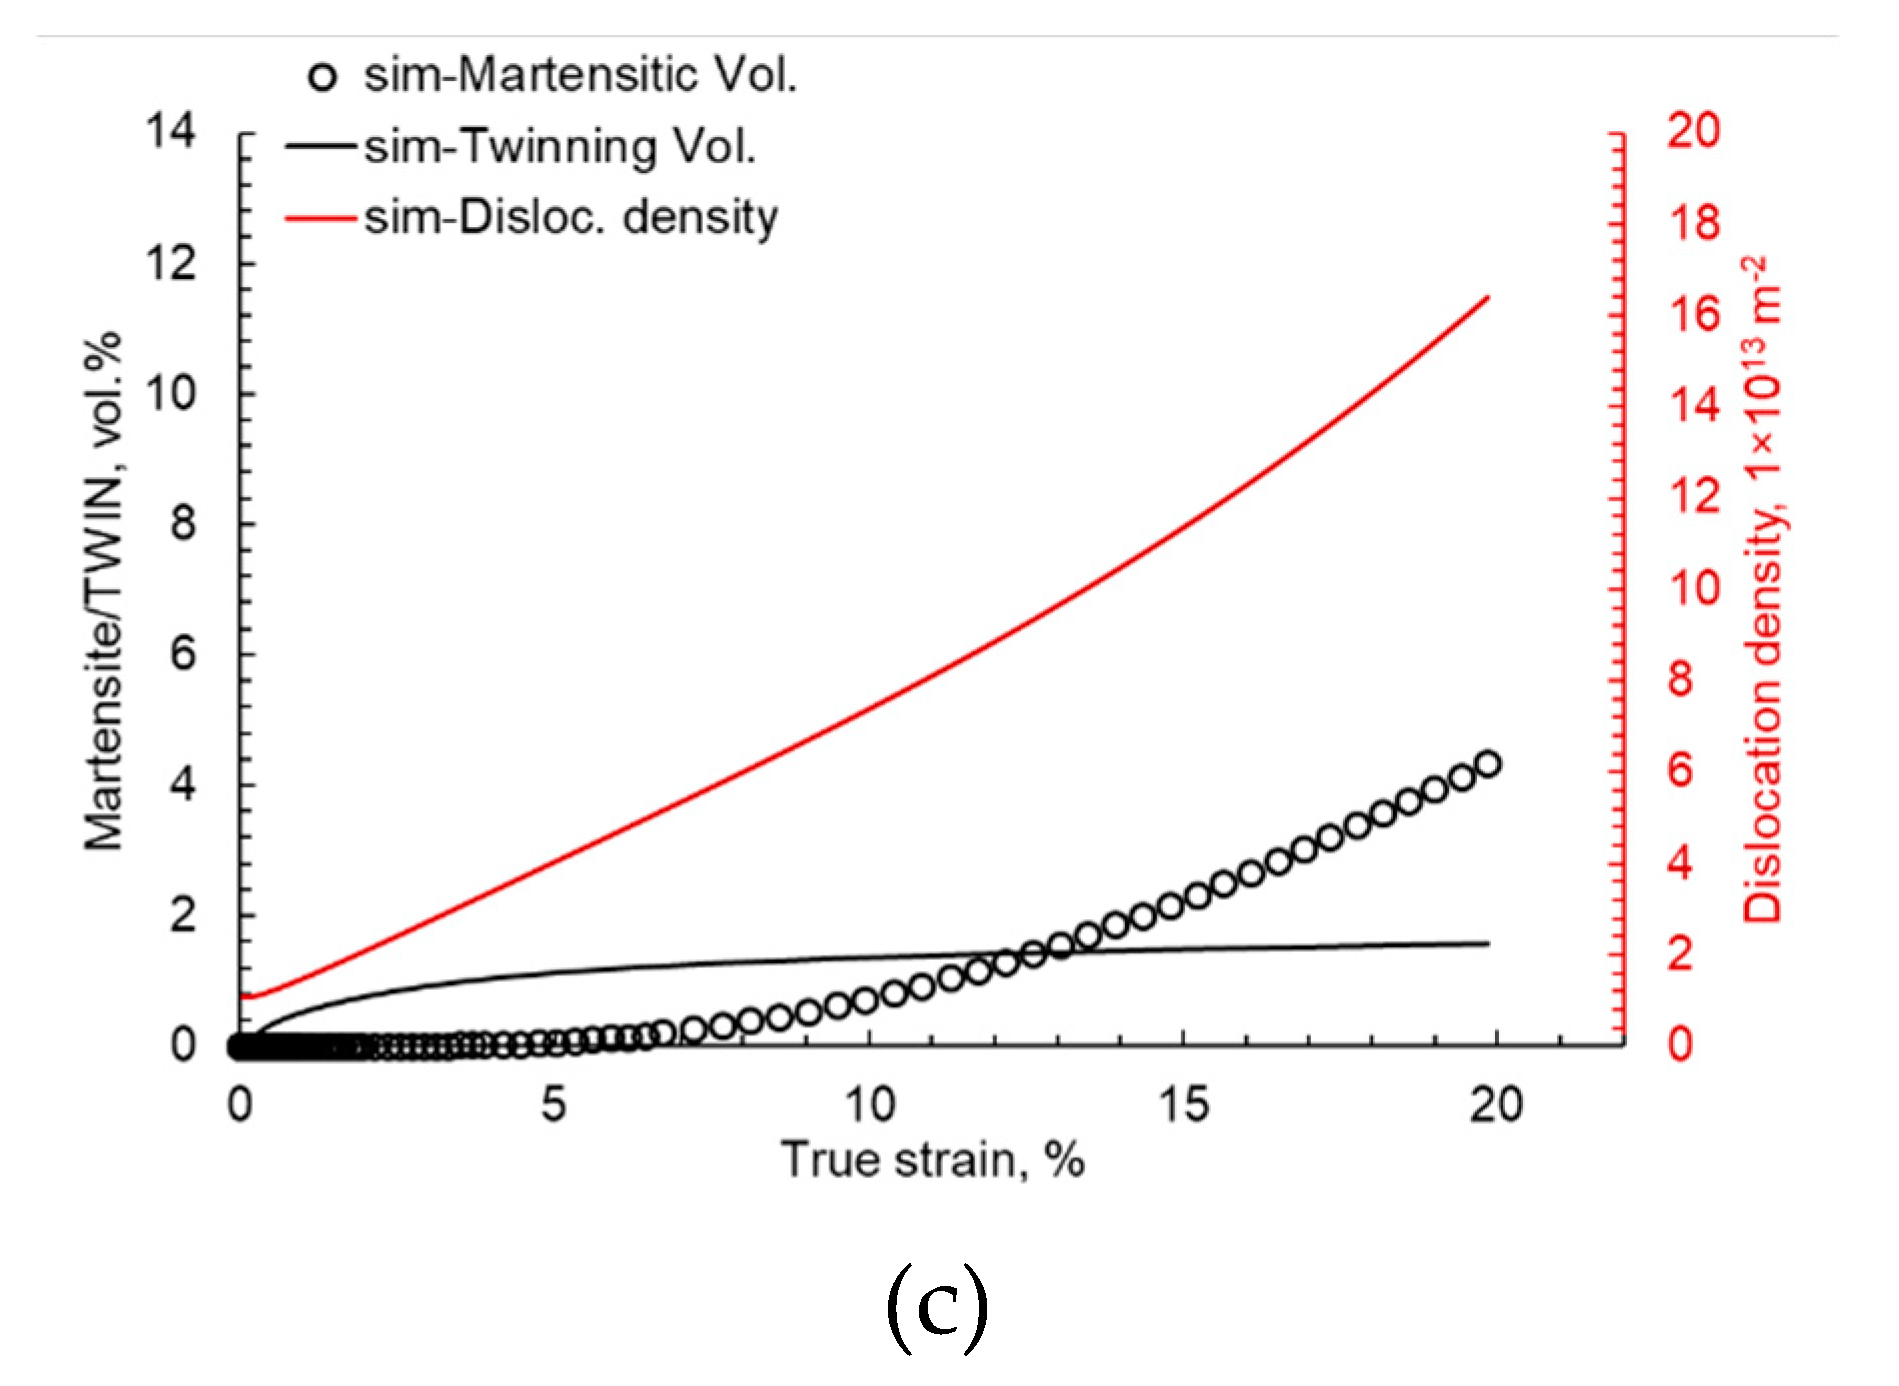
To understand this constant hardening in the material, TWIN/TRIP vol.% and the dislocation density evolution of the material are plotted with true strain in
Figure 6c. It is observed that the dislocation density increases from 1.2 × 10
12 m
−2 (assigned initial dislocation density) to 17 × 10
13 m
−2 up to 20% of the strain, after which the material fails.
6.2.2. Local Behavior
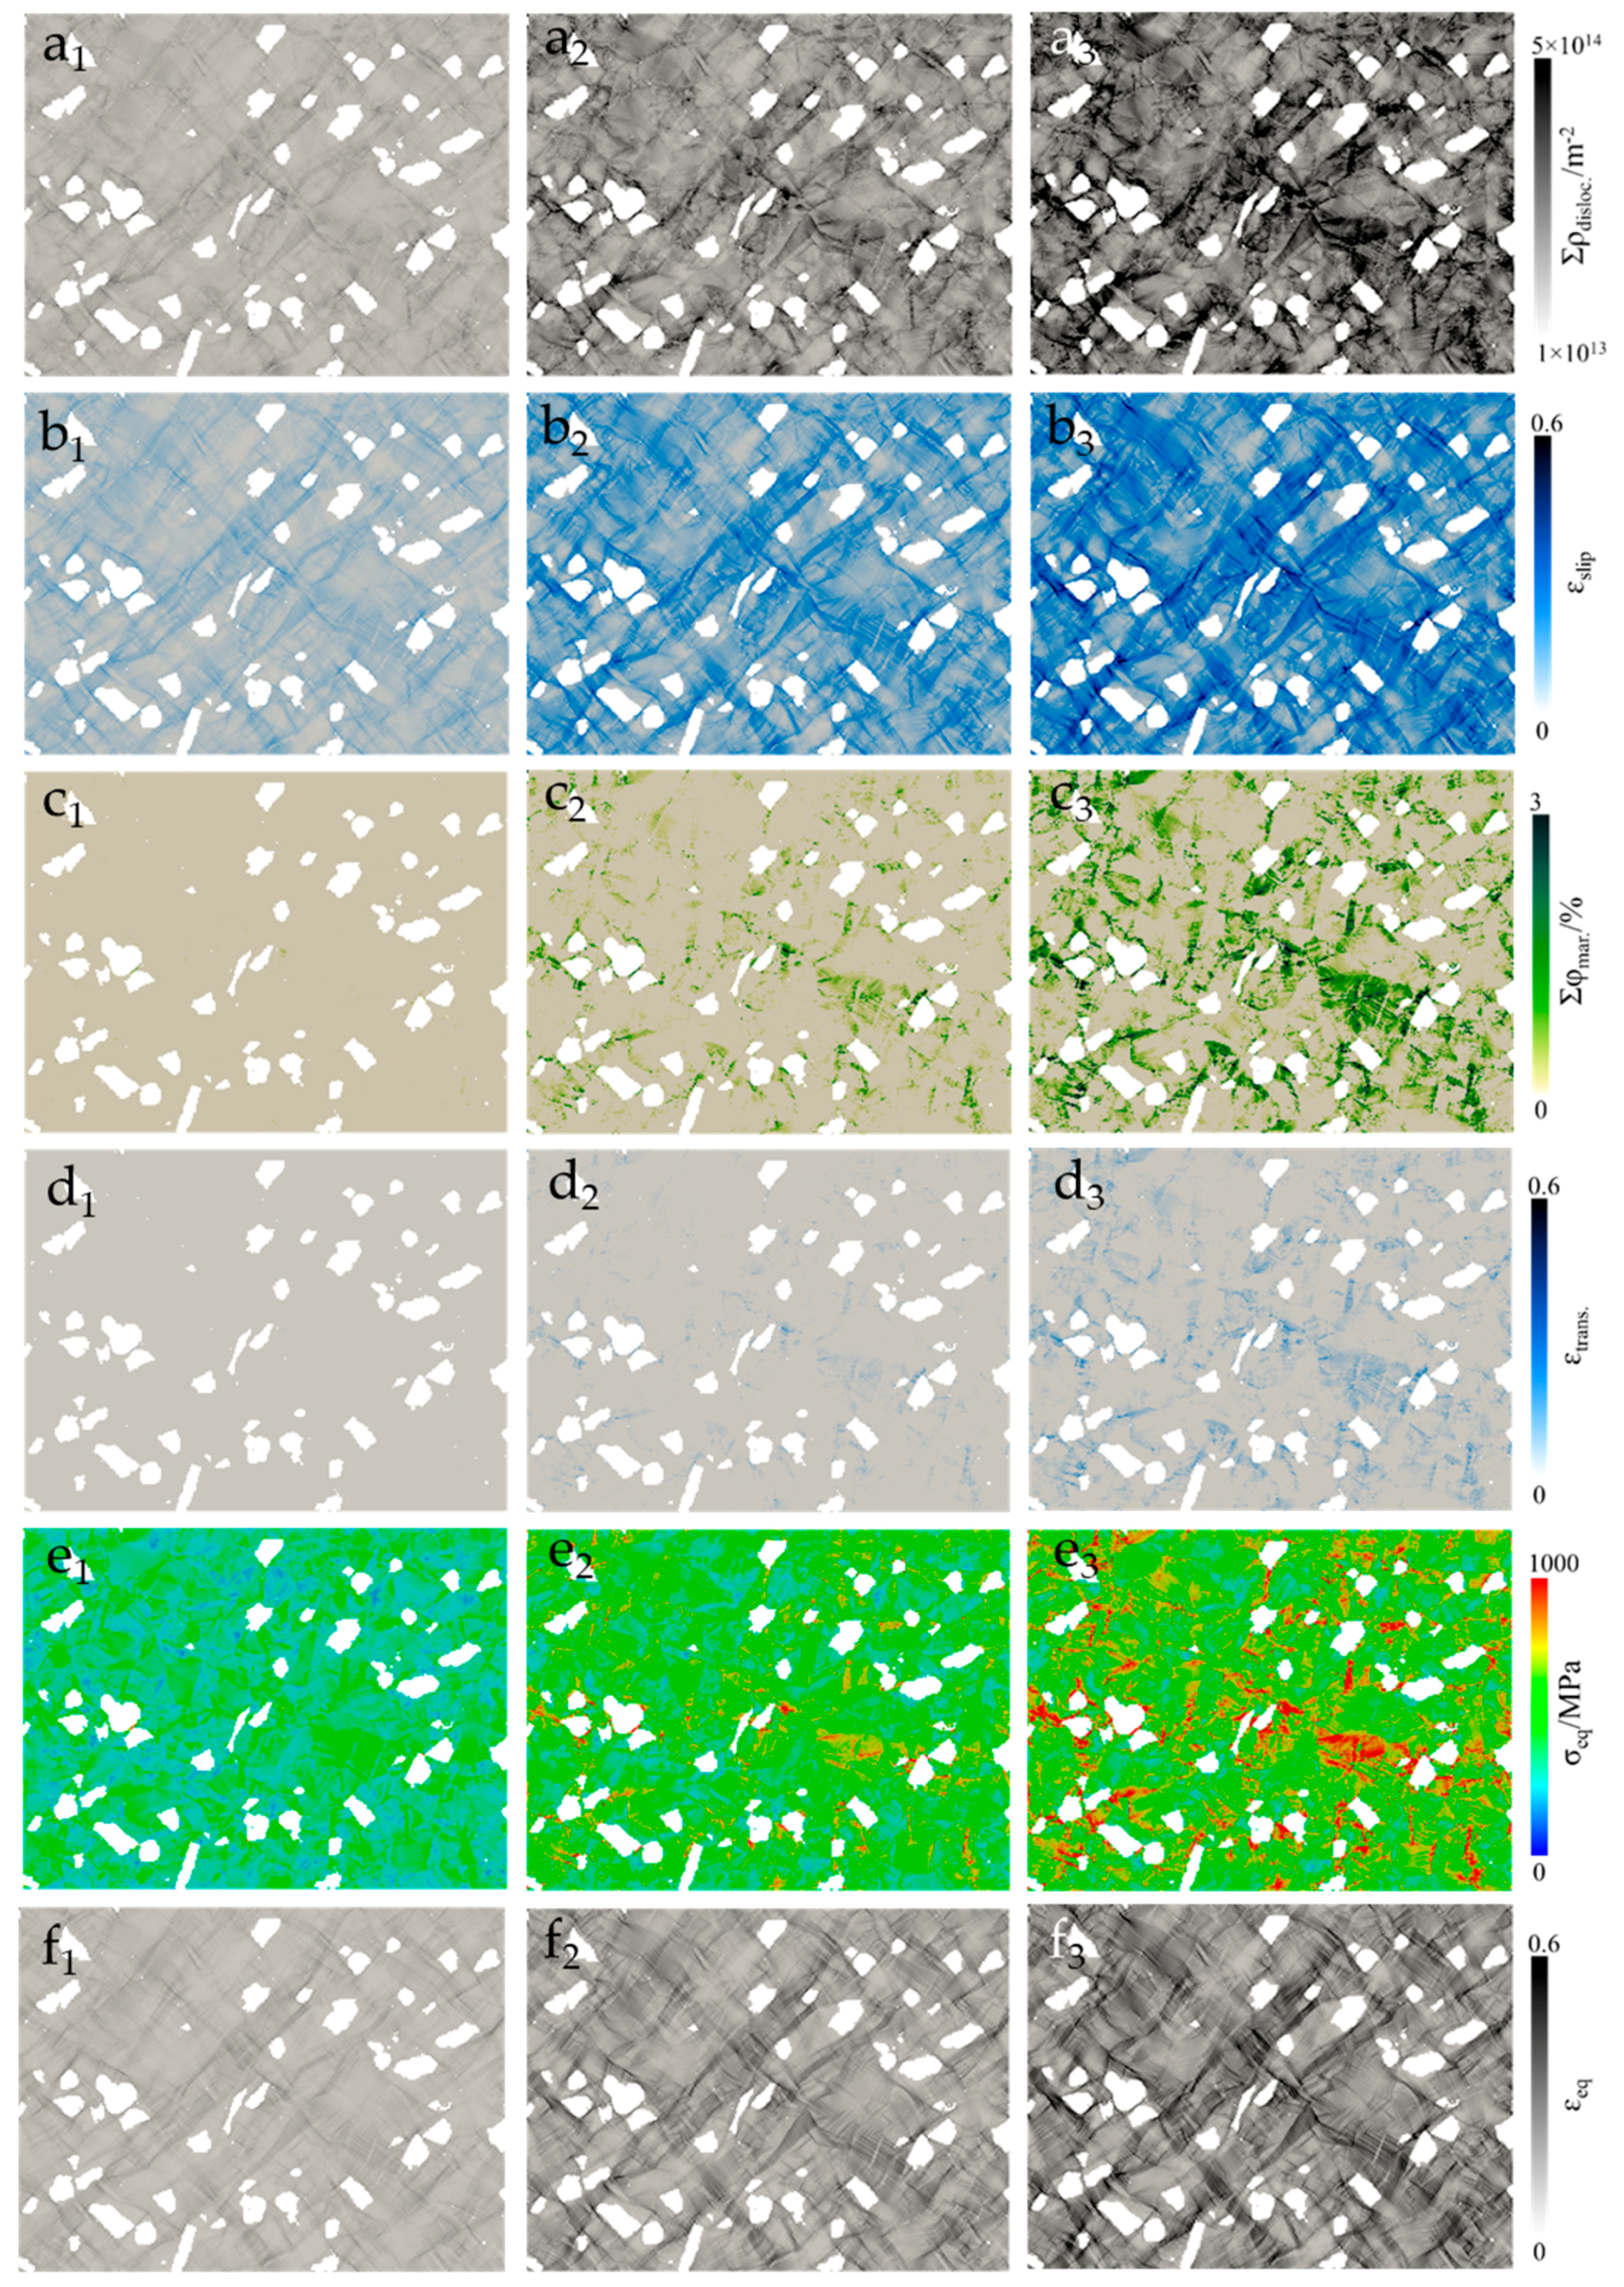
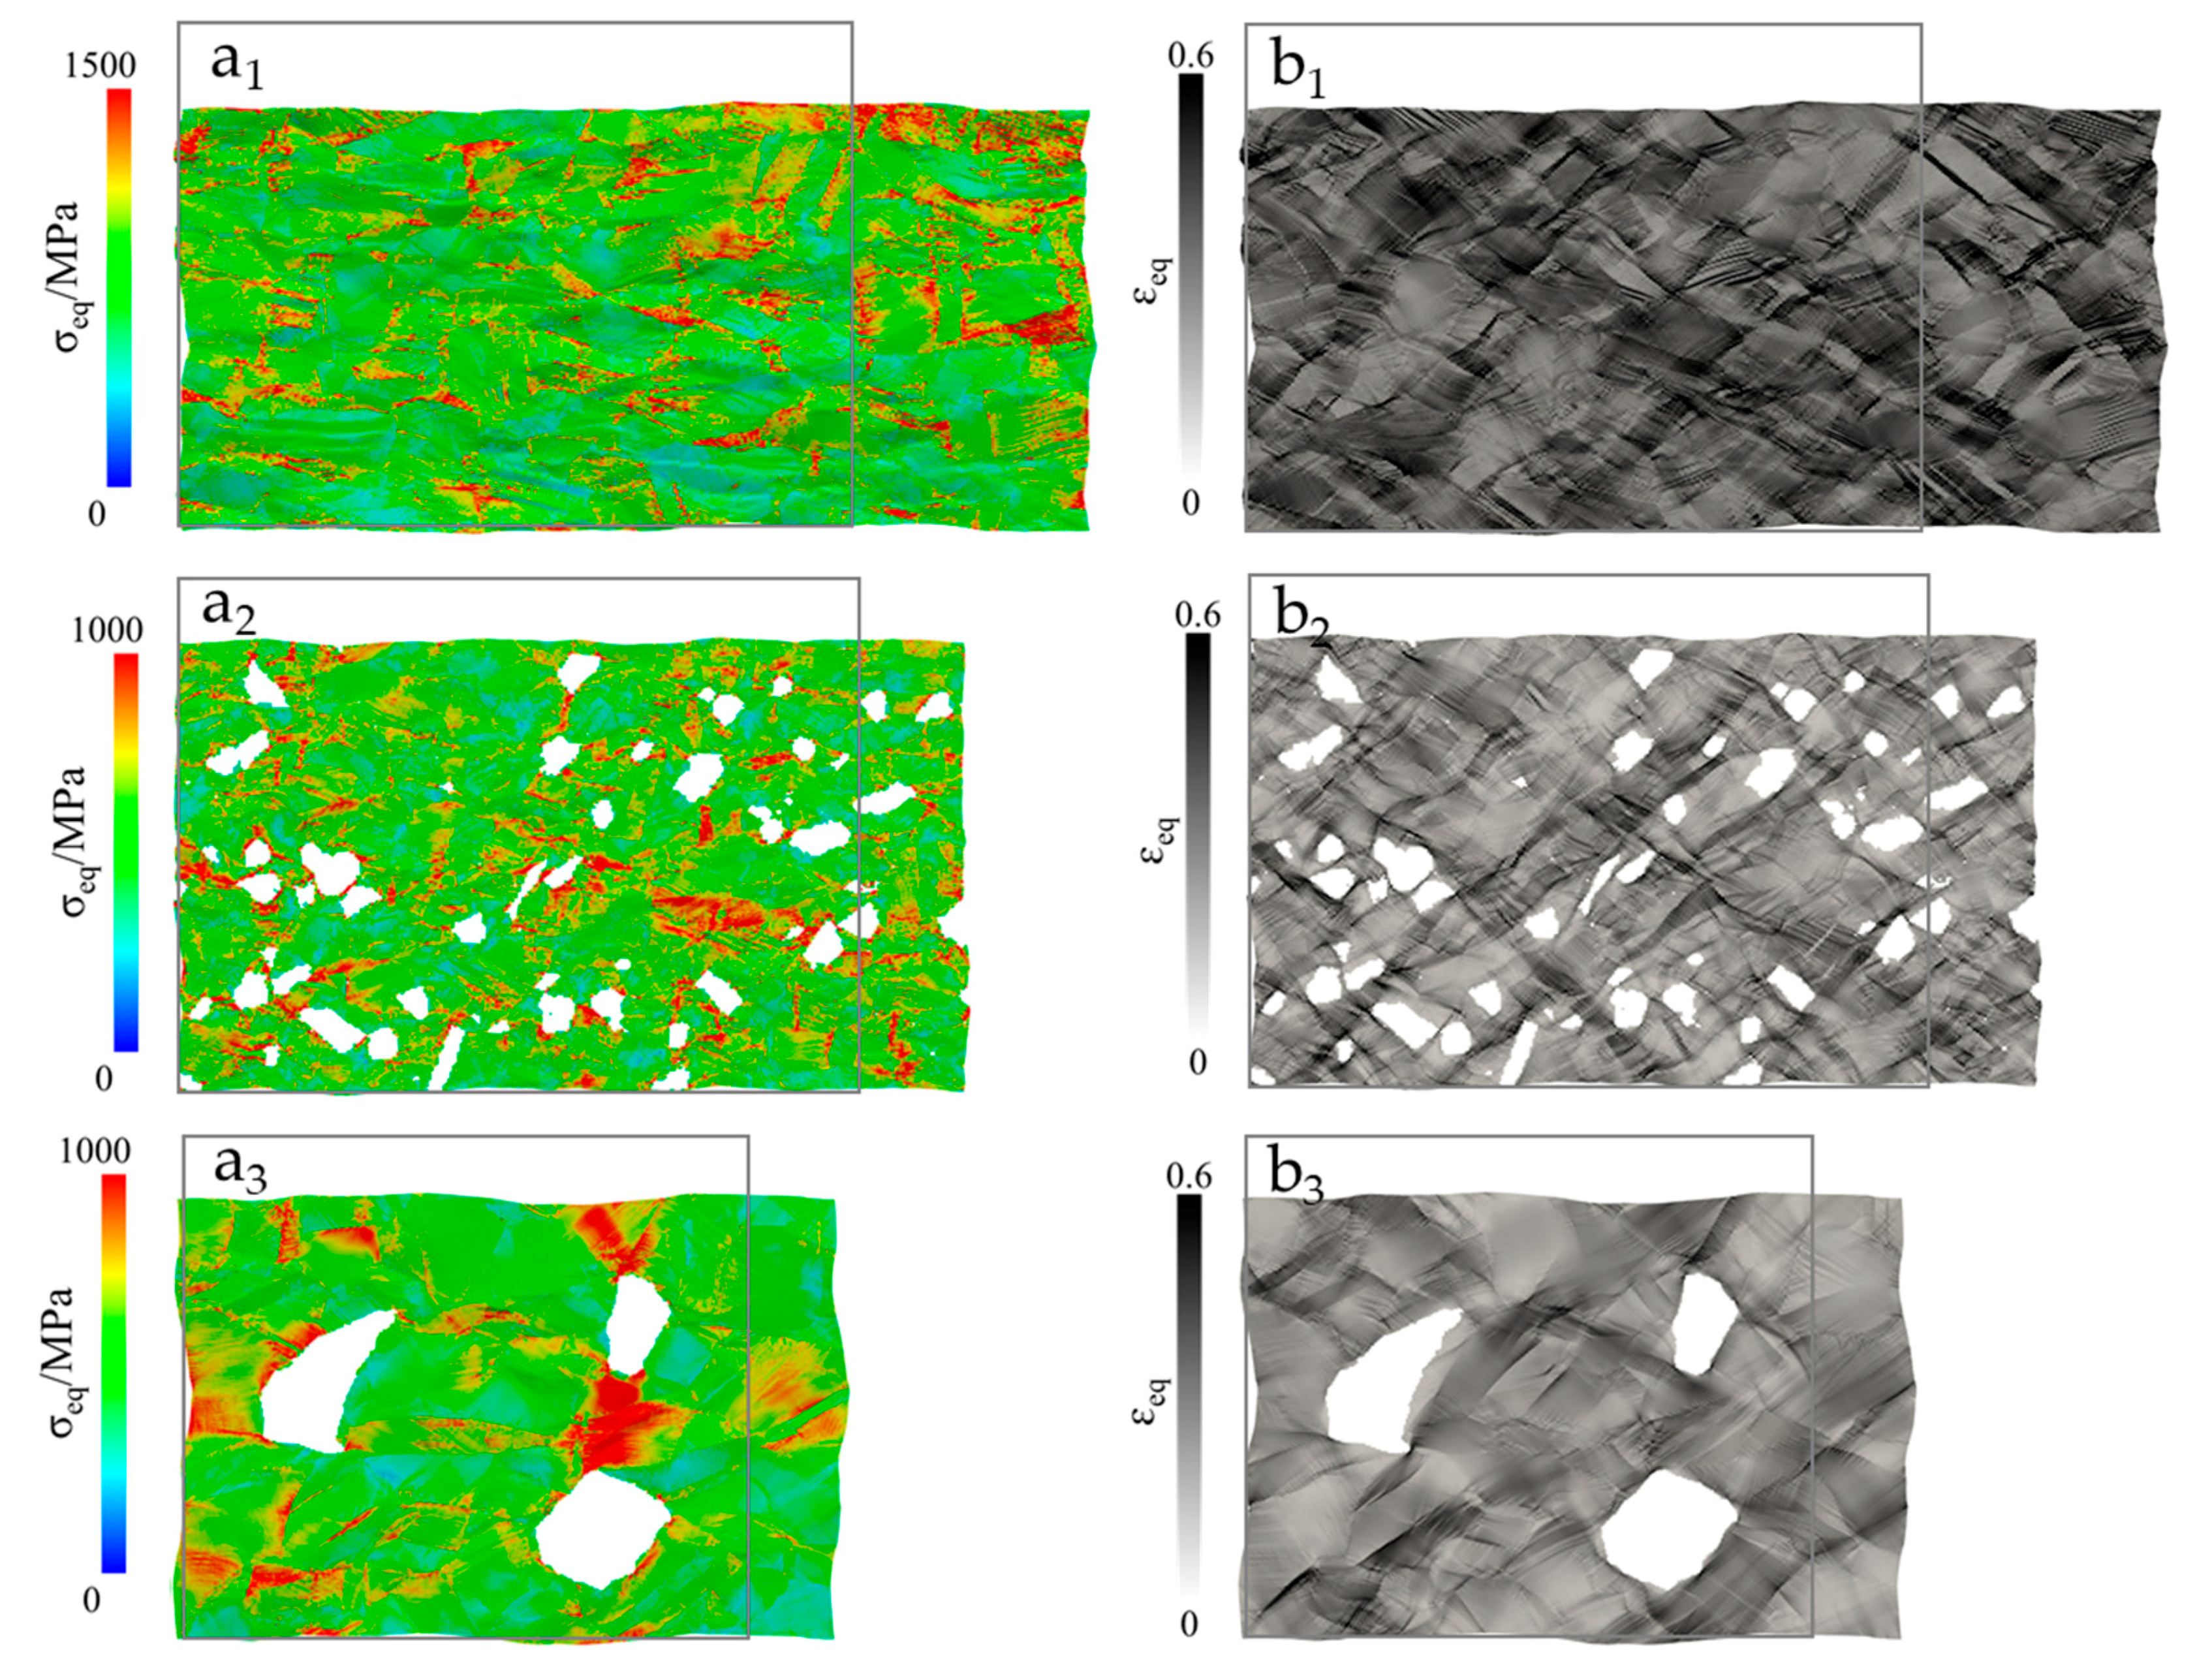
To better understand this phenomenon, the full phase simulation results of the 2D EBSD data of the composite with moderate and high magnifications were carried out. The results for the steel matrix are separated from the composite particles for better visualization of stress and strain partitioning in each phase. The results showing local evolution of the total dislocation density accumulated strain due to slipping in all planes, total martensitic volume percent, accumulated strain due to martensitic transformation, equivalent stress, and equivalent strain at 4%, 10%, and 16% of true strain are presented in
Figure 7 and
Figure 8a–f. It is observed that substantial heterogeneity in the local distribution of these parameters is present at the microstructural scale. The results of the steel matrix and zirconia particles are separately analyzed for better scaling and visualization.
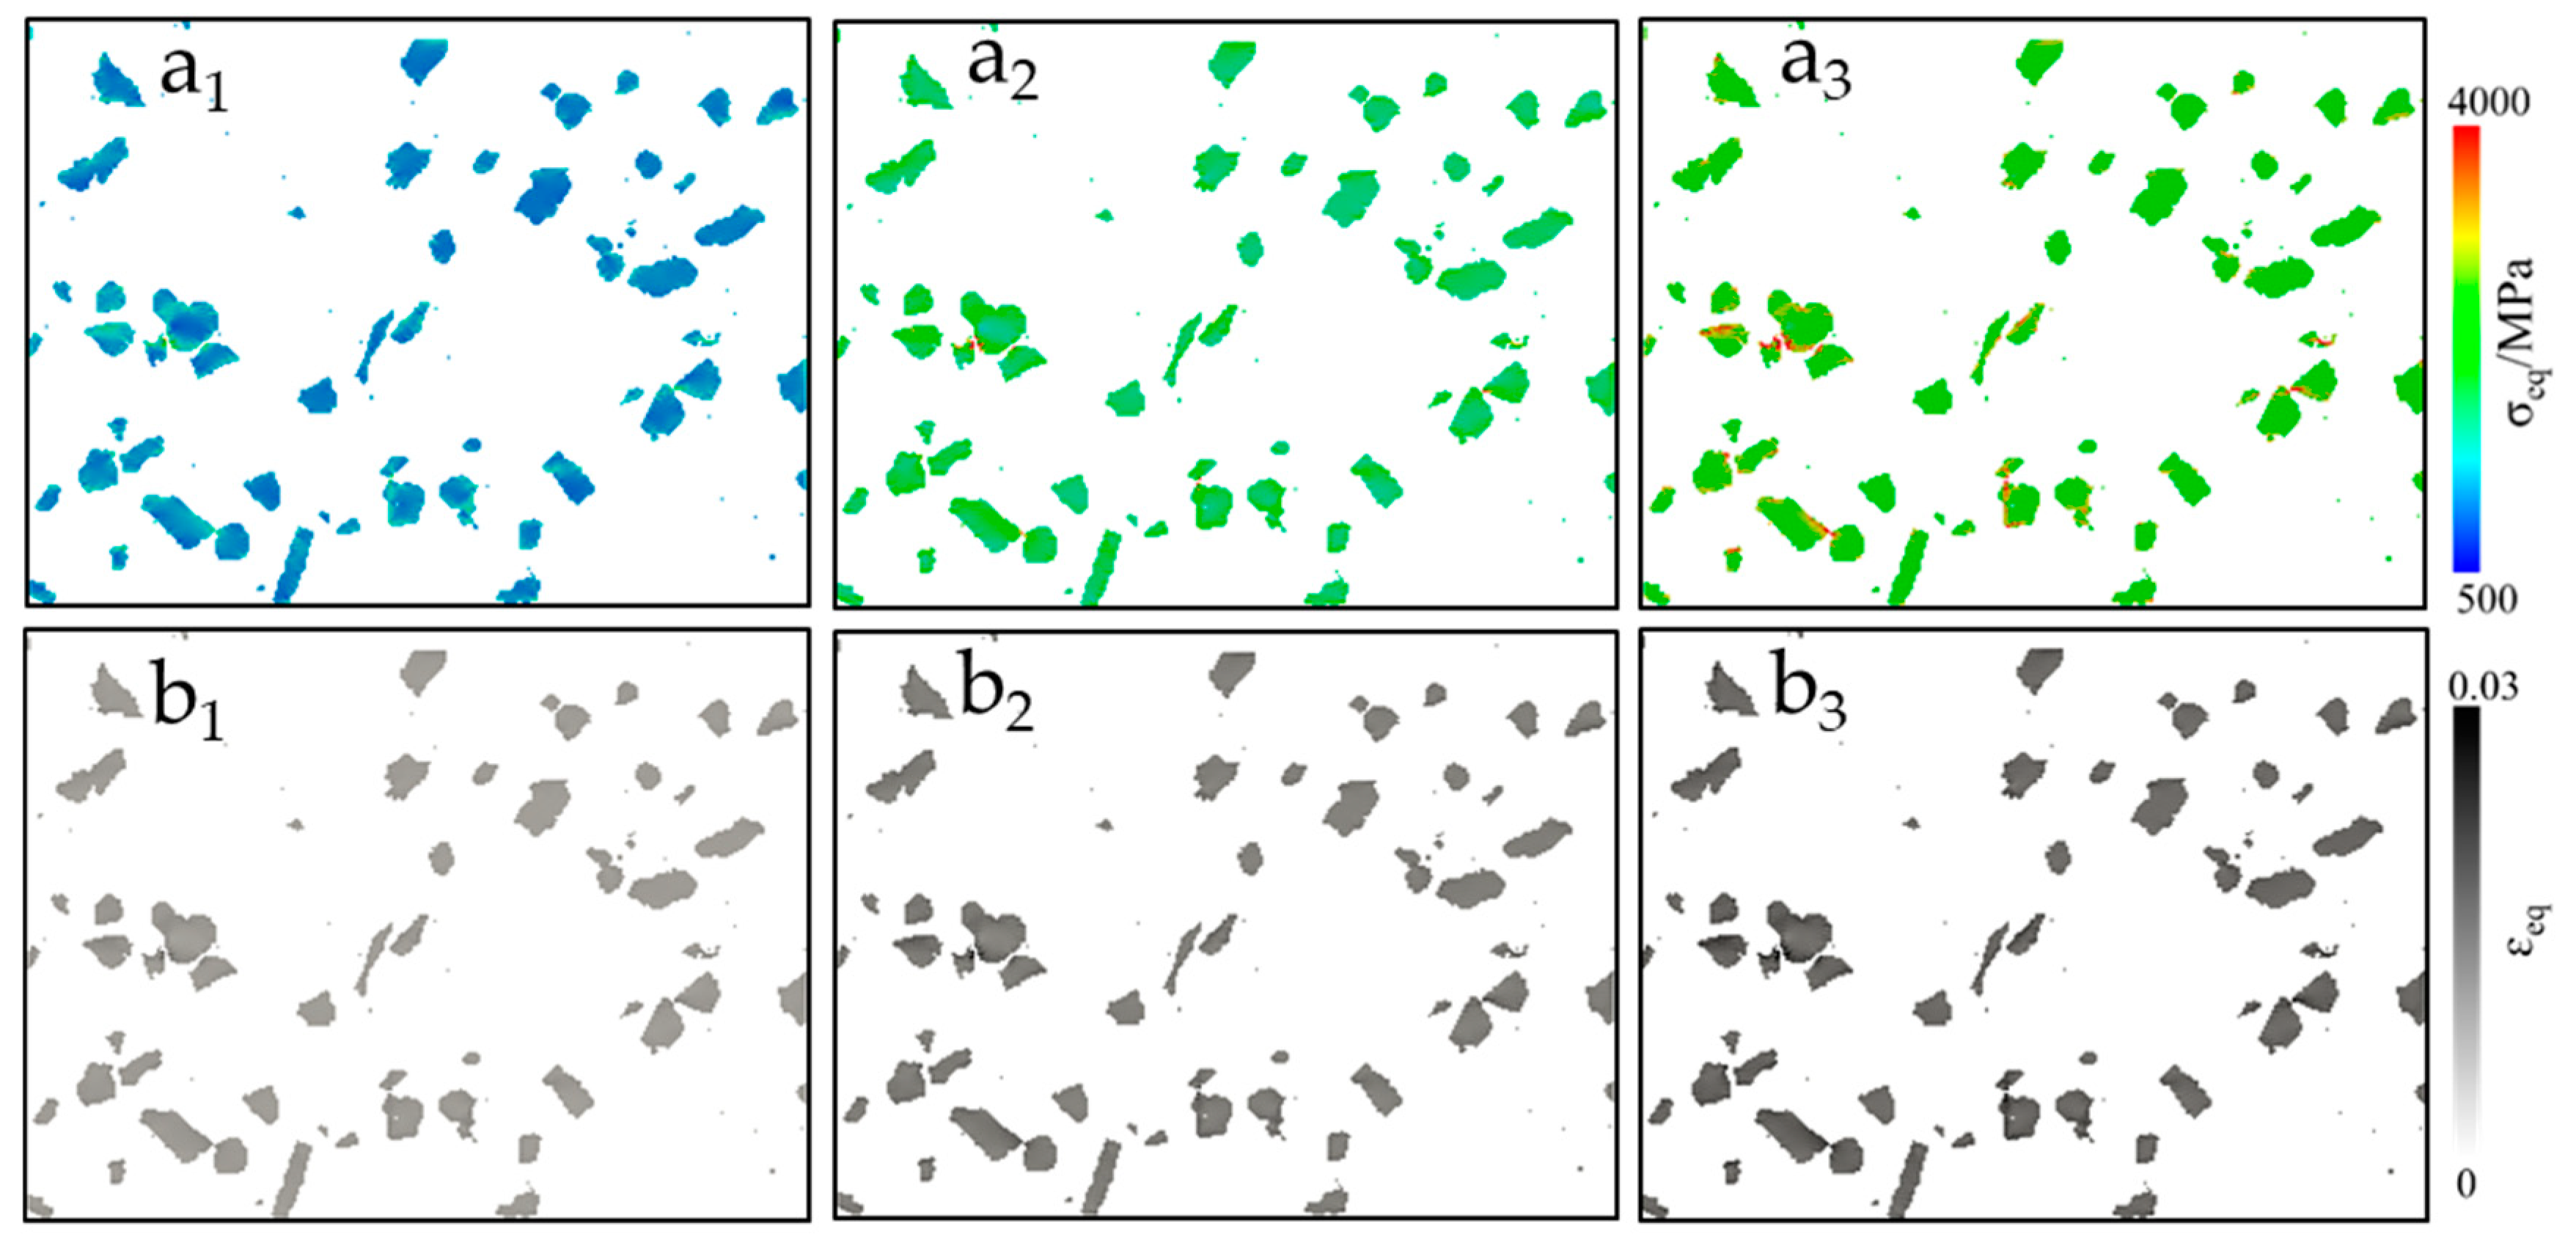
Zirconia particles in the composite, being highly stiff, are observed to carry most of the stress and undergo significantly less strain during the overall deformation of the composite, as shown in
Figure 7. Although the zirconia particles are assumed to be perfectly elastic in these simulations, it is observed in
Figure 7(a
3) at 16% of the global strain that the stress distribution inside the particles is heterogeneous. It is difficult to analyze this heterogeneity at low-magnification simulations. Therefore, a high-magnification simulation model was run to get a closer look at the overall parametric distribution in the microstructure at elevated strains.
Steel matrix in the composite, at room temperature, starts transforming into martensite around 7% of the true strain. This martensitic evolution reduces the available mean free path for the dislocation glide, and hence the dislocation pinning occurs near these martensitic islands. This increasing dislocation pinning results in higher dislocation densities, which further reduces the plastic flow of the material in these zones and results in the global hardening of the material. These zones with high transformed martensitic volume and high dislocation density also bear the highest amount of stress during deformation [
17,
18,
19,
48]. The evolution of dislocation density in the full phase model is shown in
Figure 8a. When compared with martensitic volume in
Figure 8c, it is observed that the high dislocation density zones and high martensite evolution zones are the same. It is seen that the dislocation density reached up to 5 × 10
14 m
−2 in areas of high martensite volume.
For a better understanding, the total strain component has been divided into its components. The strain due to twinning is neglected due to its small contribution. Total strain due to dislocation glide and strain due to martensitic transformation is plotted in
Figure 8b and
Figure 8d, respectively. It is observed that the primary contributing mechanism for the strain is dislocation glide the local map of strain due to accumulated shear due to slip in
Figure 8b corresponds well with the true strain map in
Figure 8f. In the 10% composite simulation, martensite starts evolving at around 7% of the true strain the material. It is observed that although martensitic transformation also contributes to the total stain in the material, the value is small. Moreover, those positions after transformation restrict the dislocation motion and hence are observed in areas with low total strain and high total stress.
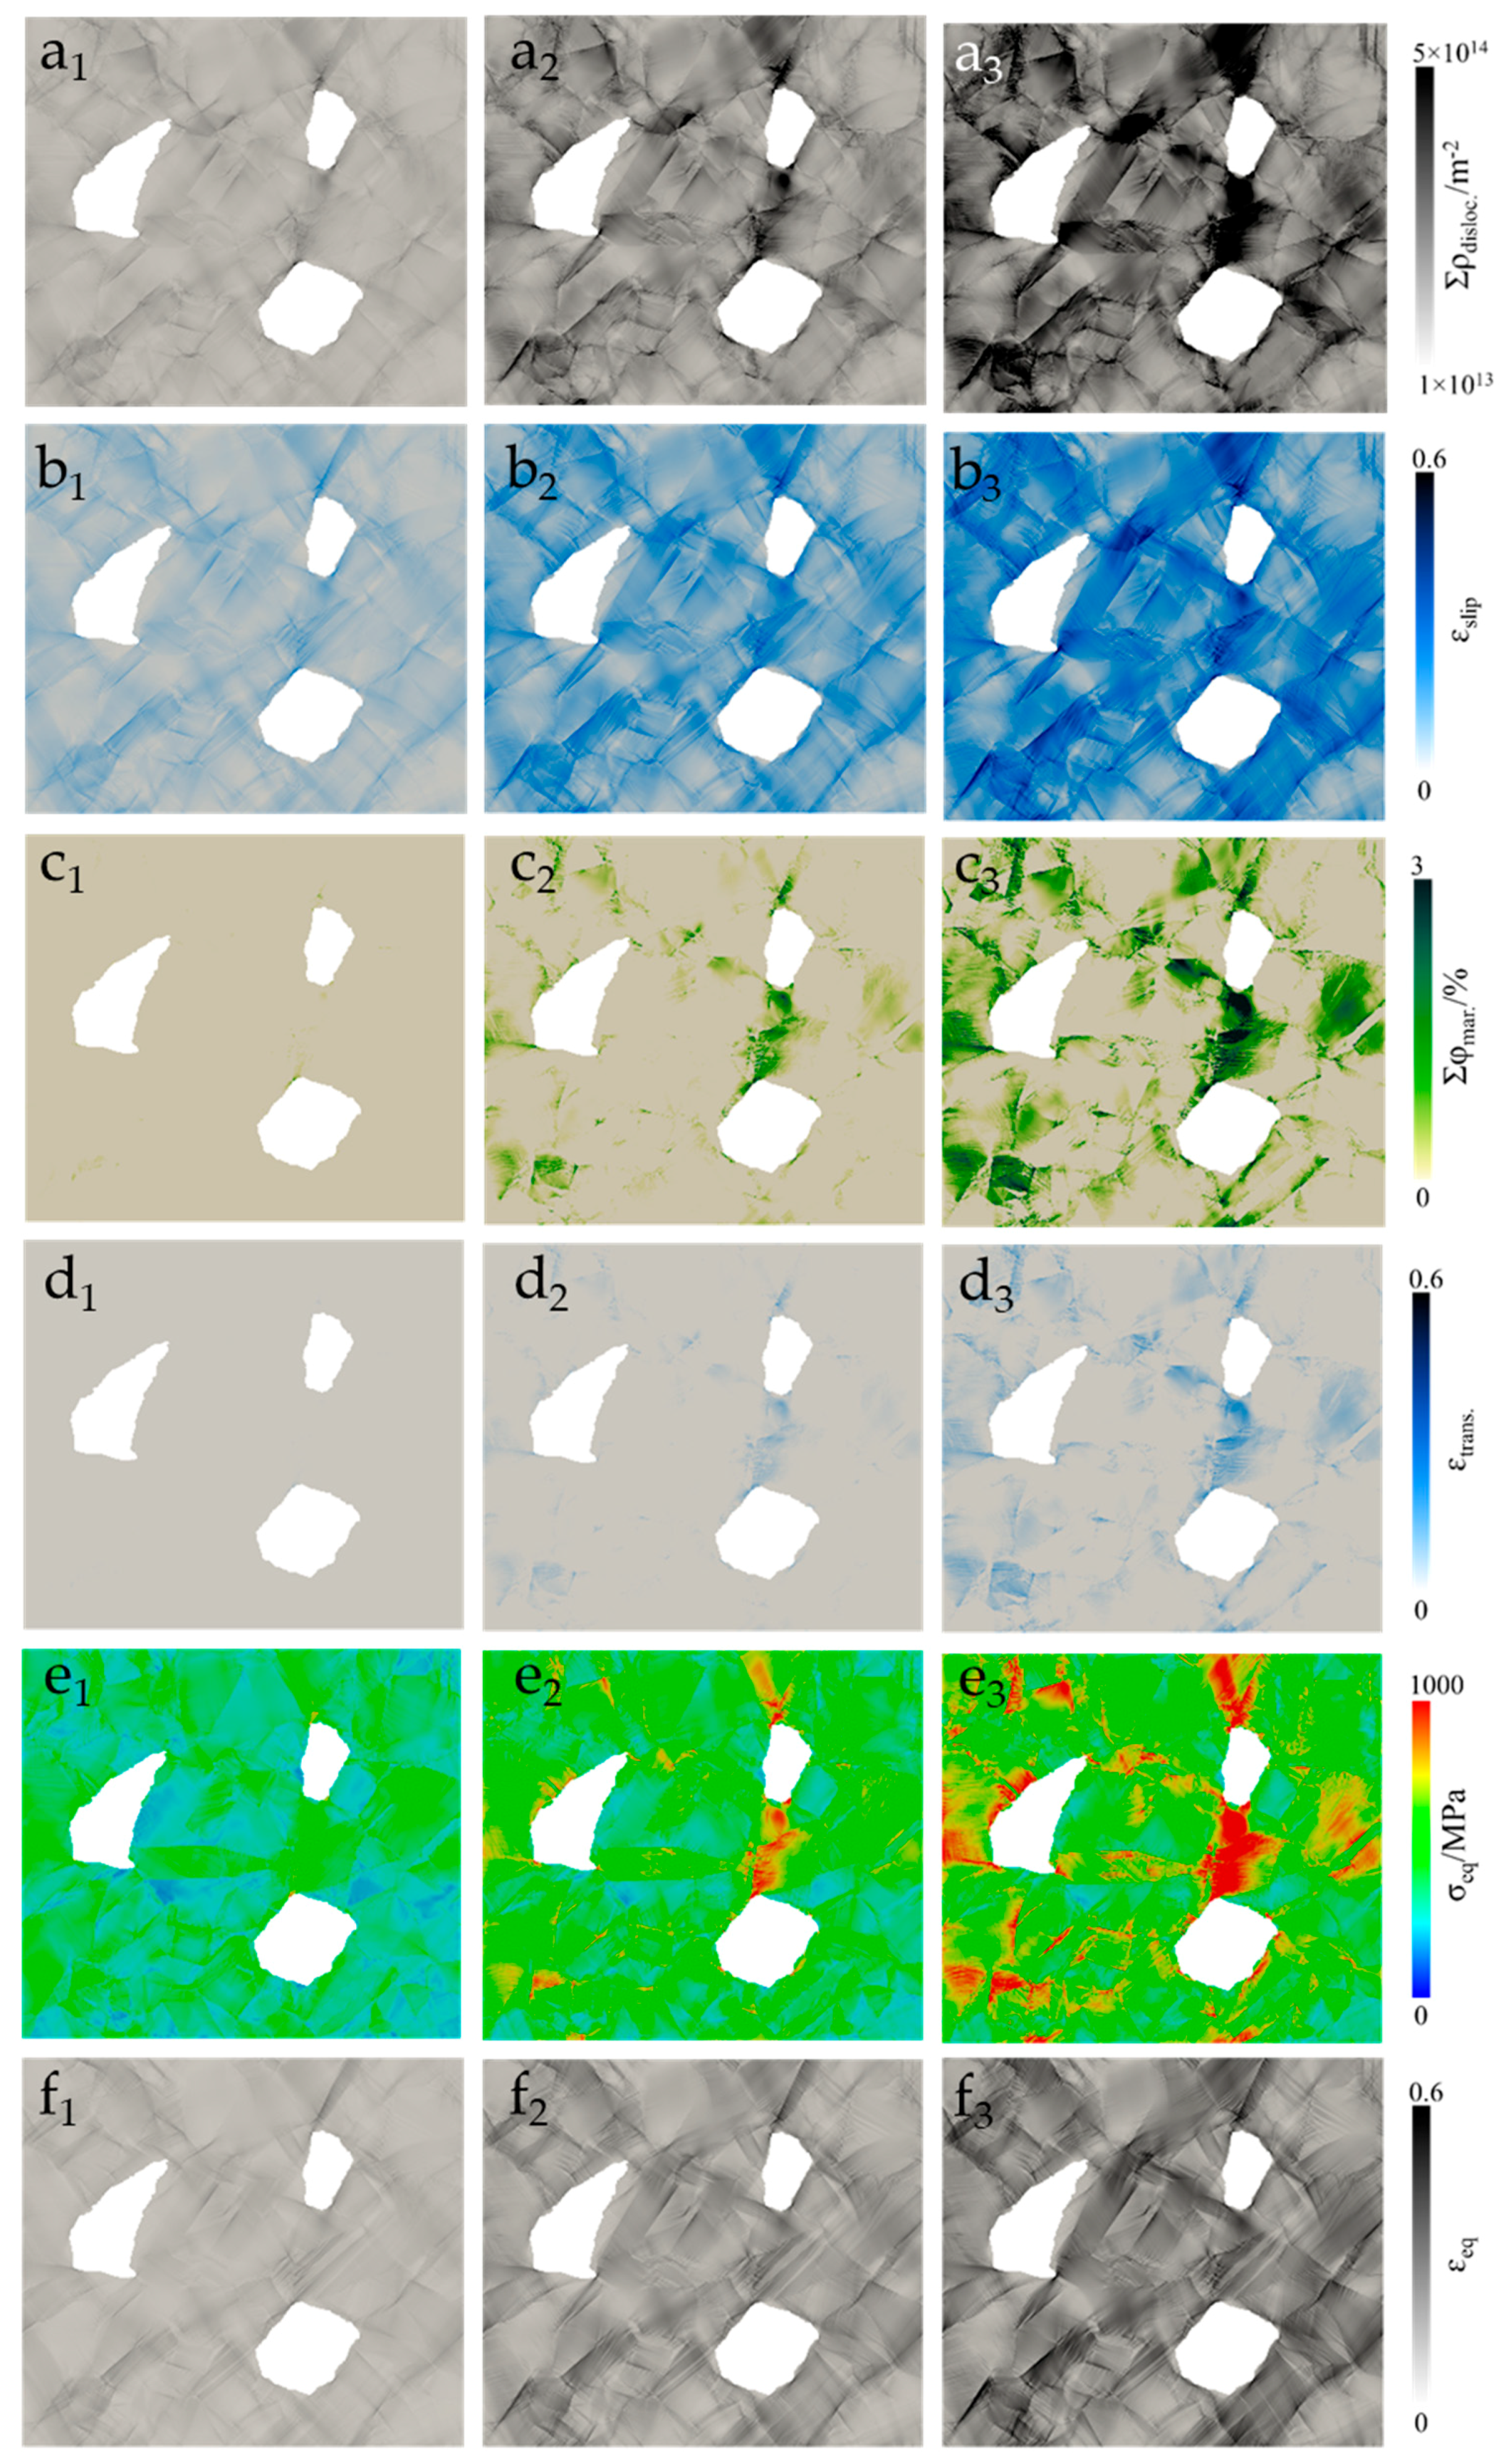
In the high-magnification simulation model, it is observed that martensite formation in the TRIP steel occurs close to the ceramic particles and at the ceramic/matrix interface, as shown in
Figure 9c. The degree of plasticity in the austenite grains above and below a ceramic particle depends on the crystal orientation, dislocation motion, and stacking fault generation. Consequently, more dislocations are generated, or glide systems of higher-order are activated in the favorably oriented grains near the TRIP steel/ceramic interfaces. Hence, an enhanced martensite formation is observed in such regions with a concentrated strain. A different situation is seen at the flanks of the Mg-PSZ particles (
Figure 5), where the deformation in the TRIP steel is limited by the strain in the ceramic particle. In these regions, the martensite formation is retarded. The martensitic evolution leads to dislocation pinning and increased dislocation density in these regions, as shown in
Figure 9c. In the steel, matrix martensite bears the most stress.
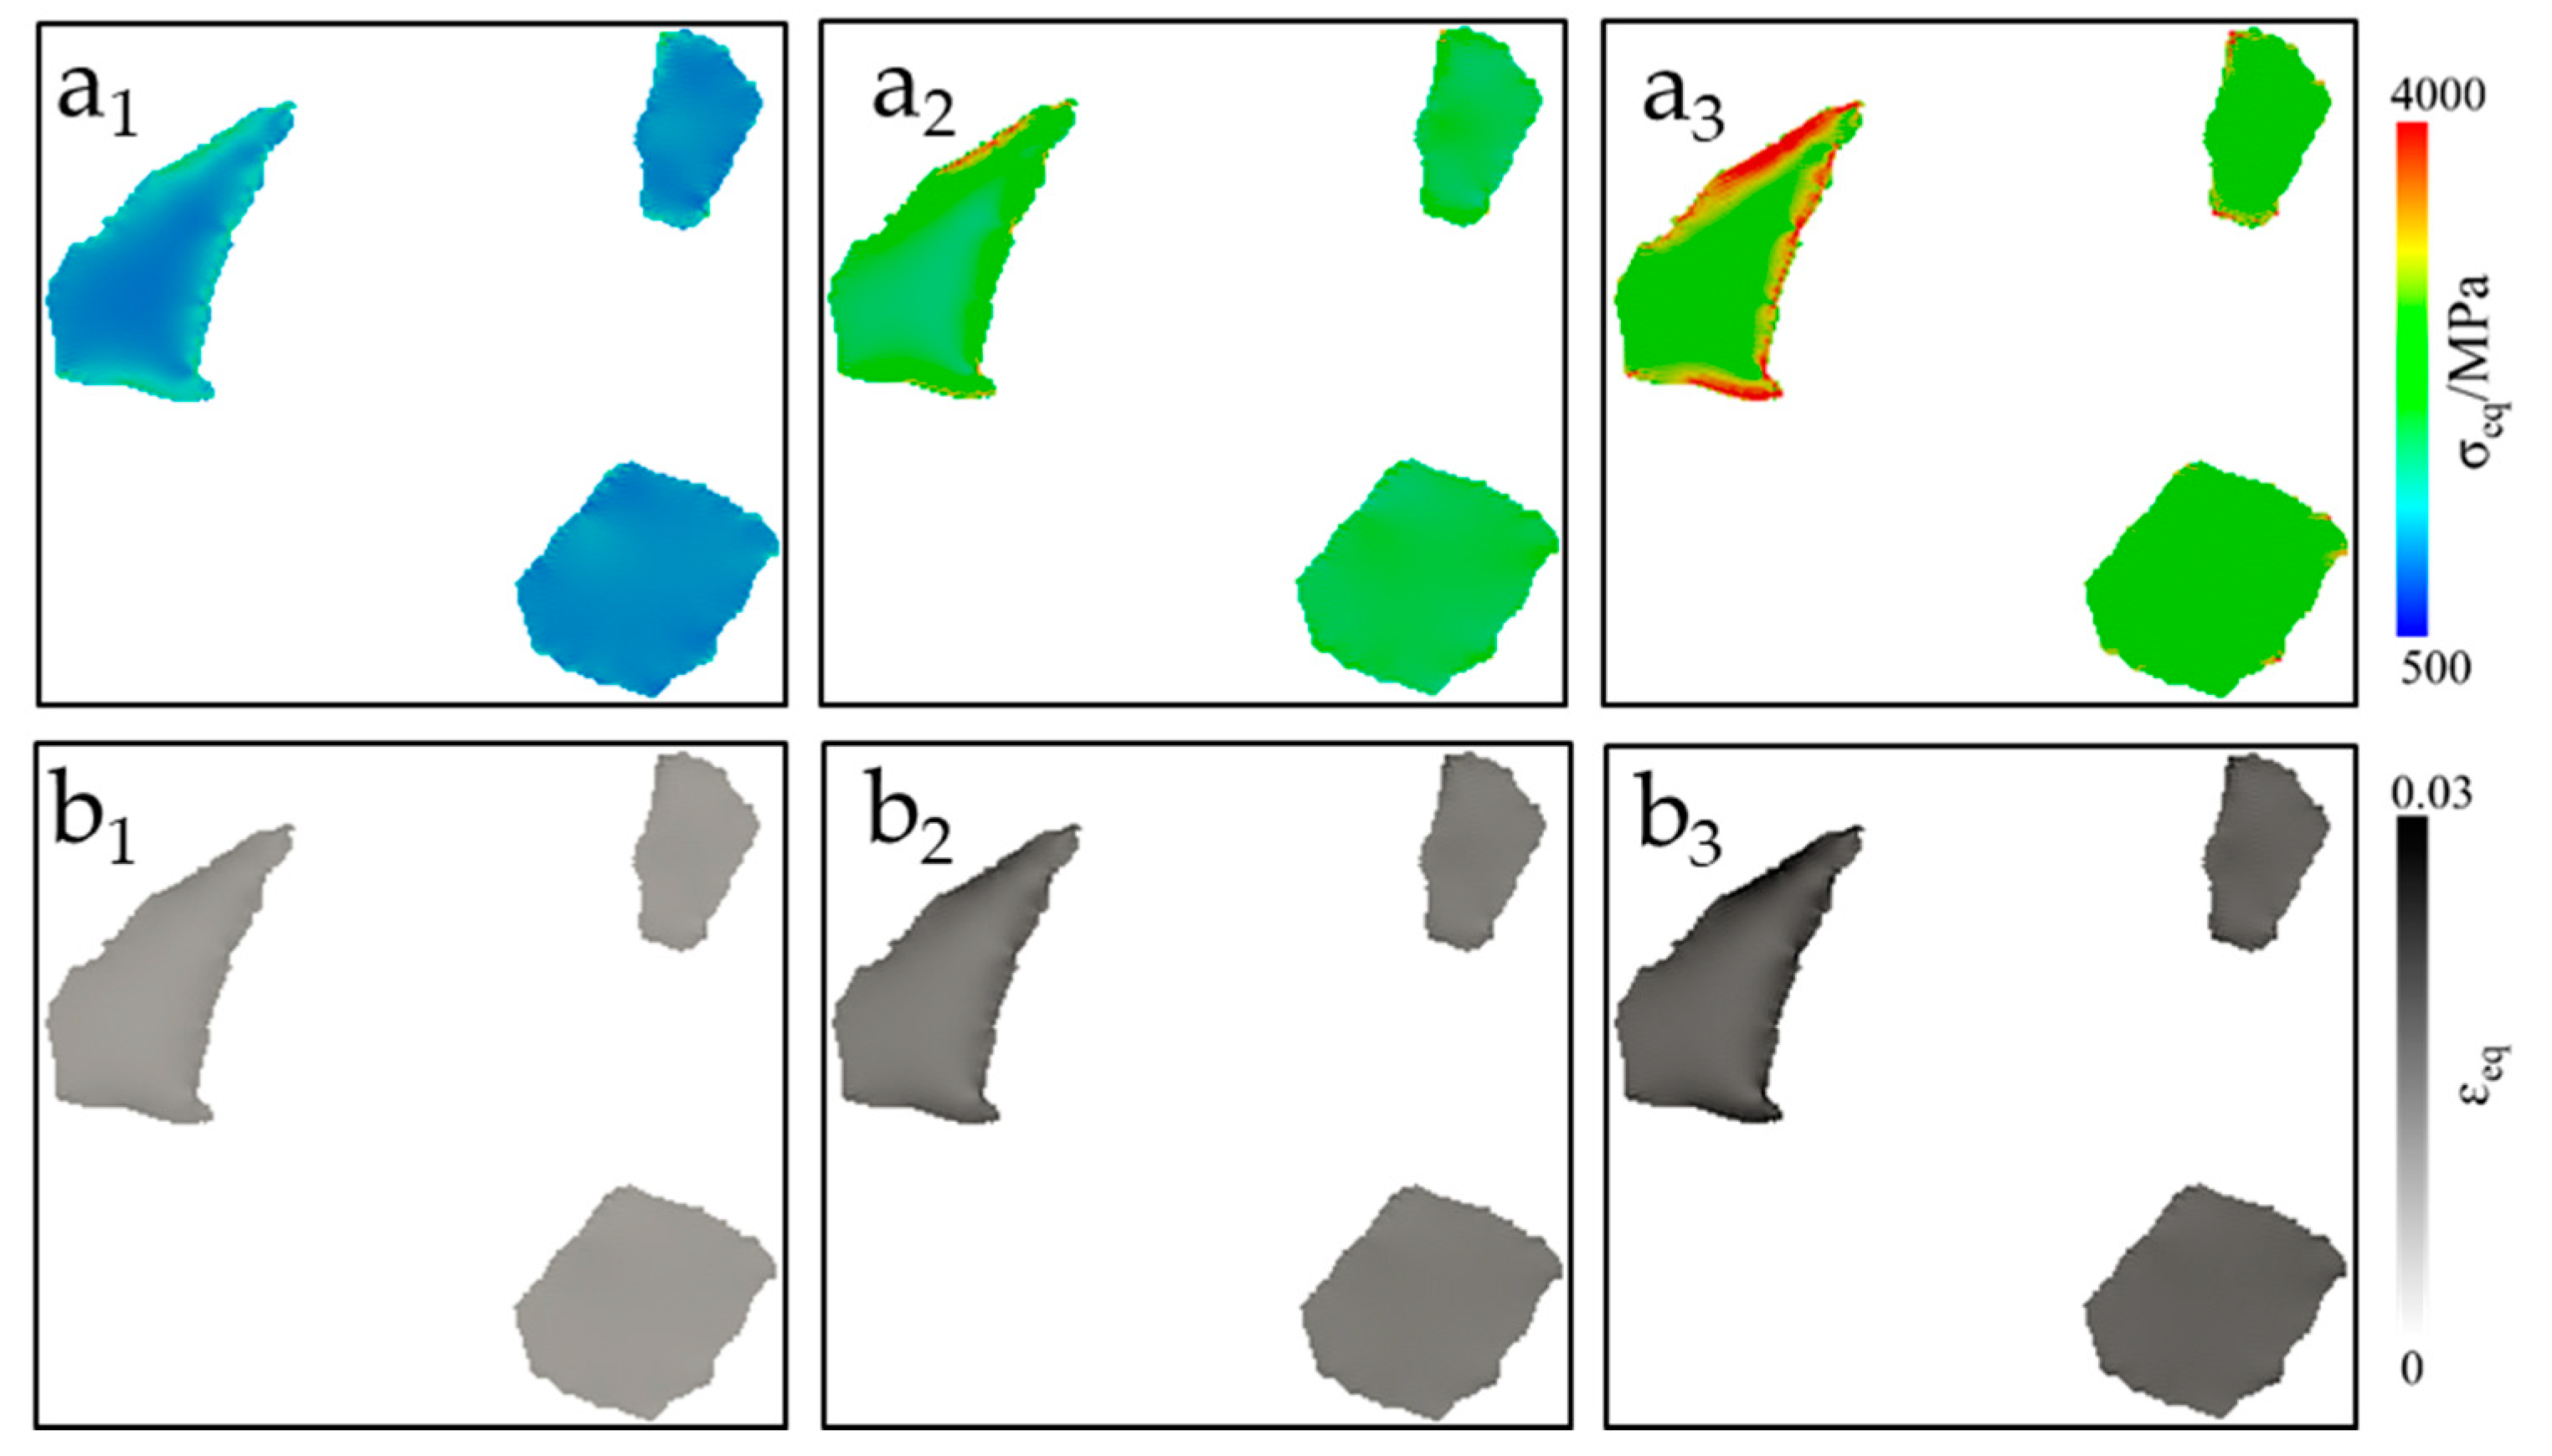
Due to the higher fracture strength of the ceramic particles compared to the low yield strength of the austenitic steel, the applied strain is absorbed mainly via the plastic deformation of the TRIP steel, and minor strain occurs in the zirconia particles, as shown in
Figure 10b. The local stress distribution in the zirconia particles is very high compared to the steel matrix, yet the distribution is not homogeneous. In
Figure 10(a
3), it is observed that the stress evolution in the zirconia particle is higher near the interface. This heterogeneous distribution of stress in zirconia particles is due to three reasons. Firstly, it is due to a variation in the orientation distribution assignment (see
Figure 2(a
1,b
1)). Secondly, it is due to dependence on the neighbor grain orientations. Thirdly, it is due to dependence on particle size.
The simulation results reveal how the orientation, size, and neighborhood of a grain largely influence the martensitic evolution in TRIP steels and composites. This evolution is further facilitated by the presence of ceramic particles inside the matrix, which act as barriers for free dislocation motion. The dislocations start accumulating on the edges of zirconia particles, preferably perpendicular to the applied load, resulting in high local strain accumulation.
To put deformation into perspective,
Figure 11 represents the deformed stress and strain geometries of all simulated RVEs in comparison with initial geometry (grey outline). The presented deformed states are scaled to 100% deformation.
7. Discussion
In this research, the already developed TRIP/TWIP material model for high manganese steels was adopted and calibrated using a small size benchmark RVE of 10 × 10 × 10 units containing 1000 elements having randomly assigned orientations for the medium alloyed X8CrMnNi16-6-6 TRIP steel. The physical parameters were adopted from literature, and fitting parameters were calibrated by comparing the stress/strain behavior of the tuned material model with experimental observations. The comparison reveals a good fit of stress/strain and twinning volume percent data with <1% error. But regarding the martensitic volume percent, the simulation model slightly under predicts the evolution for low strains but nicely captures the trend for higher strain values. This mismatch is possibly due to a slight error in the ferritoscope measurements.
The strain due to individual phenomena, when compared with acoustic emission data, shows that the trends from the experimental and numerical techniques are comparable. However, quantitatively, there is a slight mismatch in the values. It is still unknown if the simulation trend is better or the AE data as the signal measurement and clustering is an approximate technique and can yield varying results depending on subjective choices. Given the accurate output of the simulation model when comparing the stress/strain and transformation behavior in
Figure 3a, a deviation in the amount of strain due to individual phenomena when compared with AE data is unlikely. The analysis of this deviation needs further detailed study with critical AE data measurement, clustering, and analysis, which is a task for future research.
The calibration and validation of fitting parameters for such models is a big challenge these days as a model can yield the same results by using an infinite number of fitting parameter combinations where each combination will yield effective minima of the correlation function. It is evident that the demonstrated simulation model and the in-situ AE analysis complement each other and should be combined in future studies to get a better insight into the local material behavior. Combining AE with such detailed crystal plasticity models can be very helpful in the accurate calibration or validation of fitting parameters for many different deformation phenomena occurring at the same time. The method can also help obtain a unique solution regarding fitting parameter identification. This has been conclusively demonstrated in this research.
The tuned material model for steel with minor modification was adopted for the simulation modeling of 10% composite. Due to the consideration of plain stress condition and non-periodic EBSD data used for simulations, the results of the study cannot be quantitatively accurate and need careful attention for a comparative qualitative discussion. Due to non-periodicity, the stress/strain evolution on the RVE edges is ignored. It is observed in the case of steel and composite that localized plasticity initiates in austenitic grains more favorably aligned in the deformation direction to load. The deformation propagates in the form of narrow strain bands throughout the microstructure. More interestingly, nearly undeformed regions are observed in between these highly strained zones and narrow strain bands, even at high average strain levels (
Figure 5(f
3)). Thus, it appears that the full strain hardening capacity of the microstructure is not exploited during the deformation. In the case of the composite depending upon the ceramic particle distribution, the heterogeneity of plastic strain accommodation differs.
It is observed that the results of stress/strain and transformation are accurate for the steel matrix. Still, the simulation model over-predicts the transformation in the matrix by 51% in the case of the composite. This can be due to the assumption of an ideal steel/matrix interface taken for simulations, which acts as a source of high dislocation density and transformation initiation site. Whereas, in reality, this interface is fragile, and the interface decohesion of some particles has been reported to start at as low as 1.6% of the global strain [
47,
49,
50,
51,
52,
53]. This needs further investigation in future research by modeling the ceramic/matrix interface in the simulation model and comparing the results.
The reinforcing mechanism of Mg-PSZ particles in highly-alloyed TRIP steel was studied experimentally by Martin et al. in detail [
32]. The results obtained in the current analysis for high-magnification simulation correspond well with his experimental observations. It is observed that the transformation occurs mostly at the poles of the zirconia particles if the austenitic grain orientation is more favorable. In the steel matrix, the deformation due to dislocation motion starts with the applied strain and generally increases with increasing strain. Martensitic evolution in the matrix starts around 8% of global stain and increases linearly.
The simulations were run for medium magnification geometries in case of steel and composite for the better overall analysis, and a high-magnification simulation was run for the composite for detailed local analysis. Such a methodology of decoupled low- and high-magnification analysis helps reduce the computation time significantly. The correct identification of the parameters and the calibration of the model for this specific material class can help researchers in better understanding and prediction of the material behavior; hence, it will improve the chances of cost-effectively tuning the material properties for particular applications.
8. Conclusions
In this research, the TRIP/TWIP material model already developed in the framework of DAMASK is tuned for X8CrMnNi16-6-6 TRIP steel and 10% Mg-PSZ composite. A new method to more accurately tune this material model is explained by comparing stress/strain, transformation, twinning, and dislocation glide obtained from simulations with experimental acoustic emission measurements. The calibrated model for a steel matrix with slight modification is used to model a 10% Mg-PSZ composite matrix. In the simulation model, zirconia particles are assigned elastic properties with a perfect ceramic/matrix interface. The local deformation, transformation, and twinning behavior of the materials due to quasi-static tensile load were analyzed. The global simulation results were compared with experimental observations, and the full phase simulations were run to on 2D EBSD maps to see the evolution of local stresses, strains, and transformation in the microstructure. The research can be concluded as follows:
The developed material model with identified fitting parameters presented in this research and for the X8CrMnNi16-6-6 TRIP steel matrix and 10% Mg-PSZ composite can accurately predict the deformation behavior of steel matrix and ceramic particles with less than 2% error.
The individual deformation phenomena of dislocation glide and transformation in the steel matrix for the current model correspond well with in-situ AE analysis data and help in associating the number of AE events with physical attributes.
There is considerable heterogeneity in dislocation motion and strain evolution in the steel matrix with or without ceramic particles, which results in intense stress partitioning.
Most of the local strain evolution in the steel matrix is due to dislocation motion, and the strain due to partial dislocation motion or transformation is significantly less, contributing very little to the overall strain in the material.
It is observed that the zirconia particles take the most stress and undergo significantly less strain during deformation, which leads to high stress/strain partitioning at the ceramic/matrix interface, which is the possible reason for interface decohesion in this material.
The model and the methodology presented here for full phase simulation modeling is a useful tool for assisting development and microstructural optimization of cast X8CrMnNi16-6-6 TRIP steel 10% Mg-PSZ composites due to an improved understanding of the phenomena at the microstructural level accurately. Further research is needed to establish a relationship between AE data and numerical simulation results. Similar to global deformation behavior, validation of the local deformation behavior of steel and composite will be carried out in the future by comparing the results of in-situ deformation tests.


