Article

Effect of the Fluorine Substitution for –OH Group on the Luminescence Property of Eu3+ Doped Hydroxyapatite

State Key Laboratory of Advanced Technology for Materials Synthesis and Processing, Biomedical Materials and Engineering Research Center of Hubei Province, Wuhan University of Technology, Wuhan 430070, China
*
Author to whom correspondence should be addressed.
Crystals 2020, 10(3), 191; https://doi.org/10.3390/cryst10030191
Submission received: 6 February 2020 / Revised: 26 February 2020 / Accepted: 5 March 2020 / Published: 10 March 2020
(This article belongs to the Special Issue Rare Earths-Doped Materials)

Abstract

:
In this study, different fluoridated hydroxyapatite doped with Eu3+ ion nanoparticles were prepared by the hydrothermal method. The relationship between luminescence enhancement of Eu3+ ions and a fluorine substitution ratio for hydroxyl group in hydroxyapatite was discussed. Moreover, the effect of fluorine substitution for a hydroxyl group on phase composition, crystallinity, and crystal size was studied. Phase composition and chemical structures were identified by X-ray diffraction (XRD) and Fourier Transform Infrared (FT-IR) Spectroscopy analyses. Scanning Electron Microscopy (SEM) and Transmission Electron Microscopy (TEM) patterns were performed to analyze the morphology and particle size. X-ray Photoelectron Spectroscopy (XPS) patterns were observed to analyze fluorine substitution for the hydroxyl group and chemical state of Eu3+ ions in fluoridated hydroxyapatite. The results of these experiments indicated that the samples with a different fluorine substitution ratio were prepared successfully by maintaining the apatite structure. With an increasing fluorine substitution ratio, the morphology maintained a rod-like structure but the aspect ratio tended to decrease. XPS patterns displayed that the fluorine replaced the hydroxyl group and brought environmental variation. The fluorine ions could affect the crystal field environment and promote luminescence conversion. There was a linear relationship between the fluorine substitution ratio and luminescence enhancement.

1. Introduction

Hydroxyapatite (Ca10(PO4)6(OH)2), which is also known as HAp, is the main inorganic ingredient of hard tissues similar to its mineral constituents [1,2,3], which have outstanding biocompatibility and bioactivity [4,5]. Meanwhile, HAp crystals are good host material for doping of rare earth (RE) ions, and the doped HAp such as Eu:HAp [3], Eu/Tb:HAp [6], and Eu/Dy:HAp [1] display unique luminescence properties under excitation of a specific wavelength. Moreover, the RE ions doped HAp nanoparticles have better features as luminescence imaging agents including low toxicity, photostability, thermal and chemical stability, and real-time imaging [4,7,8,9]. Their luminescence imaging ability is affected by a degree of crystallinity, size distribution, and dispersion of nanoparticles as well as crystal field contributions [1,5,10].
Recently, more attention has been put by the researchers toward the luminescence performance of RE ions in natural as well as synthesized apatites. The main focus for the study of RE ions doped with HAp has been the enhancement of luminescence with previous results showing the possibility of improving luminescence performance of RE elements doped HAp by increasing the RE content [11], calcination [3], and co-doping of RE ions [12,13,14]. However, they are accompanied by certain issues like quenching effect, oversize, severe aggregation, and toxicity. Fluoride ions (F) are usually used for replacing the hydroxyl (–OH) group of HAp to improve some physicochemical properties such as solubility, crystallinity, and resistance to acid corrosion [15]. Moreover, the Eu3+ ions in fluorapatite (Ca10(PO4)6F2, FAp) emits stronger luminescence than that in HAp, which can be attributed to the effect of F- ions on the crystal field environment. The –OH group in the crystal lattice has a quenching effect on luminescence of rare earth ions. The F- ions can generate lower vibration energy and, thereby, promote luminescence conversion [16]. However, the relationship between the fluorine substitution ratio for the –OH group and luminescence of Eu3+ ions has not been revealed in detail.
Herein, we used a hydrothermal synthetic route to prepare fluoridated hydroxyapatite doped with Eu3+ ions ((Ca, Eu)5(PO4)3(OH)1−xFx), Eu:FxH1−xAp,). The change of luminescence was observed with varying fluorine substitution ratio (from 0 to 1) for the –OH group, which aims to reveal the relationship between the fluorine substitution ratio and luminescence intensity. Moreover, the effect of the fluorine substitution ratio for the –OH group on phase composition, crystallinity, crystal size, and chemical state of Eu3+ was studied by X-ray diffraction (XRD), Fourier Transform Infrared (FT-IR) Spectroscopy, Scanning Electron Microscopy (SEM), High Resolution Transmission Electron Microscope (HRTEM), Energy Dispersive Spectrometer (EDS), and X-ray Photoelectron Spectroscopy (XPS).

2. Materials and Methods

2.1. Preparation of Eu:FxH1−xAp Nanoparticles

The nanocrystalline Eu:FxH1−xAp materials were obtained using the following hydrothermal method. First, CaCl2·2H2O, Na2HPO4·12H2O, Eu(NO3)3·6H2O, and NaF were dispersed individually in deionized water. Na2HPO4 and NaF powders were dissolved in deionized water to get solution A (PO43−: 0.24 mol/L, F: 0.08x mol/L). CaCl2·2H2O and Eu(NO3)3·6H2O powders were dissolved in deionized water to get solution B (Ca2+: 0.393 mol/L, Eu3+: 0.008 mol/L). Second, 15 ml of solution A was poured into 15 ml of solution B under vigorous stirring to get the suspension. The pH value of the suspension was adjusted to about 9.0~9.5 by NH3 solution. Subsequently, the suspension was moved to a sealed stainless-steel autoclave, and maintained at a stirring condition at 120 °C for 60 min. After being naturally cooled at room temperature, the resulting milky matter was separated by centrifugation at 2000 rpm for 5 min, and washed three times using deionized water. Lastly, it was freeze dried for 20 hours to get the powder sample. The molar ratios of (Ca + Eu)/P and Eu/ (Ca + Eu) were 1.67 and 0.02, respectively. The amount of F- was adjusted to obtain a different fluorine substitution ratio for the –OH group depending on the x value in Eu:FxH1−xAp (x = 0, 0.1, 0.3, 0.5, 0.7, 0.8, and 1).

2.2. Characterization of Eu:FxH1-xAp Nanoparticles

The phase composition, crystalline structure, and the crystallinity of the Eu:FxH1−xAp were explored by XRD (D/Max-ⅢA, Rigaku Co., Tokyo, Japan). The 2θ range of the XRD pattern was collected from 10° to 70° with a scanning speed of 0.02°/s.
The degree of crystallinity Xc for Eu:FxH1−xAp was calculated by the following equation.
X c = [ 1 v 112 / 300 I 300 ]
where v 112 / 300 is the hollow intensity between the planes (112) and (300) reflection, and I 300   is the intensity of the plane (300) diffraction peak [1,17]. Moreover, crystallite sizes D of Eu: HAp were concluded by using Scherer’s Equation.
D = K · λ FWHM 002 · cos θ
where the shape factor K is 0.9, wavelength   λ   is   0.15418 , FWHM 002 express the full width at half maximum for reflection of the plane (002), and θ stands for the angle of a certain signal [1,3,18]. FT-IR (Nexus, Thermo Nicolet, USA) was exploited to analyze the material’s vibrational modes of the characteristic band. The spectra were recorded between 4000 cm−1 to 400 cm−1. The Eu:FxH1−xAp powders (7.5 mg) were dispersed in alcohol (5 ml) and then the suspension was acquired by ultrasonic cleaning. The morphology and the average particle size of Eu:FxH1−xAp were evaluated by SEM (JSM-5610LV, JEOL, Japan) and HRTEM (JEM-2100 F, JEOL, Japan). XPS (ESCALAB 250Xi/ESCALAB 250Xi) was used to identify the composition and chemical states of the elements. The luminescence spectra of Eu:FxH1−xAp was recorded using a 970CRT Luminescence Spectrophotometer (Shanghai Sanco, China). An emission spectrum (or excitation spectrum) was recorded by fastening the excitation wavelength (or emission wavelength) while scanning the determined wavelength region of the spectrofluorimeter [19].
The luminescence enhancement relative ratio (R) was calculated by the following equation.
R = B A A   · 100 %
where A is the emission peak’s intensity of Eu:HAp and B is the emission peak’s intensity of Eu:FxH1−xAp.
The luminescence lifetime and quantum yield were measured by FLS980 Series of Fluorescence Spectrometers. The average luminescence lifetime ( τ ( avg ) ) was calculated by the following equation.
τ ( avg ) = A 1 τ 1 2 + A 2 τ 2 2 A 1 τ 1 + A 2 τ 2
where A 1 and A 2 are the exponential factors. τ 1 and τ 2 are luminescence lifetime values of Eu: FxH1-−xAp.

3. Results

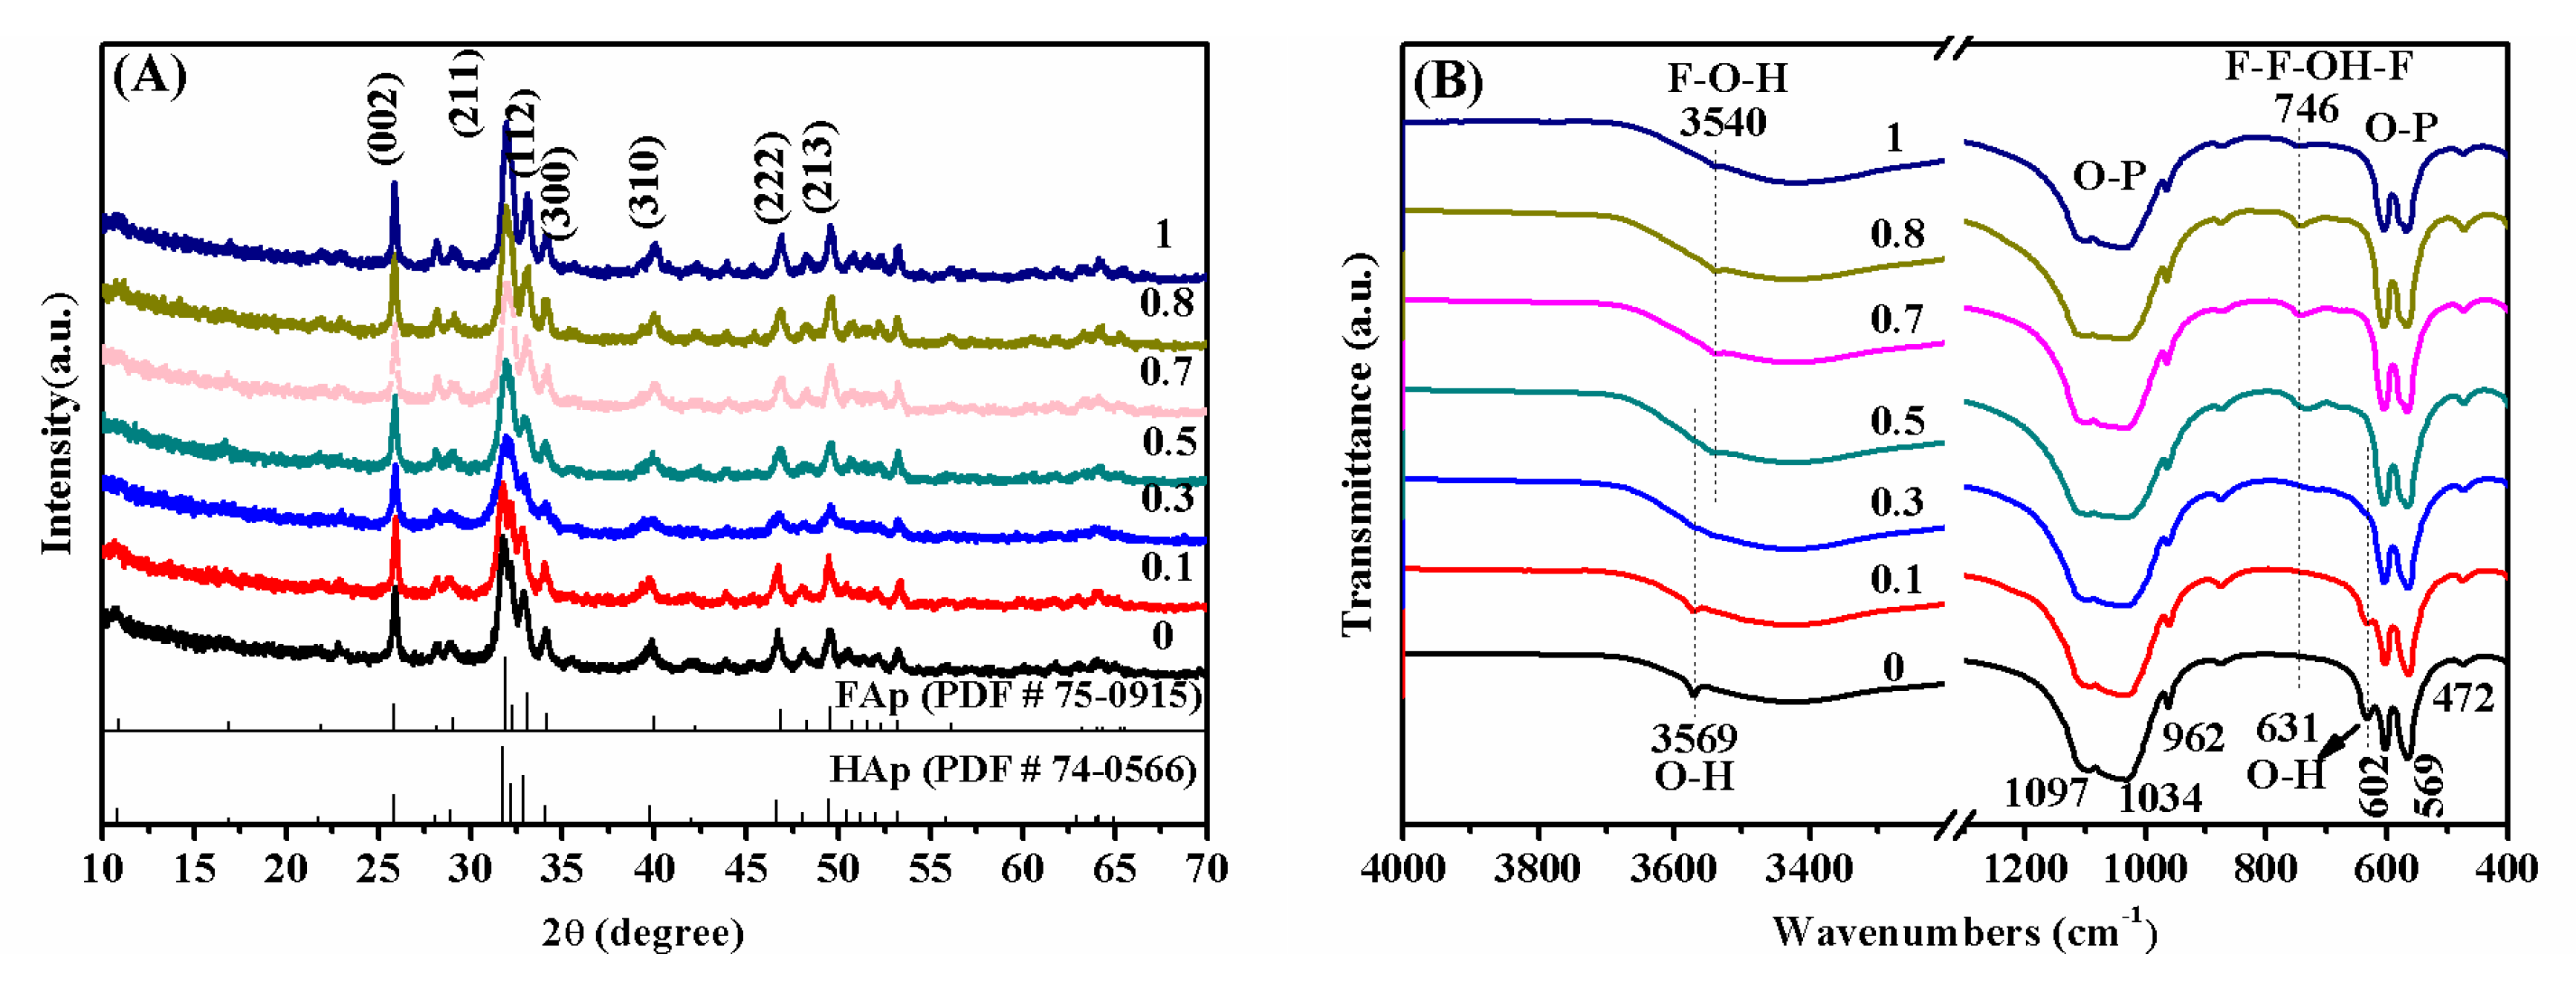
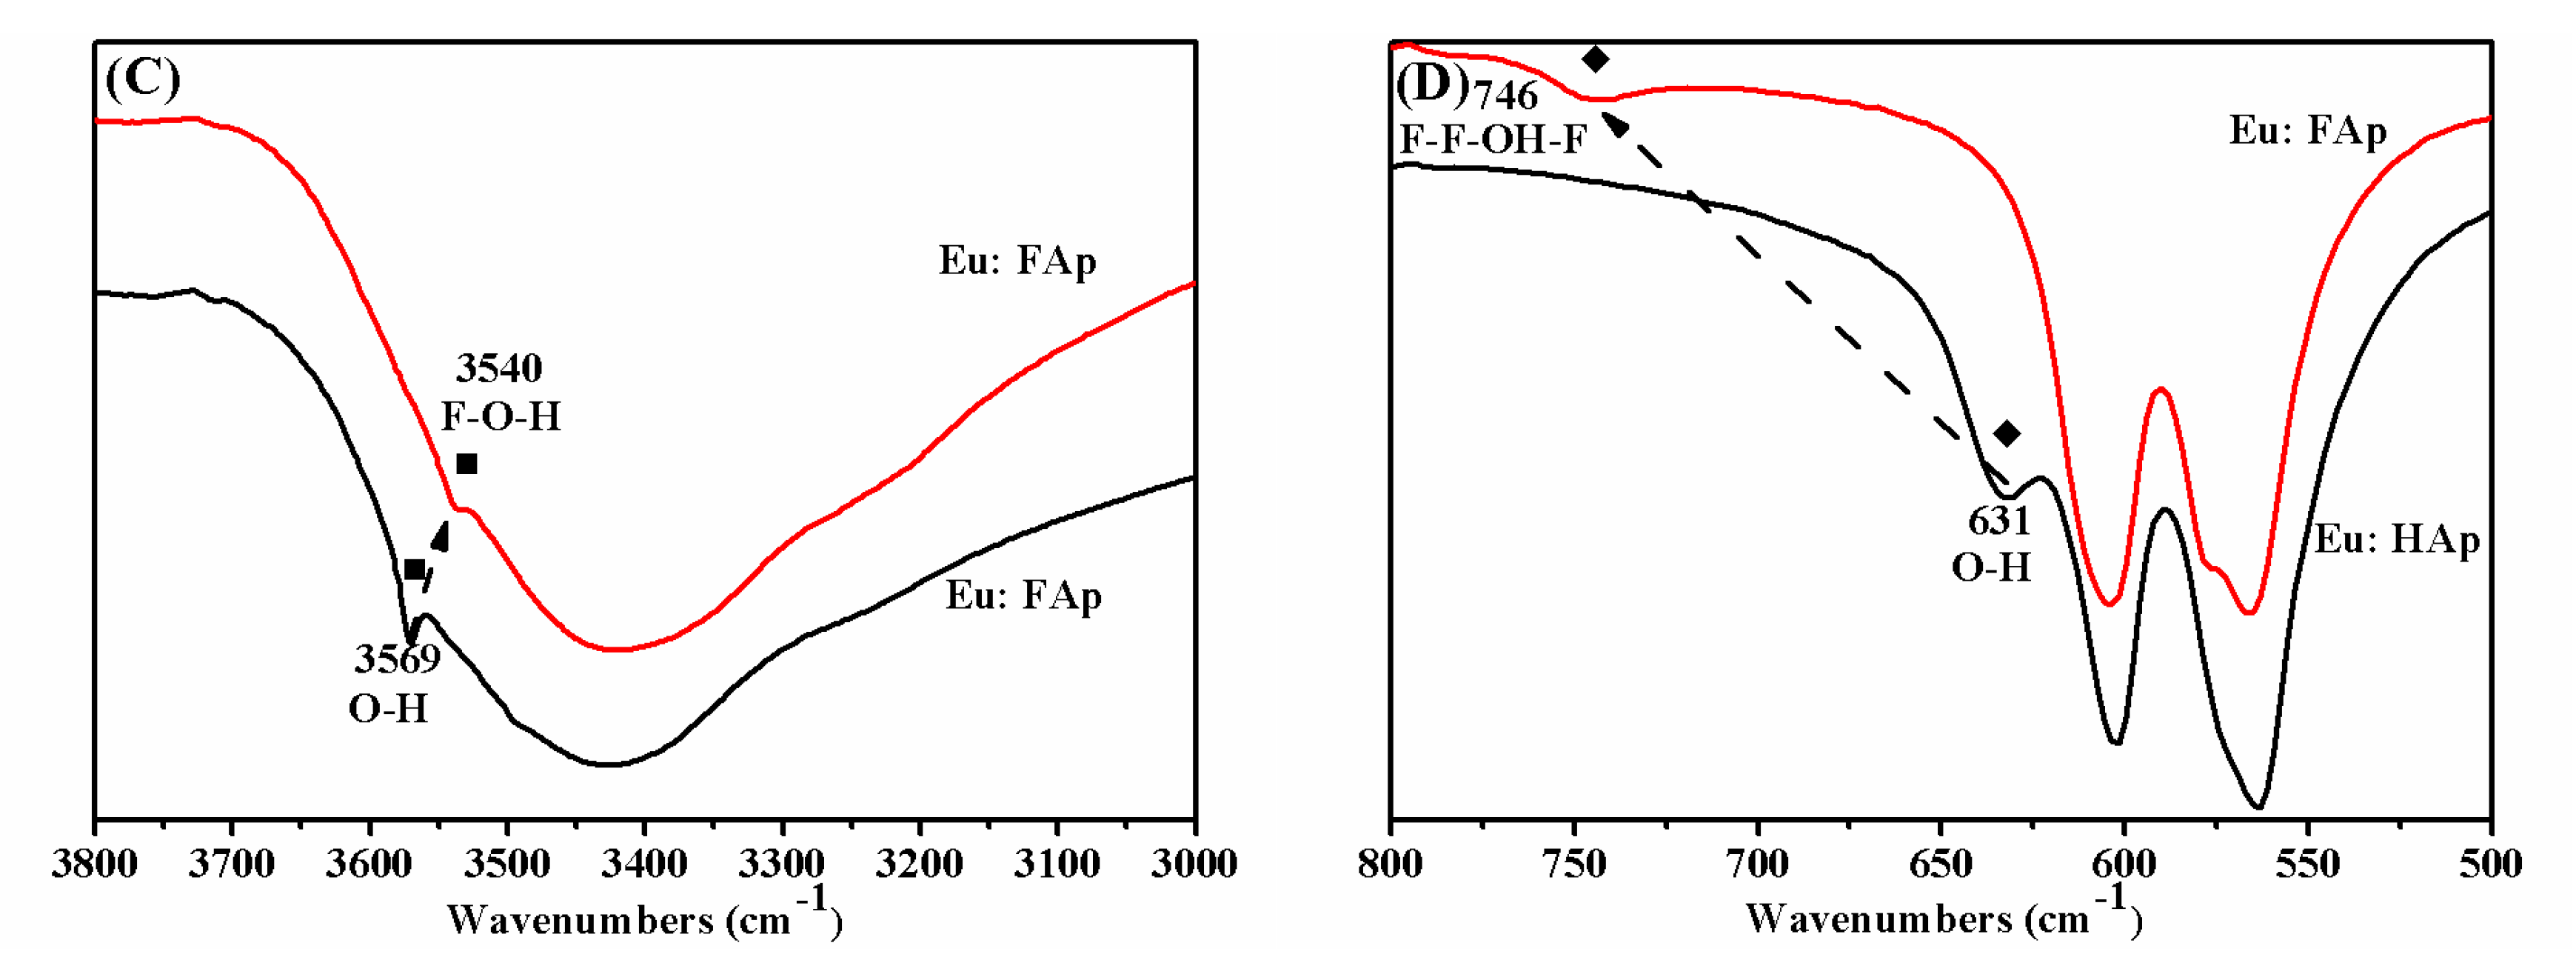
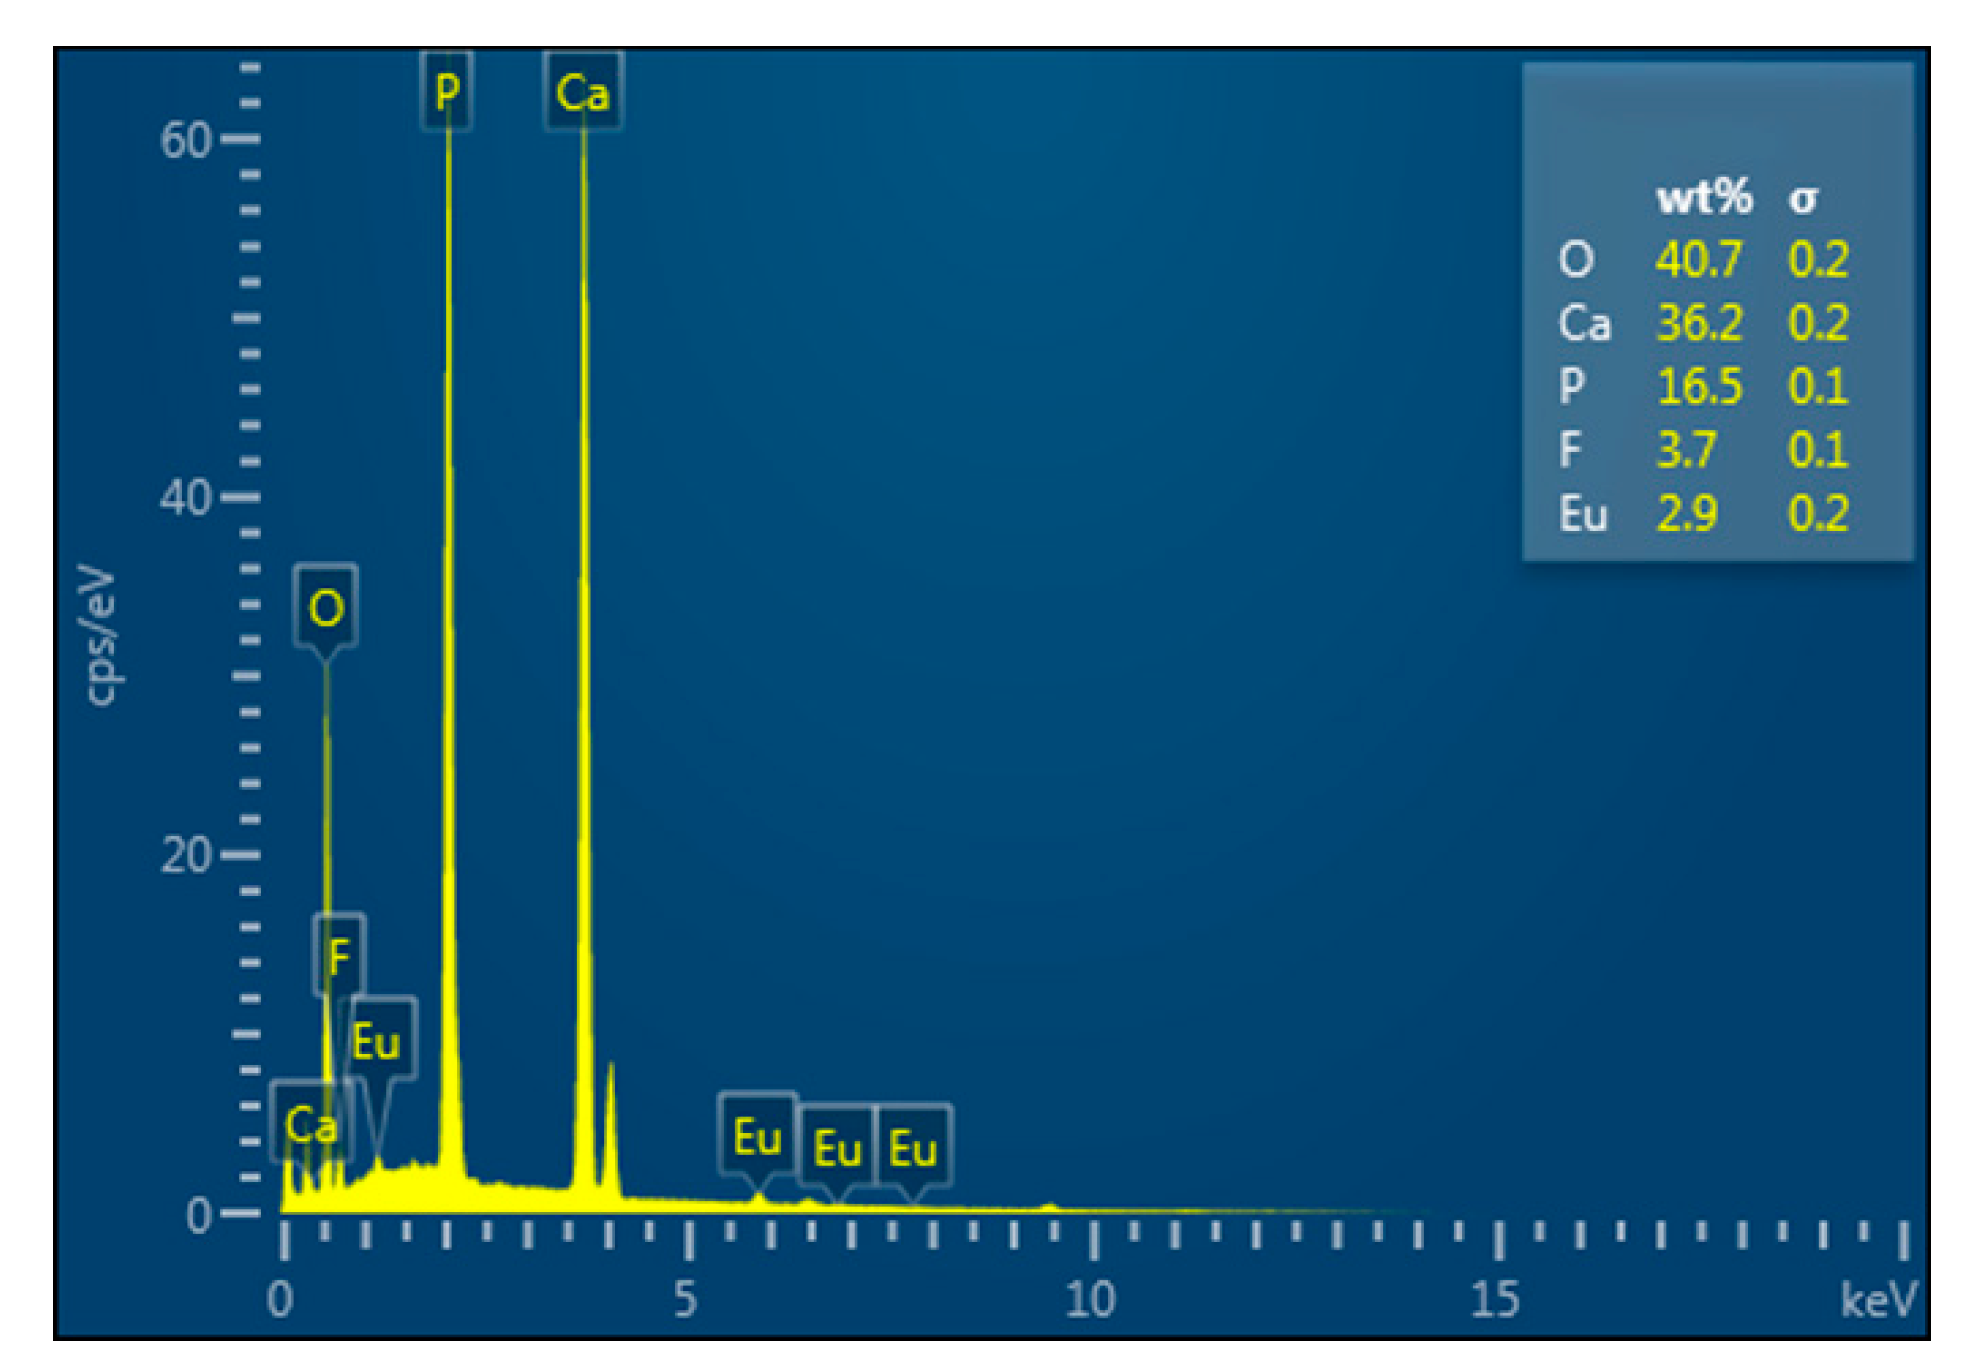
3.1. Phase Composition and Chemical Structure

Figure 1A shows the phase composition. Crystallite crystal and the degree of crystallinity of samples have different fluorine substitution ratios. By comparing the XRD patterns, it was observed that no additional diffraction peaks appeared in the case of Eu:FxH1−xAp nanoparticles except for characteristic diffraction peaks of FAp (PDF # 75-0915) and HAp (PDF # 74-0566), which indicates no impurity phase. Moreover, with the gradual increase of a fluorine substitution ratio, the diffraction angle and relative intensity varied slightly. Considering that the F ions (1.28 Å) are smaller than the –OH group (1.37 Å), with an increasing fluorine substitution ratio, there would be natural shrinkage of the lattice leading to a slight shift of the diffraction signals to higher degrees. The calculated crystallite sizes assigned to (002) diffraction peaks with a different fluorine substitution ratio, respectively, also indicated that the crystallite sizes tended to reduce (Table A1). Moreover, the crystallinity also decreased with the increase of the fluorine substitution ratio from 0 to 0.5. When the fluorine substitution ratio was above 0.5, the crystallinity gradually grew with an increasing substitution content (Table A1). In addition, the crystallinity of Eu:FAp was as high as 55.56%, which was higher than the crystallinity of Eu:HAp (38.73%).
Figure 1B shows FT-IR spectra of Eu:FxH1−xAp samples. In the FT-IR spectrum of Eu:HAp samples without F- ions substitution, the vibrational peaks of PO43- group in the apatite structure was distinguished, including ν1 (at 962 cm−1), ν2 (at 472 cm−1), ν3 (at 1034 cm−1 and 1107 cm−1), and ν4 (at 564 cm−1 and 602 cm−1) [20,21]. Hydroxyapatite is a kind of apatite crystal whose general molecular formula is Me10(XO4)6Y2. In this study, the Me is a divalent cation, XO4 is the negative trivalent group, and Y is a negative monovalent ion [22]. For RE-doped apatite with a different fluorine substitution ratio, RE ions will occupy the position of Me and Y will be replaced by F ions. Accordingly, the position and the intensity of the vibrational peak of the –OH group in the spectrum changes with the fluorine substitution ratio. When the F- ions enter into the lattice of HAp, the original H-O-H is gradually converted into the F-O-H structure, which is attributed to the hydrogen bond formed by the F- ions (Figure 1C). This will generate a new chemical bond accompanied by a new vibration mode (F-O-H) and causes the decrease of the H-O-H vibration [23]. Due to higher electronegativity of F- ions compared to O2- ions, a new vibration (F-F-OH-F) will also be detected at about 746 cm−1 (Figure 1D). Results showed that the absorption peaks of the –OH group was decreased at 3569 cm−1 and 631 cm−1 with an increase of the fluorine substitution ratio. The absorption peaks at 3540 cm−1 (F-O-H) and 746 cm−1 (F-F-OH-F) appeared and the intensity was enhanced. This indicated that the F- ions replaced the –OH group and entered into the apatite crystal lattice in the case of Eu:FxH1−xAp samples. The hygroscopic property is related to the surface chemical property [24]. For example, the –OH group makes it easy to form hydrogen bonds with water molecules, which make the water molecules absorb on the surface of materials. This is conducive toward improving the hygroscopic property [24,25]. The chemical property of the apatite surface was changed when the –OH group was replaced by F ions. The –OH group on the surface of HAp easily forms hydrogen bonds with water and absorbs on the surface of HAp. Therefore, HAp has a certain hygroscopic property. After replacing the –OH group, the hygroscopic property exhibited by hydrogen bonding is weakened. Therefore, the hygroscopic property is reduced after F ions replace the –OH group.

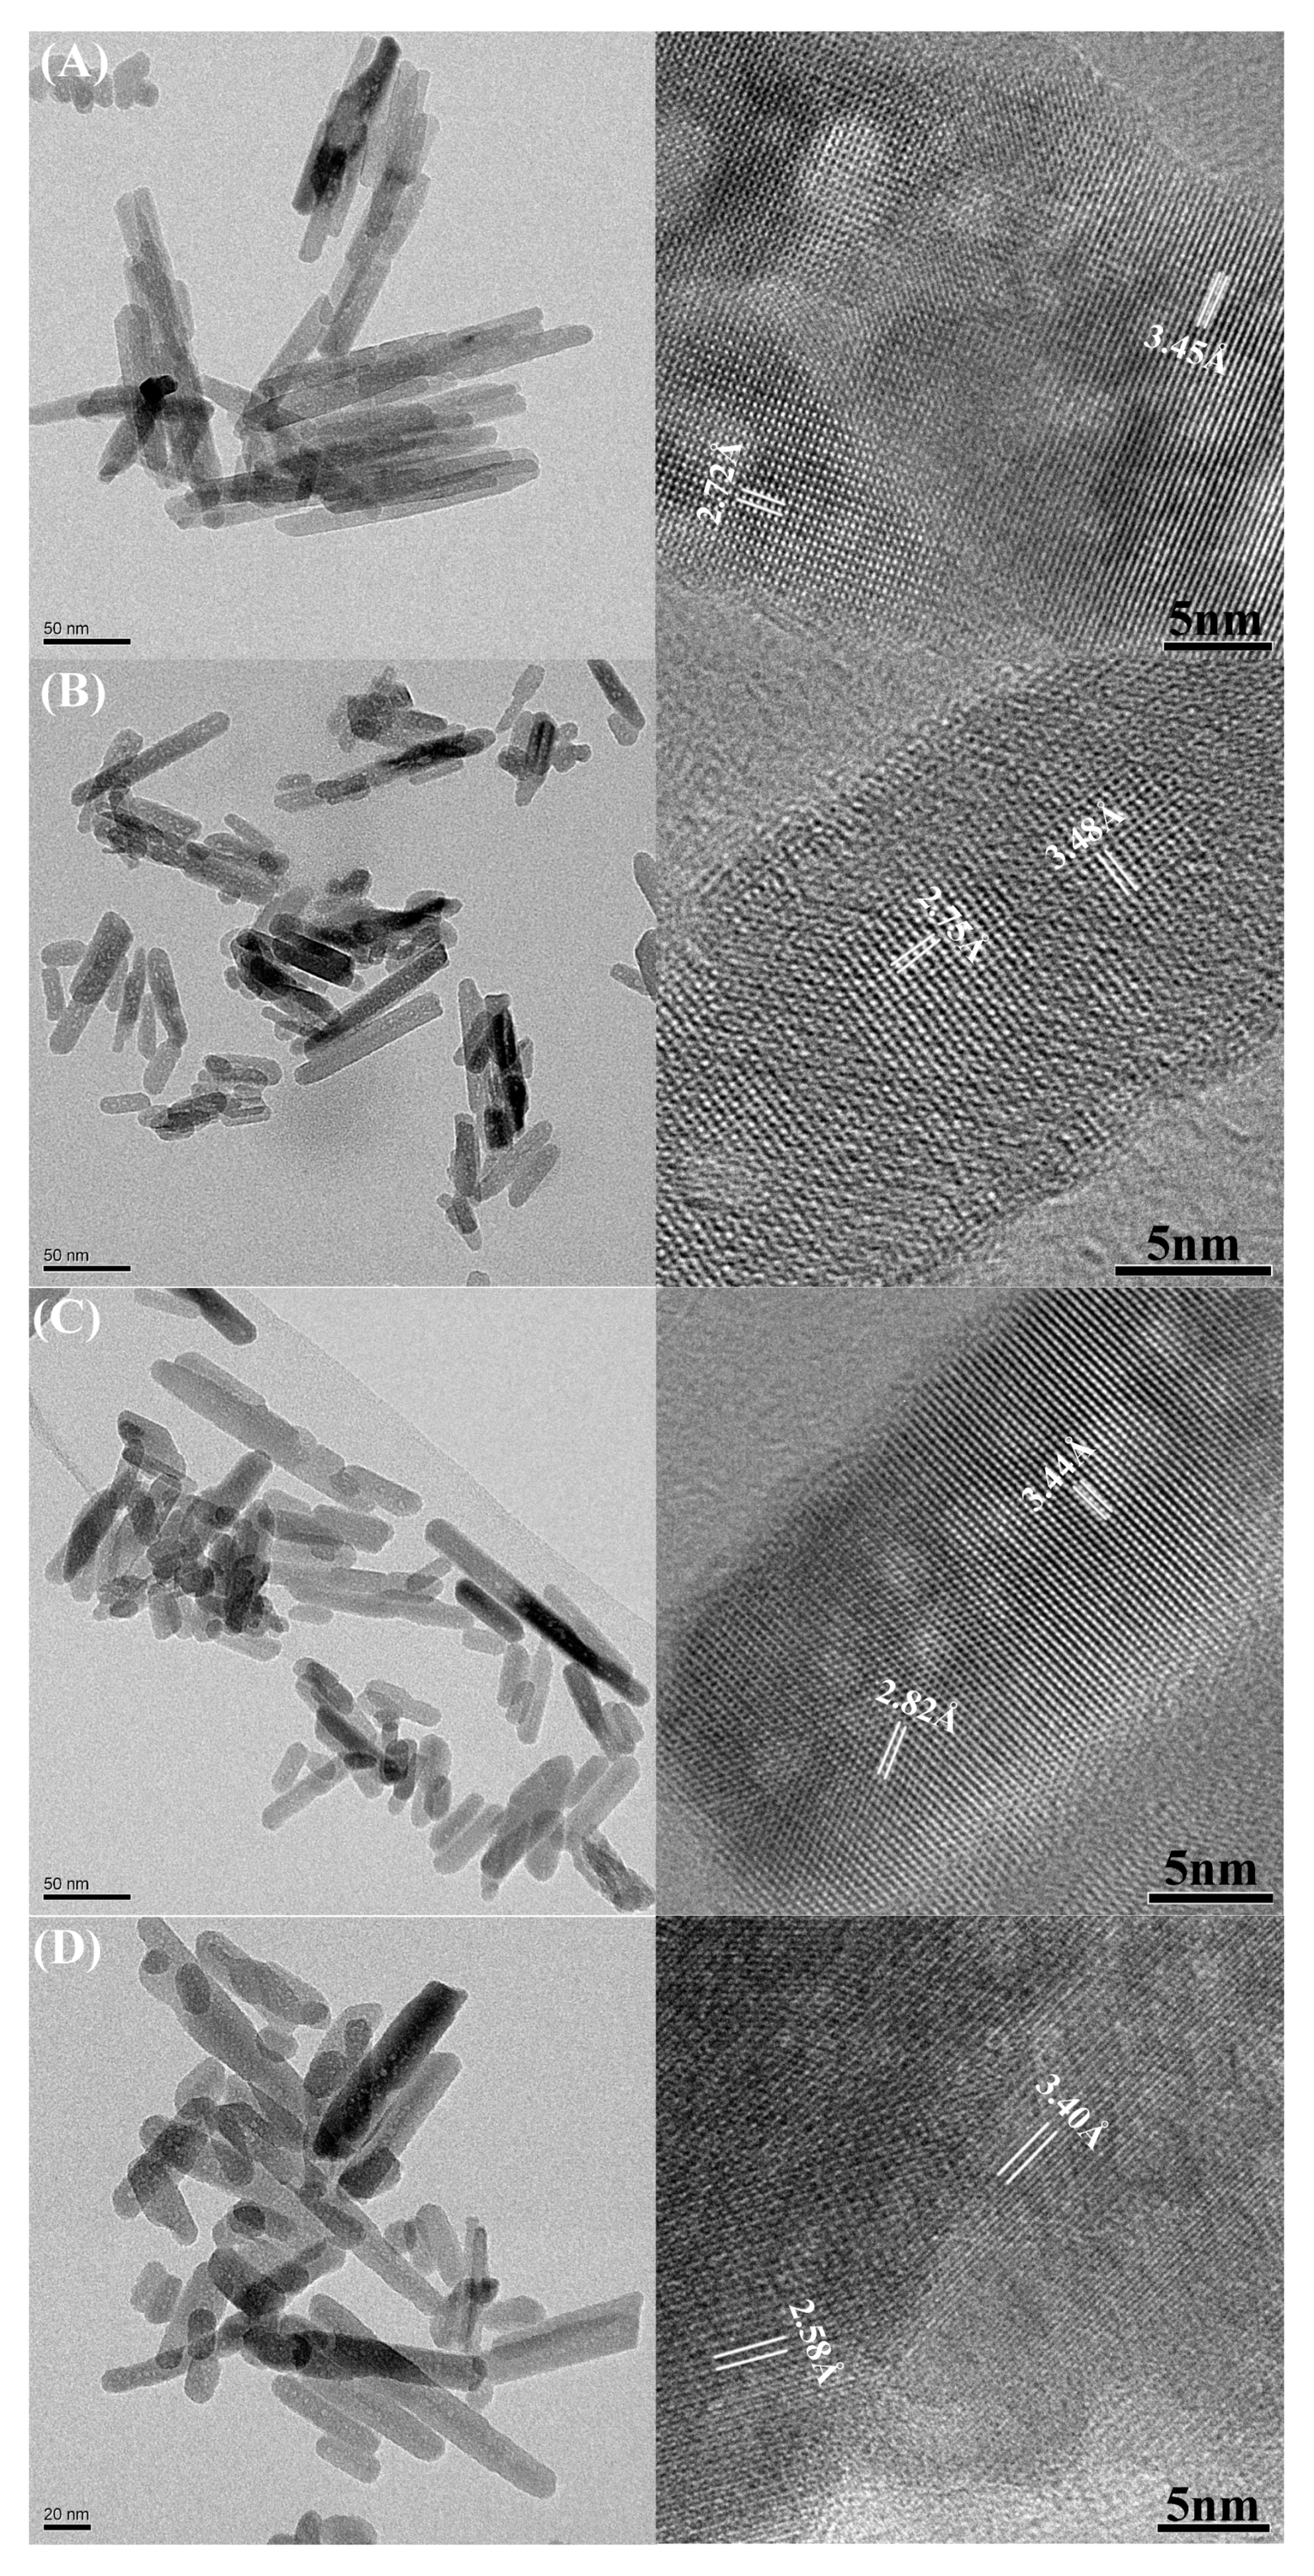
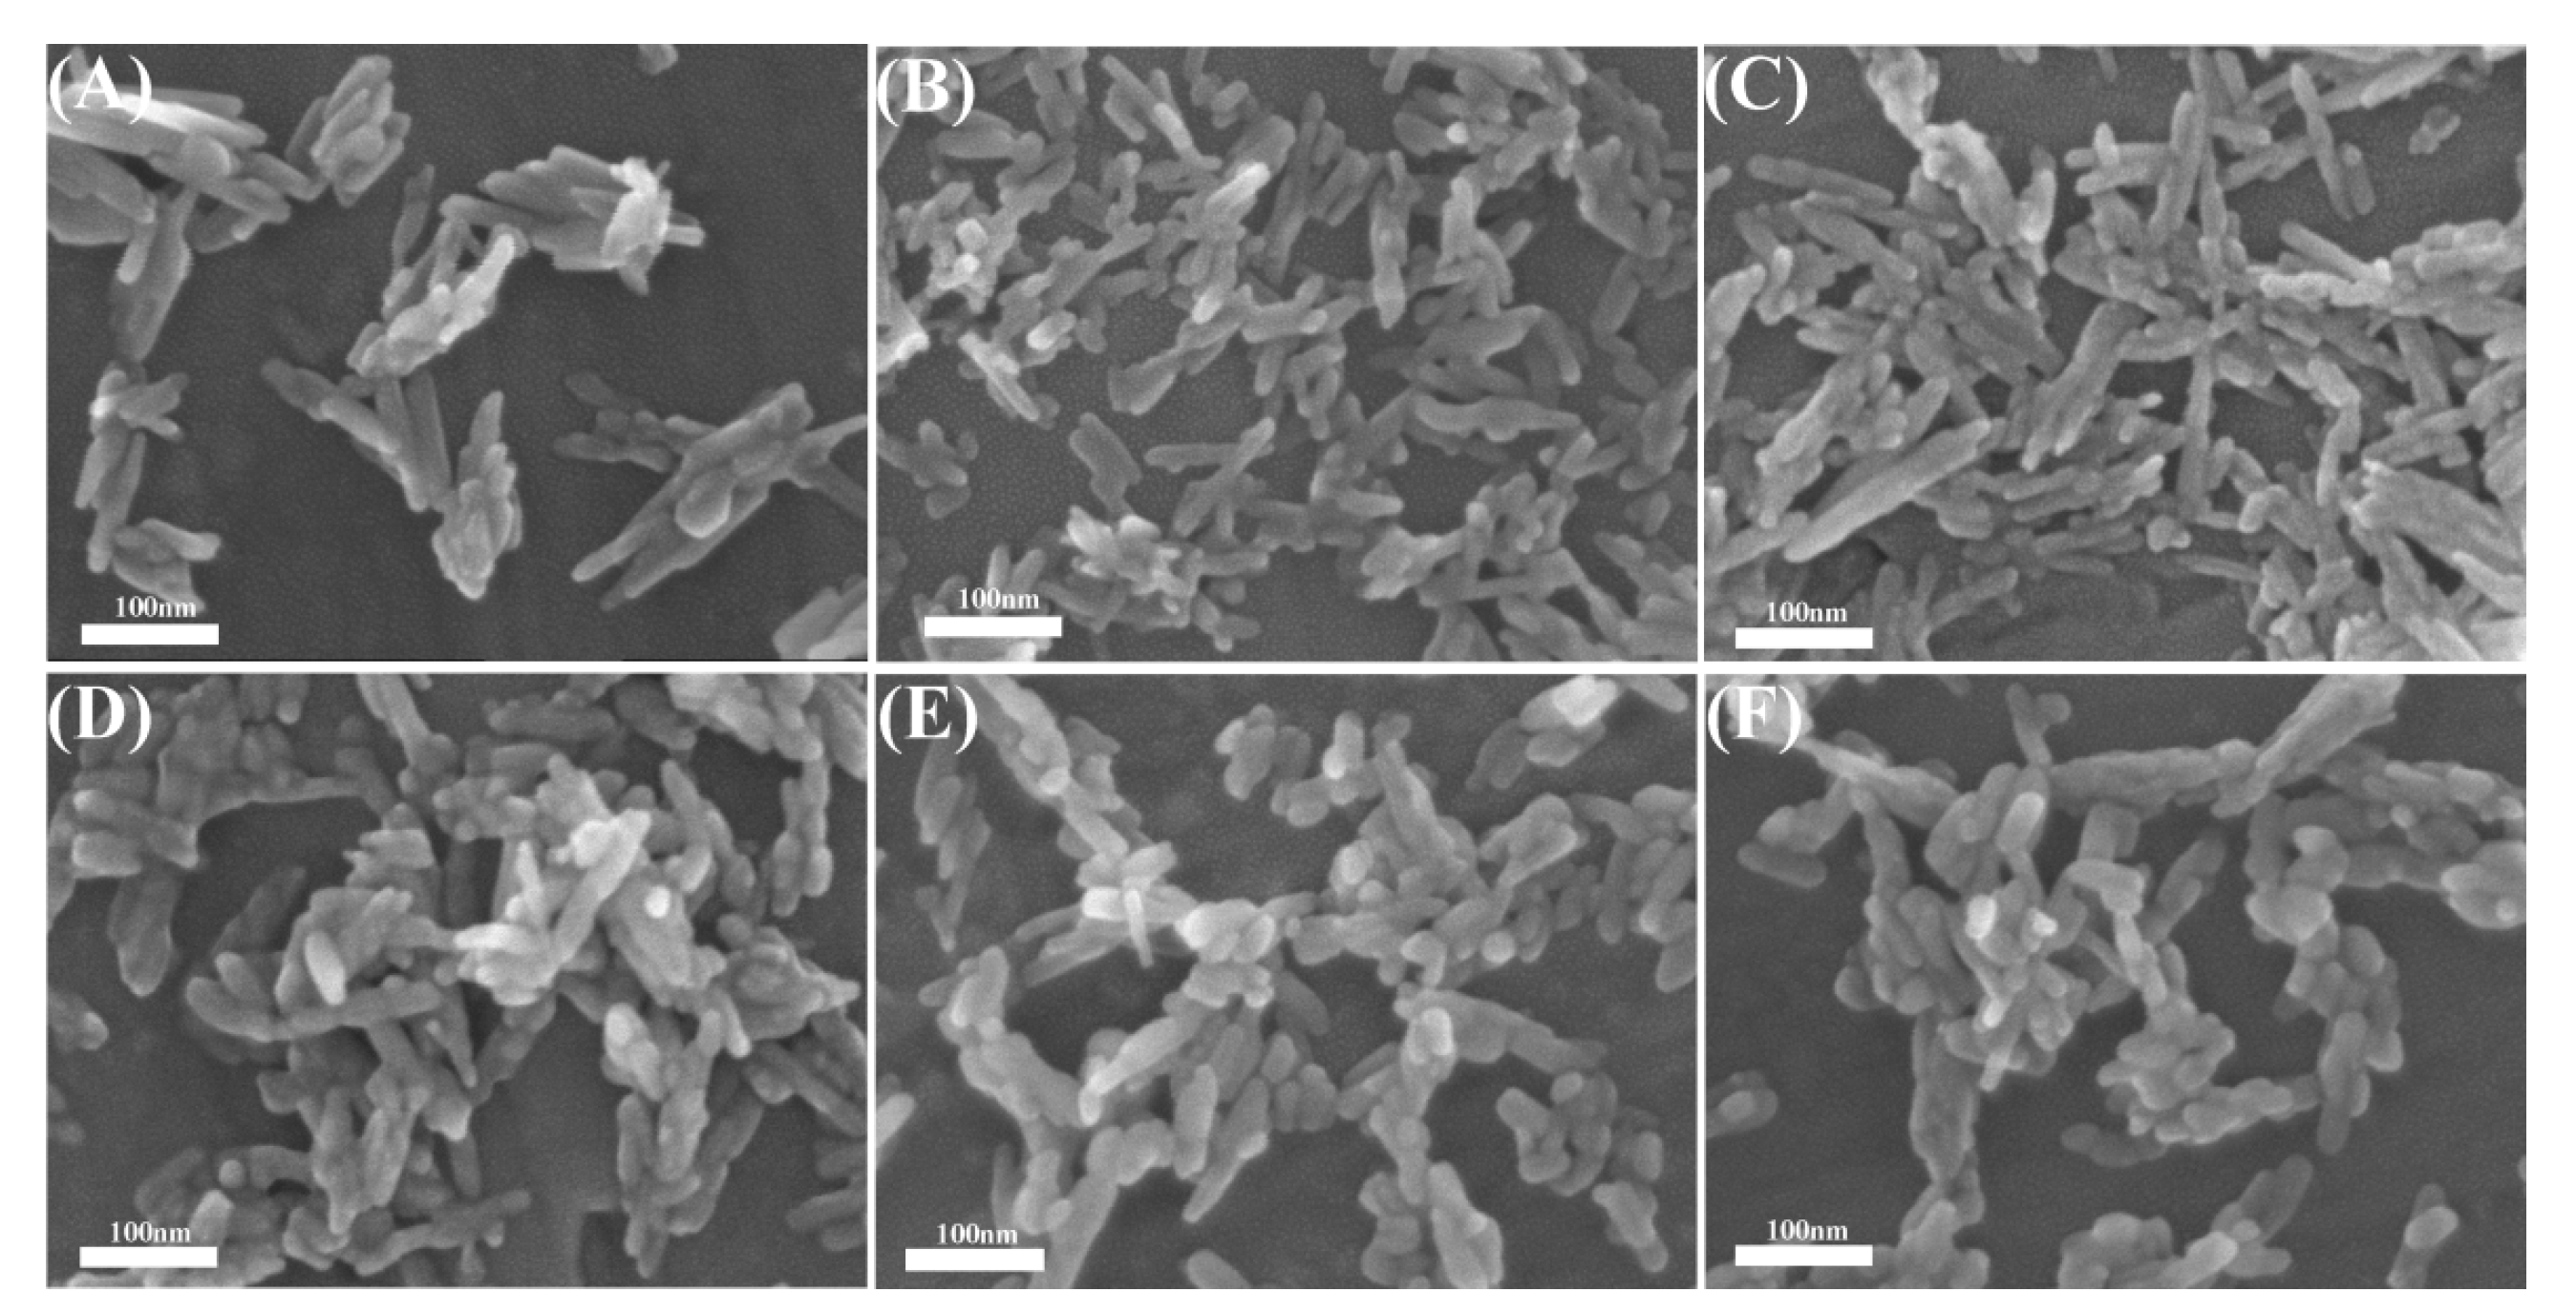
3.2. Morphology Observation
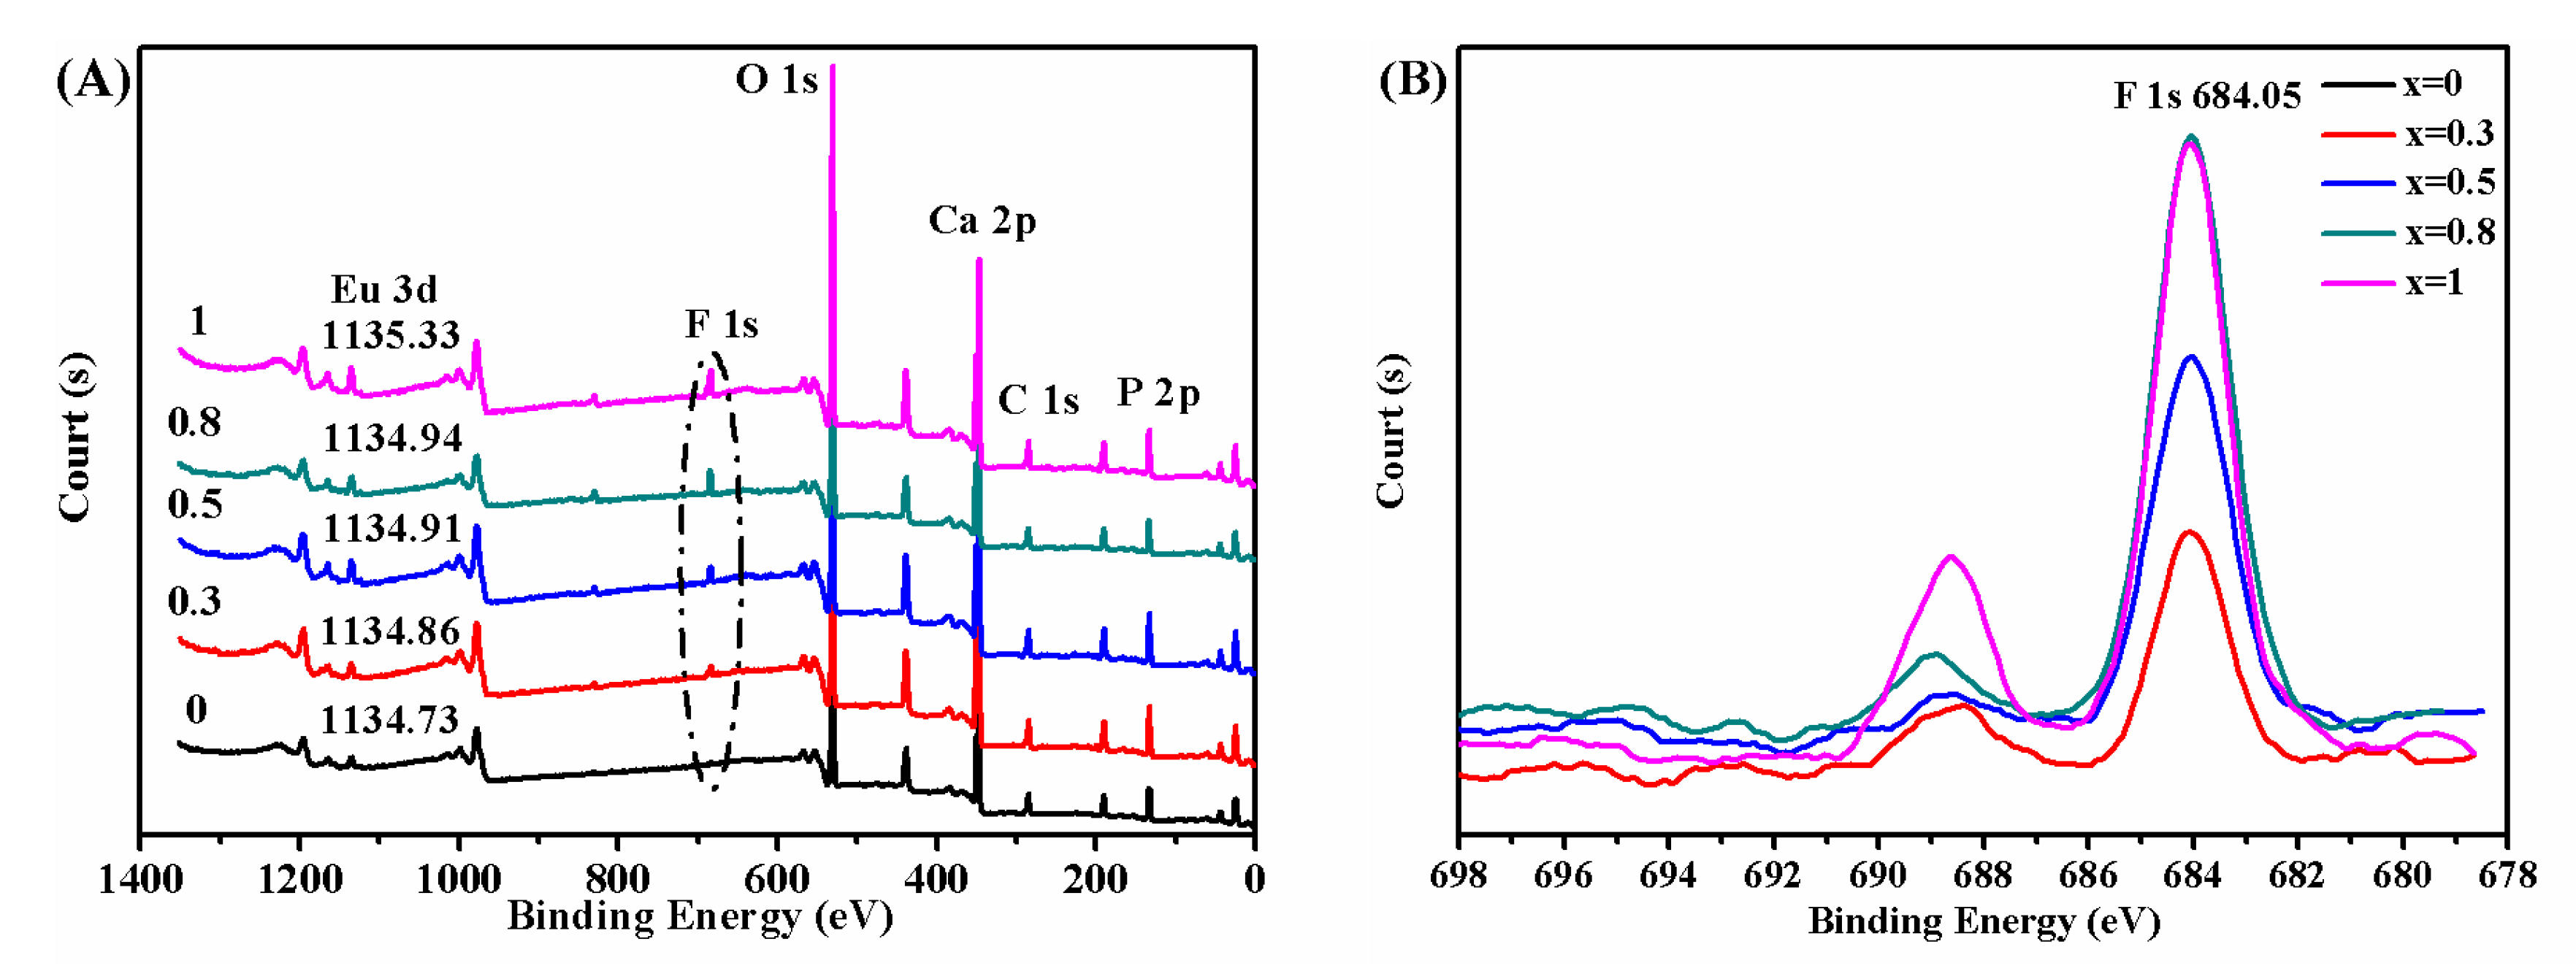
Figure A1 shows the SEM images of as-dried Eu:FxH1−xAp powders with a different fluorine substitution ratio. The morphology was mainly rod-like, and the length of the rod-like particles tended to decrease with the increase of the fluorine substitution ratio. The EDS spectrum further showed the signals of Ca, Eu, O, P, and F in Eu:FxH1−xAp (x = 1) (Figure A2). The calculated molar ratios of Eu/(Ca + Eu), (Ca + Eu)/P, and F/(Ca + Eu) were 0.02 ± 0.01, 1.69 ± 0.05, and 0.24 ± 0.04, respectively, which were consistent with the setting values (Table A2).
TEM observations showed that samples consisted of short rod-like nanoparticles (Figure 2). The average length and diameter of the nanoparticles were obtained by collecting data of more than 100 particles (Table A3). With the increase of the fluorine substitution ratio from 0 to 1, the length of the particles was decreased significantly from 77.7 ± 2.9 nm to 43.4 ± 2.0 nm. However, the diameter of the particles varied little (between 15.4 nm and 14.1 nm). This led to the decrease of the aspect ratio of rod-like particles from about 5 to about 3. Furthermore, the lattice planes of (002), (300) were observed in the HRTEM images (Figure 2), which were assigned to an apatite crystal structure. With the increase of the fluorine substitution ratio, the interfacial spacing of (002) decreased slightly, which was consistent with the change of length of rod-like particles. In addition, the capillary phenomenon between particles will make the water molecules absorbed on the particles [26]. However, the capillary and mesoporous structures were not observed in the microstructure of the Eu:FxH1−xAp synthesized by the hydrothermal method. Therefore, the hygroscopic property was not improved with fluorine substitution.

3.3. XPS

Figure 3A shows the XPS spectra of Eu:FxH1−xAp (x = 0, 0.3, 0.5, 0.8, and 1) samples. For the samples, the characteristic peaks of Ca 2p, P 2p, O 1s, and Eu 3d were all detected. Moreover, with the increase of the fluorine substitution ratio, the characteristic peak of F 1s was enhanced gradually, which indicates that the F ions entered into the apatite lattice (Figure 3B) [27]. When the F- ions entered into the apatite lattice, the binding energy of the atom varied due to the change in chemical environments, corresponding to a shift of the peak position in the XPS spectrum. For example, the binding energy of Eu3+ increased from 1134.73 eV to 1135.33 eV while the x increased from 0 to 1. This indicated that the surrounding environment for Eu3+ ions was changed due to the fluorine substitution for the –OH group.

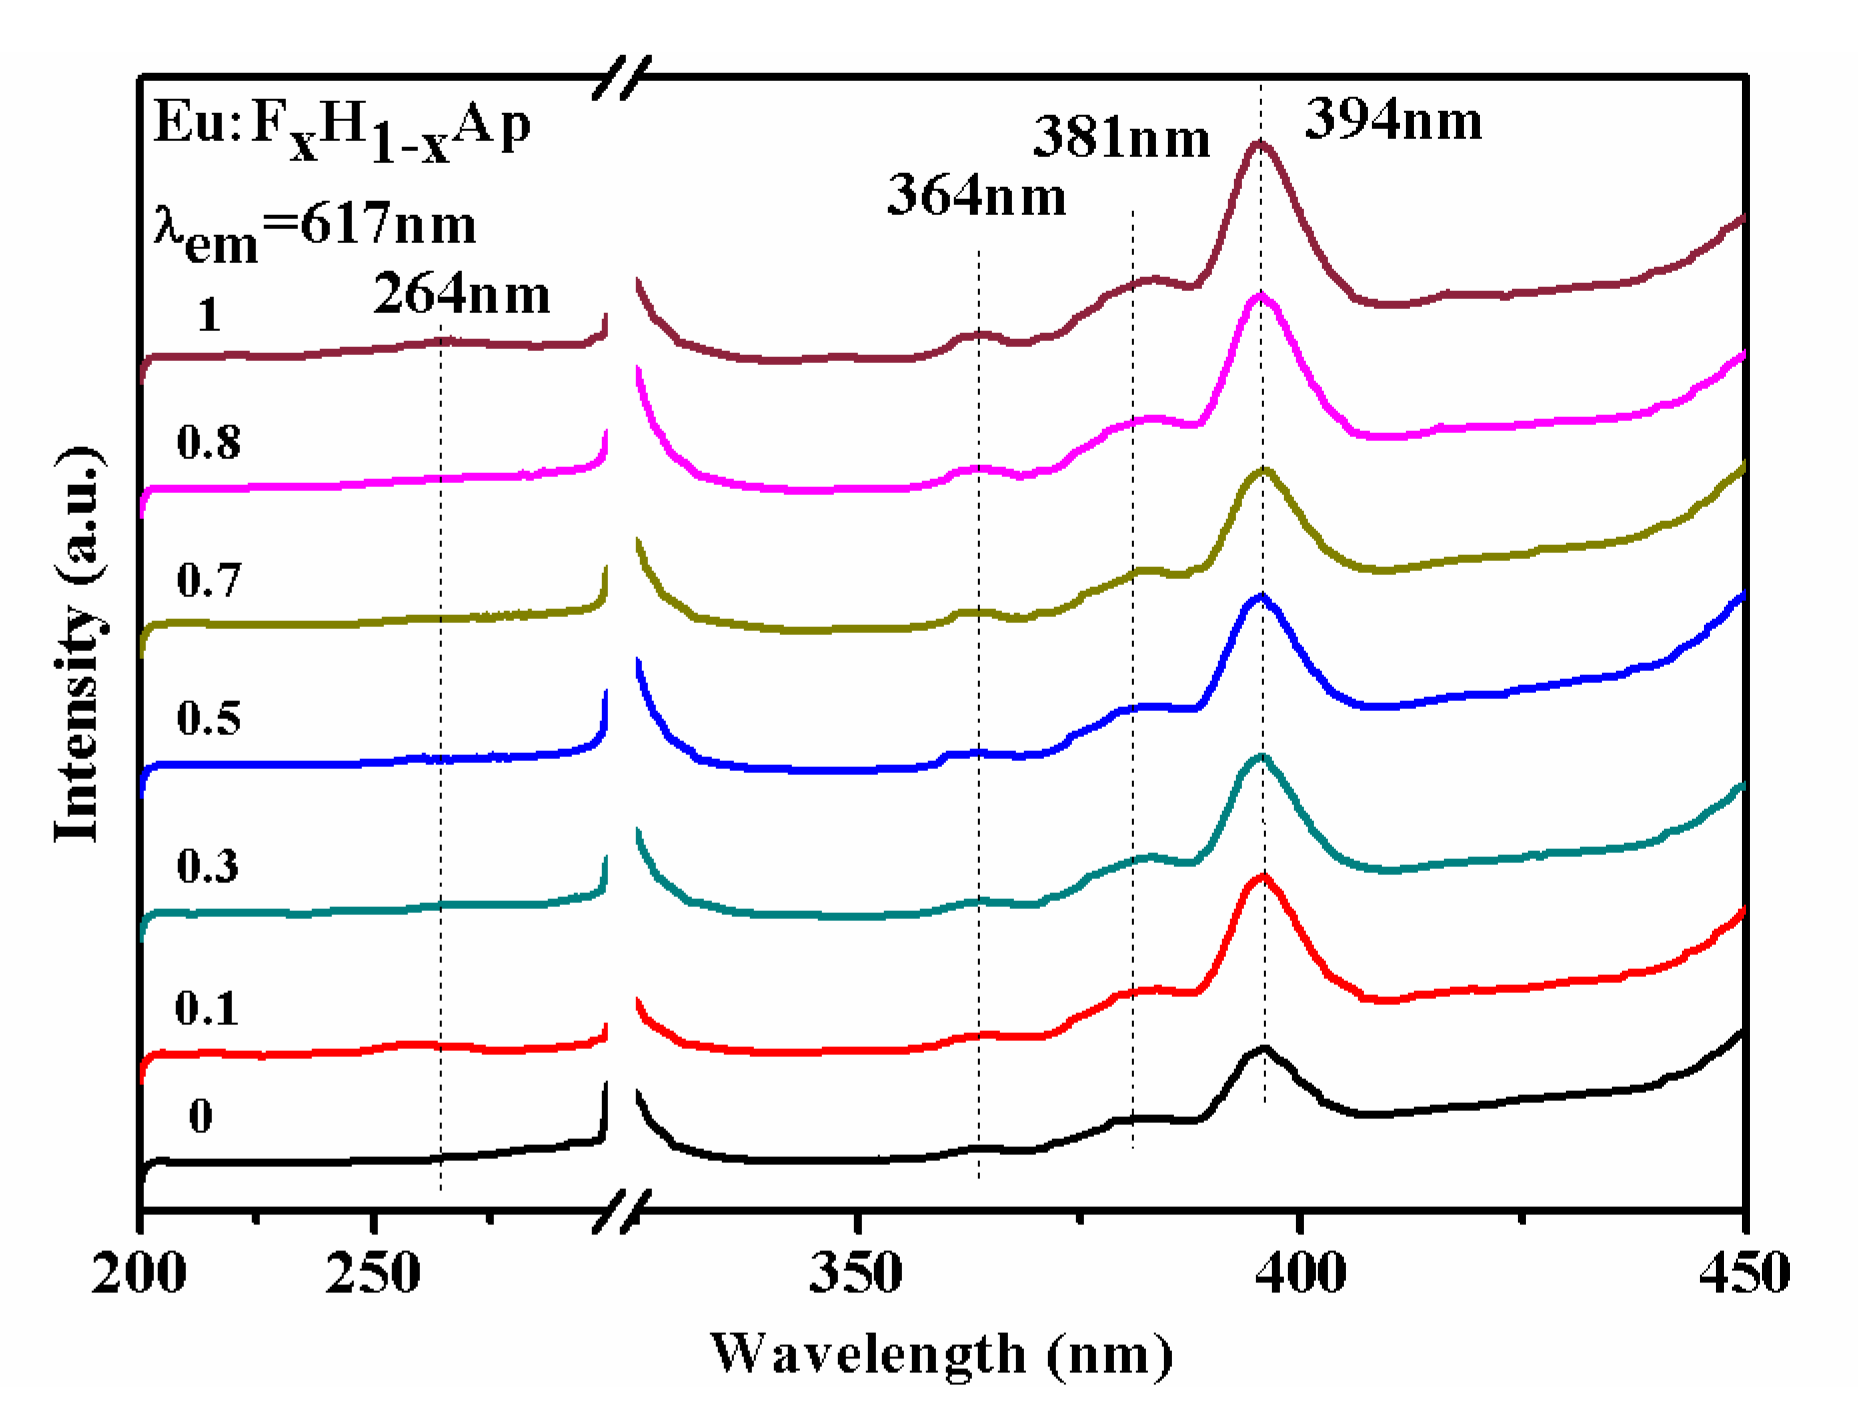
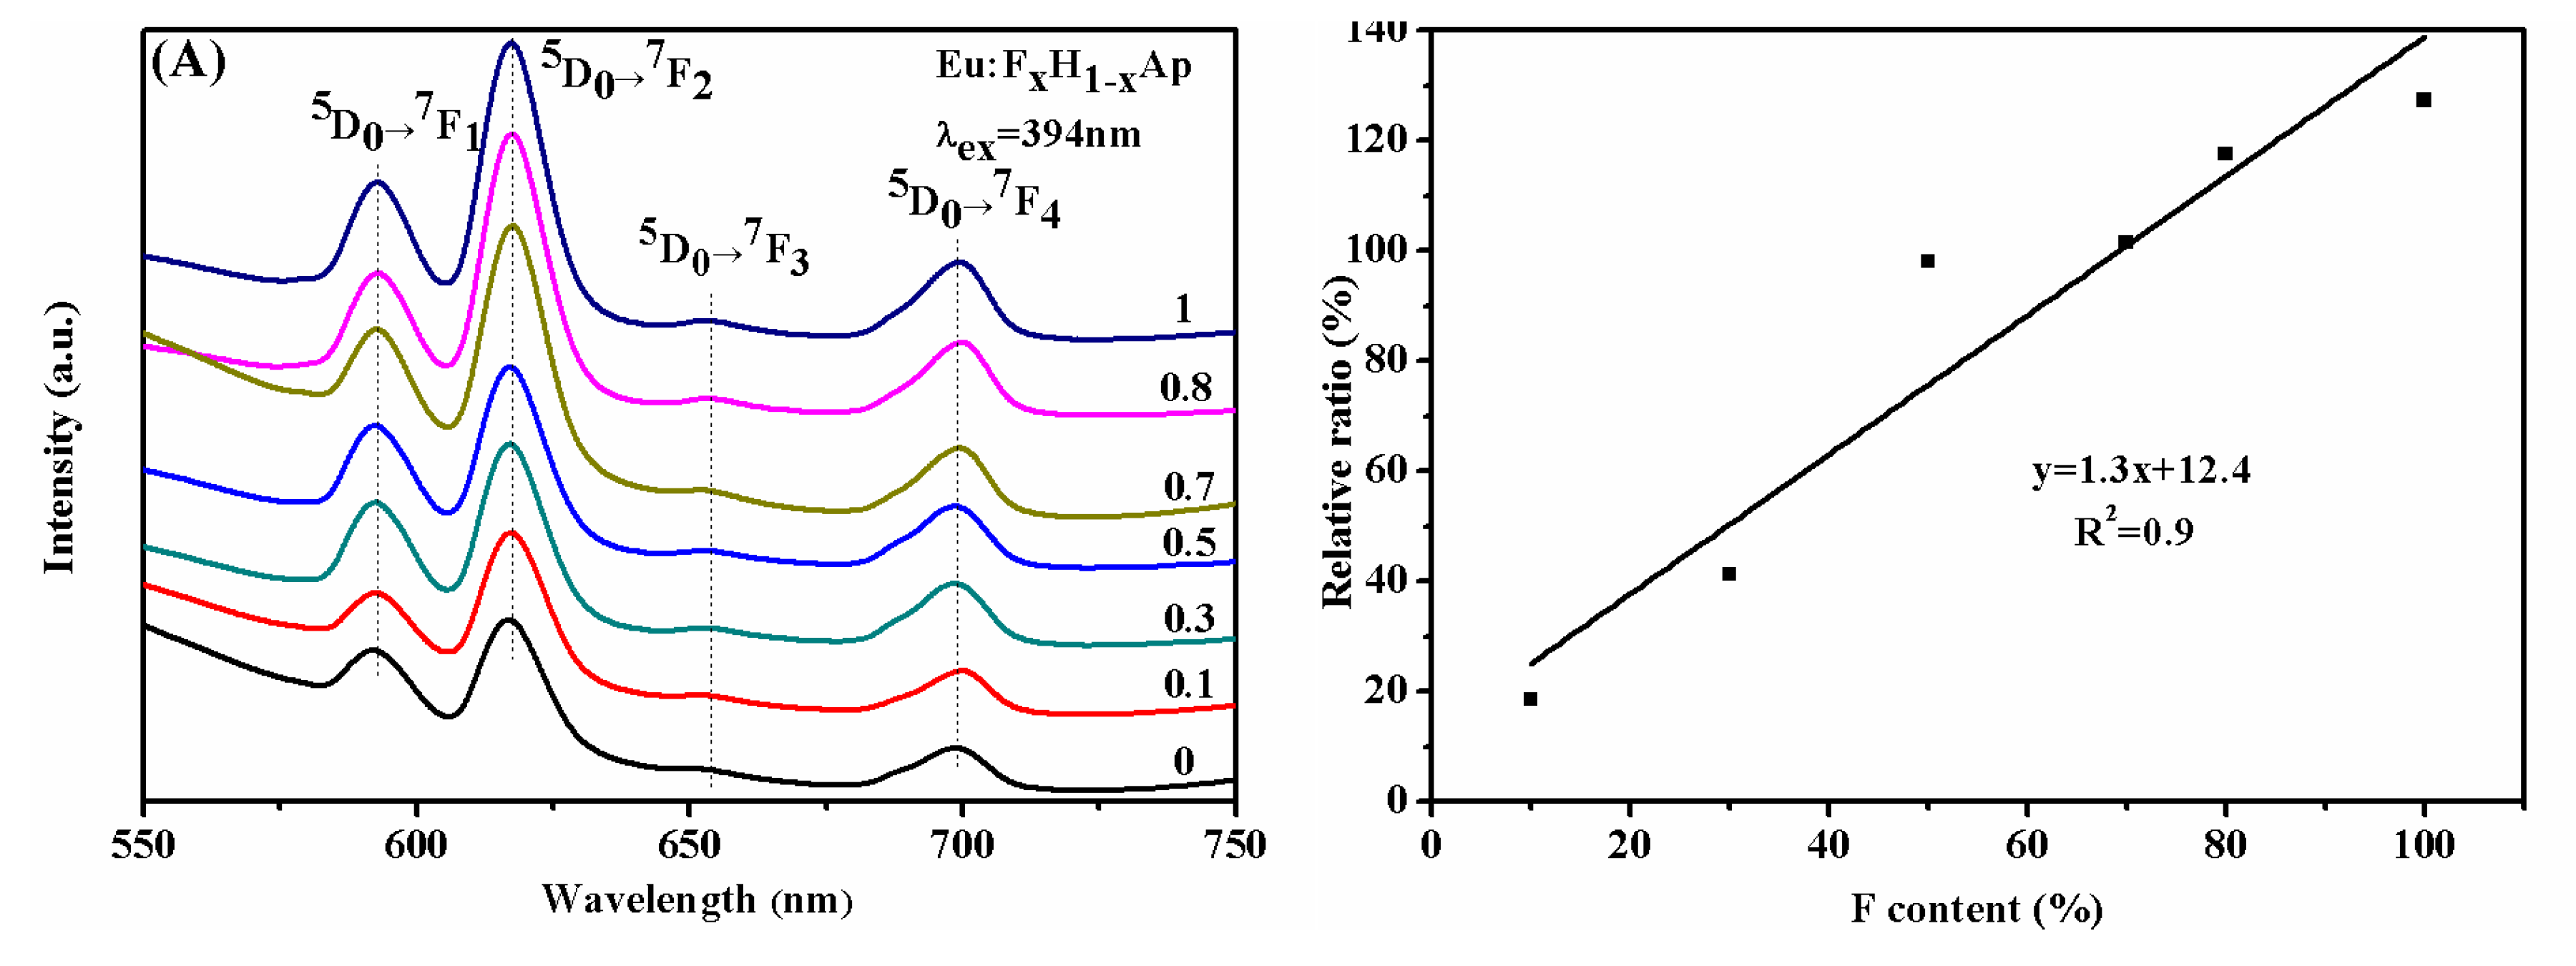
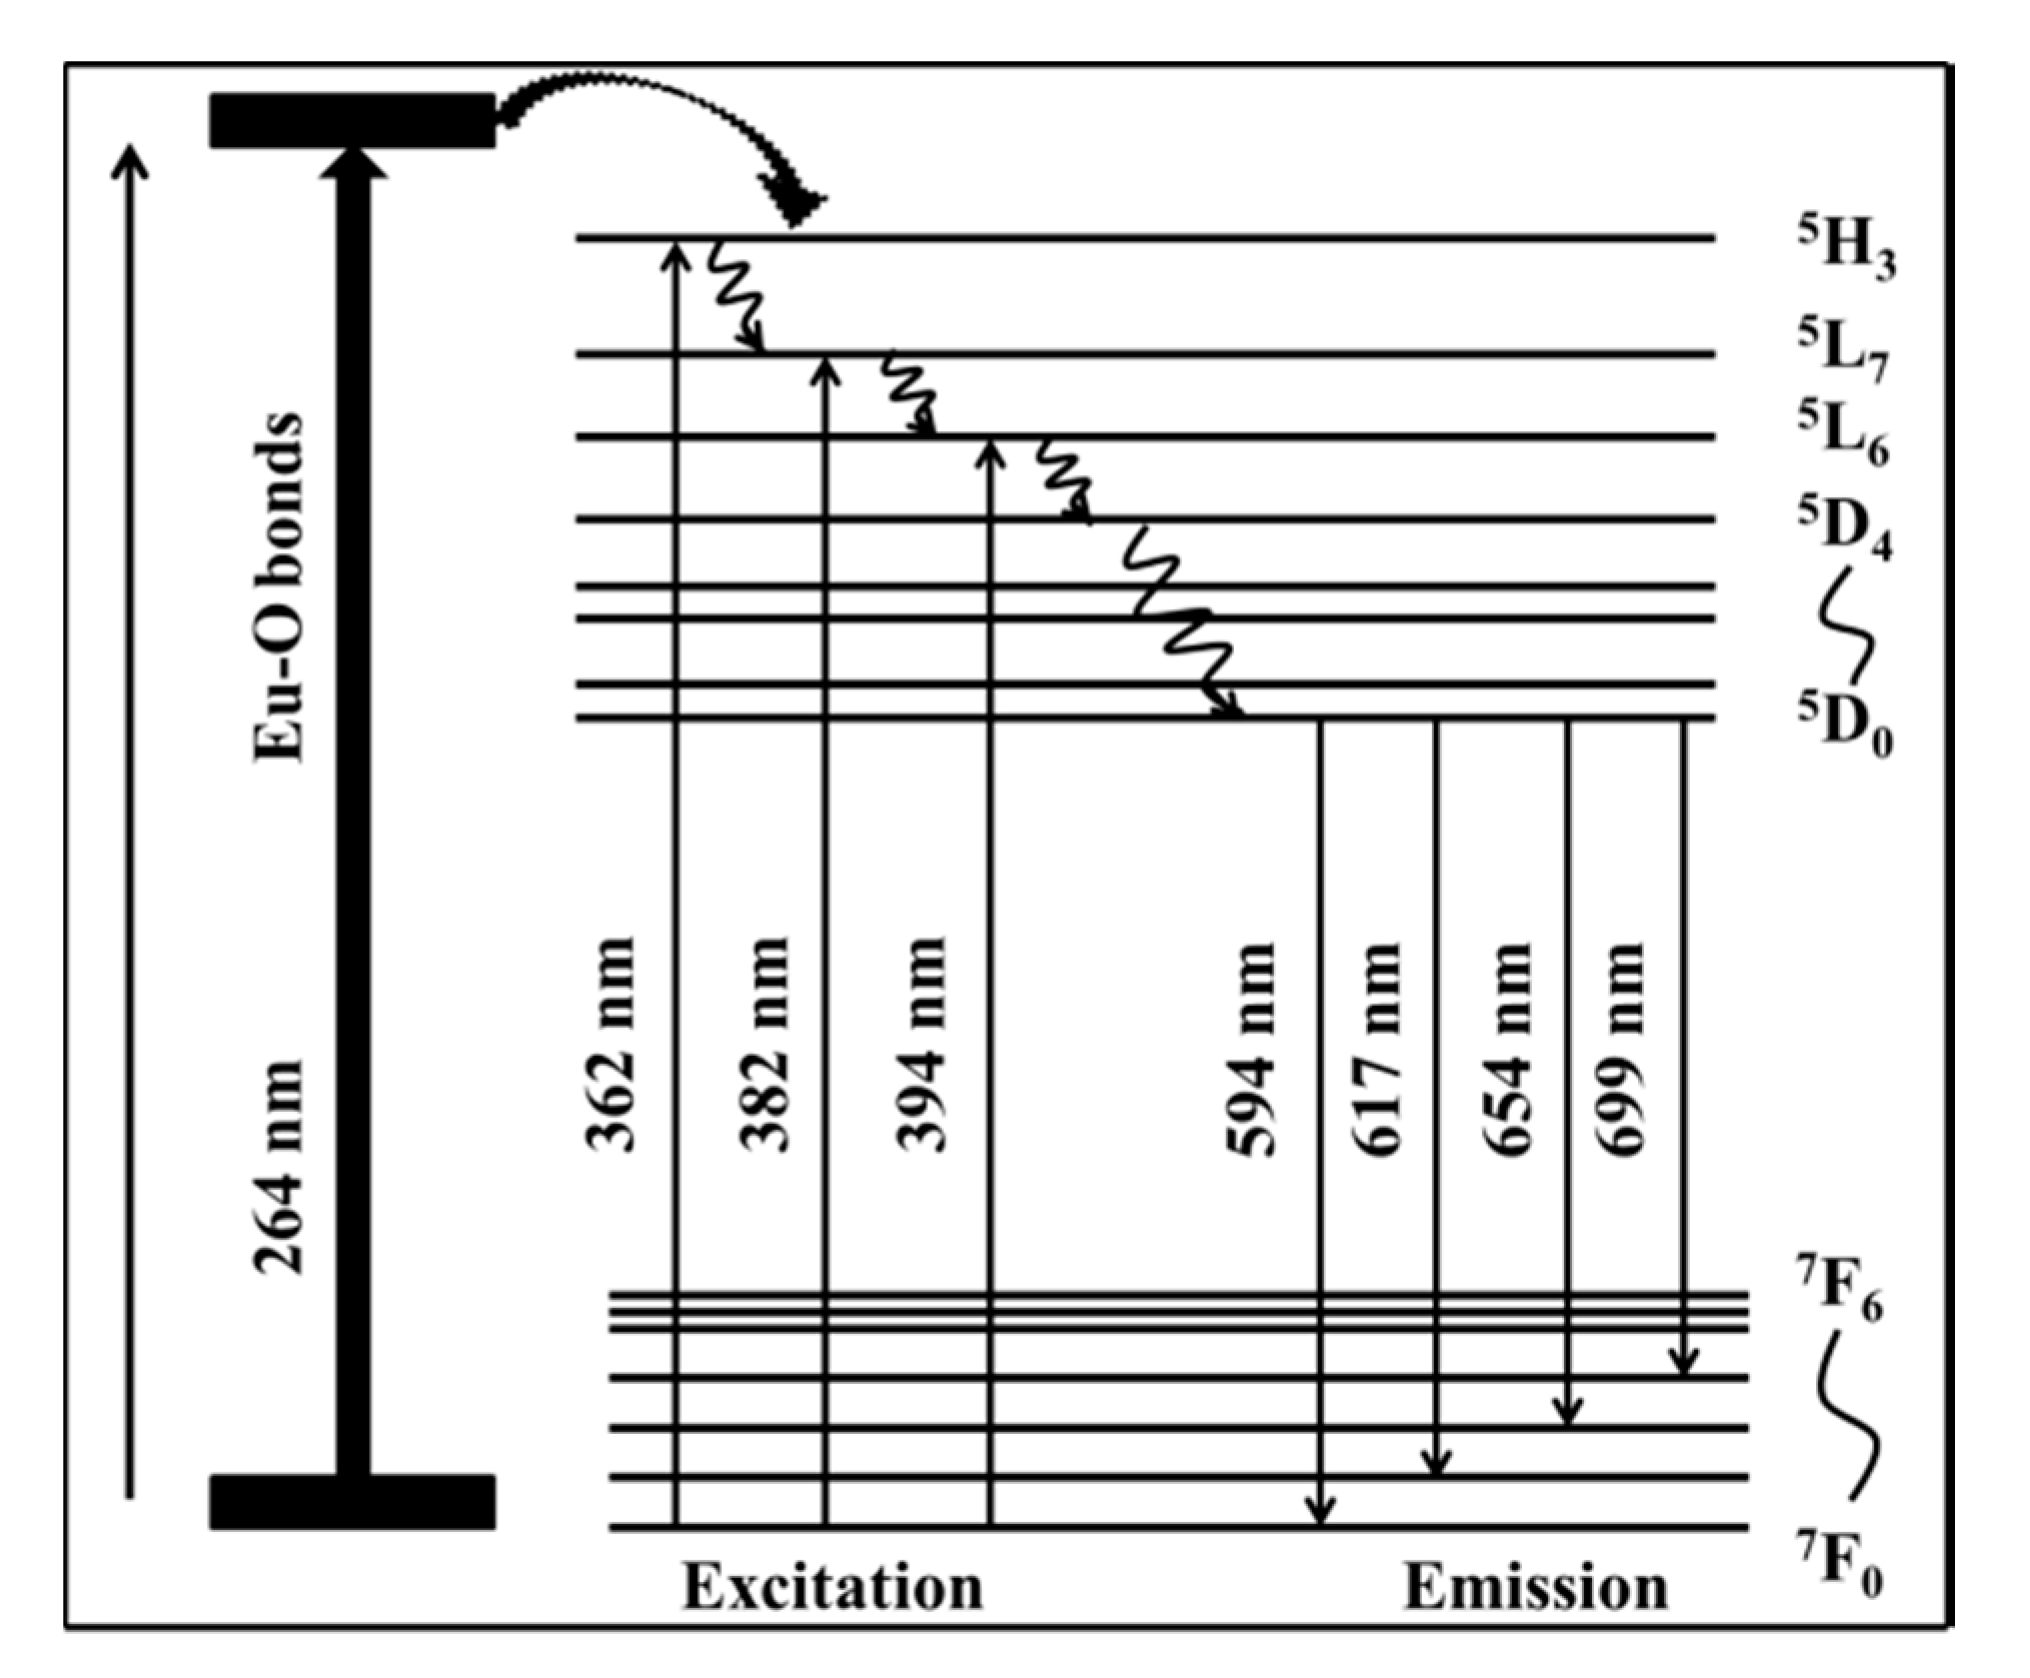
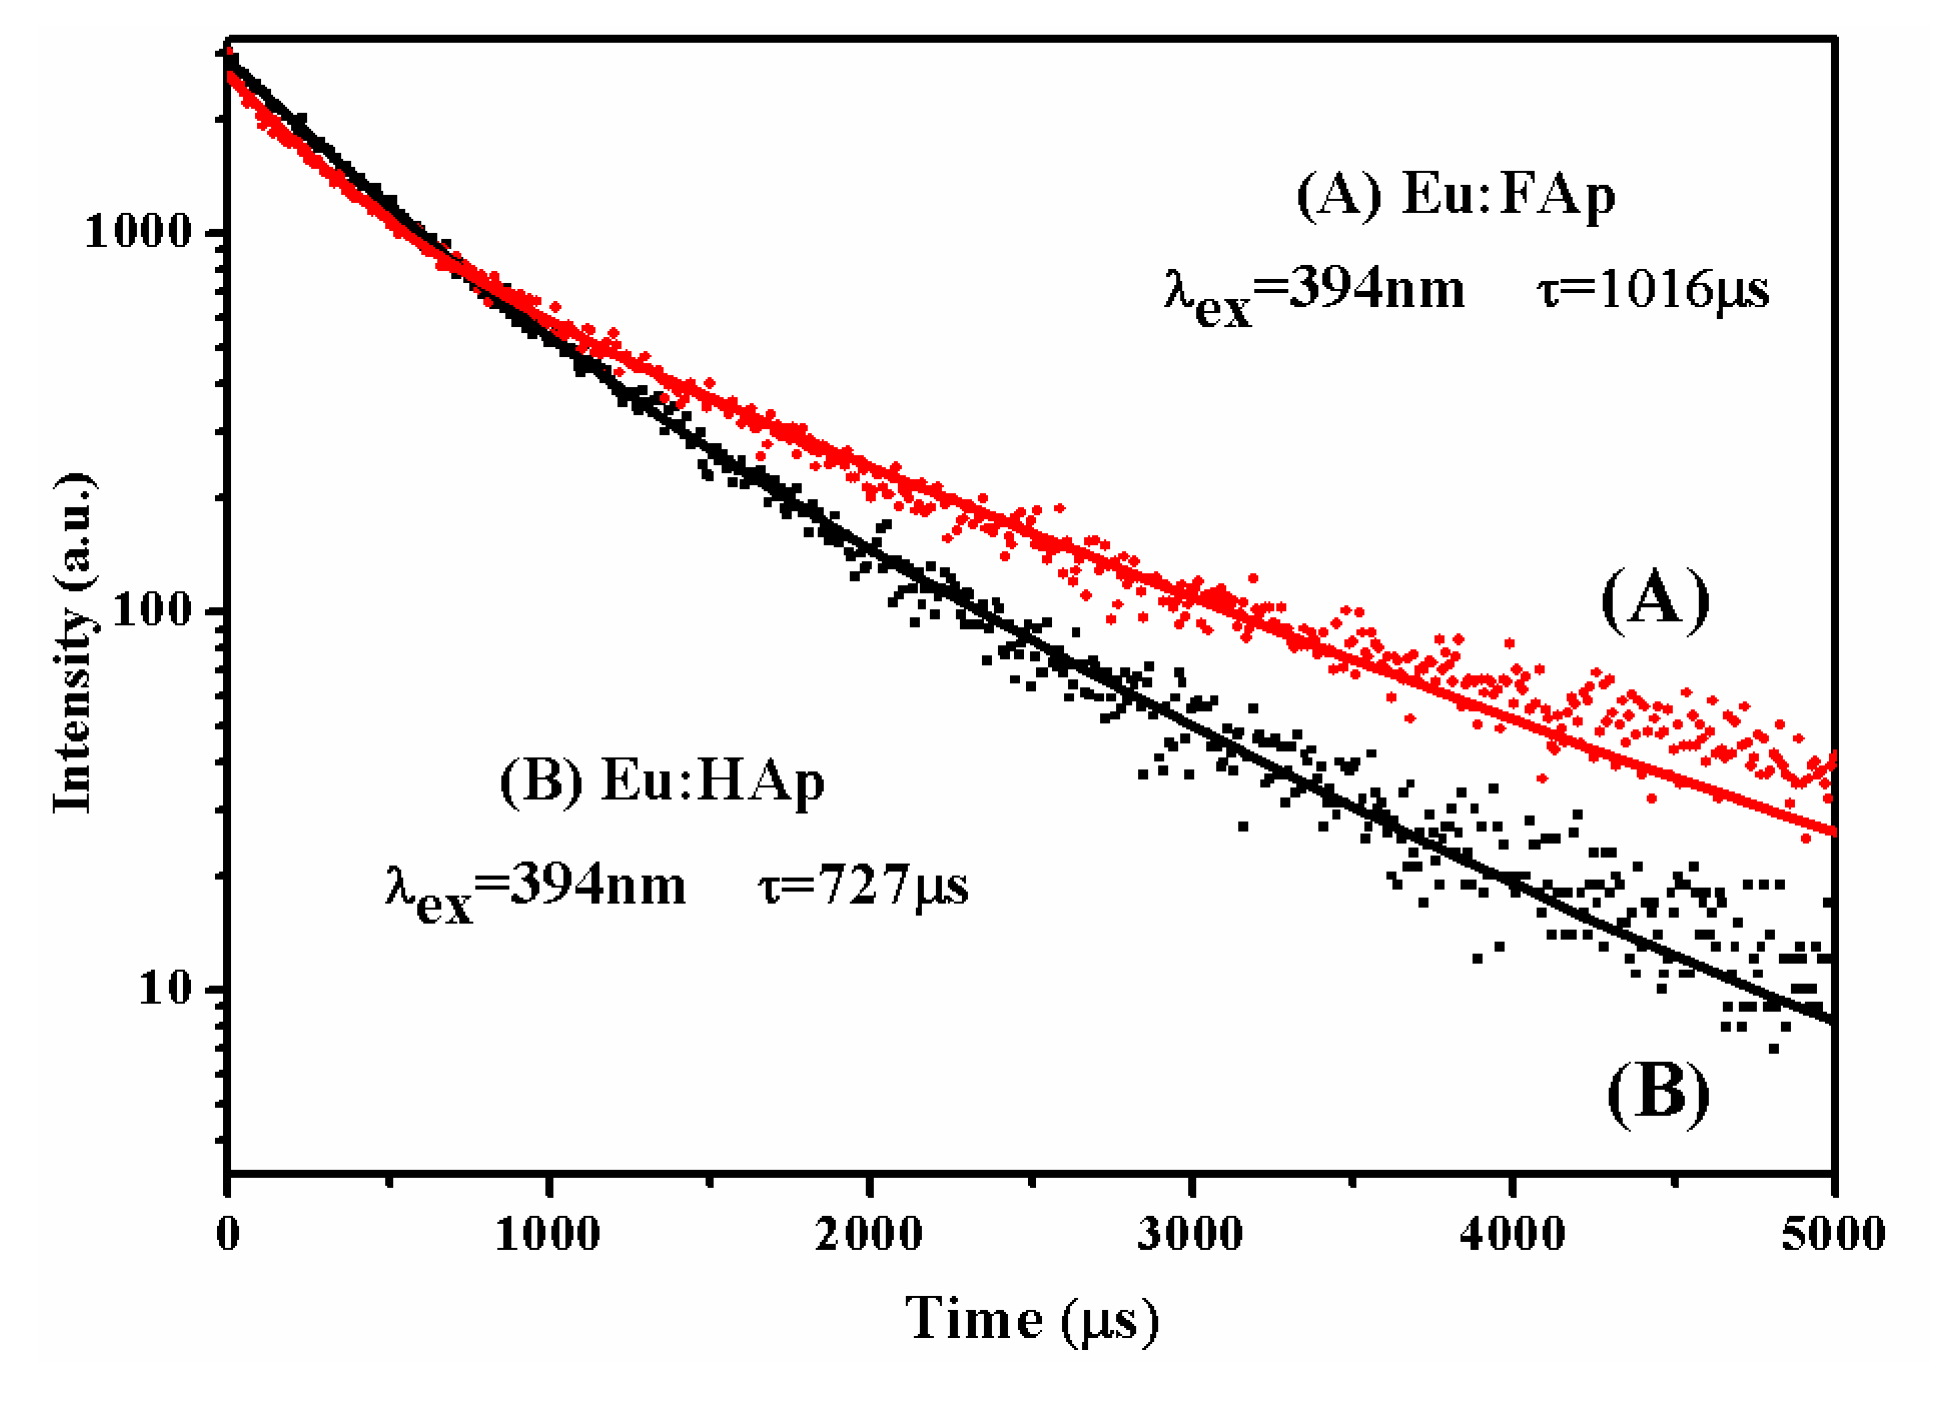
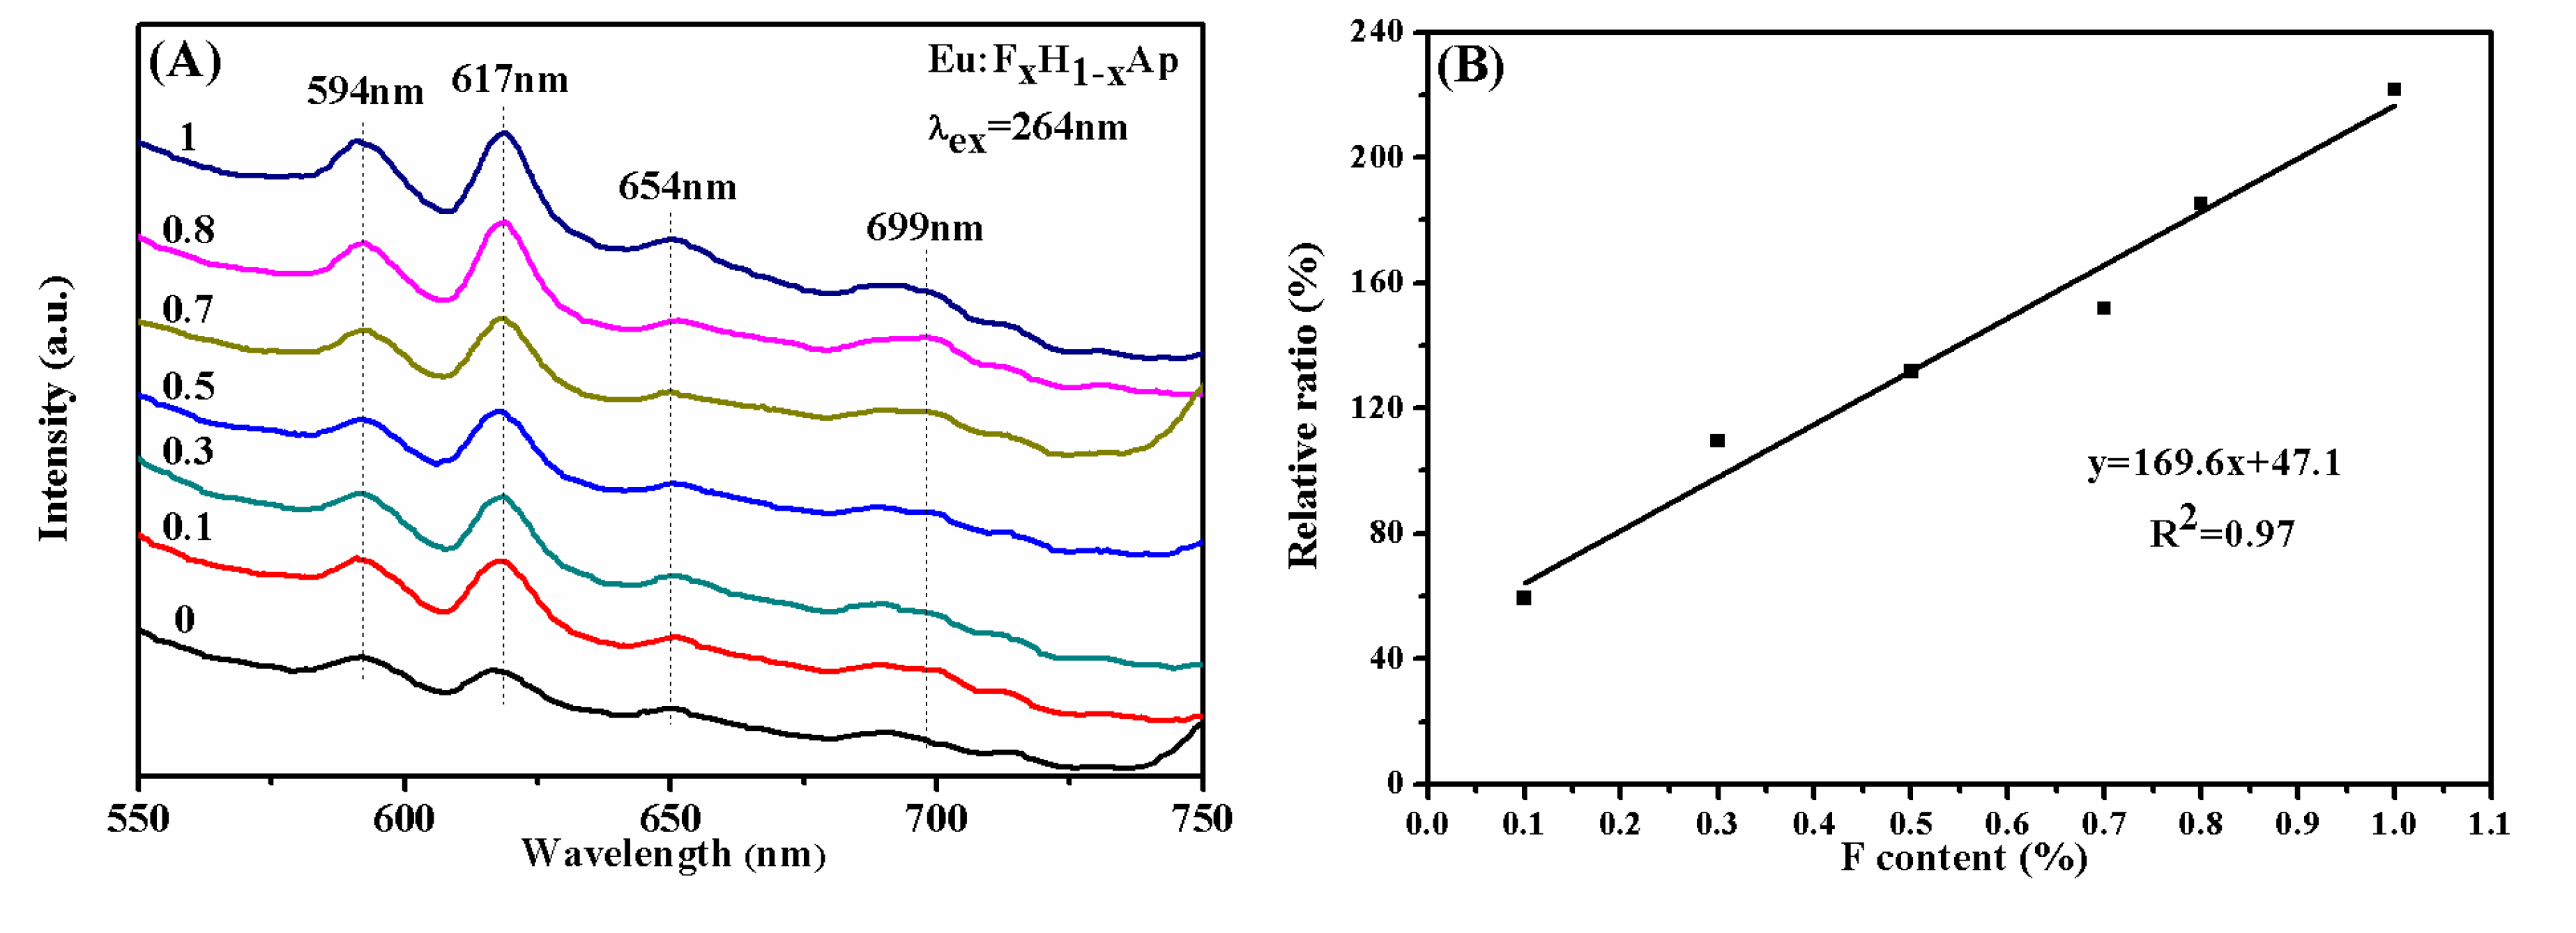
3.4. Luminescence Spectrum

The luminescence property of Eu:FxH1−xAp with a different fluorine substitution ratio was detected. Figure 4 shows the excitation spectra with the emission at 617 nm. Results showed the strongest peak at 394 nm and some smaller peaks at 364 nm, 381 nm, and 264 nm, respectively. The smaller peak at 264 nm derived from the Eu-O bonds belong to a process of energy transfer. The peaks at 394 nm, 364 nm, and 381 nm were due to the electric dipole forbidden intra-configurational f-f transitions [28]. Furthermore, with the increase of the fluorine substitution ratio, the intensity of excitation peaks was enhanced gradually.
With the excitation at 394 nm (Figure 5A), the emission spectra display the strongest peak at 617 nm (5D07F2) and three smaller peaks at 594 nm (5D07F1), 654 nm (5D07F3), and 699 nm (5D07F4). The luminescence signal at 617 nm was stronger than that at 590 nm. In the hydroxyapatite structure, two Ca sites can be occupied by Eu3+ ions. One is Ca (I) with C3 symmetry surrounded by 9 oxygens. The other is Ca (II) with Cs symmetry surrounded by six oxygens and one –OH group [9,29]. Eu3+ ions located in Ca (I) site show the main emission at about 618 nm, and the main emission appears at about 573–578 nm for Eu3+ ions in Ca (II) site [29]. Therefore, in our study, the Eu3+ ions predominantly occupied the Ca (I) site (C3 symmetry) in Eu:FxH1−xAp [30]. The luminescence intensity enhanced with the increase of the fluorine substitution ratio and the peak at 617 nm increased significantly. The luminescence enhancement relative ratio was further calculated using the emission peak at 617 nm (Figure 5B). Results displayed that the luminescence enhancement showed a near linearly increasing relationship with the increase of a fluorine substitution ratio. Under excitation at 264 nm and 394 nm, the emission peaks of Eu:FxH1−xAp nanoparticles were observed at 594 nm, 617 nm, 654 nm, and 699 nm ranging from 550 nm to 750 nm, where the transitions of Eu3+ ions were 5D07F1, 5D07F1, 5D07F3 and 5D07F4, respectively. The luminous mechanism may be explained by the energy level diagram (Figure 6). With the increase of a fluorine substitution ratio, the emission peak position of Eu:FxH1−xAp in luminescence spectra was not moved and the peak intensity was gradually enhanced. Especially, the relationship between the luminescence enhancement and fluorine substitution ratio displayed a nearly linear relationship. Accordingly, it can be expected that the fluorine content in Eu:FxH1−xAp can be estimated by determining the luminescence of Eu3+ ions.
The emissions of Eu3+ excited at 394 nm could be attributed to the two transition modes including electric dipole transition (ED transition) and a magnetic dipole transition (MD transition) [19,31]. The majority of them belonged to ED transition, and some transitions such as the 5D07F1 transition belonged to the MD transition. The 5D07F2 transition was greatly affected by the surrounding symmetry of the Eu3+ ions and properties of the host materials, which was much stronger than the other ED transition. This is also called “hypersensitive transition” [19,32,33]. The 5D07F1 MD transition is largely independent of the environment of the Eu3+ ions and its intensity is often used as a calibration for comparing luminescence spectra [19]. Furthermore, the transition intensity ratio of 5D07F2 (IR) to 5D07F1 (I0) was calculated to reveal the change of the environment of Eu3+ ions. Results showed that the value of IR/I0 was increased with the increase of fluorine substitution ratio, which indicates that the surrounding environment of Eu3+ ions became more asymmetric. It could be inferred that the fluorine substitution for the –OH group changed the environment of Eu3+ ions and caused the rise of asymmetry. In addition, the fluorine ions have lower vibrational energy than the –OH group. This will be favorable for Eu3+ ions’ luminescence transition [5]. Therefore, in the matrix of apatite, the fluorine substitution for the –OH group could decrease the luminescence quenching of Eu3+ ions, which is caused by the –OH group and promotes the luminescence conversion.
Figure 7 shows the decay curves of Eu:HAp and Eu:FAp. Under 394-nm excitation, the average luminescence lifetime of Eu:HAp and Eu:FAp were 727 μs and 1016 μs. The absolute quantum yield of Eu:HAp and Eu:FAp were 1.51% and 8.96%, respectively. The results showed that the luminescence lifetime and quantum yield increased when the –OH group was replaced by F- ions.
With the excitation at 264 nm (Figure 8A), the emission spectra display four peaks similar to those excited at 394 nm (594 nm, 617 nm, 654 nm, and 699 nm). With the increase of the fluorine substitution ratio, the luminescence intensity was gradually enhanced. For example, the luminescence enhancement of peak at 617 nm increased significantly (Figure 8B). In addition, the relative ratio also showed a nearly linear increasing relationship with the increase of the fluorine substitution ratio. The emission peaks were determined by the charge transfer of the Eu-O bond, which is also called the charge transfer band (CTB) (Figure 6) [19,26]. The O2- ions absorb energy and transfer to Eu3+ ions through the Eu-O bond. In our study, the fluorine substitution for the –OH group caused the shrinkage of the crystal lattice. It could be inferred that the distance of Eu-O bond was decreased correspondingly, which was beneficial for the energy transfer of CTB. Accordingly, the fluorine substitution for the –OH group promoted the process of the energy level transition of Eu3+ ions as well as the luminescence.

4. Conclusions

The Eu:FxH1-xAp nanoparticles were synthesized by the hydrothermal method with a different fluorine substitution ratio. With the increase of the fluorine substitution ratio, the luminescence property of Eu:FxH1−xAp could be enhanced. The absorption peak intensity of the hydroxyl group gradually decreased with the increase of the fluorine substitution ratio, which indicates that the hydroxyl group was successfully substituted by fluorine ions. The crystal structure of the Eu:FxH1−xAp was still composed of a single crystal phase where the crystallinity degree was better than HAp while x was greater than 0.5. When x was increased to 1, the crystallinity degree of Eu:FxH1−xAp was the largest, and the maximum was 55.56%. The morphology of Eu:FxH1−xAp was mainly a rod-like structure and the length tended to decrease with the increase of the fluorine substitution ratio. The fluorine affected the symmetry of the structure and, thus, changed the surrounding environment in which Eu3+ ions are located. Furthermore, regarding the fluorine substitution for the –OH group, the quenching effect caused by the –OH group was reduced. In addition, the fluorine ions could produce lower vibration energy and promote luminescence conversion. The fluorine could promote luminescence conversion and luminescence of Eu3+ ions would gradually improve with the increase of the fluorine substitution for the –OH group. There was almost a linear increase when the fluorine substitution ratio increased.

Author Contributions

Conceptualization, Y.H. and X.Z. Methodology, X.Z. and Q.X. Validation, X.Z. and L.L. Investigation, X.Z. and Q.X. Writing-original draft, X.Z. Writing-review and editing, Y.H. All authors have read and agree to the published version of the manuscript.

Funding

The National Key Research and Development Program of China (2016YFB1101302), the National Natural Science Foundation of China (51672206), the Science and Technology Partnership Program, Ministry of Science and Technology of China (KY201602002).

Conflicts of Interest

The authors declare that they have no known competing financial interests.

Appendix A

Table A1. Structural parameters and degree of crystallinity of the Eu:FxH1−xAp.
Samples
(Eu:FxH1−xAp, x)
D(002)
(nm)
V × 103
(nm3)
Xc
(%)
039.4529.038.73%
0.139.8528.635.46%
0.340.6528.028.87%
0.535.7527.920.87%
0.736.5523.721.49%
0.832.8522.243.11%
133.7522.555.56%
Figure A1. SEM images of the Eu:FxH1−xAp with a different fluorine substitution ratio. (A): 0, (B): 0.3, (C): 0.5, (D): 0.7, (E): 0.8, (F): 1.
Crystals 10 00191 g0a1
Figure A2. EDS result of Eu:FAp powders prepared by the hydrothermal method.
Crystals 10 00191 g0a2
Table A2. Calculated elemental molar ratios of Eu:FAp.
Molar RatioCalculated ValueObserved Value
Eu/(Ca + Eu)0.020.02 ± 0.01
(Ca + Eu)/P1.671.69 ± 0.05
F/(Ca + Eu)0.20.24 ± 0.04
Table A3. Particle sizes of the Eu:FxH1−xAp with different fluorine substitution ratio.
Samples
(Eu:FxH1−xAp, x)
Length
(nm)
Diameter
(nm)
Aspect Ratio
(%)
077.70 ± 2.8815.43 ± 0.265.04
0.354.37 ± 1.7814.09 ± 0.303.86
0.547.19 ± 2.5514.31 ± 0.153.30
143.36 ± 2.0214.07 ± 0.493.08

References

  1. Tesch, A.; Wenisch, C.; Herrmann, K.H.; Reichenbach, J.R.; Warncke, P.; Fischer, D.; Müller, F.A. Luminomagnetic Eu3+- and Dy3+-doped hydroxyapatite for multimodal imaging. Mater. Sci. Eng. C 2017, 81, 422–431. [Google Scholar] [CrossRef] [PubMed]
  2. Niu, N.; Wang, D.; Huang, S.; Li, C.; He, F.; Gai, S.; Li, X.; Yang, P. Controlled synthesis of luminescent F-substituted strontium hydroxyapatite with hierarchical structures for drug delivery. CrystEngComm 2012, 14, 1744–1752. [Google Scholar] [CrossRef]
  3. Han, Y.; Wang, X.; Dai, H.; Li, S. Synthesis and luminescence of Eu3+ doped hydroxyapatite nanocrystallines: Effects of calcinations and Eu3+ content. J. Lumin. 2013, 135, 281–287. [Google Scholar] [CrossRef]
  4. Escudero, A.; Calvo, M.E.; Rivera Fernández, S.; de la Fuente, J.M.; Ocaña, M. Microwave Assisted Synthesis of Biocompatible Europium Doped Calcium Hydroxyapatite and Fluoroapatite Luminescent Nanospindles Functionalized with Poly(acrylic acid). Langmuir 2013, 29, 1985–1994. [Google Scholar] [CrossRef] [Green Version]
  5. Hui, J.; Zhang, X.; Zhang, Z.; Wang, S.; Tao, L.; Wei, Y.; Wang, X. Fluoridated HAp:Ln3+ (Ln = Eu or Tb) nanoparticles for cell imaging. Nanoscale 2012, 4, 6967–6970. [Google Scholar] [CrossRef]
  6. Ma, B.; Zhang, S.; Qiu, J.; Li, J.; Sang, Y.; Xia, H.; Jiang, H.; Claverie, J.; Liu, H. Eu/Tb codoped spindle-shaped fluorinated hydroxyapatite nanoparticles for dual-color cell imaging. Nanoscale 2016, 8, 11580–11587. [Google Scholar] [CrossRef]
  7. Li, J.; Wang, X.; Yi, X.; Zhang, L.; Zhou, Z.; Zhao, H.; Gao, F. Towards pH-sensitive imaging of small animals with photon-counting difference diffuse fluorescence tomography. J. Biomed. Opt. 2012, 17, 096011. [Google Scholar]
  8. Rao, J.; Dragulescu Andrasi, A.; Yao, H. Fluorescence imaging in vivo: Recent advances. Curr. Opin. Biotechnol. 2007, 18, 17–25. [Google Scholar]
  9. Sobierajska, P.; Wiglusz, R.J. Influence of the grain sizes on Stokes and anti-Stokes fluorescence in the Yb3+ and Tb3+ ions co-doped nanocrystalline fluorapatite. J. Alloys Compd. 2019, 785, 808–818. [Google Scholar] [CrossRef]
  10. Feng, Z.; Li, Y.; Huang, Y.; Seo, H.J. Luminescence properties of Eu2+ and Eu3+ doped calcium deficient hydroxyapatite prepared in air. J. Alloys Compd. 2011, 509, 7087–7092. [Google Scholar] [CrossRef]
  11. Graeve, O.A.; Kanakala, R.; Madadi, A.; Williams, B.C.; Glass, K.C. Luminescence variations in hydroxyapatites doped with Eu and Eu ions. Biomaterials 2010, 31, 4259–4267. [Google Scholar] [CrossRef]
  12. Xie, Y.; He, W.; Li, F.; Perera, T.S.; Gan, L.; Han, Y.; Wang, X.; Li, S.; Dai, H. Luminescence Enhanced Eu3+/Gd3+ Co-Doped Hydroxyapatite Nanocrystals as Imaging Agents In Vitro and In Vivo. ACS Appl. Mater. Interfaces 2016, 8, 10212–10219. [Google Scholar] [CrossRef] [PubMed]
  13. Chen, F.; Huang, P.; Zhu, Y.J.; Wu, J.; Zhang, C.L.; Cui, D.X. The photoluminescence, drug delivery and imaging properties of multifunctional Eu3+/Gd3+ dual-doped hydroxyapatite nanorods. Biomaterials 2011, 32, 9031–9039. [Google Scholar] [CrossRef] [PubMed]
  14. Zheng, X.; Liu, M.; Hui, J.; Fan, D.; Ma, H.; Zhang, X.; Wang, Y.; Wei, Y. Ln3+ doped hydroxyapatite nanocrystals: Controllable synthesis and cell imaging. Phys. Chem. Chem. Phys. 2015, 17, 20301–20307. [Google Scholar] [CrossRef] [PubMed]
  15. Karthi, S.; Kumar, G.A.; Sardar, D.K.; Dannangoda, G.C.; Martirosyan, K.S.; Girija, E.K. Fluorapatite coated iron oxide nanostructure for biomedical applications. Mater. Chem. Phys. 2017, 193, 356–363. [Google Scholar] [CrossRef] [Green Version]
  16. Stouwdam, J.W.; Veggel, F.C.J.M.V. Near-Infrared Emission of Redispersible Er3+, Nd3+, and Ho3+Doped LaF3 Nanoparticles. Nano Lett. 2002, 2, 733–737. [Google Scholar] [CrossRef]
  17. Landi, E.; Tampieri, A.; Celotti, G.; Sprio, S. Densification behaviour and mechanisms of synthetic hydroxyapatites. J. Eur. Ceram. Soc. 2000, 20, 2377–2387. [Google Scholar] [CrossRef]
  18. Viorel Marin, R.; Chuen How, N.; Max, W.; Brigitte, T.; Peter, F.; Peter, M.G. Size-controlled hydroxyapatite nanoparticles as self-organized organic-inorganic composite materials. Adv. Sci. Technol. 2005, 53, 32–37. [Google Scholar]
  19. Binnemans, K. Interpretation of europium(III) spectra. Coord. Chem. Rev. 2015, 295, 1–45. [Google Scholar] [CrossRef] [Green Version]
  20. Qin, J.; Zhong, Z.; Ma, J. Biomimetic synthesis of hybrid hydroxyapatite nanoparticles using nanogel template for controlled release of bovine serum albumin. Mater. Sci. Eng. C Mater. Biol. Appl. 2016, 62, 377–383. [Google Scholar] [CrossRef]
  21. Doat, A.; Fanjul, M.; Pellé, F.; Hollande, E.; Lebugle, A. Europium doped bioapatite: A new photostable biological probe, internalizable by human cells. Biomaterials 2003, 24, 3365–3371. [Google Scholar] [CrossRef]
  22. Hidouri, M.; Albeladi, N. Lanthanum Neodymium Co-Substituted Calcium Fluorobritholites. J. Mater. Sci. Chem. Eng. 2018, 6, 151–162. [Google Scholar] [CrossRef] [Green Version]
  23. Biazar, E.; Jahandideh, R.; Majdi, A. Synthesis of fluorapatite– hydroxyapatite nanoparticles and toxicity investigations. Int. J. Nanomed. 2011. [Google Scholar] [CrossRef] [PubMed] [Green Version]
  24. Misra, D.N. Adsorption on hydroxyapatite: Role of hydrogen bonding and interphase coupling. Langmuir 1988, 4, 953–958. [Google Scholar] [CrossRef]
  25. Misra, D.N. Adsorption from solutions on synthetic hydroxyapatite: Nonaqueous vs. aqueous solvents. J. Biomed. Mater. Res. 1999, 48, 848–855. [Google Scholar] [CrossRef]
  26. Santos, C.; Clarke, R.L.; Braden, M.; Guitian, F.; Davy, K.W.M. Water absorption characteristics of dental composites incorporating hydroxyapatite filler. Biomaterials 2002, 23, 1897–1904. [Google Scholar] [CrossRef]
  27. Rivas, M.; del Valle, L.J.; Turon, P.; Puiggalí, J.; Alemán, C. Influence of the atmosphere conditions in the structure, properties and solubility of fluorine-substituted hydroxyapatites. Mater. Chem. Phys. 2019, 226, 279–289. [Google Scholar] [CrossRef]
  28. Xing, Q.; Zhang, X.; Wu, D.; Han, Y.; Nirmali Wickramaratne, M.; Dai, H.; Wang, X. Ultrasound-Assisted Synthesis and Characterization of Heparin-Coated Eu3+ Doped Hydroxyapatite Luminescent Nanoparticles. Colloid Interface Sci. Commun. 2019, 29, 17–25. [Google Scholar] [CrossRef]
  29. Gaft, M.; Reisfeld, R.; Panczer, G.; Shoval, S.; Champagnon, B.; Boulon, G. Eu3+ luminescence in high-symmetry sites of natural apatite. J. Lumin. 1997, 72–74, 572–574. [Google Scholar] [CrossRef]
  30. Ternane, R.; Panczer, G.; Cohen Adad, M.T.; Goutaudier, C.; Boulon, G.; Kbir Ariguib, N.; Trabelsi Ayedi, M. Relationships between structural and luminescence properties in Eu3+-doped new calcium borohydroxyapatite. Opt. Mater. 2001, 16, 291–300. [Google Scholar] [CrossRef]
  31. Mcgahan, W.A. 6—Materials Characterization. In Handbook of Magento-Optical Data Recording; Elsevier: Amsterdam, The Netherlands, 1995; pp. 362–424. [Google Scholar]
  32. KlixbüllJørgensen, C.; Judd, B.R. Hypersensitive pseudoquadrupole transitions in lanthanides. Mol. Phys. 1964, 8, 281–290. [Google Scholar]
  33. Zhang, X.; Tan, Q.; Hu, S.; Yang, J. Hydrothermal synthesis of ScVO 4: Ln 3+ (Ln = Eu, Dy, Eu/Dy) microcrystals with controllable morphology, energy transfer and multicolor luminescence. Mater. Chem. Phys. 2018, 215, 259–268. [Google Scholar] [CrossRef]
Figure 1. (A) XRD patterns and (B) FT-IR spectra of the Eu:FxH1−xAp (x = 0, 0.1, 0.3, 0.5, 0.7, 0.8, 1.0) powders with a different fluorine substitution ratio (C) and (D) corresponding to the conversion of Eu:HAp and Eu:FAp absorption peaks.
Crystals 10 00191 g001aCrystals 10 00191 g001b
Figure 2. TEM images of Eu:FxH1−xAp prepared by the hydrothermal method. (A): x = 0, (B): x = 0.3, (C): x = 0.5, (D): x = 1.
Crystals 10 00191 g002
Figure 3. The XPS spectra of Eu:FxH1−xAp (x = 0, 0.3, 0.5, 0.8 and 1) (A) Survey scan spectrum. (B) High-resolution scan spectra of F 1s.
Crystals 10 00191 g003
Figure 4. Luminescence excitation spectra of Eu:FxH1−xAp (x = 0, 0.1, 0.3, 0.5, 0.7, 0.8, 1.0) emission at 617 nm.
Crystals 10 00191 g004
Figure 5. (A) Luminescence spectra of Eu:FxH1−xAp (x = 0, 0.1, 0.3, 0.5, 0.7, 0.8, 1.0) excitation at 394 nm and (B) the relative ratio with a different fluorine ratio.
Crystals 10 00191 g005
Figure 6. Energy level diagram for a luminous mechanism of Eu:FxH1−xAp.
Crystals 10 00191 g006
Figure 7. Decay curves monitored at 617 nm of (A) Eu3+:HAp and (B) Eu3+:FAp.
Crystals 10 00191 g007
Figure 8. (A) Luminescence spectra of Eu:FxH1-xAp (x = 0, 0.1, 0.3, 0.5, 0.7, 0.8, 1.0) excitation at 264 nm. (B) The relative ratio with a different fluorine ratio.
Crystals 10 00191 g008

