Abstract
Expanding eco-friendly approaches to improve plant growth and crop productivity is of great important for sustainable agriculture. Therefore, a field experiment was carried out at the Faculty of Agriculture Farm, Mansoura University, Egypt during the 2018 and 2019 growing seasons to study the effects of different bio- and organic fertilizers and their combination on hybrid maize growth, yield, and grain quality. Seeds were treated with Azotobacter chrocoocum, arbuscular mycorrhizal fungi (AMF), Bacillus circulans, biogas slurry, humic acid (HA), and their combination aiming to increase the growth and yield of maize and to reduce the need for chemical fertilizers. The results showed that combined application of the biofertilizer mixture (Azotobacter chrocoocum, AMF, and Bacillus circulans) with organic fertilizers enhanced maize growth, yield, and nutrient uptake. Moreover, the bio-organic fertilization has improved the soluble sugars, starch, carbohydrates, protein, and amino acid contents in maize seeds. Additionally, the bio-organic fertilization caused an obvious increase in the microbial activity by enhancing acid phosphatase and dehydrogenase enzymes, bacterial count, and mycorrhizal colonization levels in maize rhizosphere as compared with the chemical fertilization. Additionally, the bio-organic fertilizers has improved α-amylase and gibberellins (GA) activities and their transcript levels, as well as decreased the abscisic acid (ABA) level in the seeds as compared to the chemical fertilizers. The obtained results of bio-organic fertilization on the growth parameters and yield of maize recommend their use as an alternative tool to reduce chemical fertilizers.
1. Introduction
Maize (Zea mays L.) is one of the most important cereal crops in the world both as food and feed. Its total world production ranks third, following wheat and rice, and it is consider a staple food in many countries, especially those in the tropics and sub-tropics [1,2,3,4]. In Egypt, maize is considered the second most important crop, where the annual production of the grain reached about 6.8 million tons from 315,000 hectares in 2018 [5]. Maize protein belongs to prolamines which are the most abundant type of proteins stored in cereal seeds, like wheat, maize, sorghum, rice, and barley [6]. Sugar-rich varieties called sweet corn are usually grown for fresh consumption, while field-corn varieties are used for animal feed and as chemical feedstocks. Moreover, maize is also a major source of oil, gluten, and starch, which can be hydrolyzed and enzymatically treated to produce syrups, particularly high fructose corn syrup. The corn steep liquor, a plentiful watery byproduct of the maize wet milling process, is widely used in the biochemical industry and research purposes as a culture medium to grow many kinds of microorganisms [7]. Recently, high consumption of the nitrogen fertilizers by new cultivars of maize plant has significantly increased by 59.60% in the last few years, which causes serious environmental problems [8].
Hence, in order to maximize the use of fertilizers economically and reduce the traces of chemical fertilizers in the environment, biofertilizers are considered as a promising alternative approach for maize and other crop species production. These biofertilizers are mainly based on beneficial microorganisms in a viable state applied to seed or soil aiming to increase soil fertility and plant growth by increasing the number and biological activity of desired microorganisms in the rhizosphere [9]. As soil is a complex system which can be affected by several factors [10,11], improving such beneficial microbial communities in the soil is an important factor in the biogeochemical cycling of both inorganic and organic nutrients, specifically, in the rhizosphere zone which can increase the availability of nutrients to plants and also improve the soil quality [12]. The plant growth-promoting rhizobacteria (PGPR) was used for the first time at the end of the 1970s in many key ecosystem processes, such as bio-fertilizers and bio-pesticides [13]. Recent studies have reported that the bio-fertilizers can promote plant growth through nitrogen fixation, phytohormone, phosphate (P), and potassium solubilization [14,15]. This study reports that using Azotobacter chroococcum and Bacillus circulans as biofertilizers have a promising effect on maize growth and yield as compared with non-inoculated plants.
Among the different biofertilizers, arbuscular mycorrhizal fungi (AMF) is the most effective microbial symbioses for improving the growth and yield of the majority (90%) of plants, including flowering plants, bryophytes, and ferns [16,17,18]. Under the P deficiency in the soil, the AMF can influence plant community development, nutrient uptake, water relations, and above-ground productivity, and can also act as bio-protectants against pathogens and toxic stresses [12]. Moreover, AMF can improve the plant growth by enhancing the photosynthetic rate and gas exchange-related traits [19], or by increasing the availability and translocation of various nutrients [20]. The extrametrical fungal hyphae can deeply extend into the rhizosphere of the soil leading to the absorption of large amounts of various nutrients, increasing the availability and uptake of P and micro-nutrients, and alleviating the stress effects on plant, as well as improve the soil fertility [21]. The symbiotic relationship between plants and mycorrhizal has its consequences by linking the biotic and geochemical portions of the ecosystem, and such relationship can be considered as a bridge connecting the root with the surrounding soil microhabitats [14,22]. A recent study reported that inoculating soil with AMF forms more constant masses and significantly higher extra-radical hyphal mycelium as compared to the non-AMF-treated soils [23].
In addition to the biofertilizers, the use of organic fertilizers can also reduce the application of chemical fertilizers to a great extent. With the increasing interest in using renewable energy, the production and subsequent use of biomass energy is an important organic source [24]. Biogas slurry is one of the best organic fertilizers to revitalize soils, since it is a rich source of both plant nutrients and organic matter. By using this source as an organic fertilizer, it is possible to reduce the use of the chemical fertilizers up to 50%, which will reduce the production costs as well as increase the soil fertility for high crop productivity [25]. Biogas slurry has a large amount of macronutrients, such as N, P, and K, for crop growth and can be also used as a nitrogen fertilizer [26]. Several studies reported that the application of biogas slurry could bring significant changes to different plant species, such as tomato [27], corn [28], and rice [29]. Another study showed that the biogas slurry has the ability to improve the physical and biological characteristics of the soil and can provide both macro and micro nutrients to crops, and the sustainability of the biogas chain would be greatly improved if a suitable method of utilizing the digestate was developed [24].
Seed priming has been frequently used to improve seed germination and seedling development and can also improve plant growth in a wide range of environmental conditions [30,31,32,33,34,35]. As a priming agent, humic acid (HA) are usually used as a kind of hormone that promotes plant growth rather than improving the chemical or the physical conditions of the soil. Moreover, HA has an important function for improving plant growth via increasing the plant nutrient uptake, transport, and availability of micronutrients. In addition, HA may have an important role for inducing the metabolic activity-related enzymes of soil microorganisms [36]. A recent study has shown that seed germination, seedling growth, soluble protein, sugar, and starch contents were significantly improved by HA priming [37]. Moreover, HA priming has the potential to maintain the balance between the ABA and GA biosynthesis and catabolism [37]. Several studies have reported that HA increased the activities of superoxide dismutase (SOD), catalase (CAT), and glutathione peroxidase [38], and reduced the transpiration rate and water use efficiency of the roots [39].
Though there are many studies on the effect of different organic and biofertilizers on different plant species, no information is available on their combined effects with respect to the relative expression level of seed metabolism-related genes, as well as their interaction effects on the rhizosphere microbial communities. The hypothesis of the present study was that the organic fertilizers, biofertilizers, and their combination could improve the plant growth, nutrient uptake, grain yield, quality, and the rhizosphere microbial ecology of hybrid maize using a low dose of the chemical fertilizers. Therefore, to test this hypothesis, different physiological and biochemical, as well as molecular, approaches were investigated. Moreover, the ABA, GA, and α-amylase at both physiological and molecular levels were analyzed to further understand the mechanism by which bio- and organic fertilizers could improve seed vigor of hybrid maize. Additionally, changes in the activities of soil enzymes (acid phosphatase and dehydrogenase), mycorrhizal root colonization, and bacterial counts in the rhizosphere of soil were also determined to provide a better insight into changes in rhizosphere activity and microbial biomass.
2. Materials and Methods
2.1. Experimental Site and Field Management
Two-year field experiments were carried out from May to September of 2018 and 2019 growing seasons at the Experimental Farm, Faculty of Agriculture, Mansoura University, Egypt (27.00 °N 30.00° E). The meteorological data of the study area during both growing seasons are presented in Table 1. Soil at the experimental site was clay loam in texture. Soil samples from 0–30 cm depth from the soil surface were randomly collected before soil preparation and analyzed for various physicochemical and biological properties during both growing seasons as presented in Table 2. The field was prepared through well conventional tillage to a depth of 15 cm, leveling, ridging, and then divided into the specific experimental units.

Table 1.
Meteorological data for the two summer growing seasons 2018 and 2019.
Table 2.
Physicochemical and biological properties of soil used in the two growing seasons, 2018 and 2019.
The treatments were applied using a Completely Randomized Block Design (CRBD) with three replications. The size of the plot was 3 × 3.5 m2 consisting of four ridges of 2.5 length. Nitrogen fertilizer in the form of urea (46%N) at the rate of 285 Kg urea/hectare was applied in two equal doses, in which the first dose was applied after thinning and before the first irrigation, whereas the second dose was applied before the second irrigation. Calcium superphosphate (15.5% P2O5) at the rate of 476 kg/hectare was applied during soil preparation. Potassium fertilizer in the form of potassium sulfate (48% K2O) at the rate of 120 kg/hectare was applied after thinning together with the first dose of nitrogen fertilizer.
Maize seeds (Hageen Fardy No.1) were obtained from the research station, Giza, Egypt. Thereafter, the seeds were surface sterilized with 1% sodium hypochlorite for 5 min, washed with sterilized water, and then treated with the microbial inoculants before planting. Then, seeds were sowed on 15 May 2018 and 2019 in hills, the distance between hills was 25 cm, and 2–3 grains were applied per hill on one side of the ridge. Three weeks and before the first irrigation, the plants were thinned to a one healthy plant per hill. Plots were irrigated as needed according to the optimize recommendations for maize production, in which the first irrigation was applied after 21 days from sowing and the following irrigations were applied at 15 day intervals in both growing seasons and the weeds were controlled by hand.
2.2. Source of Bio- and Organic Fertilizers
Azotobacter chroococcum SARS 101 and Bacillus circulans ARC-SWERI- 2 were obtained from the Laboratory of Bacteriology, Sakha Agricultural Research Station, Kafr El-Sheikh, Egypt. AMF inoculum containing a mixture of different spores of Glomus clarum, Glomus mosseae and Gigaspora margarita was obtained from Botany Department, Faculty of Science, Mansoura University, Egypt.
Liquid biogas slurry produced from fresh rabbits manure was obtained from the biogas unit, Faculty of Agriculture, Mansoura University, Egypt. HA (85%) contain 56% C, 4.5% H, 31% O, and 4.5% N was obtained from Sphinx International Trade Company, Cairo, Egypt.
2.3. Morpho-Physiological Traits
Four plants were randomly collected from each block on 15 August and used to measure plant height (cm), number of leaves per plant, leaf dry weight, root dry weight, leaf area, and chlorophyll content. The plant height was measured from ground level to the collar of the upper leaf with developed leaf sheath using a meter rule. Chlorophyll content was determined on the midpoint of the youngest fully-expanded leaf and on the ear leaf at 12 weeks after planting using SPAD-502 (Minolta Co. Ltd., Osaka, Japan). The mature leaf in the middle quadrant of the plant was used to measure the leaf area according to the method of Amanullah et al. [40] according to the following formula:
where L = Length of leaf, W = Width of leaf, K = constant ≈ 0.75.
LAI = L × W × K
2.4. Yield and Its Attributes
The cob length was immediately measured after harvesting using a ruler. The cob weight and 100 grain weight was calculated after the moisture content of the grain of each plot was adjusted to 15.5%. Number of rows per cob was calculated by counting rows of ten selected cobs and then the average was calculated.
2.5. Efficacy of Bacterial Strains for Phosphate Solubilization and Indole Acetic Acid Production
Solubilization of tricalcium phosphate was measured in Pikovskaya liquid medium [41]. Tricalcium phosphate was added at the rate of 0.25 g/100 mL liquid medium, i.e., 50 mg P2O5/100 mL medium. One milliliter (1 × 10⁸ cfu mL−1) of 48 hour-old liquid cultures of bacterial strains was transferred to each flask and incubated on a rotary shaker operating at 150 rpm at 30 °C for 3, 7, 14, 21, and 28 days. After the incubation period, the liquid cultures were centrifuged at 4000 rpm for 20 min. The concentration of soluble phosphate was determined colorimetrically at 660 nm.
For the indole acetic acid (IAA) determination, A. chroococcum SARS 101 and B. circulans ARC-SWERI- 2 were grown on Ashby’s medium [42] and nutrient broth medium, respectively. Each medium was supplemented with 0.1% L-tryptophan according to Ahmad et al. [43]. One milliliter (1 × 10⁸ cfu mL−1) of 48 hours old liquid cultures of bacterial strains was transferred to each flask and incubated on a rotary shaker operating at 150 rpm at 30 °C for 1, 2, 3, 4, 5, 6, 7, and 8 days. After the incubation period, bacterial cells were centrifuged at 4000 rpm for 20 min. IAA was assayed colorimetrically at 530 nm in the supernatant using Salkowaski reagent [43].
2.6. The Treatment of Seeds and Soils with the Chemical, Bio-, and Organic Fertilizers
Treatments were performed as follows: T1 = 100% NPK, T2 = 50% NPK, T3 = Biogas slurry + 50% NPK, T4 = Humic acid + 50% NPK, T5 = Biogas slurry + Humic acid + 50% NPK, T6 = Biofertilizer mixture (A. chrococcum + AMF + B. circulans) + 50% NPK, T7 = Biogas slurry + Biofertilizers + 50% NPK, T8 = Humic acid + Biofertilizers + 50% NPK, and T9 = Biogas + Humic + Biofertilizers + 50% NPK.
2.7. Preparation and Application of Bio- and Organic Fertilizers
Azotobacter chroococcum SARS 101 was grown on Ashby’s liquid medium [42] for five days at 30 °C (4.6 × 10⁸ cfu/mL). Bacillus circulans ARC-SWERI-2 was grown on nutrient broth medium for three days at 30 °C (8.7 × 10⁸ cfu/mL). Equal volumes were mixed to make the mixture of the inoculum. Seeds were soaked in microbial inoculants for 30 min. Arabic gum (16%) was used as an adhesive agent. An extra of 10 mL culture was added to each plant with the second irrigation. The non-bacterial treatments received equal amounts of autoclaved inoculum to provide the same nutrients.
The mixture of different AMF spores (Glomus clarum, Glomus mosseae and Gigaspora margarita) were left to multiply for six months on Sudan grass (Sorghum sudanenses Pers.) roots as the suitable trap plants under controlled conditions and then used as AM fungal inoculum. The AMF inoculum consisted of a mixture of soil, spores, hyphae, and infected Sudan grass root fragments. Five grams of trapped soil (~50 spores per one gram soil) and 0.5 g of infected roots of Sudan grass with an infection level of 70% were then inoculated to each hill. The inoculum was placed 5 cm below the surface of the soil before sowing. The non-mycorrhizal treatments received equal amounts of autoclaved inoculum to provide the same nutrients other than mycorrhizal spores.
Biogas slurry was added at the rate of 0.5 m3 /hectare with the second irrigation. The pH of the biogas fertilizer used in this study was 8.23 and the full description of its nutrients composition is shown in Table S1. HA was added at the rate of 12 kg/hectare with the first dose of chemical fertilizers [36].
2.8. Staining and Estimation of Mycorrhizal Root Colonization
Fresh roots for each treatment were rinsed repeatedly in tap water to remove the adhering soil particles, 30 root segments 0.5–1 cm were cleared with 10% KOH solution and stained with 0.05% trypan blue (SIGMA) in lacto-phenol for 15 min at 90 °C [44]. The stained segments were placed on slides and were observed with a microscope (Carl Zeiss, Milan, Italy) at 40× magnification. They were visually allocated to six classes of AMF colonization (from 0 to 5, depending on the occurrence of AMF structure in the root segment) and to four levels of AMF abundance (from A0 to A3). Mycorrhizal colonization levels of the stained roots were estimated by the method of Trouvelot et al. [45] using Mycocalc software (Wuhan, Hubei, China). This method calculates three parameters of mycorrhizal colonization, F: Frequency of root colonization (percentage of root segments colonized), M: Intensity of cortical colonization (proportion of cortical colonization in all the mycorrhizal root system) and A: Arbuscule frequency in roots (percentage of arbuscular colonization of the root system.
2.9. Microbial Count Determination
In the maize plant rhizosphere, total bacterial count was counted on nutrient agar medium (oxoid) after three days of incubation, phosphate-dissolving bacteria were counted on Pikovskaya medium [41] after five days of incubation, and potassium-releasing bacteria were counted on Alexandrov’s medium [46] after five days of incubation by using pour-plate method, while Azotobacter was counted on Ashby’s medium [41] using the most probable number (MPN) technique after 15–21 days of incubation. Each was performed at 30 °C.
2.10. Determination of Acid Phosphatase and Dehydrogenase Enzymes
Acid phosphatase and dehydrogenase activities were determined as the method described by [47]. To determine acid phosphatase activity dry soil was incubated in disodium phenyl phosphate for 2 h, and the results are expressed as the µg of P2O5 released per 1 g of dry soil using 4-aminoantipyrine colorimetry at 510 nm. To determine dehydrogenase activity dry soil was incubated in triphenyl-tetrazolium chloride (TTC) for 24 h, and the results were expressed as the mg of triphenyl formazan (TPF) released per 1 g of dry soil. The concentration of TPF in the extract was measured using a colorimeter at 485 nm.
2.11. Biochemical Analysis of the Seeds
Total soluble sugar and starch contents were determined in the grains according to the method of Zhu et al. [48]. Soluble protein contents were measured in the grains according to the method portrayed by Bradford [49]. The amino acids were determined according to the methods of Ahmed et al. [50]. The soluble carbohydrates were determined according to Dubois et al. [51].
2.12. Nutrient Uptake
In order to determine the NPK content in the leaves and roots, the oven dried samples of maize were finely ground, and 0.1 g of samples was moved to the digestion tubes for digestion using H2SO4 and H2O2 [52]. Nitrogen was determined from plant filtrate using Kjeldhal method [53]. The phosphorus was determined according to Ashraf et al. [54]. Potassium was determined by flame photometer [55].
2.13. Plant Hormones, α-Amylase Activities, and Their Transcript Levels
The ABA levels were determined in the seeds with or without priming using the method of Zhu et al. [48]. For the GA analysis, seed sample (0.1 g) were frozen in liquid nitrogen and finely ground with 15 mL methanol containing 20% water (v/v) at 4 °C for 12 h and GA analysis was measured as depicted by Zhu et al. [48]. For α-amylase activity, seeds were frozen in liquid nitrogen and then stored at −80 °C. The seeds were hulled and ground into fine powder, followed by fine homogenization with 10 mL distilled water, after which the mixtures were centrifuged at 5000× g for 10 min. Supernatant was collected in 10 mL centrifuge tube for chromogenic reaction. The α-amylase activity was measured by the 3, 5-dinitrosalicylic acid colorimetric (DNS) method [56].
The transcript levels of ABA, GA, and α-amylase were analyzed in maize seeds, and total RNA was isolated by using RNA isolation (Takara, Japan). Briefly, a frozen seed sample (100 mg) was ground in liquid nitrogen using a mortar and pestle and QRT-PCR was carried out according to the method of Salah et al. [30]. Primers used in QRT-PCR and shown in Table S2 were the same as those used in a recent study [2]. ACT1 was used as a control to measure the transcript levels of the other studied genes. The PCR program used in this study was the same as described by Salah et al. [30].
2.14. Statistical Analysis
The obtained results are the means of three replicates ± standard deviation (SD). The data were analyzed using one-way analysis of variance (ANOVA) by SPSS v16.0 (SPSS, Inc., Chicago, IL, USA), and means were separated using Duncan’s multiple range tests (α = 0.05).
3. Results
3.1. Plant Growth Promotion Traits
The result presented in Figure 1 showed that tri-calcium phosphate was solubilized by the two bacterial strains A. chroococcum SARS 101 and B. circulans ARC-SWERI-2. The maximum release of soluble phosphorus was 11.68 mg P2O5 /100 mL culture after 28 days by A. chroococcum SARS 101 and 16.70 mg P2O5/100 mL culture after 14 days by B. circulans ARC-SWERI-2 (Figure 1). Moreover, these strains could also produce IAA and showed a different pattern in their efficacy (Figure 1). As such, IAA was detected from the first day and reached the highest level at the 7th day (162.11 µg/mL culture) for A. chroococcum SARS 101 and up to the 6th day (27.05 µg/mL) for B. circulans ARC-SWERI-2, then the IAA production was decreased by both strains (Figure 1).
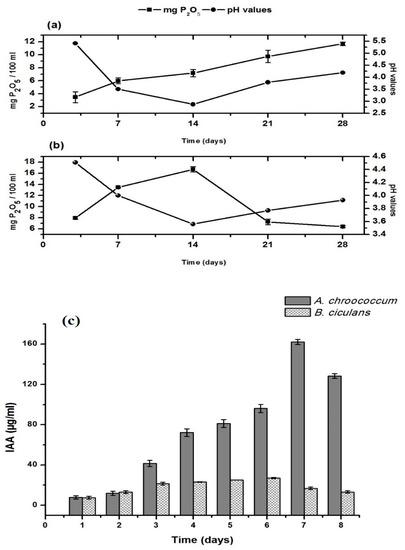
Figure 1.
Phosphate solubilization by the bacterial strains; (a) A. chroococcum SARS 101, (b) B. circulans ARC-SWERI-2; and (c) Indole acetic acid production by A. chroococcum SARS 101 and B. circulans ARC-SWERI-2.
3.2. Effects of Bio- and Organic Fertilizers on Morpho-Physiological Parameters
The effect of chemical fertilization and bio-organic fertilization on growth parameters of maize are presented in Table 3. Taken together, the plant height, number of leaves per plant, leaf and root dry weight, and leaf area, as well as chlorophyll content were significantly improved by the bio-organic fertilization treatments. The results reveal that he application of biogas slurry, humic acid, biofertilizer mixture, and their combination resulted in significant increases in the plant height, leaf and root dry weight, leaf area, and chlorophyll content as compared with the chemical fertilizers at both 100% and 50% levels (Table 3). Maximum plant height (276.20 cm and 300.17 cm) was observed with T6 (Biofertilizers + 50% NPK), followed by T7 (Biogas slurry + Biofertilizers + 50% NPK) (269.00 cm and 295.83 cm) in both growing seasons, respectively. However, the maximum number of leaves per plant was observed in T8 (Humic acid + Biofertilizers + 50% NPK) (16.66 and 13.33), followed by T7 (15.33 and 14.33) and T6 (15.33 and 14.33) in both growing seasons, respectively (Table 3). Moreover, maximum leaf dry weight (44.85 g and 45.59 g) was observed in the plants those treated with T7 in both seasons, respectively. Similarly, maximum root dry weight (17.11 g and 18.94 g) was also observed with T7-treated plants in both seasons, respectively (Table 3). Furthermore, maximum leaf area was observed with T7 (1238.2 cm2 and 1147.7 cm2), followed by T6 (1199.1 cm2 and 1143.7 cm2) and T8 (1212.4 cm2 and 1147.7 cm2) in both seasons, respectively (Table 3). Total chlorophyll of maize leaves was affected by the application of biogas slurry, humic acid, biofertilizer mixture, and their combinations during the two seasons (Table 3). The results show that the interaction between biogas slurry and biofertilizers recorded the highest values of total chlorophyll (98.20 and 102.20) in both growing seasons, respectively, as compared with their individual treatments and control plants (Table 3). These results suggested that the organic and biofertilizer mixture both alone or in combination have the potential to improve seedlings growth of maize by using only the half dose of recommended quantity of the chemical fertilizers.
Table 3.
Morpho-physiological traits of maize treated with organic and biofertilizers alone or in combination.
3.3. Effects of Bio- and Organic Fertilizers on Yield and Their Attributes
Mean data regarding the yield and its attributes of maize as affected by organic and biofertilizers both alone and in combination are presented in Table 4. The results show that cob weight, cob length, rows number/cob, and 100 grain weight were improved by the application of biogas slurry, humic acid, biofertilizers, and their combinations. Maximum values of the aforementioned parameters was achieved by the application of biogas slurry, humic acid, biofertilizer mixture and their combination as compared with the chemical fertilizers at both 100% and 50% levels (Table 4). The results show that highest cob weight (227.56 g and 237.64 g) was observed with the application of T7 followed by T6 (219.87 g and 235.07 g) and T8 (211.11 g 214.67 g) in both growing seasons, respectively (Table 4). A similar trend was also observed by application of T7 for cob length (20.53 cm and 19.76 cm), rows numbers (13.66 and 14.66), and 100 grain weight (35.48 g and 31.99 g) in both growing seasons, respectively (Table 4). It could be concluded that the application of the organic and biofertilizers beside 50% NPK has improved the maize yield parameters as compared with the control plants.
Table 4.
Yield and its attribution to maize treated with organic and biofertilizers alone or in combination.
3.4. Effects of Bio- and Organic Fertilizers on Grains Quality
The effects of bio-organic and chemical fertilization on the maize grain quality are presented in Table 5. The results revealed that the bio-organic fertilization has an effective role in improving the content of soluble sugars, starch, carbohydrates, and amino acids in maize grains. The highest soluble sugars content of maize grains (18.35 and 25.58 µgg−1 FW) was achieved by the application of T8 followed by T9 (23.36 and 19.86 µgg−1 FW) and T7 (20.59 and 20.37 µgg−1 FW) in both growing seasons, respectively (Table 5). The protein content was highly significantly improved by T6 (342.60 and 260.70 mgg−1 FW) followed by T9 (282.71 and 216.66 mgg−1 FW), T8 (243.08 and 247.10 mgg−1 FW) and T7 (190.53 and 167.71 mgg−1 FW) in both growing seasons, respectively (Table 5). Interestingly, the highest content of the starch (47.65% and 26.31%) in the maize grains was observed in T5 (Biogas slurry + Humic acid + 50% NPK) followed by T6 (40.94% and 35.53%) and T7 (35.71% and 27.60%) in both growing seasons, respectively (Table 5). The highest carbohydrates content (64.49% and 53.44%) was observed in T6 followed by T8 and T9 in both growing seasons, respectively (Table 5). On the other hand, highest content of amino acids was achieved by T6 (18.92 and 21.39 mgg−1) followed by T9, T8 and T7 in both growing seasons, respectively (Table 5). Thus, the application of organic and biofertilizers may have the potential to improve the grain quality via improving photosynthesis and nutrient uptake, which ultimately translocated to the seed and contributes to improving the grain nutrient status, amino acids, starch, carbohydrates, and protein of the grains.
Table 5.
Grain quality of maize treated with organic and biofertilizers alone or in combination.
3.5. Effects of Bio- and Organic Fertilizers on Nutrient Uptake
Mean data regarding the nutrient uptake (N, P and K) in the root and leaves of maize as affected by bio-organic and chemical fertilization are presented in Figure 2. Results revealed that the bio-organic fertilization has significantly improved the content of N, P, and K in leaves and roots of maize in both growing seasons as compared with chemical fertilizers at both 50% and 100% rates. The NPK contents were significantly increased by inoculation with the biofertilizer mixture alone (T6) and its combinations with biogas slurry alone (T7), humic acid alone (T8) and both humic acid and biogas slurry (T9) as compared to the individual application of humic or biogas or the dual application (T3, T4 and T5). Moreover, the highest values of N, P, and K contents in leaves and roots was observed in maize plants those inoculated with T6 in the both seasons (Figure 2). Accordingly, this results explored that the interaction between the organic and biofertilizers resulted in enhanced nutrients uptake specifically N content which could contribute to increasing amino acids content and thereby the protein content of the maize grains.
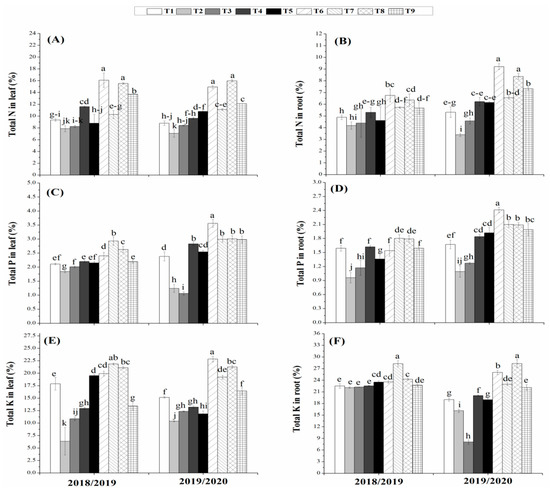
Figure 2.
Nutrients (N, P, and K) contents in the leaves (A, C, and E) and in the roots (B, D, and F) of maize plants treated with organic and biofertilizers alone or in combination. (T1 = 100% NPK, T2 = 50% NPK, T3 = Biogas slurry + 50% NPK, T4 = Humic acid + 50% NPK, T5 = Biogas slurry + Humic acid + 50% NPK, T6= Biofertilizer mixture + 50% NPK, T 7= Biogas slurry + Biofertilizers + 50% NPK, T8 = Humic acid + Biofertilizers + 50% NPK, T9 = Biogas + Humic + Biofertilizers + 50% NPK). Different letters mean significant difference at p < 0.05.
3.6. Effects of Bio- and Organic Fertilizers on Hormone Activities and Their Transcription Levels
In order to further study the beneficial role of the organic and biofertilizers for maize growth, the hormones involving in the control of seed germination, such as GA, ABA, and α-amylase, were investigated at the both physiological and molecular levels (Figure 3). The results showed that the ABA activity was significantly decreased in the plants those treated with organic and biofertilizers either alone or in combination as compared with the chemical fertilizers in both growing seasons (Figure 3A). The minimum level of the ABA activity was observed with T9 in 2018/2019 and with T7 in 2019/2020 growing season. These results of the ABA activity are consistent with its transcription levels in terms of ZmCYP707A2 and ZmCPK11 genes (Figure 3B,C). On contrast, GA activity was improved by the application of organic and biofertilizers either alone or in combination in both growing seasons (Figure 3D). Similar trend was observed in transcription levels of the genes involved in the GA biosynthesis, namely ZmGA20ox1 and ZmGA3ox2 in both growing seasons (Figure 3E,F). These genes were highly up-regulated in T9-treated plants in both growing seasons, except for ZmGA3ox2 in the 2019/2020 season, which was highly up-regulated in T8-treated plants. Similarly, the α-amylase activity and their transcription levels were improved by the organic and biofertilizers in both growing seasons (Figure 3G–I). These results revealed that the seeds produced from the plants those treated with both organic and biofertilizers are more healthy and developed through the solubilizing of starch to a simple form by the amylase enzyme for providing the energy to the germinating embryo. Additionally, the higher activity of GA in these seeds could break dormancy and promote germination upon seeds exposed to the appropriate conditions for germination.
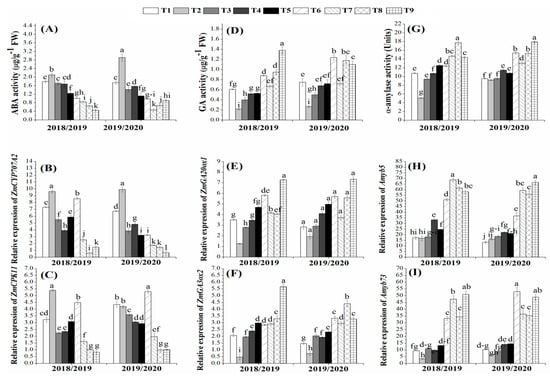
Figure 3.
Effects of organic and biofertilizers alone or in combination on ABA activity (A) and its transcription levels (B,C); GA activity (D) and its transcription levels (E,F); α-amylase activity (G) and its transcription levels (H,I) in maize grains. (T1 = 100% NPK, T2 = 50% NPK, T3 = Biogas slurry + 50% NPK, T4 = Humic acid+50% NPK, T5 = Biogas slurry + Humic acid + 50% NPK, T6 = Biofertilizer mixture + 50% NPK, T7 = Biogas slurry + Biofertilizers + 50% NPK, T8 = Humic acid + Biofertilizers + 50% NPK, T9 = Biogas + Humic + Biofertilizers + 50% NPK). Different letters mean significant difference at p < 0.05.
3.7. Effects of Bio- and Organic Fertilizers on Dehydrogenase and Phosphatase Activities
The activities of dehydrogenase and phosphatase were affected by the application of both organic and biofertilizers either alone or in combination in both growing seasons (Figure 4). The activities of dehydrogenase and phosphatase enzymes in the maize rhizosphere were significantly increased by combined applications of humic acid and/or biogas slurry with the bio-fertilizers (T9) as compared to its individual application. Maximum values of the dehydrogenase and phosphatase activities were observed in T9 and T8 in 2018/2019 and 2019/2020, respectively, while minimum values of the dehydrogenase and phosphatase activities were observed with 50% of the chemical fertilizers (T2) in both growing seasons (Figure 4A,B). Accordingly, this study suggests that the application of organic and biofertilizers either alone or in combination could stimulate soil microbes to synthesize dehydrogenase and phosphatase, thus promoting microbial metabolic activity.
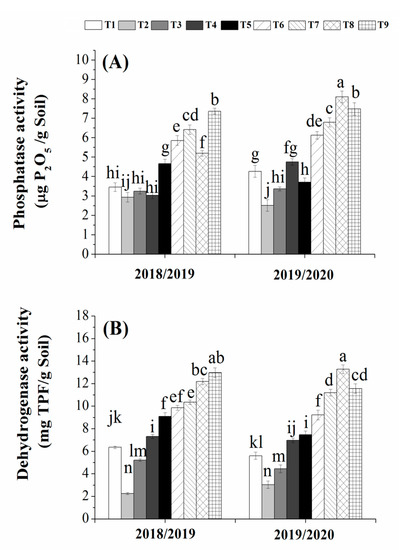
Figure 4.
Acid phosphatase (A) and dehydrogenase (B) activities as affected by organic and/or bio-fertilization. (T1 = 100% NPK, T2 = 50% NPK, T3 = Biogas slurry + 50% NPK, T4 = Humic acid + 50% NPK, T5 = Biogas slurry + Humic acid + 50% NPK, T6 = Biofertilizer mixture + 50% NPK, T7 = Biogas slurry + Biofertilizers + 50% NPK, T8 = Humic acid + Biofertilizers + 50% NPK, T9 = Biogas + Humic + Biofertilizers + 50% NPK). Different letters mean significant difference at p < 0.05.
3.8. Effects of Bio- and Organic Fertilizers on Mycorrhizal Colonization Levels
Mycorrhizal colonization levels (F%, frequency of mycorrhizal colonization; A%, intensity of mycorrhizal colonization and A%, arbuscular frequency) were highly affected by different tested treatments (Table 6). Among the different treatments, all levels of mycorrhizal colonization were increased by the application of biogas slurry (T7) during both growing seasons, followed by the biofertilizer mixtures (T6). Structures of arbuscular mycorrhizal fungi (arbuscules, vesicles, and internal hyphae) were observed in stained roots of maize plants (Figure 5). No mycorrhizal colonization was observed in the non-mycorrhizal maize plants.
Table 6.
Mycorrhizal colonization levels in the roots of maize treated with organic and biofertilizers alone or in combination.
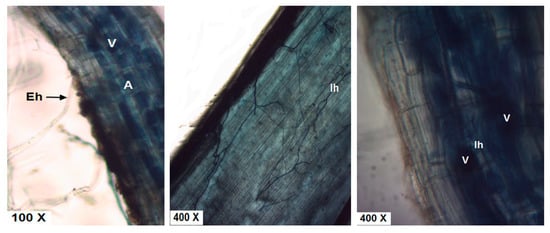
Figure 5.
Root segment of maize root colonized with arbuscular mycorrhizal fungi showing the structure of fungal tissue. Where, Eh = external hyphae, Ih = internal hyphae, V= vesicle, and A = arbuscule.
3.9. Effects of Bio- and Organic Fertilizers on Bacterial Counts
The effects of chemical and bio-organic fertilization on bacterial counts in maize rhizosphere are presented in Table 7. Results revealed that the total bacterial counts for Azotobacter spp., phosphate-solubilizing bacteria, and potassium-releasing bacteria in the rhizosphere of the plants treated with bio-organic was higher than those of chemical fertilizer-treated plants (Table 7). The highest numbers of bacterial counts were recorded in the rhizosphere of the T9-treated plants. Additionally, the highest bacterial numbers were obtained at 60 days after planting (DAP) under all applications, then it decreased at 90 DAP, which might be due to the decrease of root exudates by old plants. Regardless of the effects of bio-organic fertilization, the bacterial counts were increased as NPK-fertilizer was highly supplied during all plant growth stages (Table 7). Moreover, the combined applications of humic acid and/or biogas slurry with the bio-fertilizers (T9) significantly increased bacterial counts in the maize rhizosphere as compared to its individual application. Thus, it could be stated that the bio-organic fertilization has a pronounced increase in bacterial counts in comparison with the mineral fertilization.
Table 7.
Bacterial counts in the root rhizosphere of maize treated with organic and biofertilizers alone or in combination.
4. Discussion
Inoculation with plant growth-promoting micro-organisms and the use of organic fertilizers can increase the productivity of maize and reduce chemical fertilizers usage. Therefore, the present study focused on studying the effect of biogas slurry and humic acid as organic fertilizers, inoculation by AMF, A. chrococcum, and Bacillus circulans, and their combinations, on the growth and productivity of maize. The ability of rhizobacteria to solubilize phosphate and to produce IAA was tested in this study. The potential ability of A. chrococcum and B. circulans to solubilize phosphate was also investigated. The results showed that A. chrococcum reached its maximum activity after 28 days of incubation, whereas B. circulans reached the maximum activity after 14 days of incubation, then was decreased. The decrease in P content with the advance of the incubation period could be attributed to the utilization of P resulting in the fluctuating levels of P release, and availability of soluble P in the culture medium might also have an inhibitory effect on further P solubilization [57,58,59,60]. Excretory toxic products may also responsible for such decline in P solubilization. Moreover, the correlation between pH and P solubilization was tested in the present study. Generally, there was a rapid decrease in pH values within the first three days of the experiment, reflecting the high activity of organic carbon degradation bacteria leading to organic acids releasing which mainly contribute to the increasing pH value. The increase in pH might be due to a subsequent oxidation of organic acids produced in the culture media or might be due to the formation of other natural substances [57,58,59]. Moreover, both bacterial strains can effectively produce IAA which may contribute to improving the nutrition of maize plants.
Plant–microbe interactions in the rhizosphere are the main factor for plant growth and soil fertility. The current study indicated that the plant growth, yield and grains quality of maize were positively affected by the application of biogas slurry, humic acid, biofertilizers, and their combinations. The effective role of biofertilizer inoculation on plant growth could be related to its ability to produce high quantities of auxin, such as indole acetic acid. Moreover, these microorganisms and AMF have the potential for N fixation, and P and K mobilization, leading to enhanced nutrient uptake and plant growth [61,62,63]. Previous studies also reported that the N-fixing and P-solubilizing bacterial strains had the ability to provide nutrients and stimulate each other through their physical and biochemical activities and, subsequently, enhancing the physiological properties of plants [64]. A similar study has also shown that application biofertilizers, humic acid, and their combinations positively affected plant growth parameters [36]. As such, in the present study, plant growth and yield of maize was improved by the humic acid application (Table 3 and Table 4). These results are consistent with a previous study reporting that increasing humic acid in the rhizosphere zone could improve the plant growth and development by increasing the availability of essential nutrients and biomolecules for root absorbance [39]. The stimulatory mechanisms may be that humic acid could increase the cell membrane permeability, oxygen uptake, and root cell elongation [36,65], or by increasing water retention and mobilizing nutrient availability [66].
Application of biogas slurry to farmland can effectively increase the availability of soil nitrogen, and essential macro and micronutrients, which can enhance crop yield and grain quality. Such nutrients from organic sources are more efficient in the different plant functions, such as protein and enzyme synthesis, than those from chemical sources [67,68] The observed increase in the growth and yield of maize in response to biogas slurry in the present study (Table 3 and Table 4) might be due to its effect on cell development, enzyme regulation, and induction of the photosynthetic process. These results are consistent with the findings obtained by Lu et al. [69] who demonstrated that the application of biogas slurry increased the rice yield by 24.0% and 4.9% as compared to no fertilization and conventional fertilization treatments, respectively. Moreover, the high P content of the slurry might also contribute to improving the biomass and yield of maize. In addition, these compounds can act as an energy sources for carbohydrate metabolism and reproductive processes [25].
The current study reported that T6 (Biofertilizers + 50% NPK) had the highest values of N, P, and K contents, followed by the combinations between either humic or biogas slurry with biofertilizers as compared to humic or/and biogas slurry without biofertilizers. Several studies reported the beneficial roles of different bacterial strains to promote plant growth and nutrient uptake for different plant species, such as wheat with Azospirillum, Pseudomonas, Providencia, and Anabaena [70,71,72]; sugar beet and barley with Bacillus, Paenibacillus, Pseudomonas, and Rhodobacter [73,74]; sugarcane with Herbaspirillum [75]; sunflower with Bacillus [76]; and maize with Herbaspirillum, Trichoderma, Pseudomonas, and Bacillus [77,78]. The increase of nutrients content in bio-organic-treated plants might be due to the enhancement of the biological N2 fixation and/or production of organic acids which could help in P and K solubilization. Moreover, the production of certain growth promoting substances using bacterial inoculation such as A. chroococcum SARS and B. circulans ARC-SWERI-2, could effectively affect root development and, consequently, their function in water and nutrient uptake. Accordingly, the function of all mycorrhizal systems depends on the ability of the fungal symbiont to absorb inorganic and/or organic nutrients available in the soil. These findings are consistent with those obtained by Wu et al. [14] who stated that the use of biofertilizer containing Glomus mosseae, Azotobacter chroococcum, Bacillus megaterium, and Bacillus mucilaginous has increased the nutritional assimilation of total N, P, and K of maize plant. Similar observations showed that the application of humic acid and AMF has improved the physical properties of the soil and increased the nutrient availability in the rhizosphere to the plants [62,79]. Therefore, improving nutrient uptake of maize plants by bio-organic fertilizers not only improves grain yield but can also increase grain quality.
As such, the present study indicated that the organic and biofertilizers have significantly increased the grain quality and metabolism in both growing seasons (Table 5; Figure 3 and Figure 4). This study is consistent with a previous study suggesting that biogas slurry plays a role in the balance of carbon and nitrogen metabolisms and, thus, improves the grain amino acid content [80]. Moreover, increased nitrogen uptake of leaves due to the dual inoculation of both organic and biofertilizers may induce phytohormone production, which stimulates the photosynthesis process and, consequently, increases protein content [81]. Thus, the application of organic and biofertilizers may have the potential to improve the grain quality via improving the photosynthetic and the nutrient uptake, which ultimately translocates to the seed and contribute for improving the grain nutrient status, amino acids, starch, carbohydrates and protein of the grains. In the current study, the organic and biofertilizers induce the hormones related with seed metabolism, such as ABA, GA, and amylase, which contribute to vigorous seeds as compared with the chemical fertilizers. In this context, our previous findings also found that humic acid treatment could achieve a balance between ABA and GA and, thus, increase seed vigor as compared with the control [37]. Improving the seed quality along with inducing amylase activity by the biofertilizers can also contribute to seed development, as increasing protein, amino acids, and starch can be used for the mobilization by the amylase to provide energy for the germinating embryo. These findings are supported by the previous reports suggesting that partial disruption of humic acid agglomerates by root-secreted organic acids may then release individual growth regulatory molecules that are small enough to penetrate through the cell wall matrix to the cell membrane and effect changes in gene expression or enzyme activities [37,82,83].
It was shown that adding biogas slurry to the biofertilizer mixture containing AMF has an effective influence on increasing mycorrhizal colonization levels (frequency (F%), intensity (M%) of mycorrhizal colonization, and arbuscular development (A%)) in root tissues of maize plants. These results are in agreement with those obtained by Abou-aly et al. [36] and Habashy et al. [84] who reported that organic fertilizers significantly increased colonization of mycorrhiza. However, the colonization was slightly decreased by the application of the combination between biogas slurry and humic acid. These results are in agreement with those obtained by Zhang et al. [85] and Wang et al. [86] who noted that the population size of mycorrhizal colonization was significantly decreased at high rates of organic fertilizer use.
Key soil enzymes, namely phosphatase and dehydrogenase, were mainly induced from microbial activities in the rhizosphere, playing an important role for organic matter decomposition and nutrient remobilization of rhizosphere soil [87]. The dehydrogenase activity is always only present in viable cells and essentially depends on the metabolic state of the soil microbial community, and may therefore be considered a direct measure of soil microbial activity [47], while soil phosphatase enzyme plays an important role in the mineralization of organic P [88]. The current study indicated that acid phosphatase and dehydrogenase enzymes in maize rhizosphere were significantly increased by combined application of humic acid and/or biogas slurry with the bio-fertilizers (Figure 4A,B). This may be due to the mechanisms of bacteria and AMF in improving the physical and chemical soil properties, especially the soil structure, which enhance the microbial activity in the soil. Additionally, biogas slurry is a high-quality nutrient material that has the ability to improve the physical and biological quality of the soil. Addition of HA may play an important role in restoring optimal levels of organic matter for plant growth and for microbial activity, which is associated with enzymes activity. These results are in agreement with those obtained by Abou-aly et al. [36], who observed an increase in the activities of phosphatase and dehydrogenase enzymes with application of humic acid. Moreover, Zheng et al. [89] and Abubakr et al. [90] reported that the addition of biogas residues as fertilizers resulted in an increase of soil microbial activities. Similar reports have also indicated that soil health and microbial activity was enhanced by the combination of biogas slurry and PGPR [68,91].
The current results showed that the combination of organic fertilizers (HA and/or biogas slurry) with the bio-fertilizers has significantly increased bacterial counts in the maize rhizosphere. An increase in bacteria might be due to nutrient viability and organic matter-favored content in the reproduction of bacteria and other organisms, as they serve as sources of energy for the development of microorganisms and supply certain essential nutrient elements and compounds required by soil microorganisms. Furthermore, organic matter decomposition liberates heat which enhances the growth of microorganisms. These results were in harmony with those obtained by Hauka et al. [92], who found that the mixed inoculum of Azotobacter, Azospirillum, cyanobacteria, and AMF in the presence of compost as organic fertilizer recorded the highest number of total bacteria, such as Azotobacter, Azospirillum, and cyanobacteria, as well as increased the mycorrhizal infection. Similarly, the bio-fertilization has increased the microbial count as compared with the mineral fertilization as observed in wheat [62] and in onion [63].
5. Conclusions
Based on the obtained results, it could be concluded that application of biogas slurry, humic acid, biofertilizer mixture, and their combination has improved seedling growth, maize yield, and its attributes by using only half the dose of the recommended quantity of the chemical fertilizers. The interaction between the organic and biofertilizers resulted in enhancing the soil nutrient content, which might not only have increased the total N, P, and K contents in the soil, but also increased the availability of these elements, thus enabling maize roots to absorb more nutrients. Increasing the uptake of such essential nutrients by plants contributes to the increase in the grain quality by translocating to the seed, thus improving the amino acid, starch, carbohydrate, and protein contents. Hence, this study indicates that the seeds produced from the plants treated with both organic and biofertilizers are healthier and better developed, having higher starch content, and having higher activities of amylase and GA enzymes which could promote germination and seedling development. This study suggests that organic and biofertilizers, either alone or in combination, could stimulate soil microbial activity and metabolism of the substances in the soil by enhancing the activities of dehydrogenase and phosphatase in the soil. Thus, the current research revealed that the integration of bio-organic fertilizer + 50% chemical fertilizer can serve as an effective and alternative fertilizer in order to reduce the consumption of chemical fertilizers for sustainable agriculture.
Supplementary Materials
The following are available online at https://www.mdpi.com/2073-4395/10/3/319/s1, Table S1. Nutrients composition of biogas fertilizer, Table S2. Sequences of oligonucleotide primers used in QRT-PCR.
Author Contributions
A.M.E.-S., M.S.S., and D.F.I.A. initiated, designed, conducted, and monitored the experiment. M.S.S. and C.G. performed the RNA extractions, plant hormones analysis, and the chemical analysis of the seeds. Y.A.H., C.G., and H.S. performed the soil enzymes measurements. A.M.E.-S. and D.F.I.A. prepared the biofertilizers and performed the microbiological measurements. M.S.S., Y.A.H., and C.G. analyzed the data. M.S.S. and A.M.E.-S. wrote the first draft of the manuscript. M.S.S. revised and edited the final version of the manuscript. All authors have read and agreed to the published version of the manuscript.
Funding
The authors are grateful for Natural Science Foundation of Anhui Province, China [1908085MC69] and China Post-doctoral Science Foundation Fund [2019M6617770].
Acknowledgments
The authors would like to thank Abdel-Fattah G.M. for providing arbuscular mycorrhizal fungi inoculum (Glomus clarum, Glomus mosseae and Gigaspora margarita).
Conflicts of Interest
The authors declare that they have no conflict of interest.
References
- Mohammadi, P.; Castel, S.E.; Brown, A.A.; Lappalainen, T. Quantifying the regulatory effect size of cis-acting genetic variation using allelic fold change. Genome Res. 2017, 27, 1872–1884. [Google Scholar] [CrossRef]
- Li, Z.; Xu, J.; Gao, Y.; Wang, C.; Guo, G.; Luo, Y.; Huang, Y.; Hu, W.; Sheteiwy, M.S.; Guan, Y.; et al. The synergistic priming effect of exogenous salicylic acid and H2O2 on chilling tolerance enhancement during maize (Zea mays L.) seed germination. Front. Plant Sci. 2017, 8, 1153. [Google Scholar] [CrossRef]
- He, F.; Shen, H.; Lin, C.; Fu, H.; Sheteiwy, M.S.; Guan, Y.; Huang, Y.; Hu, J. Transcriptome analysis of chilling-imbibed embryo revealed membrane recovery related genes in maize. Front. Plant Sci. 2017, 7, 1978. [Google Scholar] [CrossRef]
- Abdoulaye, A.O.; Lu, H.; Zhu, Y.; Alhaj Hamoud, Y.; Sheteiwy, M. The global trend of the net irrigation water requirement of maize from 1960 to 2050. Climate 2019, 7, 124. [Google Scholar] [CrossRef]
- FAOSTAT. Food and Agriculture Organization of the United Nations Statistics Division. 2019. Available online: http://www.fao.org/faostat/en/#home (accessed on 20 November 2019).
- Holding, D.R. Recent advances in the study of prolamine storage protein organization and function. Front. Plant Sci. 2014, 5, 276. [Google Scholar] [CrossRef] [PubMed]
- Krenz, R.D.; EI Guindy, M.; Ariza-Nino, E.; Siddik, I. Utilization of maize in Egypt. Report Number 72 Proposed to Ministry of Agriculture & Land Reclamation; US Agency for Int. Dev. Agriculture Policy Reform Program. Reform Design and Implementation: Washington, DC, USA, 1999.
- Abdel Monem, M.A.S.; Khalifa, H.E.; Beider, M.; El Ghandour, I.A.; Galal, Y.G.M. Using biofertilizers for maize production: Response and economic return under different irrigation treatments. J. Sust. Agric. 2000, 1–9. [Google Scholar] [CrossRef]
- Subba Roa, N.S. Soil Microbiology, 4th ed.; Science Publishers: Enfield, NH, USA, 1999; p. 407. [Google Scholar]
- Alhaj Hamoud, Y.; Shaghaleh, H.; Sheteiwy, M.S.; Guo, X.; Elshaikh, N.A.; Khan, N.; Oumarou, A.; Rahim, S.F. Impact of alternative wetting and soil drying and soil clay content on the morphological and physiological traits of rice roots and their relationships to yield and nutrient use-efficiency. Agric. Water Manag. 2019, 223, 105706. [Google Scholar] [CrossRef]
- Alhaj Hamoud, Y.; Wang, Z.; Guo, X.; Shaghaleh, H.; Sheteiwy, M.S.; Chen, S.; Qiu, R.; Elbashier, M. Effect of Irrigation Regimes and Soil Texture on the Potassium Utilization Efficiency of Rice. Agronomy 2019, 9, 100. [Google Scholar] [CrossRef]
- Jeffries, P.; Gianinazzi, S.; Perotto, S.; Turnau, K.; Barea, J.M. The contribution of arbuscular mycorrhizal fungi in sustainable maintenance of plant health and soil fertility. Biol. Fertil. Soils 2003, 37, 1–16. [Google Scholar] [CrossRef]
- Kloepper, J.; Schroth, M. Plant growth-promoting rhizobacteria on radishes. In Proceedings of the 4th International Conference on Plant Pathogenic Bacteria, Berkeley, CA, USA, 20 August 1978; pp. 879–882. [Google Scholar]
- Wu, S.C.; Cao, Z.H.; Li, Z.G.; Cheung, K.C.; Wong, M.H. Effects of biofertilizer containing N-fixer, P and K solubilizers and AM fungi on maize growth: A greenhouse trial. Geoderma 2005, 125, 155–166. [Google Scholar] [CrossRef]
- Bashan, Y.; de-Bashan, L.E. Plant Growth-Promoting. Encyclopedia. Soils Environ. 2005, 1, 103–115. [Google Scholar]
- Zhu, X.C.; Song, F.B.; Xu, H.W. Arbuscular mycorrhizae improve low temperature stress in maize via alterations in host water status and photosynthesis. Plant Soil 2010, 331, 129–137. [Google Scholar] [CrossRef]
- Ahanger, M.A.; Tyagi, S.R.; Wani, M.R.; Ahmad, P. Drought Tolerance: Role of Organic Osmolytes, Growth Regulators, and Mineral Nutrients, in Physiological Mechanisms and Adaptation Strategies in Plants under Changing Environment; Ahmad, P., Wani, M.R., Eds.; Springer: New York, NY, USA, 2014; Volume 1, pp. 25–55. [Google Scholar]
- Tarnabi, Z.M.; Iranbakhsh, A.; Mehregan, I.; Ahmadvand, R. Impact of arbuscular mycorrhizal fungi (AMF) on gene expression of some cell wall and membrane elements of wheat (Triticum aestivum L.) under water deficit using transcriptome analysis. Physiol. Mol. Biol. Plants 2019, 1–20. [Google Scholar] [CrossRef]
- Birhane, E.; Sterck, F.; Fetene, M.; Bongers, F.; Kuyper, T. Arbuscular mycorrhizal fungi enhance photosynthesis, water use efficiency, and growth of frankincense seedlings under pulsed water availability conditions. Oecologia 2012, 169, 895–904. [Google Scholar] [CrossRef] [PubMed]
- Rouphael, Y.; Franken, P.; Schneider, C.; Schwarz, D.; Giovannetti, M.; Agnolucci, M. Arbuscular mycorrhizal fungi act as bio-stimulants in horticultural crops. Sci. Hort. 2015, 196, 91–108. [Google Scholar] [CrossRef]
- Begum, N.; Qin, C.; Ahanger, M.A.; Raza, S.; Khan, M.I.; Ashraf, M.; Ahmed, N.; Zhang, L. Role of arbuscular mycorrhizal fungi in plant growth regulation: Implications in abiotic stress tolerance. Front. Plant Sci. 2019, 10, 1068. [Google Scholar] [CrossRef]
- Larsen, J.; Pineda-Sánchez, H.; Delgado-Arellano, I.; Castellano-Morales, V.; Carreto-Montoya, L.; Villegas-Moreno, J. Interactions between microbial plant growth promoters and their effects on maize growth performance in different mineral and organic fertilization scenarios. Rhizosphere 2017, 3, 75–81. [Google Scholar] [CrossRef]
- Syamsiyah, J.; Herawati, A.; Mujiyo. The potential of arbuscular mycorrhizal fungi application on aggregrate stability in alfisol soil. In Proceedings of the IOP Conference Series: Earth Environmental Science, Surakarta, Indonesia, 10–12 August 2018; Volume 142, p. 012045. [Google Scholar]
- Zheng, X.; Fan, J.; Cui, J.; Wang, Y.; Zhou, J.; Ye, M.; Sun, M. Effects of biogas slurry application on peanut yield, soil nutrients, carbon storage, and microbial activity in an Ultisol soil in southern China. J. Soils Sediments 2016, 16, 449–460. [Google Scholar] [CrossRef]
- Islam, M.D.R.; Rahman, S.M.E.; Rahman, M.D.M. The effects of biogas slurry on the production and quality of maize fodder. Turk. J. Agric. For. 2010, 34, 91–99. [Google Scholar]
- Tan, F.; Wang, Z.; Zhouyang, S.Y.; Li, H.L.; Xie, Y.P.; Wang, Y.P.; Zheng, Y.M.; Li, Q.B. Nitrogen and phosphorus removal coupled with carbohydrate production by five microalgae cultures cultivated in biogas slurry. Bores. Technol. 2016, 221, 385–393. [Google Scholar] [CrossRef]
- Yu, F.B.; Luo, X.P.; Song, C.F.; Zhang, M.X.; Shan, S.D. Concentrated biogas slurry enhanced soil fertility and tomato quality. Acta Agric. Scand. Sect. B Soil Plant Sci. 2010, 60, 262–268. [Google Scholar] [CrossRef]
- Lal, C.M.; Shakeel, A.K.; Navindu, G. Impacts of biogas slurry application on soil environment, yield and nutritional quality of baby corn. Vegetos 2015, 28, 194–202. [Google Scholar]
- Niyungeko, C.; Liang, X.; Liu, C.; Liu, Z.; Sheteiwy, M.; Zhang, H.; Zhou, J.; Tian, G. Effect of biogas slurry application rate on colloidal phosphorus leaching in paddy soil: A column study. Geoderma 2018, 325, 117–124. [Google Scholar] [CrossRef]
- Salah, M.S.; Guan, Y.; Cao, D.; Li, J.; Nawaz, A.; Hu, Q.; Hu, W.; Ning, M.; Hu, J. Seed priming with polyethylene glycol regulating the physiological and molecular mechanism in rice (Oryza sativa L.) under nano-ZnO stress. Sci. Rep. 2015, 5, 14278. [Google Scholar] [CrossRef] [PubMed]
- Sheteiwy, M.S.; Fu, Y.; Hu, Q.; Nawaz, A.; Guan, Y.; Zhan, L.; Huang, Y.; Hu, J. Seed priming with polyethylene glycol induces antioxidative defense and metabolic performance of rice under nano-ZnO stress. Environ. Sci. Pollut. Res. 2016, 23, 19989–20002. [Google Scholar] [CrossRef] [PubMed]
- Sheteiwy, M.S.; Shen, H.; Xu, J.; Guan, Y.; Song, W.; Hu, J. Seed polyamines metabolism induced by seed priming with Spermidine and 5-aminolevulinic acid for chilling tolerance improvement in rice (Oryza sativa L.) seedlings. Environ. Exp. Bot. 2017, 137, 58–72. [Google Scholar] [CrossRef]
- Sheteiwy, M.S.; An, J.; Yin, M.; Jia, X.; Guan, Y.; He, F.; Hu, J. Cold plasma treatment and exogenous salicylic acid priming enhances salinity tolerance of Oryza sativa seedlings. Protoplasma 2018, 256, 1–21. [Google Scholar]
- Sheteiwy, M.S.; Gong, D.; Gao, Y.; Pan, R.; Hu, J.; Guan, Y. Priming with methyl jasmonate alleviates polyethylene glycol-induced osmotic stress in rice seeds by regulating the seed metabolic profile. Environ. Exp. Bot. 2018, 153, 236–248. [Google Scholar] [CrossRef]
- Sheteiwy, M.S.; Shao, H.; Qi, W.; Alhaj Hamoud, Y.; Shaghaleh, H.; Ullah Khan, N.; Yang, R.; Tang, B. GABA-alleviated oxidative injury induced by salinity, osmotic stress and their combination by regulating cellular and molecular signals in rice. Int. J. Mol. Sci. 2019, 20, 5709. [Google Scholar] [CrossRef]
- Abou-Aly, H.E.; Mady, M.A. Complemented effect of humic acid and biofertilizers on wheat (Triticum aestivum L.) productivity. Ann. Agric. Sci. Moshtohor 2009, 47, 1–12. [Google Scholar]
- Sheteiwy, M.S.; Dong, Q.; An, J.; Song, W.; Guan, Y.; He, F.; Huang, Y.; Hu, J. Regulation of ZnO nanoparticles-induced physiological and molecular changes by seed priming with humic acid in Oryza sativa seedlings. Plant Growth Regul. 2017, 1–15. [Google Scholar] [CrossRef]
- Moghadam, H.R.T. Humic acid as an ecological pathway to protect corn plants against oxidative stress. Biol. Forum 2013, 7, 1704–1709. [Google Scholar]
- Asli, S.; Neumann, P.M. Rhizosphere humic acid interacts with root cell walls to reduce hydraulic conductivity and plant development. Plant Soil 2010, 336, 313–322. [Google Scholar] [CrossRef]
- Amanullah, K.H.; Marwat, K.B.; Shah, P. Nitrogen levels and its time of application influence leaf area, height and biomass of maize planted at low and high density. Pak. J. Bot. 2009, 41, 761–768. [Google Scholar]
- Pikovskaya, R.I. Mobilization of phosphorus in soil in connection with vital activity of some microbial species. Mikrobiologiya 1948, 17, 362–370. [Google Scholar]
- Abd-El-Malek, Y.; Ishac, Y.Z. Evaluation of methods used in counting Azotobacter. J. Appl. Bact. 1968, 31, 267–275. [Google Scholar] [CrossRef]
- Ahmad, F.; Ahmad, I.; Khan, M.S. Indole acetic acid production by the indigenous isolates of Azotobacter and fluorescent Pseudomonas in the presence and absence of tryptophan. Turk. J. Bio. 2005, 29, 29–34. [Google Scholar]
- Phillips, J.M.; Hayman, D.S. Improved procedures for clearing roots and staining parasitic and vesicular arbuscular mycorrhizal fungi for rapid assessment of infection. Trans. Brit. Mycol. Soc. 1970, 55, 158–161. [Google Scholar] [CrossRef]
- Trouvelot, A.; Kough, J.L.; Gianinazzi-Pearson, V. Mesure du Taux de Mycorhization VA d’un Système Radiculaire Recherche de Methods D’estimation Ayant une Signification Fonctionnelle. In Physiological and Genetical Aspects of Mycorrhizae; Gianinazzi-Pearson, V., Gianinazzi, S., Eds.; INRA Publications: Paris, France, 1986; pp. 217–221. [Google Scholar]
- Setiawati, T.; Mutmainnah, L. Solubilization of potassium containing mineral by microorganisms from sugar cane rhizosphere. Agric. Sci. Procedia 2016, 9, 108–117. [Google Scholar]
- Zhang, X.; Li, F.; Liu, T.; Xu, C.; Duan, D.; Peng, C.; Zhu, S.; Shi, J. The variations in the soil enzyme activity, protein expression, microbial biomass, and community structure of soil contaminated by heavy metals. ISRN Soil Sci. 2013, 2013, 803150. [Google Scholar] [CrossRef]
- Zhu, L.; Cao, D.; Hu, Q.; Guan, Y.; Hu, W.; Nawaz, A.; Hu, J. Physiological changes and sHSPs genes relative transcription in relation to the acquisition of seed germination during maturation of hybrid rice seed. J. Sci. Food Agric. 2015, 96, 1764–1771. [Google Scholar] [CrossRef] [PubMed]
- Bradford, N.M. Rapid and sensitive method for quantitation of microgram quantities of protein utilizing principle of protein-dye binding. Anal. Biochem. 1976, 72, 248–254. [Google Scholar] [CrossRef]
- Ahmed, I.M.; Cao, F.; Han, Y.; Nadira, U.A.; Zhang, G.; Wu, F. Differential changes in grain ultrastructure, amylase, protein and amino acid profiles between Tibetan wild and cultivated barleys under drought and salinity alone and combined stress. Food Chem. 2013, 141, 2743–2750. [Google Scholar] [CrossRef] [PubMed]
- Dubois, M.; Gilles, K.A.; Hamilton, J.K.; Rebers, P.A.; Smith, F. Colorimetric method for determination of sugar and related substance. Anal. Chem. 1956, 3, 350–356. [Google Scholar] [CrossRef]
- McGill, W.B.; Figueiredo, C.T. Total nitrogen. In Soil Sampling and Methods of Analysis; Carter, M.R., Ed.; Lewis Publishers: Boca Raton, FL, USA, 1993; pp. 201–211. [Google Scholar]
- Jackson, M.L. Soil Chemical Analysis; Prentice Hall, Inc.: WoodCliff, NY, USA, 1962. [Google Scholar]
- Ashraf, M.Y.; Khan, A.H.; Azmi, A.R. Cell membrane stability and its relation with some physiological process in wheat. Acta Agronomica Hungarica 1992, 41, 182–191. [Google Scholar]
- Chapman, D.H.; Parker, E.R. Determination of NPK Methods of Analysis for Soil, Plant and Waters; Pub. Div. Agri. Univ. of California: Berkeley, CA, USA, 1961; pp. 150–179. [Google Scholar]
- Li, H.S. Principle and Technology of Plant Physiological and Biochemical Experiments; Higher Education Press: Beijing, China, 2000; pp. 169–172. [Google Scholar]
- Alori, E.T.; Glick, B.R.; Babalola, O.O. Microbial phosphorus solubilization and its potential for use in sustainable agriculture. Front. Microbiol. 2017, 8, 971. [Google Scholar] [CrossRef]
- Hauka, F.I.A.; Afify Aida, H.; El-Sawah, A.M. Efficiency Evaluation of some Rhizobacteria isolated from Egyptian Soils, In vitro as Biofertilizers. J. Agric. Chem. Biotechn. Mansoura Univ. 2017, 8, 231–235. [Google Scholar] [CrossRef]
- Walpola, C.B.; Arunakumara, K.; Yoon, M.H. Isolation and characterization of phosphate solubilizing bacteria Klebsiella oxytoca with enhanced tolerant to environmental stress. Afr. J. Microbiol. Res. 2014, 8, 2970–2978. [Google Scholar]
- Hemalatha, N.; Raja, N.; Jayachitra, A.; Rajalakshmi, A.; Valarmathi, N. Isolation and characterization of phosphate solubilizing bacteria and analyzing their effect on Capsicum annum L. Inter. J. Biol. Pharm. Res. 2013, 4, 159–167. [Google Scholar]
- Abdel-fattah, G.M.; Asrar, A.A.; Al-amri, S.M.; Abdel-salam, E.M. Influence of arbuscular mycorrhiza and phosphorus fertilization on the gas exchange, growth and phosphatase activity of soybean (Glycine max L.) plants. Photosynthetica 2014, 52, 581–588. [Google Scholar] [CrossRef]
- El-Sawah, A.M.; Hauka, F.I.A.; Afify Aida, H. Dual inoculation with Azotobacter chroococcum MF135558 and Klebsiella oxytoca MF135559 enhance the growth and yield of wheat plant and reduce N-fertilizers usage. J. Food Dairy Sci. 2018, 10, 67–76. [Google Scholar]
- Afify, A.H.; Hauka, F.I.A.; El-Sawah, A.M. Plant Growth-Promoting Rhizobacteria enhance Onion (Allium cepa L.) productivity and minimize requisite chemical fertilization. Env. Biodiv. Soil Secur. 2018, 2, 119–129. [Google Scholar] [CrossRef]
- Jha, C.K.; Saraf, M. Evaluation of multispecies plant-growth promoting consortia for the growth promotion of Jatropha curcas L. J. Plant Growth Regul. 2012, 31, 588–598. [Google Scholar] [CrossRef]
- Russo, R.O.; Berlyn, G.P. The use of organic bio-stimulants to help low input sustainable agriculture. J. Sustain. Agric. 1990, 1, 19–42. [Google Scholar] [CrossRef]
- Pukalchik, M.; Kydralieva, K.; Yakimenko, O.; Fedoseeva, E.; Terekhova, V. Outlining the Potential Role of Humic Products in Modifying Biological Properties of the Soil—A Review. Front. Environ. Sci. 2019, 7, 80. [Google Scholar] [CrossRef]
- Du, Z.J.; Chen, X.M.; Qi, X.B.; Li, Z.Y.; Nan, J.K.; Deng, J.Q. The effects of biochar and hoggery biogas slurry on fluvo-aquic soil physical and hydraulic properties: A field study of four consecutive wheat-maize rotations. J. Soils Sediments 2016, 16, 2050–2058. [Google Scholar] [CrossRef]
- Maqshoof, A.; Zahir, A.Z.; Jamil, M.; Latif, F.N.M.; Akhtar, M.F. Integrated use of plant growth promoting rhizobacteria, biogas slurry and chemical nitrogen for sustainable production of maize under salt-affected conditions. Pak. J. Bot. 2014, 46, 375–382. [Google Scholar]
- Lu, J.; Jiang, L.N.; Chen, D.J.; Toyota, K.; Strong, P.J.; Wang, H.L.; Hirasawa, T. Decontamination of anaerobically digested slurry in a paddy field ecosystem in Jiaxing region of China. Agric. Ecosyst. Environ. 2012, 146, 13–22. [Google Scholar] [CrossRef]
- Rana, A.; Joshi, M.; Prasanna, R.; Shivay, Y.S.; Nain, L. Biofortification of wheat through inoculation of plant growth promoting rhizobacteria and cyanobacteria. Eur. J. Soil Biol. 2012, 50, 118–126. [Google Scholar] [CrossRef]
- Rosas, S.B.; Avanzin, G.; Carlier, E.; Pasluosta, C.; Pastor, N.; Rovera, M. Root colonization and growth promotion of wheat and maize by Pseudomonas aurantiaca SR1. Soil Biol. Biochem. 2009, 41, 1802–1806. [Google Scholar] [CrossRef]
- Hungria, M.; Campo, R.J.; Souza, E.M.; Pedrosa, F.O. Inoculation with selected strains of Azospirillum brasilense and A. lipoferum improves yields of maize and wheat in Brazil. Plant Soil 2010, 331, 413–425. [Google Scholar] [CrossRef]
- Orhan, E.; Esitken, A.; Ercisli, S.; Turan, M.; Fikrettin, S. Effects of plant growth promoting rhizobacteria (PGPR) on yield, growth and nutrient contents in organically growing raspberry. Sci. Hort. 2006, 111, 38–43. [Google Scholar] [CrossRef]
- Çakmakçi, R.; Dönmez, F.; Aydin, A.; Sahin, F. Growth promotion of plants by plant growth promoting rhizobacteria under greenhouse and two different field soil conditions. Soil Biol. Biochem. 2006, 38, 1482–1487. [Google Scholar] [CrossRef]
- Silva, S.F.; Olivares, F.L.; Canellas, L.P. The biostimulant manufactured using diazotrophic endophytic bacteria and humates is effective to increase sugarcane yield. Chem. Biol. Technol. Agric. 2017, 4, 24. [Google Scholar] [CrossRef]
- Shahid, M.; Hameed, S.; Imran, A.; Ali, S.; Elsas, J.D. Root colonization and growth promotion of sunflower (Helianthus annuus L.) by phosphate solubilizing Enterobacter sp. Fs-11. World J. Microbiol. Biotechnol. 2012, 28, 2749–2758. [Google Scholar] [CrossRef] [PubMed]
- Canellas, L.P.; Balmori, D.M.; Médici, L.O.; Aguiar, N.O.; Campostrini, E.; Rosa, R.C.C.; Façanha, A.R.; Olivares, F.L. A combination of humic substances and Herbaspirillum seropedicae inoculation enhances the growth of maize (Zea mays L.). Plant Soil 2013, 366, 119–132. [Google Scholar] [CrossRef]
- Thonar, C.; Lekfeldt, J.D.S.; Cozzolino, V.; Kundel, D.; Kulhánek, M.; Mosimann, C.; Neumann, G.; Piccolo, A.; Symanczik, S.; Walder, F. Potential of three microbial bio-effectors to promote maize growth and nutrient acquisition from alternative phosphorous fertilizers in contrasting soils. Chem. Biol. Technol. Agric. 2017, 4, 7. [Google Scholar] [CrossRef]
- Turkmen, O.; Demir, S.; Sensoy, S.; Dursun, A. Effect of arbuscular mycorrhizal fungus and humic acid on the seedling development and nutrient content of pepper growth under saline conditions. J. Biol. Sci. 2005, 5, 568–574. [Google Scholar]
- Tang, Y.; Wen, G.; Li, P.; Dai, C.; Han, J. Effects of Biogas Slurry Application on Crop Production and Soil Properties in a Rice–Wheat Rotation on Coastal Reclaimed Farmland. Water Air Soil Pollut. 2019, 230, 51. [Google Scholar] [CrossRef]
- Cakmakci, R.; Erat, M.; Erdogan, U.; Donmez, M.F. The influence of plant growth-promoting rhizobacteria on growth and enzyme activities in wheat and spinach plants. J. Plant Nut. Soil Sci. 2007, 170, 288–295. [Google Scholar] [CrossRef]
- Canellas, L.P.; Junior, L.R.L.T.; Dobbss, L.B.; Silva, C.A.; Medici, L.O.; Zandonadi, D.B.; Facanha, A.R. Humic acids crossinteractions with root and organic acids. Ann. Appl. Biol. 2008, 153, 157–166. [Google Scholar] [CrossRef]
- Aguirre, E.; Lemenager, D.; Bacaicoa, E.; Fuentes, M.; Baigorri, R.; Angel, Z.; Jose, G.M. The root application of a purified leonardite humic acid modifies the transcriptional regulation of the main physiological root responses to Fe deficiency in Fe-sufficient cucumber plants. Plant Physiol. Biochem. 2009, 47, 215–223. [Google Scholar] [CrossRef] [PubMed]
- Habashy, N.R.; Abou El-Khair Amal, W.; Zaki, R.N. Effect of organic and biofertilizers on phosphorus and some micronutrients availability in a calcareous soil. Res. J. Agric. Biol. Sci. 2008, 4, 454–552. [Google Scholar]
- Zhang, G.Y.; Zhang, L.P.; Wei, M.F.; Liu, Z.; Fan, Q.L.; Shen, Q.R.; Xu, G.H. Effect of arbuscular mycorrhizal fungi, organic fertilizer and soil sterilization on maize growth. Acta Ecol. Sinica 2011, 31, 192–196. [Google Scholar] [CrossRef]
- Wang, M.Y.; Liu, S.T.; Liu, R.J. P-tolerance of arbuscular mycorrhizal fungi in soil under long-term fertilization. Acta Pedol. Sin. 2006, 143, 1056–1059. [Google Scholar]
- Lioussanne, L.; Perreault, F.; Jolicoeur, M.; St-Arnaud, M. The bacterial community of tomato rhizosphere is modified by inoculation with arbuscular mycorrhizal fungi but unaffected by soil enrichment with mycorrhizal root exudates or inoculation with Phytophthora nicotianae. Soil Biol. Biochem. 2010, 42, 473–483. [Google Scholar] [CrossRef]
- Wang, Y.; Shi, J.; Wang, H.; Lin, Q.; Chen, X.; Chen, Y. The influence of soil heavy metals pollution on soil microbial biomass, enzyme activity, and community composition near a copper smelter. Ecotoxicol. Environ. Safe. 2007, 67, 75–81. [Google Scholar] [CrossRef]
- Zheng, X.; Fan, J.; He, Y.; Cui, J.; Xu, L.; Zhu, Z.; Zhou, J. Effect of total nitrogen ratio of biogas slurry/chemical fertilizer on microflora and enzyme activities of soil. Trans. Chin. Soc. Agric. Eng. 2015, 31, 142–150. [Google Scholar]
- Abubaker, J.; Risberg, K.; Pell, M. Biogas residues as fertilizers—Effects on wheat growth and soil microbial activities. Appl. Energy 2012, 99, 126–134. [Google Scholar] [CrossRef]
- Akhtar, M.F.; Jamil, M.; Maqshoof, A.; Abbasi, G.H. Evaluation of biofertilizer in combination with organic amendments and rock phosphate. Soil Environ. 2017, 36, 59–69. [Google Scholar]
- Hauka, F.I.A.; Bayoumy, Samia, M.M.; Afify, Aida, H.; Ashour, Eman, H.; El-Awady, M.A. Effect of using compost, mineral nitrogen and biofertilizer on microbial population in the rhizosphere of wheat plants cultivated in sandy soil. J. Agric. Chem. Biotechn. Mansoura Univ. 2010, 6, 307–314. [Google Scholar]


© 2020 by the authors. Licensee MDPI, Basel, Switzerland. This article is an open access article distributed under the terms and conditions of the Creative Commons Attribution (CC BY) license (http://creativecommons.org/licenses/by/4.0/).