Abstract
Relationships between tourism development, quality of life and sustainable performance are very important topics and benchmarks in long-term policies and strategies at global, regional and local levels. Starting from the concerns expressed by researchers and international organizations, as well as the characteristics of the European region, our research aims to identify these relationships in the context of increasing pressure from stakeholders on the adoption of decisive measures in order to limit the negative effects manifested globally in the context of climate change. Using cluster analysis, we managed to identify relevant groups of countries, based on the selected variables. The results of the study highlight the existence of a positive relationship between the development of tourism and the increase of the quality of life, as between the level of sustainable performance and tourism intensity, opening the possibility of future research on the causal relationships between the selected variables and the promotion of coherent public policies that support the sustainable development.
1. Introduction
Tourism has always been and will remain a way of progress for all countries of the world, being an important driver of the use of natural and anthropic resources, of cultural resources, traditions and local customs, connecting people from all over the planet, bringing real profits for the host communities, and directly contributing to GDP growth and employment. Tourism is not only a stimulating factor for local and regional economies, but also a catalyst for all areas of activity with which tourism companies come into direct and indirect contact. The economic, social and environmental performance of tourism companies are both a consequence and a stimulating factor for the entire local, regional and global economy [1,2,3].
On the other hand, it is also known that tourism can be a trigger factor of environmental crises, where we identify the phenomenon of overcrowding or tourist pressure, as well as the phenomenon of artificial inflation by raising prices at the level of tourist destinations and, hence, all the negative effects on local communities, including aspects of their quality of life [4,5].
According to the latest data provided by the UN World Tourism Organization (UNWTO), in 2018, international tourist arrivals exceeded 1.4 billion, while total export earnings from international tourism reached USD 1.7 trillion (about 2% of global GDP). From the perspective of the existing tourist destinations on a global level, Europe continues to be a magnet for travel of any kind and, here, we take into account cultural, coastal, skiing, spa tourism and, last but not least, business tourism. Europe, as a tourist region, continues to hold global supremacy in terms of revenue and number of travelers (welcoming half of the world’s international tourist arrivals) but also important positions from the point of view of economically developed countries, quality of life and, not least, from the point of view of achieving sustainable development goals [6].
In response to the multiple challenges of the economic, political, social and environmental environment, a new paradigm of development has been launched, this being closely linked to the concept of sustainable development or the “Common future” as identified in the United Nations Report. Thus, the Committee on Environment and Development, also known as Brundtland Report (1987), supports the idea that sustainable development is, in fact, “development that meets the needs of the present, without compromising the ability of future generations to meet their own needs” [7,8].
Subsequently, concepts such as “responsible tourism”, “ethical tourism” and “green tourism” were promoted and supported. Regardless of the context or variants of definition and identification, we are currently talking about a common language of sustainability in general and tourism in particular, inscribed and promoted globally in the “Global Code of Ethics for Tourism”. This is currently an important reference element for the development of responsible tourism in relation to cultural, social and environmental resources [9,10].
It is also important to mention, since the beginning, that tourism directly influences three of the global objectives, respectively: SDG 8 “Promote sustained, inclusive and sustainable economic growth, full and productive employment and decent work for all”; SDG 12 “Ensure sustainable consumption and production patterns”; SDG 14 “Conserve and sustainably use the oceans, seas and marine resources for sustainable development” [3,11,12,13].
Relationships between tourism development, quality of life and sustainable performance are very important topics and benchmarks in long-term policies and strategies at global, regional and local level, with more and more researchers becoming concerned about this topic. Whether or not it is sustainable at present is a universally valid decision for all countries of the world; moreover, where we are witnessing a marked development of the economy, the situation is much different. In other words, the level of economic development at the level of each country directly influences the quality of life, but also the implementation and development of sustainable activities [14,15,16].
As a response to all these challenges and changes, especially those related to environmental threats, we are currently witnessing an increase in consumer awareness. All these have generated, in the last period of time, new lifestyles, more ethical and resource efficient, but also in terms of decisions regarding future generations and quality of life.
If a few years ago the importance of tourism was limited mainly to economic aspects, aiming to maximize profit and increase employment especially at the level of local communities, at present, things are completely different and the analyses are carried out following a much wider range of points of view.
Thus, from the purely economic role of tourism, we are witnessing today the complex implications of tourism, especially at the social, cultural, environmental, but also quality of life level; tourism being a stimulating factor for the sustainable use of local tourism resources, in most cases, reinvigorating traditions, preserving the environment and consequently increasing the quality of life and changing the lifestyle of the locals.
On the other hand, more tourists represent an increase in tourism pressure at the level of very attractive destinations (cultural cities, or coastal areas during the summer), an aspect that most often generates for the local communities a series of shortcomings, from overcrowding to pollution, from the increasing of prices on the local market to the degradation of the environment, aspects that lead, in time, to the degradation of the quality of life for the residents.
Europe has always been divided, both in terms of economic potential, economic and social performance, quality of life, as well as in terms of tourist resources and attractiveness on the international tourism market. Thus, we can identify at least three distinct groups. A first group brings together the economically developed countries, respectively the countries of the north and west of Europe, whose national economy is not based primarily on tourism and its related activities. A second group is made up of southern European countries with a Mediterranean coastline that play a major role in the economy and the European tourism industry, countries with significant tourist attractiveness and attracting about 1/3 of the European tourist circulation in the summer season. The third group of countries includes those from central and eastern Europe, countries with an emerging economy coming from the former communist bloc, being relatively new to the international tourism market, but with high rates for economic growth and tourism activity.
However, this segmentation into three macro-regions at the level of the European continent cannot provide a universal answer that characterizes the relationships between tourism development, quality of life and sustainable performance. From the analysis of research published so far, a clear conclusion cannot be distinguished, given that results are sometimes contradictory. Some papers present results that support the positive influence of tourism on improving the quality of life and sustainable performance [17,18,19,20], other authors identify the development of tourism as a factor with negative effects on the overall index of quality of life and the growth of sustainable performance [21,22,23,24], while a third group of studies shows mixed results [25,26,27].
Is tourism a progress factor, is tourism a catalyst for achieving sustainable development goals, is tourism a factor in improving the quality of life? These were the starting points of our research and this is because the problems related to the sustainable development of the economy, the society, the welfare of the society in terms of quality of life are the subject of all present and long-term strategies.
Starting from the concerns expressed by researchers and international organizations, as well as the characteristics of the European region, our research aims to identify at EU level what relationships exist between the level of tourism development, quality of life and sustainable performance, in the context in which the achievement of the Sustainable Development Goals set out in the 2030 Agenda for sustainable development are declared priorities at European and global levels.
In fact, as UNWTO mentioned in a recent document [28], the long-term sustainability of the travel and tourism industry faces important challenges in terms of making the growth model compatible with the quality of life of local communities, especially in cities or mature destinations. Additionally, it is suggested that a paradigm shift is starting, by renouncing the use of models focused on economic growth at any price and focusing on the quality of this growth and its compatibility with the quality of life of residents.
The results of this research will bring a better understanding of the links between tourism development, quality of life and sustainable performance, contributing to the community’s efforts to identify the best solutions and models of sustainable development.
This paper is divided into five sections, stating with introduction, followed by literature review. Section 3 includes information on the variables and the model used in data analysis. Further, in Section 4 the main results of the research are presented and discussed, and Section 5 unveils the main conclusion of the research.
2. Literature Review
From the point of view of the characteristics of the tourism and travel industry, it is well known that Europe is one of the most competitive tourist regions in the world, including 6 of the 10 best performing countries in the world in 2019, respectively: Spain, France, Germany, UK, Italy and Switzerland. Europe also has rich and numerous cultural and natural resources, especially in Southern and Western Europe, having one of the best developed tourism-specific infrastructures (with the highest density of hotels in the world), an advanced infrastructure for business tourism but also high-performance air, road and rail infrastructure, recording the largest export of tourism, attracting half of the international tourist arrivals and over 40% of the international receipts [29].
Additionally, the influence of tourism on the environment has led to the publication of a series of researches conducted in different parts of the world. Scholars from major destinations worldwide have made due efforts to address issues emerging in their respective continents, and the findings from these studies have generated both theoretical and practical contributions, tourism being considered as an integrative reflection of economic, societal, and cultural phenomena, which indicate that sustainable tourism research should be comprehensive and multi-dimensional [30].
From a tourism perspective, the Global Development Agenda promotes the sustainability of its domain and its importance especially since the 2002 World Summit on Sustainable Development (Rio+10) and the UN Conference on Sustainable Development (Rio+20) in 2012. On the one hand, the World Tourism Organization defines the sustainability of tourism as “tourism which takes full account of its economic, social future and environmental impact, addressing the needs of visitors, industry, the environment and the host communities“ [31]. In the same vein, the 2030 Global Agenda for Sustainable Development launched a real challenge in 2017, namely the International Year for Sustainable Tourism (IY2017) which, as the UN General Assembly said, highlighted the importance of tourism as a trigger for changes in policies, the actions and business practices of the behavior of all the factors directly and indirectly involved in creating a sustainable tourist [32].
Although the globalization of tourism is evident with all that it represents from an economic, social and political point of view, tourism is predominantly a regional, national and local activity. We support this feature by the fact that, although countries are stimulated to focus on international tourism through the income obtained through exports, domestic tourism has been and continues to be the main segment, accounting for 73% of total global tourism expenses [33,34].
From the perspective of the major contribution of tourism to economic, social and environmental progress, its importance and dynamics are obvious, tourism being one of the largest economic sectors in the world, owning 1 of 10 jobs (319 million) worldwide and generating 10.4% ($8.8 trillion) of world GDP. Equally important is the fact that the tourism and travel industry registered a growth of 3.9% in 2018, compared to the global economy (3.2%), and 1 of 5 new jobs were created by industry for the past five years [35].
A number of published studies claim that the development of tourism presents a number of advantages, especially in relation to the economic development of the states, as well as the increase of the quality of life. In a published study, Selimi et al. calculate the impact of tourism on economic growth in Western Balkan countries as being positive, respectively, for every 1% increase of tourist arrivals, the output will increase approximately by 0.08% [17].
In another macro-level research, Tang and Tan analyzed whether the tourism-led growth hypothesis is globally valid by accounting for countries’ income levels and their institutional qualities, against a panel dataset of 167 countries. The results showed that the effect of tourism on economic growth is positive, but it is also contingent on income levels and institutional qualities of the host tourism countries [20].
Therefore, we emphasize that global tourism is, in fact, a consequence of local, national and regional actions, being an important tool for all governments to eliminate poverty and increase employment and economic growth. On the other hand, the development of local tourism is also a starting point but also a consequence of investments in the general and specific infrastructure of tourism, as well as investments in reducing the pressure on the natural environment, in the facilities to reduce the overcrowding in the tourist destinations, or in the facilities and actions that reduce the negative impact of seasonality [36,37].
From the point of view of capital investments in tourism, we mention the World Travel and Tourism Council (WTTC) Global Summit in Madrid, April 2015, in which we analyzed the current and future investments in tourism for the Europe region. Thus, the main correlations between the economic competitiveness of the countries and the investments in tourism were highlighted. It is also important to note that the report highlights the fact that, despite 2.1 trillion euros in tourism investment and travel in Europe over the next decade (5% of total investments), many countries may not meet forecasts from the perspective of GDP and jobs for tourism and travel. The forecast is sustained in terms of global competitiveness, through the dynamics of investments in reduced infrastructure in relation to the demand for tourism and travel [38,39,40].
Additionally, an important and intensely debated aspect in the scientific community is that regarding the tourism pressure. In 2018, more than 1.4 billion tourists were registered, of which 45% traveled to visit cities, the first 300 cities in size receiving more than 500 million visitors [40]. Tourism is creating pressures on the environment, while tourist travels, whether air or road transport, contributes to greenhouse gas emissions and degrades air quality. In areas where tourism is a dominant activity, the environment is also subject to strong pressures. The development of tourist accommodation causes soil degradation resulting from increased urbanization and leads to an increase in the pressures on natural resources [41,42].
In a pioneering research, Gössling [21] analyzes five major aspects of the leisure-related alteration of the environment, reaching the conclusion that environmental consequences of travel are substantial, particularly if looked at from a per capita perspective, and the population from developing countries may suffer most from these negative consequences. In a similar research, Gössling and Peeters [43] offer a fresh perspective on tourism’s total global resource use, demonstrating that over the next four decades, overall resource consumption may grow by between 92% (water) and 189% (land use), which requires urgent implementation of more sustainable forms of tourism.
In the same note, Kožić [24] refers to another negative effect of tourism development, respectively on human capital. In his research based on two groups of Croatian towns and municipalities, he showed that the development of tourism leads to the deterioration of human capital.
On the other hand, the tourism pressure has different manifestation modes, but the problems are similar, respectively those related to the residents and the way the quality of life is affected, different levels of the quality of the tourist experience, and the overloaded infrastructure, but also negative effects on nature, culture and local traditions. Regardless of the magnitude or the presence of all these negative effects, the direct responsibility belongs to the local authorities, which must choose the best solutions. Currently, tourism pressure is more than a sensitive issue, sometimes difficult to estimate and forecast. Basically, the only real diagnosis is the one based on the specific indicators, respectively: tourist arrivals, number of residents, seasonality and pollution [38,44,45,46].
The most relevant and impactful issues currently identified are defined through the long-term strategic objectives. Furthermore, we identified the concept of basic “critical problems” of climate change, the degradation of the destination and the disturbance of life in nature, elements that define the future actions. WTTC proposes a list of key challenges and critical sustainability issues that affect the future growth of tourism and travel. There are, thus, identified 43 problems on 8 different topics: • Maintaining sustainable destinations in a changing world • Travel, tourism, and environmental impacts • Travel, tourism, and health • Travel, tourism, and human rights • Travel, tourism, and security in a changing world • Responsible business practices and leadership • Shifting innovation drivers in travel and tourism [47].
Quality of life has become a topic of interest in the tourism literature over the past two decades, leading to intense debates in the social scientific literature in recent years. Many scholars have explored the contribution that tourism in general makes towards various aspects of the QoL of both hosts and guests. The vast majority of the studies show that tourists’ experiences and tourism activities tend to contribute to a positive effect in a variety of life domains such as family life, social life, leisure life, or cultural life [48,49,50,51].
Thus, we note the research of Paramati and Roca [23], which highlights the effects of tourism growth on house prices in 20 OECD countries; the authors concluding that tourism directly influences the price of houses, thus altering the quality of life of the residents.
Additionally, there is another category of studies on the relations between tourism and the quality of life, demonstrating the existence of inconclusive results, obtaining contradictory conclusions, or different, from case to case. Conducting two parallel surveys in two different countries (Spain and Italy), Meleddu et al. showed that the relationship between the presence of tourists and quality of life of residents’ perceptions are different, respectively in Spanish locations, the residents have shown signs of distress, while in the Italian destinations the opposite occurs, generating, thus, different attitudes of residents towards tourists [52].
We should also mention the point of view taken by several authors according to which, including the perceptions of the residents of the tourist destinations regarding the local economic, social, environmental and quality of life effects, they are different, depending on the stages of tourism development, but according to the life cycle in which the tourist destinations are located [53,54].
In terms of the connection between quality of life and sustainable performance, there is a limited number of researches that address this topic. One of the relevant conclusions drawn from this research is that sustainability should be based on social cohesion, because of the difficulty in integrating the numerous needs of citizens and requirements of different cultures, allowing all people throughout the world to satisfy their basic needs and enjoy a better quality of life, without compromising the quality of life of future generations [55].
Moreover, we cannot overlook a series of researches carried out in relation to the relationships between tourism development, quality of life and sustainable performance, which have reached mixed conclusions, without being able to argue decisively towards the positive or negative side of the observed effects.
Thus, Ren et al. [26] conducted a study in 8 Mediterranean countries on the income level of a country’s tourist arrival and economic and environmental effects, and the results showed the existence of positive and negative impacts on economic growth and emissions. Or, we can mention the research conducted by De Vita and Kyaw [56] which analyzed the impact of the level of economic development on the tourism-growth relationship, based on a panel of 129 countries over 20 years. The results of the research showed that a positive effect of development of tourism is significant only for middle and high-income countries, while for low levels of economic development, tourism has no contribution to economic development.
With this multitude of ways, often different, we intend to address the knowledge gap existing in this complex and extremely dynamic field by conducting this research in the EU countries, to try to identify existing relationships between tourism development, quality of life and sustainable performance.
Thus, we aim, as the first objective of the present research, to identify the relevant groups of countries based on the selected variables and to analyze the evolution of the mutations that occurred during the period since the conclusion of the Paris Agreement. Even though a number of statistical data were also available for the period before 2015, we consider this year as a reference regarding the priority adoption at EU level of Sustainable Development Goals, and all the changes that will occur in the future in relation to the analyzed variables will most likely be due to the measures adopted as a result of the provisions of the 2030 Agenda for Sustainable Development.
A second objective of our research is to identify the level of performance in terms of tourism development, quality of life and sustainable development, in order to establish a foundation for relevant stakeholders, especially researchers and policy-makers, to make possible the transfer of good practices from countries that record high performance to countries that could improve their current levels of development.
3. Research Methodology
In order to be able to evaluate the existing relationships between development of tourism development on the evolution of the quality of life in the European Union countries, we set out to analyze the evolution of the mutations that have occurred in the structure of the analyzed variables, between the year of the conclusion of the Paris Agreement and the year 2018, the last year for which complete statistical data have been reported. We also sought to look at how EU member countries can be grouped by similar characteristics, using cluster analysis, to identify the characteristic features of development, but also potential examples of good practice.
Thus, in our research we used the official data provided by the European Commission, through Eurostat [57], the information made available by the World Travel and Tourism Council [58], as well as the data extracted from the collaborative online database Numbeo [59] and SDG Index and Dashboard Reports [60,61].
From the preliminary analysis of the data collected for all the 28 EU member countries, it was found that there were incomplete data for Malta and Luxembourg, which for this reason were not included in the final analysis.
According to the European methodology used for tourism statistics [62] and based on the data provided by Eurostat, the tourism intensity indicator (TIntens) was calculated for each analyzed country, using the formula:
using the reports published by the World Travel and Tourism Council, the relevant data regarding Direct contribution of travel and tourism to GDP (TDGDP), Direct contribution of travel and tourism to employment (TEMP), Government individual expenditures (GovEx) and Capital investment spending (CapInv).
According to the methodology used by WTTC [63], Direct contribution of travel and tourism to GDP defines the GDP that is generated by industries directly connected with tourists, including hotels, restaurants, travel agencies, airlines and other transport services, as well as the leisure industry. The value of the indicator is equal to the total travel and tourism spending within, except the purchases made by those industries, including imports, being consistent to the total GDP calculated in Table 6 of the TSA: RMF 2008. Direct contribution of travel and tourism to employment was estimated in a similar manner as the previous indicator (direct contribution to GDP), based on the added value of travel and tourism industry. Government individual expenditures are the spendings made by the government for services related to the tourist activity, such as cultural services (e.g., museums) or leisure services (e.g., national parks). Capital investment spending includes the expenses incurred by all industries directly involved in travel and tourism, the data being consistent with the total gross formation of the fixed tourist capital from Table 8 of the TSA: RMF 2008.
Quality of life is a broad concept that encompasses a number of different factors (both objective and subjective). In the present research, the main difficulty in quantifying the quality of life is to obtain an index, a single value describing the level recorded for a particular country, region or city, in order not to excessively complicate the analysis by considering a high number of variables (we can mention here the Eurostat framework based on 8+1 dimensions).
For each country included in the analysis, the Quality of Life Index was obtained from the collaborative online database Numbeo. The index is calculated as an estimate of overall quality of life by using an empirical formula that takes into account purchasing power index, pollution index, house price to income ratio, cost of living index, safety index, health care index, traffic commute time index and climate index [64].
Finally, the Bertelsmann Stiftung and the Sustainable Development Solutions Network (SDSN) methodology was used to quantify the level of performance achieved by the countries analyzed in relation to the implementation of sustainable development standards (SDG_Perf). Thus, for the SDG Index calculation, a mix of official data sources and non-official data sources are used. Official data corresponds to data usually reported by national governments to international organizations, and non-official data are typically collected by non-governmental actors (research institutions, universities, NGOs, private sector) using different techniques (estimates, satellite imagery, expert surveys, others) [65].
It is important to emphasize that by using the proposed method, by comparing in time the individual and group results, we obtain the advantage of visualizing at the level of each country which analyzed the individual changes of the values of the variables, simultaneously with the highlighting of the structural changes that have occurred in relation to the membership of the different clusters, which leads to the highlighting of the performing and less performing countries, simultaneously with the identification of the variables that led to these conclusions.
The description of the selected variables for the proposed analysis is presented in Table 1 and synthetic values for years 2015 and 2018 are shown in Table 2.

Table 1.
Selected variables for the analysis.
Table 2.
Descriptive statistics.
In order to identify and analyze the structural changes that have taken place regarding the sustainable development of tourism and the evolution of quality of life in the selected countries, hierarchical cluster analysis has been used [66,67]. The available data have been processed and analyzed using the IBM SPSS Statistics software [68].
For constructing the proximity matrix (), with 26 countries (m) and 7 variables (n), the Squared Euclidean Distance method was calculated.
To determine the distance between clusters, the Wards Method [44] was used:
Based on existing research [66,69,70], analyzing the cluster formation steps and the dendrogram, we can state that for year 2015, a significant number of three clusters can be identified. However, given the purpose of the research and without violating the recognized methodologies for selecting the optimal number of clusters, we propose to select the base five clusters, which may be more relevant for a better observation of the influences of the variables analyzed (Figure 1).
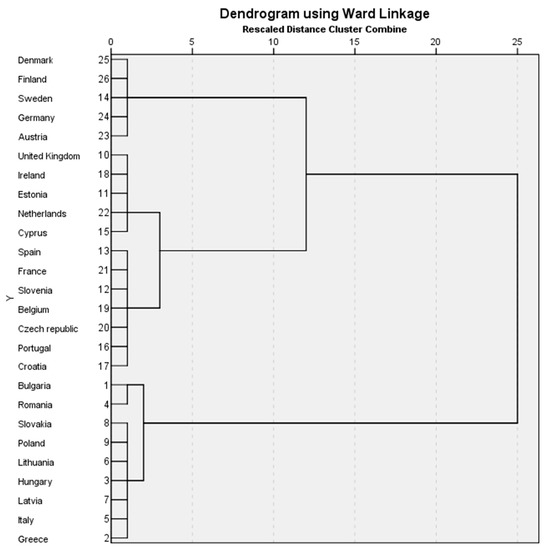
Figure 1.
Dendogram of clustering—year 2015. Source: own construction using SPSS.
Applying the same methodology for the year 2018, we can observe on the basis cluster formation steps and the dendrogram, the formation of the same number of three clusters, but with a different composition. However, by maintaining the analysis at this level, we cannot obtain sufficiently relevant results. Therefore, without violating the recognized methodologies for selecting the optimal number of clusters, we will adapt the level of analysis by increasing the number of clusters to six, as can be seen in Figure 2.
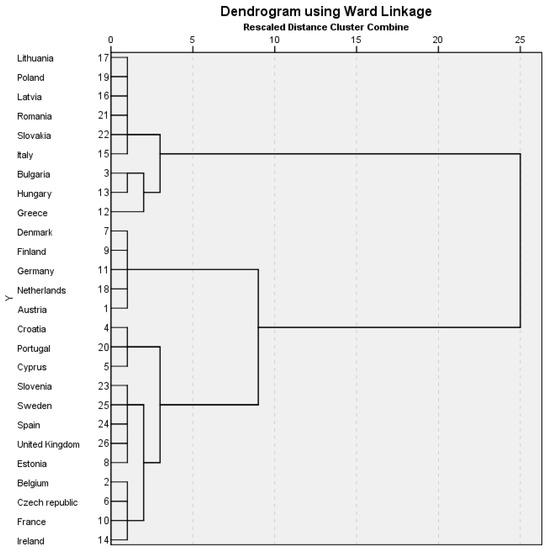
Figure 2.
Dendogram of clustering—year 2018. Source: own construction using SPSS.
To check the validity of the clusters, we decided to use the Welch Test and the Brown–Forsythe Test (Null Hypothesis H0_1: variable means do not differ significantly). The results of the tests for a significance threshold of α = 0.05 are presented in Table 3 and Table 4.
Table 3.
Robust Tests of Equality of Means—year 2015.
Table 4.
Robust Tests of Equality of Means—year 2018.
For all the selected variables, the null hypothesis is rejected, which means that we can consider their values as significant for the analysis of the formed clusters.
The scattergrams for the three main variables, Direct contribution of travel and tourism to GDP, Quality of Life Index and SDG performance, for 2015 and 2018, are shown in Figure 3:
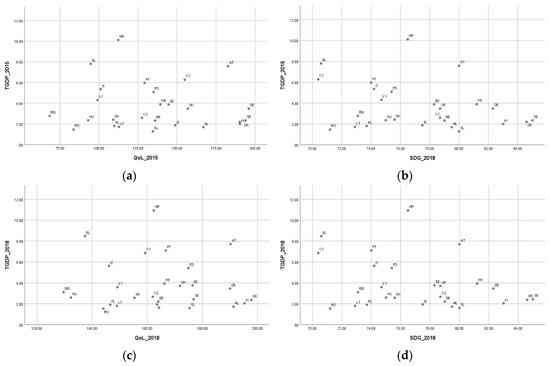
Figure 3.
Scattergrams for TDGDP, QoL and SDG performance, 2015 and 2018. Source: own construction using SPSS. (a) TDGDP-QoL 2015; (b) TDGDP-SDG Performance 2015; (c) TDGDP-QoL 2018; (d) TDGDP-SDG Performance 2018.
4. Empirical Results and Discussion
In order to evaluate the relationship between tourism development, quality of life and sustainable performance in the countries of the European Union, we analyzed the evolution of the mutations that occurred in the structure of the selected variables, between the year of the Paris Agreement (2015) and the year 2018, which is the last year for which complete statistical data are reported. We also sought to look at how EU member countries can be grouped by similar characteristics, using cluster analysis, in order to identify potential correlations between variables, highlighting high performing groups of countries that can become potential examples of good practices.
The following clusters resulted from the analysis (Table 5):
Table 5.
The components of the clusters for 2015 and 2018.
For a better observation of the evolution of the variables, we present the values recorded by the analyzed variables for the two years considered (2015 and 2018) in Table 6 and, respectively, Table 7.
Table 6.
Values of variables for analyzed clusters—year 2015.
Table 7.
Mean values of variables for analyzed clusters—year 2018.
Comparing the two analyzed periods (2015 and 2018), we can underline a first important remark of this research, related to top performers and to the countries with potentially unused development potential.
In 2015, the top performing countries could be considered Austria, Denmark, Finland, Germany and Sweden, countries which hold the highest values for the Quality of Life Index and SDG performance, but also for tourism intensity. On the other hand, the countries from the same cluster record the lowest average values for Government individual expenditures and Capital investment spending.
For the year 2018, the grouping of the above countries identified by the highest values for the Quality of Life Index, SDG performance and tourism intensity involved a small change, respectively the replacement of Sweden with the Netherlands, maintaining the same lowest average values for Government individual expenditures and Capital investment spending.
Continuing the comparative analysis of the A-2015 and A-2018 clusters, we note a positive evolution regarding the values of the variables Quality of Life Index, Government individual expenditures, and, only marginally, SDG performance, corroborated with a decrease in the values recorded by the variables Direct contribution of travel and tourism to GDP, Direct contribution of travel and tourism to employment Capital investment spending and Tourism intensity.
The highlighting of these countries from the perspective of the significant indicators for the objective of our research also support the fact that, the development of the economy, the quality of life, the significant results for achieving the SDG, are not always similar and are with important results of tourism activities/tourism development. The case of these countries (especially those from northern Europe) reconfirms that the supremacy of European tourism in terms of tourist flows, tourism exports, tourism-specific indicators, is the responsibility of the countries of southern Europe, respectively those of the coast to the Mediterranean. The massive annual flow of tourists from northern Europe to the south, on the other hand, favors the emergence of negative phenomena related to tourism intensity and even lower performance in terms of SDGs and the quality of life of residents, as we have also identified in our research for Mediterranean countries: Italy, Greece, Spain, Croatia, Portugal and France.
Regarding the countries at the opposite pole to the performing countries, the changes between the analyzed periods are more significant. Thus, if in 2015, 2 countries, Bulgaria and Romania (cluster C-2015), were significantly detached by the rest from the countries with the lowest average values in terms of Direct contribution of travel and tourism to GDP, Direct contribution of travel and tourism to employment, Quality of Life Index, Tourism intensity and SDG performance, in year 2018, cluster C-2018 is composed of 3 countries, respectively Bulgaria, Greece and Hungary. Despite the fact that the average values recorded by the selected variables have made visible progress compared to 2015, the countries in the C-2018 cluster still have the lowest average values for Quality of Life Index, Tourism intensity and SDG performance.
On the other hand, the inclusion of the countries in cluster D-2015 (Croatia, Greece, Hungary, Italy, Latvia, Lithuania, Poland and Slovakia) supports the idea of association in this group as being mainly related to the recording of the highest average value for the direct contribution of travel and tourism to GDP; these are also countries with increasing tourism but also where the indicators of quality of life and the contribution to the SDG, record relatively average values or below average values.
For the year 2018, in cluster D-2018, we identify significant changes in terms of the association of countries. Thus, Italy is, this time, with Latvia, Lithuania, Poland, Slovakia and Romania. The characteristic of this group is given by the recording of the lowest average values for the direct contribution of travel and tourism to employment and tourism intensity. Additionally, the average values recorded for the rest of the analyzed variables are relatively lower compared to the values recorded by the other clusters.
However, in order to better understand the relationships between the selected variables, we decided to deepen the analysis at the level of the clusters identified for 2015 and 2018 (Table 8, Table 9, Table 10, Table 11 and Table 12).
Table 8.
Cluster A-2015.
Table 9.
Cluster B-2015.
Table 10.
Cluster C-2015.
Table 11.
Cluster D-2015.
Table 12.
Cluster E-2015.
In the cluster A-2015 (Table 8), the following countries were grouped: Austria, Denmark, Finland, Germany and Sweden. The countries belonging to this cluster are characterized by the top five highest values for Quality of Life Index and for SDG performance, but also by the highest average tourism intensity value (with Finland having the highest value of all the 26 analyzed countries). Additionally, the countries included in this cluster are characterized by the lowest average values for Government individual expenditures and Capital investment spending, even if the individual values recorded are not at the absolute minimum level between EU countries. Even though Austria has very different variable values compared to the other countries in the cluster, it is obvious that the countries grouped in A-2015 have the highest values for Quality of Life Index and for SDG performance; this seems to be the main grouping criterion.
Seven countries were reunited in cluster B-2015 (Table 9), Belgium, Croatia, Czech Republic, France, Portugal, Slovenia and Spain respectively. All seven countries have relatively average levels for the analyzed variables, with a relatively high Quality of Life Index, which is also found in the case of SDG performance. However, we can also note the existence of quite pronounced differences between the values recorded by the countries thus grouped, as is the case of Croatia and Slovenia in terms of Direct contribution of travel and tourism to GDP and Capital investment spending, or between Belgium and Croatia in terms of Direct contribution of travel and tourism to employment.
The C-2015 cluster (Table 10) is an extremely small one, being composed of only two countries, namely Bulgaria and Romania. The defining characteristic of the two countries is the recording of the lowest average and absolute values for the Quality of Life Index, as well as the lowest average values for Direct contribution of travel and tourism to GDP, Direct contribution of travel and tourism to employment, Tourism intensity and SDG performance. On the other hand, surprisingly, the two countries thus grouped register the highest average value of Capital investment spending among the five clusters analyzed.
In Cluster D-2015 (Table 11), Greece, Hungary, Italy, Latvia, Lithuania, Poland and Slovakia are grouped together, the feature of this cluster being the recording of the highest average value for Direct contribution of travel and tourism to GDP. The rest of the selected variables record relatively average or below average values, but not extreme. However, even with regard to Direct contribution of travel and tourism to GDP, excessive polarization can be observed; Greece and Lithuania being diametrically opposed, at great distance. The same extremely high variations can also be observed in terms of Direct contribution of travel and tourism to employment and Capital investment spending (between Greece and Poland), or in terms of the level of Government individual expenditures (between Greece and Italy).
Finally, the E-2015 cluster (Table 12) brings together the rest of five countries, namely Cyprus, Estonia, Ireland, Netherlands and United Kingdom. The main feature of this cluster is the recording of the highest average values for two of the analyzed variables, namely Direct contribution of travel and tourism to employment and Government individual expenditures. As in the case of the previous clusters, in this situation, we can also meet considerable variations between the individual values recorded by the countries grouped in E-2015, such as the situation for Direct contribution of travel and tourism to employment and Government individual expenditures, with extreme differences between Cyprus and Ireland, or the differences between Cyprus and the Netherlands in terms of Capital investment spending.
Continuing the research, in order to observe the variations in the influence of sustainable development of tourism and quality of life in EU countries at the level of 2018, we again resorted to cluster analysis, obtaining a number of six relevant clusters. Additionally, for greater ease in appreciating the changes that have taken place, we have tried to maintain the consistency of the clusters formed in the two analyzed periods (Table 13, Table 14, Table 15, Table 16, Table 17 and Table 18).
Table 13.
Cluster A-2018.
Table 14.
Cluster B-2018.
Table 15.
Cluster C-2018.
Table 16.
Cluster D-2018.
Table 17.
Cluster E-2018.
Table 18.
Cluster F-2018.
In the A-2018 cluster (Table 13) were kept a number of five countries (Austria, Denmark, Finland, Germany and Netherlands), with the observation that the Netherlands took the place of Sweden, most likely due to the lower Quality of Life Index for the latter. The characteristic of this cluster is that it maintains the level of the highest average values for Quality of Life Index and for SDG performance, along with the lowest average values of Government individual expenditures and Capital investment spending. As in 2015, there are still differences between the values recorded by the countries grouped in this way, but they seem to tend to diminish.
Cluster B-2018 (Table 14) comprises four European states, namely Belgium, Czech Republic, France and Ireland. Compared to 2015, in this cluster were kept three of the countries initially included (Belgium, Czech Republic and France) to which is added Ireland, most probably due to the growth recorded for the variables Quality of Life Index and Capital investment spending. Regarding the rest of the analyzed variables, average values are recorded and distributed evenly, except for Capital investment spending where significant variations are observed between Belgium and Ireland.
The third cluster, C-2018 (Table 15), comprises three countries: Bulgaria, Greece and Hungary. The characteristic of this cluster is that the component countries register the lowest average value for two important variables, namely Quality of Life Index and SDG performance, specifying that all these three countries also record the lowest levels for Quality of Life Index of all the analyzed countries. However, another feature of this cluster is the recording of the highest average value for Government individual expenditures.
Six countries were grouped in the D-2018 cluster (Tabel 16), namely Italy, Latvia, Lithuania, Poland, Romania and Slovakia, as opposed to 2015 when eight countries were present. The characteristic of this cluster is the recording of the lowest average values for Direct contribution of travel and tourism to employment and Tourism intensity. Additionally, the average values recorded for the rest of the analyzed variables are at relatively lower values compared to the values recorded by the other clusters.
Five EU countries were grouped into the E-2018 cluster (Table 17): Estonia, Slovenia, Spain, Sweden and United Kingdom. For these countries, at the level of the analyzed variables, it is not noticed the recording of extreme minimum or maximum values, and the average values are above average. However, we can observe the existence of significant variations between the values of Government individual expenditures and Capital investment spending between Slovenia and Estonia.
The sixth cluster formed at the level of 2018 is F-2018 (Table 18), which includes Croatia, Cyprus and Portugal. Interestingly, this cluster records the highest average values for four of the seven variables analyzed, namely Direct contribution of travel and tourism to GDP, Direct contribution of travel and tourism to employment, Capital investment spending and Tourism intensity.
An interesting discussion can be started in relation to the variations registered between 2015 and 2018 by the variables analyzed at the level of each country. Thus, the most relevant changes occurring at the level of the analyzed countries are encountered in the case of the countries that migrated during the analyzed period between clusters.
For example, in the case of Romania, the main change in the analyzed variables had materialized in the increase of Quality of Life Index by more than 72% during the analyzed period (from 83.63 points to 144.05 points), but also to increase the sustainable performance by about 5.5% (from 67.51 points to 71.20 points); the rest of the variables recording insignificant variations. Due to these changes, in 2018, we find Romania as part of a different cluster, along with two of the Baltic Countries, Poland, Slovakia and Italy.
Another relevant example can be considered in Sweden, which in 2018 we no longer find in the cluster of the best performing countries at EU level, despite the increase of more than 9.6% of the Quality of Life Index during the analyzed period (from 176.81 points to 193.86 points). Most likely, the structural change occurred due to the decreases recorded in terms of tourism intensity (−27%) or sustainable performance (−0.5%). Additionally, a reduction of Direct contribution of travel and tourism to GDP (about 0.1 percentage points, respectively −3.7%), which can be associated with the negative variation of tourism intensity, can be noticed.
Another country with special characteristics regarding the evolution of the variables analyzed is Croatia. It has the highest absolute values of Direct contribution of travel and tourism to GDP in 2015 and 2018 (10.12% and 10.93% respectively) and the second highest absolute value of Direct contribution of travel and tourism to employment (22.34% and 23.26% respectively). During the analyzed period, the Quality of Life Index increased by 44.5% (from 112.34 points to 162.36 points), sustainable performance increased by 8.2% (from 70.71 points to 76.50 points), but tourism intensity decreased by about 28.4% (mainly due to the reduction in the number of tourist nights).
Such individual or group observations can be debated and analyzed for both the selected period and the future. Due to the multitude of factors that influence the variables selected for the analysis, as well as due to the multiple plans in which different influences can be manifested, it is almost impossible to determine a universally applicable model. However, when using cluster analysis combined with qualitative analysis in the countries analyzed, certain characteristics can be distinguished to be considered in order to establish appropriate policies to support the development of tourism, increase the quality of life and improve sustainable performance.
5. Conclusions
Analyzing the relationships between development of tourism, quality of life and sustainable performance in EU countries was the main aim of the present research, thus bringing to the fore the problem of the sustainability of European countries, of European tourism, with its precise targets for 2030.
Although controversial and sometimes neglected, the problems related to the sustainable balance of the tourist actions and the quality of life of the residents of the tourist destinations, the current research comes to shape the idea that there is a direct and strong connection between the two aspects, these being significant also from the perspective of the current society’s performance and its long-term viability.
This desire is also identified and supported by our research, which concretely reflects the changes in the structure of the analyzed variables, between the year of the Paris Agreement (2015) and the year 2018. On the other hand, it was interesting to be noted and highlighted the way of grouping the countries according to the performance of the economic indicators of the tourism, the quality of life, the performance of the SDG and the tourism intensity.
We mention thus, the relative sensitivity identified at the level of the European countries (especially those with emerging economies) from the point of view of the position compared to the indicators analyzed in our research, sensitivity justified especially by the fact that we speak about countries that from an economic, political and potential tourist perspective, open to tourism, historically, have different starting points. Thus, we explain the grouping in different clusters as well as the sustainable development of tourism and the quality of life of the countries of central and eastern Europe as being relatively low, by the fact that, these are mostly countries with emerging economies, countries from the former communist group, countries that after three decades have a significantly different dynamic in relation to the global economic, political, social and environmental priorities as well as different levels of development and reporting towards the sustainable development of the economy.
Regarding the first objective of this research, through our analysis, we were able to identify the countries with high performances at European level, namely Austria, Denmark, Finland and Germany, together with Netherlands. These record the highest values of the Quality of Life Index and sustainable performance, along with relatively high values of tourism intensity. At the same time, the values of Direct contribution tourism to GDP and Direct contribution tourism to employment are kept at a moderate level, while the values of Government individual expenditures and Capital investment spending are very low, being characteristic of the economically developed countries.
Additionally, following the analysis of the obtained results, it can be stated that the countries that have registered an above average value of Direct contribution tourism to GDP and Direct contribution tourism to employment, in general, have registered the most important increases of the Quality of Life Index, which highlights the existence of a positive relationship between the development of tourism and the increase of the quality of life during the analyzed period.
Another significant result obtained from this research is the highlighting of a positive relationship between the level of sustainable performance and tourism intensity, so that countries showing high sustainable performances also record above average values in terms of tourism intensity. We can see that it is more than likely that maintaining high levels of tourism intensity will lead, in time, to the further development of tourism in the countries analyzed.
At the same time, from the perspective of developing the tourism activity, these are new countries entering the international tourism market, which generates, on the one hand, a competitive advantage from the point of view of the novelty and attractiveness but also from the point of view of the general and specific tourism infrastructure, countries where investments in the field (as our research shows) are constantly increasing. Thus, we suggest that these countries should adopt models of good practices on sustainable/smart investments from countries with advanced sustainable economy, countries with the highest performance in achieving the SDGs and with the highest Quality of Life Index (see cluster A-2015 and A-2018).
As a subject of reflection, the changes registered by the European countries in relation to the sustainable development of tourism and the quality of life, we emphasize, at the end, that there is no easy or general solution that can justify the sustainability of the economy in general and of tourism in particular, and nor to what extent this, with all the direct, indirect and induced effects, generates the quality of life in a positive or negative sense. What is more and more obvious, however, is the reality of the over-demanding tourist destinations, where the presence of a large number of people brings with them the benefits of an economic nature (high incomes, high employment, high number of employees, etc.) and a number of negative effects of a purely social and environmental nature.
We also notice how the imbalances of the sustainability of the tourist activity, in relation to the quality of life, generates decisions and strategies regarding the intelligent financing of the tourist destinations, but also concrete actions that, in time, can alleviate these imbalances so that the local communities and the tourism companies “profit” in a sustainable way of the benefits of tourism.
In conclusion, it is more than imperative that every European country, especially every European tourist destination, develops, implements and monitors its own set of sustainable development solutions in relation to the quality of life of the residents, so that tourism becomes, essentially, a path to the existence of a sustainable global community.
The findings of this empirical research should also be seen in light of the potential limitations it implies, but which may open new directions for future research. A potential limitation of this study is that empirical findings are conditioned by the selected sample and the availability of information. The results of this study may be limited by the Quality of Life Index and SDG performance rating and the models used to obtain these scores. Sometimes, the information used is from sources not readily quantifiable, and each rating company has its own models, so that scores vary according to each rating company. Another potential limitation of this research may be related to the short period of time for which we sought to highlight the links between sustainable tourism development and the change in quality of life.
However, the results obtained can serve as a starting point for the development of other research to identify new ways of quantifying the relationships between tourism development and economic growth, but without negatively impacting the quality of life and without endangering the environment or the existence of future generations.
Author Contributions
Formal analysis, A.B. and E.J.; Investigation, M.E., Gheorghe Axinte and S.T.; Methodology, M.E. and D.F.; Supervision, A.B.; Validation, E.J.; Writing—original draft, A.B. and D.F.; Writing—review & editing, D.F. All authors have read and agreed to the published version of the manuscript.
Funding
This research received no external funding.
Conflicts of Interest
The authors declare no conflict of interest.
References
- Mihalic, T. Sustainable-responsible tourism discourse – Towards ‘responsustable’ tourism. J. Clean. Prod. 2016, 111, 461–470. [Google Scholar] [CrossRef]
- Sharpley, R. Tourism and Sustainable Development: Exploring the Theoretical Divide. J. Sustain. Tour. 2000, 8, 1–19. [Google Scholar] [CrossRef]
- World Tourism Organization and United Nations Development Programme. Tourism and the Sustainable Development Goals—Journey to 2030; World Tourism Organization (UNWTO): Madrid, Spain, 2017; Available online: https://www.e-unwto.org/doi/pdf/10.18111/9789284419401 (accessed on 27 December 2019).
- Dolnicar, S.; Lazarevski, K.; Yanamandram, V. Quality of life and tourism: A conceptual framework and novel segmentation base. J. Bus. Res. 2013, 66, 724–729. [Google Scholar] [CrossRef]
- Andereck, K.; Nyaupane, G.P. Exploring the Nature of Tourism and Quality of Life Perceptions among Residents. J. Travel Res. 2010, 50, 248–260. [Google Scholar] [CrossRef]
- World Tourism Organization. European Union Tourism Trends, UNWTO 2018; World Tourism Organization: Madrid, Spain, 2018; Available online: https://www.e-unwto.org/doi/book/10.18111/9789284419470 (accessed on 20 December 2019).
- WCED (World Commission on Environment and Development). Report of the World Commission on Environment and Development: Our Common Future. Available online: http://www.un-documents.net/wced-ocf.htm (accessed on 24 November 2009).
- International Trade Centre and World Tourism Organization. Tourism and Trade: A Global Agenda for Sustainable Development; ITC: Geneva, Switzerand, 2015. [Google Scholar]
- World Tourism Organization. Global Code of Ethics for Tourism 2001; World Tourism Organization: Madrid, Spain, 2001; Available online: https://webunwto.s3.eu-west-1.amazonaws.com/imported_images/37802/gcetbrochureglobalcodeen.pdf (accessed on 27 December 2019).
- Liu, Z. Sustainable Tourism Development: A Critique. J. Sustain. Tour. 2003, 11, 459–475. [Google Scholar] [CrossRef]
- Organization for Economic Co-operation and Development; World Trade Organization; World Tourism Organization. Aid for Trade and Value Chains in Tourism; OECD: Paris, France; WTO: Geneva, Switzerland; UNWTO: Madrid, Spain, 2013; Available online: https://www.oecd.org/dac/aft/AidforTrade_SectorStudy_Tourism.pdf (accessed on 7 December 2019).
- Croes, R.; Ridderstaat, J.; Rivera, M. Asymmetric Business Cycle Effects and Tourism Demand Cycles. J. Travel Res. 2017, 57, 419–436. [Google Scholar] [CrossRef]
- Firoiu, D.; Ionescu, G.H.; Băndoi, A.; Florea, N.M.; Jianu, E. Achieving Sustainable Development Goals (SDG): Implementation of the 2030 Agenda in Romania. Sustainability 2019, 11, 2156. [Google Scholar] [CrossRef]
- Goffi, G.; Cucculelli, M.; Masiero, L. Fostering tourism destination competitiveness in developing countries: The role of sustainability. J. Clean. Prod. 2019, 209, 101–115. [Google Scholar] [CrossRef]
- Yanes, A.; Zielinski, S.; Cano, M.D.; Kim, S.-I. Community-Based Tourism in Developing Countries: A Framework for Policy Evaluation. Sustainability 2019, 11, 2506. [Google Scholar] [CrossRef]
- Firoiu, D.; Ionescu, G.H.; Bădîrcea, R.; Vochița, L.; Enescu, M. Sustainable Development of Mountain Hotels through the Implementation of International Management Standards: The Romanian Case. Sustainability 2019, 11, 6487. [Google Scholar] [CrossRef]
- Selimi, N.; Sadiku, S.L.; Sadiku, M. The Impact of Tourism on Economic Growth in the Western Balkan Countries: An Empirical Analysis. Int. J. Bus. Econ. Sci. Appl. Res. 2017, 10, 19–25. [Google Scholar] [CrossRef]
- Woo, E.; Uysal, M.; Sirgy, M.J. Tourism Impact and Stakeholders’ Quality of Life. J. Hosp. Tour. Res. 2016, 42, 260–286. [Google Scholar] [CrossRef]
- Cannonier, C.; Burke, M.G. The economic growth impact of tourism in Small Island Developing States—Evidence from the Caribbean. Tour. Econ. 2018, 25, 85–108. [Google Scholar] [CrossRef]
- Tang, C.F.; Tan, E.C. Tourism-Led Growth Hypothesis: A New Global Evidence. Cornell Hosp. Q. 2017, 59, 304–311. [Google Scholar] [CrossRef]
- Gössling, S. Global environmental consequences of tourism. Glob. Environ. Chang. 2002, 12, 283–302. [Google Scholar] [CrossRef]
- Raza, S.A.; Sharif, A.; Wong, W.-K.; Karim, M.Z.A. Tourism development and environmental degradation in the United States: Evidence from wavelet-based analysis. Curr. Issues Tour. 2016, 20, 1768–1790. [Google Scholar] [CrossRef]
- Paramati, S.R.; Roca, E. Does tourism drive house prices in the OECD economies? Evidence from augmented mean group estimator. Tour. Manag. 2019, 74, 392–395. [Google Scholar] [CrossRef]
- Kožić, I. Can tourism development induce deterioration of human capital? Ann. Tour. Res. 2019, 77, 168–170. [Google Scholar] [CrossRef]
- Akadiri, S.S.; Akadiri, A.C.; Alola, U.V. Is there growth impact of tourism? Evidence from selected small island states. Curr. Issues Tour. 2017, 22, 1480–1498. [Google Scholar] [CrossRef]
- Taizeng, R.; Can, M.; Paramati, S.R.; Fang, J.; Wu, W. The Impact of Tourism Quality on Economic Development and Environment: Evidence from Mediterranean Countries. Sustainabiliy 2019, 11, 2296. [Google Scholar] [CrossRef]
- Thomas, R.; Ormerod, N. The (almost) imperceptible impact of tourism research on policy and practice. Tour. Manag. 2017, 62, 379–389. [Google Scholar] [CrossRef]
- Guerreiro, S. How Global Tourism can be More Sustainable; World Economic Forum: Colony, Switzerland, 2019; Available online: https://www.weforum.org/agenda/2019/09/global-tourism-sustainable (accessed on 27 December 2019).
- World Economic Forum. The Travel & Tourism Competitiveness Report 2019. Available online: http://reports.weforum.org/travel-and-tourism-competitiveness-report-2019 (accessed on 20 December 2019).
- Qian, J.; Shen, H.; Law, R. Research in Sustainable Tourism: A Longitudinal Study of Articles between 2008 and 2017. Sustainability 2018, 10, 590. [Google Scholar] [CrossRef]
- United Nations. Transforming our World: The 2030 Agenda for Sustainable Development; United Nations: New York, NY, USA, 2015; Available online: https://sustainabledevelopment.un.org (accessed on 15 December 2019).
- United Nations Environment Programme; World Tourism Organization. Making Tourism More Sustainable—A Guide for Policy Makers; UNWTO: Madrid, Spain, 2015; Available online: http://wedocs.unep.org/bitstream/handle/20.500.11822/8741/-Making%20Tourism%20More%20Sustainable_%20A%20Guide%20for%20Policy%20Makers-2005445.pdf?sequence=3&isAllowed=y (accessed on 15 December 2019).
- World Tourism Organization. Measuring Sustainable Tourism: A call for Action—Report of the 6th International Conference on Tourism Statistics; UNWTO: Madrid, Spain, 2017; Available online: https://www.e-unwto.org/doi/pdf/10.18111/9789284418954 (accessed on 7 December 2019).
- Li, X.; Law, R. Forecasting Tourism Demand with Decomposed Search Cycles. J. Travel Res. 2019, 59, 52–68. [Google Scholar] [CrossRef]
- World Travel & Tourism Council—Regional Data. Available online: https://www.wttc.org/ (accessed on 5 December 2019).
- Font, X.; Higham, J.; Miller, G.; Pourfakhimi, S. Research engagement, impact and sustainable tourism. J. Sustain. Tour. 2019, 27, 1–11. [Google Scholar] [CrossRef]
- Lee, T.H.; Jan, F.-H. Can community-based tourism contribute to sustainable development? Evidence from residents’ perceptions of the sustainability. Tour. Manag. 2019, 70, 368–380. [Google Scholar] [CrossRef]
- European Commission. The European Tourism Indicator System—ETIS Toolkit for Sustainable Destination Management; European Commission: Luxembourg, 2016; Available online: https://ec.europa.eu/docsroom/documents/21749/attachments/1/translations/en/renditions/native (accessed on 11 December 2019).
- World Travel & Tourism Council. European Travel and Tourism: Where are the Greatest Current and Future Investment Needs? World Travel & Tourism Council: London, UK, 2015; Available online: https://www.wttc.org/publications/other/travel-and-tourism-investment-in-europe (accessed on 11 December 2019).
- World Travel & Tourism Council. Destination 2030: Global Cities’ Readiness for Tourism Growth; World Travel & Tourism Council: London, UK, 2019; Available online: https://www.wttc.org/publications/2019/destination-2030/ (accessed on 14 December 2019).
- Gauche, M. (Ed.) Tourism Intensity at a Local Level: Environmental Pressure or Preservation Factor? The Monitoring and Statistics Directorate (SOeS): Paris, France, 2017; Available online: https://www.statistiques.developpement-durable.gouv.fr/sites/default/files/2018-10/datalab-17-la-fonction-touristique-des-territoires...mars2017-anglais.pdf (accessed on 28 December 2019).
- Cvelbar, L.K.; Dwyer, L.; Koman, M.; Mihalic, T. Drivers of Destination Competitiveness in Tourism. J. Travel Res. 2016, 55, 1041–1050. [Google Scholar] [CrossRef]
- Gössling, S.; Peeters, P. Assessing tourism’s global environmental impact 1900–2050. J. Sustain. Tour. 2015, 23, 639–659. [Google Scholar] [CrossRef]
- Frechtling, D. Issue Paper Series—The Economic Impact of Tourism: Overview and Examples of Macroeconomic Analysis. In Issue Paper Series & Ndash; The Economic Impact of Tourism: Overview and Examples of Macroeconomic Analysis; World Tourism Organization (UNWTO): Madrid, Spain, 2013. [Google Scholar]
- Pirvu, R.; Radoi, I.M. The implications of regional competitiveness on regional development policy and economic cohesion. Theor. Pract. Res. Econ. Fields 2019, 10, 35–44. [Google Scholar]
- Mahadevan, R.; Amir, H.; Nugroho, A. Regional impacts of tourism-led growth on poverty and income inequality: A dynamic general equilibrium analysis for Indonesia. Tour. Econ. 2017, 23, 614–631. [Google Scholar] [CrossRef]
- World Travel & Tourism Council. Identifying the Critical Material Issues for Travel & Tourism; World Travel & Tourism Council: London, UK, 2017; Available online: https://www.wttc.org/publications/2017/identifying-the-critical-material-issues-for-travel-tourism/ (accessed on 14 December 2019).
- Uysal, M.; Sirgy, M.J.; Woo, E.; Kim, H. (Lina) Quality of life (QOL) and well-being research in tourism. Tour. Manag. 2016, 53, 244–261. [Google Scholar] [CrossRef]
- Naidoo, P.; Ramseook-Munhurrun, P. Tourism and quality of life. In The Routledge Handbook of Tourism Impacts 2019; Gursoy, D., Nunkoo, R., Eds.; Routledge: London, UK, 2019. [Google Scholar]
- Moscardo, G. Tourism and quality of life: Towards a more critical approach. Tour. Hosp. Res. 2009, 9, 159–170. [Google Scholar] [CrossRef]
- Neal, J.D.; Uysal, M.; Sirgy, M.J. The Effect of Tourism Services on Travelers’ Quality of Life. J. Travel Res. 2007, 46, 154–163. [Google Scholar] [CrossRef]
- Meleddu, M.; Royuela, V.; Biagi, B.; Ladu, M.G. Tourism and Quality of Life: A Capability Approach; Working Paper CRENoS 201519; Centre for North South Economic Research, University of Cagliari and Sassari: Sardinia, Italy, 2015; Available online: https://crenos.unica.it/crenos/publications/tourism-and-quality-life-capability-approach (accessed on 14 December 2019).
- Bakker, M.; Messerli, H.R. Inclusive growth versus pro-poor growth: Implications for tourism development. Tour. Hosp. Res. 2016, 17, 384–391. [Google Scholar] [CrossRef]
- Mathew, P.V.; Sreejesh, S. Impact of responsible tourism on destination sustainability and quality of life of community in tourism destinations. J. Hosp. Tour. Manag. 2017, 31, 83–89. [Google Scholar] [CrossRef]
- Mella, P.; Gazzola, P. Sustainability and quality of life: The development model. Enterp. Compet. Environ. 2015, 542–551. Available online: https://www.researchgate.net/publication/282671925_Sustainability_and_quality_of_life_the_development_model (accessed on 20 December 2019).
- De Vita, G.; Kyaw, K.S. Tourism development and growth. Ann. Tour. Res. 2016, 60, 23–26. [Google Scholar] [CrossRef]
- Eurostat. Tourism. 2019. Available online: https://ec.europa.eu/eurostat/web/tourism/data/database (accessed on 20 December 2019).
- World Travel & Tourism Council. WTTC Data Gateway; World Travel & Tourism Council: London, UK, 2020; Available online: https://tool.wttc.org/ (accessed on 28 December 2019).
- Numbeo. Quality of Life Index by Country. 2020. Available online: https://www.numbeo.com/quality-of-life/rankings_by_country.jsp (accessed on 16 December 2019).
- Sachs, J.; Schmidt-Traub, G.; Kroll, C.; Durand-Delacre, D.; Teksoz, K. An SDG Index and Dashboards—Global Report 2016; Bertelsmann Stiftung and Sustainable Development Solutions Network (SDSN): New York, NY, USA, 2016. [Google Scholar]
- Sachs, J.; Schmidt-Traub, G.; Kroll, C.; Lafortune, G.; Fuller, G. Sustainable Development Report 2019; Bertelsmann Stiftung and Sustainable Development Solutions Network (SDSN): New York, NY, USA, 2019. [Google Scholar]
- Eurostat. Methodological Manual for Tourism Statistics. 2014. Available online: https://ec.europa.eu/eurostat/documents/3859598/6454997/KS-GQ-14-013-EN-N.pdf/166605aa-c990-40c4-b9f7-59c297154277 (accessed on 10 February 2020).
- World Travel & Tourism Council. Travel and Tourism: Economic Impact Research Methodology 2019. Available online: https://www.wttc.org/economic-impact/country-analysis/methodology/ (accessed on 11 December 2019).
- Numbeo. Quality of Life Index Methodology. 2020. Available online: https://www.numbeo.com/quality-of-life/indices_explained.jsp (accessed on 16 December 2019).
- Lafortune, G.; Fuller, G.; Moreno, J.; Schmidt-Traub, G.; Kroll, C. SDG Index and Dashboards Detailed Methodological Paper; Bertelsmann Stiftung and Sustainable Development Solutions Network (SDSN): New York, NY, USA, 2018; Available online: https://github.com/sdsna/2018GlobalIndex/raw/master/2018GlobalIndexMethodology.pdf (accessed on 10 December 2019).
- Everitt, B.S.; Landau, S.; Leese, M. Cluster Analysis, 4th ed.; Wiley Publishing: Hoboken, NJ, USA, 2009. [Google Scholar]
- Ward, J.H. Hierarchical Grouping to Optimize an Objective Function. J. Am. Stat. Assoc. 1963, 58, 236–244. [Google Scholar] [CrossRef]
- George, D.; Mallery, P. IBM SPSS Statistics 25 Step by Step, 15th ed.; Routledge: New York, NY, USA, 2018. [Google Scholar]
- Jung, Y.J.; Park, H.; Du, D.-Z.; Drake, B.L. A Decision Criterion for the Optimal Number of Clusters in Hierarchical Clustering. J. Glob. Optim. 2003, 25, 91–111. [Google Scholar] [CrossRef]
- Salvador, S.; Chan, P. Determining the number of clusters/segments in hierarchical clustering/segmentation algorithms. In Proceedings of the 16th IEEE International Conference on Tools with Artificial Intelligence, Boca Raton, FL, USA, 15–17 November 2005; pp. 576–584. [Google Scholar]


© 2020 by the authors. Licensee MDPI, Basel, Switzerland. This article is an open access article distributed under the terms and conditions of the Creative Commons Attribution (CC BY) license (http://creativecommons.org/licenses/by/4.0/).