Abstract
Epimedium folium is the major medicinally-used organ of Epimedium species and its metabolic changes during the leaf growth have not been studied at the metabolomic level. E. pubescens is one of five recorded species in the Pharmacopoeia of the People’s Republic of China and widely grows in China. A UPLC-ESI-MS/MS-based targeted metabolomic analysis was implemented to explore the metabolite composition in E. pubescens leaves under the cultivation condition and further to investigate their temporal variations among four representative growth stages. A total of 403 metabolites, including 32 hitherto known in Epimedium species, were identified in E. pubescens leaf, of which 302 metabolites showed the growth/development-dependent alterations. Flavonoid-type compounds were the major composition of the metabolites identified in this study. Most flavonoids, together with tannin-type and lignans and coumarin-type compounds, were up-regulated with E. pubescens leaf growth and maturation after the full flowering stage. Our results not only greatly enriched the existing Epimedium phytochemical composition database and also, for the first time, provided the metabolomics-wide information on metabolic changes during E. pubescens leaf growth and development, which would facilitate in the choice of an optimum harvest time to balance a higher biomass yield of Epimedium folium with its better medicinal quality.
1. Introduction
Epimedium species in Epimedium Linn. (Berberidaceace) are perennial shade herbal plants and widely distributed in the world including China, Japan, Korean, North Africa, Europe, and India [1]. Till now, a total of 81 species have been identified in Epimedium Linn. (Berberidaceace family), according to the recent NCBI taxonomy database, and more than half of them were found in China (http://www.iplant.cn). Epimedium plants are believed to nourish the kidney and reinforce the Yang and used in clinic to effectively treat sexual dysfunction, osteoporosis, cardiovascular diseases, menstrual irregularity, asthma, chronic nephritis, and immunoregulation [1,2]. These wide-reaching pharmacological effects are closely related to the compounds which are synthesized in the growing Epimedium plants and accumulated in medicinally used parts especially at harvest. In the recent 40 years, a total of more than 260 compounds have been identified from 20 known species of Epimedium Linn., of which were mainly flavonoids [1,2]. However, some of these known metabolites were not distributed in all the Epimedium species and showed species-variation or species-specificity [2]. Shi et al. identified 76 essential oils in E. pubescens and E. koreanum Nakai using GC-MS analysis and found that only 28 of them were shared by these two species [3]. In addition, the collective metabolite constituents in Epimedium folium, the major medicinal organ of Epimedium species has not to be explored enough in terms of a single Epimedium species, considering the estimate that a single plant species can produce about 4000 to 20,000 metabolites [4]. The first three Epimedium species with the most number of known chemical compounds were E. koreanum Nakai (97), E. sagittatum (67), and E. grandiflorum (57) [1]. E. pubescens is one of five recorded Epimedium species including E. brevicornu Maxim, E. sagittatum Maxim, E. koreanum Nakai and E. wushanense T.S.Ying in the Pharmacopoeia of the People’s Republic of China (version 2015) [5]. Besides the above-mentioned essential oils, 23 flavonoids were by far identified in this species [6].
Emerging metabolomics provides a large-scale metabolite analysis to mine a matrix of phytochemical compounds presented in given biological samples and to broaden our comprehensive understanding of dynamic changes and developmental regulation of plant metabolism during growth [7,8,9,10]. The primary high-throughput analytical techniques adopted in metabolomic studies include nuclear magnetic resonance (NMR) spectroscopy, gas chromatography-mass spectrometry (GC-MS), and liquid chromatography-mass spectrometry (LC-MS) together with multivariate statistical analysis. Due to its wide metabolome coverage, high sensitivity and accuracy, LC-MS has been greatly used in medicinal plant metabolomics to analyze a wide range of compounds such as flavonoids, alkaloids, terpenoids, steroids, coumarins, and lignans [11]. It also has gradually been used to characterize the spatio–temporal distribution of medicinal plant metabolites at the metabolomic level [12,13,14]. According to the aim and scope of the undergoing research, metabolomics experiments are generally classified into two types: Untargeted metabolomics analysis and targeted metabolomics analysis [15,16]. The former aims to analyze all the measurable known/unknown metabolites in a sample and has the opportunity for novel compound discovery in the studied organism in a specific condition, which most medicinal plant chemists especially long for in their drug discovery projects. In contrast, targeted metabolomics intends to study the metabolites with known chemical structure and biochemically annotated compounds and thus could only find a limited number of known metabolites in the given sample. However, it had an overall better precision in compound identification than the untargeted metabolomics method [17]. In addition, the metabolite coverage and throughput of targeted metabolomics analysis was greatly enhanced with the recent breakthroughs of LC-MS based large-scale targeted metabolomics methodologies and also with the MS/MS library databases constructed and enriched [18,19,20]. Following the widely targeted metabolomics method that Chen et al. developed in 2013 [18], 661 metabolites in Chrysanthemum morifolium. cv “Hangju” and 515 metabolites in developing leaves of Eucommia ulmoides could be simultaneously identified and quantified using UPLC-ESI-Q TRAP-MS/MS platform in combination of multiple reaction monitoring (MRM) scan mode [13,14].
With the increasing demand on the medicinally-used Epimedium species, wild resources are gradually exhausted and in shortage due to over-exploration within short time. People turn to cultivate Epimedium plants in China in a simulated shade environment. In this study, E. pubescens Maxim. was cultivated in a shaded field and the leaves collected at different growth stages were subjected to flavonoid content quantification and a widely-targeted metabolome profiling. Our result identified/annotated 403 metabolites present in E. pubescens leaf, which greatly enriched our current knowledge of compound composition in Epimedium metabolism [1,2]. Meantime, our metabolome-based temporal profiling, as the first case in Epimedium species research field, revealed that E. pubescens leaf possessed huge metabolic changes during the growth, which provided the important and supportive information to choose an optimum harvest time in order to obtain better integrative pharmacological effects of Epimedium leaves.
2. Results
2.1. E. Pubescens Growth in the Shaded Field
In our shaded field condition, E. pubescens seedlings with tender leaves emerged by the end of February and early March. Figure 1A outlined the major developmental events of E. pubescens plants from the full-flowering stage to the mid July. Flowering occurred from March and peaked in middle April. Fruiting simultaneously accompanied the flowering process and peaked in early May. Most follicles matured around early June and fell from the stalks shortly after ripening. Epimedium leaves are its major medicinal source. E. Pubescens leaves became hard and darker with leaf growth and maturation. Our observation showed that E. Pubescens leaf length increased mainly in April and May and reached about 7 cm and that its width stopped increasing till early June (Figure 1B). E. Pubescens leaf biomass weight increased with leaf growth and reached the peak by the end of June (Figure 1C), which coincided approximately with the harvesting period in production. In Longnan city, Gansu province where our E. pubescens plants were introduced, harvest begins from late May and ends by the end of June.
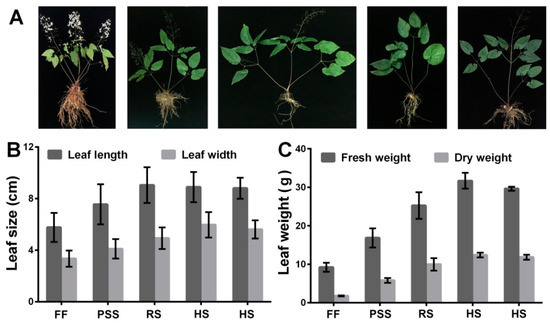
Figure 1.
Developmental events of E. pubescens plant (A) and changes of E. pubescens leaf size (B) and biomass weight (C) at five growth stages: Full flowering stage (FF), peak seed set stage (PSS), ripening stage (RS), and two timepoints of harvest stage (HS). The corresponding observations were made separately on 16 April, 10 May, 3 June, 27 June, and 21 July. Two investigations for harvest stage were carried out on 27 June and 21 July since E. Pubescens leaves are harvested usually in June by farmers and sometimes till July, depending on the actual growth status and place of E. Pubescens plants.
2.2. Flavonoid Content Fluctuated with E. Pubescens Leaf Growth and Development
Flavonoids especially prenyl-flavonoids such as epimedin A, epimedin B, epimedin C, and icariin are considered to be the primary bioactive components. They are often used to evaluate the quality of Epimedium folium and to study the quality influencing factors such as different growing places, process methods and harvest time. Flavonoid content and composition in Epimedium folium were affected by the intrinsic genetic characteristics [21] and environmental factors such as geographical origin [22] and light intensity [23]. In addition, icariine-based content analysis indicated the involvement of developmental regulation on Epimedium foliar flavonoid content during the growth [24,25,26,27,28,29]. In this study, we assayed the contents of nine major prenyl-flavonoids in E. pubescens leaves using LC-MS/MS method and investigated their dynamic changes with E. pubescens leaf growth and development in the simulated shaded field. The representative extraction MRM chromatograms (XIC) for reference standards in negative ion mode were shown in Figure S1. Our results showed that E. pubescens leaves contained a less amount of baohuoside II and icaritin (μg/g) and a big amount of epimedins A, B, C, icariin, baohuoside I, and sagittatosides A and B (mg/g) (Figure 2). Their contents fluctuated with E. pubescens leaf growth and maturation and displayed two major distinct dynamic changing trends. The first changing trend included epimedin A and epimedin B, which were gradually increased and accumulated mainly after reproductive stages, especially at harvest stage (Figure 2A,B). The content of epimedin A and epimedin B reached 6.21 mg/g and 8.09 mg/g in mid July. The rest seven prenyl-flavonoids had the opposite changing trend from epimedin A and epimedin B. That is, these seven prenyl-flavonoids especially baohuoside I and II were generally higher at the full flowering stage and then decreased greatly at later growth stages. For example, the content of baohuoside I and baohuoside II was 3.95 mg/g and 81.77 ug/g at the full flowering stage and only 0.18 mg/g and 1.59 ug/g in mid July (Figure 2E,F). Some prenyl-flavonoids in this group like epimedin C and icaritin were increased again at late harvest stage and had the close or even higher level, compared to their levels at the full flowering stage (Figure 2C,I). The total contents of these nine prenyl-flavonoids were also found highly accumulated at flowering stage and harvest stage (Figure 2J). Their total content declined to some degree at fruit stages.
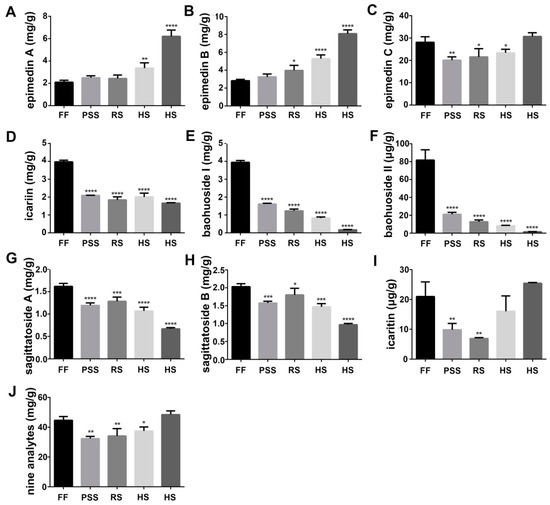
Figure 2.
Quantitation results of nine icariin analogues in E. pubescens leaves at five growth stages: Full flowering stage (FF), peak seed set stage (PSS), ripening stage (RS), and two timepoints of harvest stage (HS). The observation dates were the same as described in Figure 1. * p < 0.05 and ** p < 0.01, *** p < 0.001 and **** p < 0.0001 meant significant difference of the measurement at the indicated stage compared with E. pubescens leaf at FF stage. The contents were calculated per gram dry weight. (A) epimedin A; (B) epimedin B; (C) epimedin C; (D)icariin; (E) baohuoside I; (F) baohuoside I; (G) sagittatosides A; (H) sagittatosides B; (I) icaritin; (J) total content of nine analytes.
2.3. Widely-Targeted Metabolomics Analyis of E. Pubescens Leaves at Various Developmental Stages
2.3.1. Overview of E. Pubescens Foliar Metabolome
According to our above investigation on E. pubescens leaf indexes and developmental changes of flavonoid content, we conducted a targeted metabolomics analysis on the first four representative developmental stages of E. pubescens leaves. The accuracy and reproducibility of metabolite detection was revealed by the superimposed display analysis of mass spectrometry total ion current (TIC) of foliar QC samples which were run at the different time (Figure S2A,B). The TICs were well-overlapped, indicating our instrumental stability during the analysis. A total of 403 metabolites, including 216 metabolites detected in the positive ion mode and 187 metabolites detected in the negative ion mode, were identified in E. pubescens leaf samples using UPLC-ESI-Q TRAP-MS/MS method (Table S1). The identified metabolites were comprised of 138 flavonoids, 52 lipids, 48 phenolic acids, 46 amino acids and its derivatives, 26 nucleotide and its derivatives, 23 organic acids, 21 alkaloids, 7 tannins, 17 saccharides and alcohols, 7 vitamins, 5 lignans and 1 coumarins, 2 quinones, and 10 other metabolites. The flavonoids included 57 flavonols, 46 flavonoids, 11 flavanols, 9 dihydroflavones, 5 anthocyanins, 4 dihydroflavonols, 3 chalcones, 3 isoflavones, and 1 other type. Of 403 identified metabolites, 158 metabolites were annotated in KEGG compound database and 127 were mapped to 94 KEGG pathways (3rd level).
2.3.2. Multivariate Analysis of E. Pubescens Foliar Metabolomes at Various Developmental Stages
In order to reveal the developmental roles in E. Pubescens foliar metabolism, the resulting metabolomic data from four main growth stages were further subjected to multivariate statistical analysis. Unsupervised PCA (Figure 3A) and hierarchical cluster analysis (HCA) heatmap (Figure 3B) showed that the obvious metabolic changes occurred in E. Pubescens leaves across the growth and development. The first principal component (PC1) explained 67.9% of the variance, followed by the second principal component (PC2) with 16.6%, which both amounted to a total variance of 84.5%. The samples of four different growth stages were separated from one another. The FF stage was markedly clustered on the negative side of PC1 and far from other three growth stages, while the RS- and HS- samples were grouped on the positive side of PC1. Similarly, the HCA heatmap result clustered FF stage from other three growth stages, indicating a great number of metabolites changed in E. pubescens leaf after the full flowering stage. RS- and HS- stage were clustered closer than PSS group, indicating that RS- and HS- stage had more similar metabolite profiling, compared to PSS.
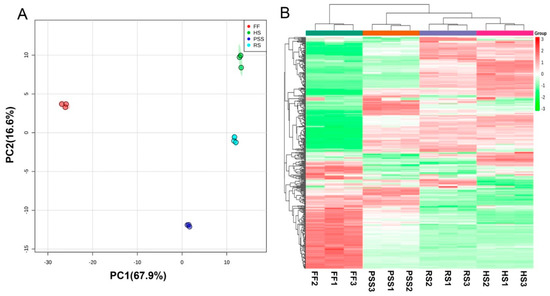
Figure 3.
Score plot of principal components analysis (PCA) (A) and heatmap of hierarchical cluster analysis (HCA) (B) showing that the leaf development regulated E. Pubescens foliar metabolites. The abbreviated stage name and observation dates were the same as described in Figure 1. HS in metabolomic analysis referred to leaf samples collected on 27 June.
2.3.3. Differential Metabolite Profiling of E. Pubescens Leaves during the Leaf Growth and Development.
In order to find out the differential metabolites regulated by E. pubescens leaf growth and development, a supervised OPLS-DA was further conducted to construct the classification models and discriminate the different metabolic compositions between the compared growth stages. As shown in OPLS-DA score plots (Figure 4A–F), clear metabolic differentiations in E. pubescens leaves were observed between PSS and FF, RS and FF, HS and FF, RS and PSS, HS and PSS, and HS and RS. The R2X and Q2 values (Figure 4A–F) and permutation tests (Figure S3A–F) suggested that these models had the high fitness and predictive capability and were suitable for further differential metabolite analysis.
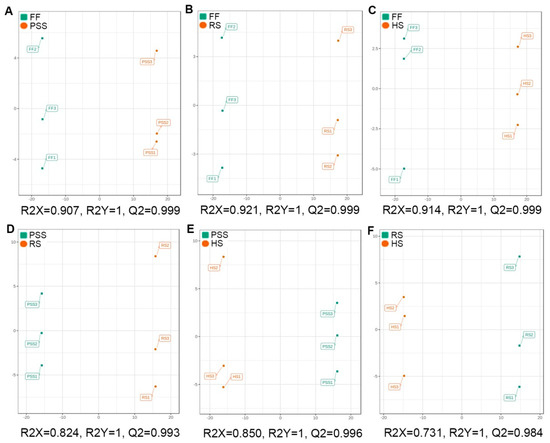
Figure 4.
Score plots of orthogonal partial least squares discriminant analysis (OPLS-DA) for six pairwise comparisons. R2X and R2Y were cumulative modeled variation of all R2Xs and R2Ys, separately, and Q2 was the cumulative predicted fraction. The abbreviated stage name and observation dates were the same as described in Figure 3. (A) PSS vs FF; (B) RS vs FF;(C) HS vs FF;(D) PSS vs RS;(E) PSS vs HS;(F) RS vs HS.
Using two differential metabolite screening criteria VIP ≥ 1 and |Log2FC (fold change)| ≥ 1, a total of 302 metabolites from 403 annotated metabolites were identified to differentially express in at least two studied stages (Table 1 and Table S2). As shown in Table 1, E. pubescens leaves at the full flowering stage had the remarkably different contents of metabolites from the subsequent three growth stages. Compared to FF stage, the contents of 213, 262, and 265 metabolites were found changed at PSS, RS, and HS stage, respectively. Venn diagram analysis further revealed that 194 differential metabolites were commonly regulated by three late growth stages and only few compounds were uniquely modulated by a specific growth stage (Figure 5A). We further compared the metabolite contents of E. pubescens leaves at the subsequent three stages, namely PSS, RS, and HS stages (Table 1, Figure 5B,C). 111 metabolites (52 increased/59 decreased) in RS stage and 131 metabolites (62 increased/69 decreased) in HS stage were found significantly distinct, compared to PSS stage. There were only 27 differentially regulated metabolites between RS stage and HS stage, which indicated that most metabolites in E. pubescens leaves remained a relatively constant abundance with its leaf maturation and senescence. The number of differential metabolites in each compound class was also investigated (Table 1). Our targeted metabolomic data uncovered that a high proportion of metabolites in each compound class were highly regulated by E. pubescens leaf growth stage. For example, 119 of 138 flavonoids ~87%, as the major bioactive compound resources of Epimedium folium, showed the altered contents during the leaf growth and development.

Table 1.
Number of differential metabolites found in different pairwise comparisons and compound class.
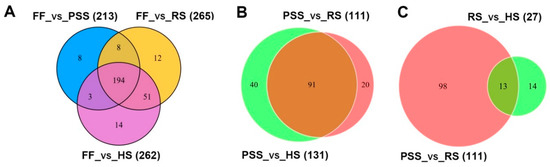
Figure 5.
Venn diagrams showing differential metabolites shared or unique among the different comparisons. (A) Differential metabolites detected by comparisons of FF stage and the remaining three growth stages. (B) Differential metabolites detected by comparisons of PSS stage and its subsequent two stages. (C) differential metabolites detected by comparisons of RS stage and its two neighboring stages: PSS and HS stages. The number in () was the altered metabolites between two compared growth stages. The numerical values on the Venn diagram depicted the number of differential metabolites shared or unique among the different comparisons. The abbreviated stage name and observation dates were the same as described in Figure 3.
The hierarchical and K-means cluster analyses were performed to characterize dynamic changes of differential metabolites in E. pubescens leaves across the four studied growth stages (Figure 6A–B). The HCA-based heatmap showed that the four growth stages of leaf samples were clustered into three major groups: FF stage, PPS stage, and RS and HS stages. The HCA also revealed that most flavonoid-type compounds together with tannin-type and lignans and coumarin-type were up-regulated with E. pubescens leaf growth and development, while lipid-type and amino acid-type compounds were down-regulated. The k-means clustering further classified all differential metabolites into nine sub-clusters (Figure 6B, Table S2). Sub-clusters 1–5 showed the similar metabolite changing trends, that is, the differential metabolites in these five groups had increased contents in E. pubescens leaves after the full flowering stage. Sub-cluster 1 contained 52 metabolites whose contents constantly increased throughout the whole growth period. The representative compounds in this group included flavonoid glycosides astragalin, icariin, luteolin and its metabolites, and phenylpropanoid neochlorogenic acid. Although the abundance of metabolites in Sub-clusters 2 and 3 were dramatically increased at PSS stage, the metabolites in the former sub-cluster remained constant during late stages while in Sub-cluster 3 declined greatly at ripening stage and then remained the slightly higher levels at harvest stage than at the full flowering stage. The metabolites in Sub-clusters 4 and 5 reached its accumulation plateau at the ripening stage and harvest stage, separately and then exhibited the similar changes as Sub-cluster 2 and 3, separately. Sub-clusters 6–9 consisted of metabolites whose levels decreased greatly after the full-flowering stage. 27 metabolites in Sub-cluster 6 and 69 in Sub-cluster 7 reached their lowest levels at the harvest stage and ripening stage, separately. The representative compounds in clusters 6–9 included chlorogenic acid, baohuoside I, lkarisoside D, lkarisoside C, and lipid-type compounds LysoPE 18:1, LysoPC 18:3, LysoPC 16:0, and LysoPE 16:0.
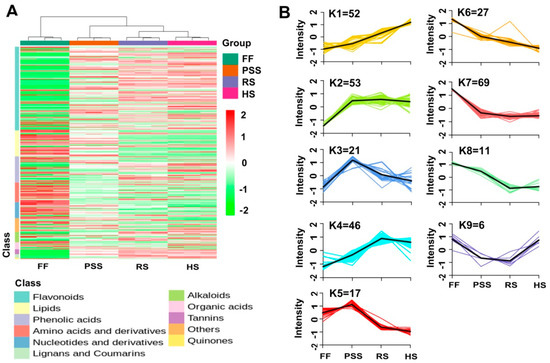
Figure 6.
HCA (A) and K-means (B) cluster analysis showing the dynamic accumulation of 302 differential metabolites across four representative growth stages. K-means cluster was performed on Z-score normalized intensities. The abbreviated stage name and observation dates were the same as described in Figure 3.
2.3.4. KEGG Pathway Enrichment Analysis of Differential Metabolites
Of 127 metabolites assigned to KEGG pathways (Table S1), 95 exhibited the fluctuating accumulation in E. pubescens leaves during the growth (Table S2). Thirty-eight more differential metabolites were putatively assigned onto KEGG pathways according to the similarities of their chemical structures with known KEGG compounds (Table S2). The further KEGG pathway enrichment analysis revealed that only “Flavonoid biosynthesis” was significantly different in the comparisons of FF and PSS, FF and HS, PSS and RS, and PSS and RS (Table S3). This indicated that flavonoid accumulation in E. pubescens leaves was tightly regulated by plant development during reproductive stages and maturation.
3. Discussion
Epimedium folium, named Yingyang huo in Chinese, is its major medicinally-used organ of this plant. As a perennial herb, Epimedium leaves experience an annual plant life cycle: emergence, growth and development, and maturation towards senescence. A number of physiologic activities accompanied with dramatic metabolic changes occurred in plant leaves during the year-round plant life cycle [14,30]. The influences of plant growth/development on Epimedium foliar constituents were studied on the relative contents of icariine [24,25,26,27,28,29], epimedin A [27], epimedin B [27], epimedin C [25,27] and sagittatoside B [28], and rouhuoside [29]. Although no consistent optimum time for the higher flanovoid content could be concluded from these studies, possibly due to the difference of experimental growth conditions and the studied Epimedium species, all these findings told that their contents fluctuated during the whole growth period. They usually had a higher accumulation in young Epimedium leaves and declined at the reproductive stage and increased later on to some extent, which was similar as our quantification of icariine and its analogues in E. pubescens leaves at the different growth stages. Our targeted metabolomics analysis also elucidated the overall developmental regulation of Epimedium foliar ingredients especially flavonoid compounds after the full flowering stages. Most of detected flanovoid compounds such as luteolin, acuminatoside, hyperinsuch, icariin and icaritin were significantly increased with E. pubescens leaf growth and development. It should be noted that the other main Epimedium bioactive compounds such as epimedins A, B, C, sagittatoside A, and sagittatoside B were just slightly changed in our four studied growth stages where E. pubescens leaves were already fully expanded and almost mature especially at harvest time. In E. sagittatum, a higher accumulation of main epimedium bioactive compounds epimedin A, B, and icariin was found in folded young leaves, not in expanded mature leaves [31]. KEGG pathway enrichment analysis revealed that flavoniod biosynthesis was significantly influenced by E. pubescens leaf growth and development. Transgenic studies showed the synthesis of major bioactive flanovoids was regulated by transcription factors such as MYB9 EsMYBA1, EsMYBF1, and EsGL3 [31,32]. Further expression profiling will facilitate us to understand the molecular mechanisms of developmental dynamic changes of E. pubescunes foliar metabolites at crucial growth and development stages.
4. Materials and Methods
4.1. Chemicals and Reagents
HPLC-grade methanol, ethanol and acetonitrile were purchased from Merck Corporation (Darmstadt, Germany). Analytical grade formic acid and acetic acid were provided by the Tianjin Reagent Company (Tianjin, China). Distilled water was purchased from Wahaha Group Co., Ltd. (Hangzhou, China). Standard compounds of nine icariin analogues including epimedin A, epimedin B, epimedin C, icariin, baohuoside I, baohuoside II, sagittatoside A, sagittatoside B, and icaritin were obtained from Shanghai Yuanye Biotechnology (Shanghai, China). All these standards were HPLC-grade and ≥98% of purity.
4.2. Plant Growth and Sampling
Epimedium (Epimedium pubescens Maxim.) rizhome buds were transplanted in October, 2016 from Longnan City, Gansu province, China to the shade mesh field at the Institute of Medicinal Plant Development (IMPLAD), Beijing, China. The plant and row distances were separately 15 cm and 60 cm. The black shade mesh was fixed onto 1.6 m high steel poles and can filter 80% sunlight irradiation. Epimedium leaves were harvested in the morning about every 24 days from 16 April, 2019 till 21 July, 2019. Each time, three biological replicates were collected from multiple uniformly-grown plants. In order to remove leaf surface soil, the collected leaves were rinsed quickly in the tap water and then dried with tissue paper. Subsequently, one portion of leaf samples for widely-targeted metabolomics analysis were flash frozen in liquid nitrogen and then stored at −80 °C till use. The other portion of leaf samples for quantitative analysis of nine icariin analogues were brought to the lab and dried at 60 °C in the oven for 12 h.
E. pubescens leaf dynamic growth was investigated using leaf indexes including leaf size (width X length) and leaf fresh and dry weight. Branches with three compound leaflets were collected each time randomly from the field. Leaf width and length of the middle leaflet was measured separately across its widest part and along its major vein. One replicate of leaf weight was measured from 20 branches and three replicates were done each stage. E. Pubescens leaf dry weight was measured after constant weight was obtained in the oven at 60 °C. The significant difference of leaf indexes across the studied growth stages (adjusted p < 0.05) were evaluated using one-way analysis of variance (ANOVA) with Tukey’s multiple comparisons test in GraphPad Prism 6.0 (La Jolla, CA, USA).
4.3. LC-MS/MS Quantitative Analysis of Icariin Analogues
4.3.1. Preparation of Quantitative Analysis Samples and Standard Solutions
The oven-dried leaf samples were powdered by the electric universal pulverizer and sieved via a 60 mesh sieve. Then, 50 mg of each Epimedium leaf powder was weighed and extracted in 25 mL of 40% (v/v) ethanol solution at room temperature for one hour using an ultrasonic extraction system. The extracted solutions were filtered under vacuum and the filtrates was then filtered via a 0.22 μm membrane and transferred into the inner vial for the subsequent analysis.
The appropriate amounts of epimedin A, epimedin B, epimedin C, icariin, baohuoside I, baohuoside II, sagittatoside A, sagittatoside B, and icaritin were separately weighed and dissolved in methanol as individual standard stock solutions. A series of mixed standard solutions were diluted by methanol to the suitable concentrations of 16.2–540 ng/mL for epimedin A, 27.8–555 ng/mL for epimedin B, 0.053–10.6 μg/mL for epimedin C, 10.3–515 ng/mL for icariin, 5.15–386 ng/mL for Baohuoside I, 1.29–645 ng/mL for Baohuoside II, 5.4–405 ng/mL for sagittatoside A, 2.475–495 ng/mL for sagittatoside B and 1.07–53.5 ng/mL for icaritin. All standard stock and work solutions were stored at −20 °C freezer.
4.3.2. LC-MS/MS Analysis
The analysis was conducted on a SHIMADZU Prominence LC system (Kyoto, Japan) coupled with a 5500 QTRAP mass spectrometer (AB SCIEX, Foster City, CA, USA), which includes a LC-20ADXR solvent delivery system, a DGU-20A3R automatic degasser, a SIL-20AXR autosampler and a CTO-20AC column oven. Chromatographic separation was performed at 40 °C on a Waters UPLC BEH C18 column (2.1 mm × 100 mm, 1.7 μm) The mobile phase consisted of a binary solvent system with ACN (A) and 0.1% formic acid in water (B), and run under the following parameters: 35% A at 0.01–0.5 min, 35–90% A at 0.5–9 min, 90% A at 9–11 min, 90–35% A at 11–12 min and 35% of A for 4 min to re-equilibrate the column. The injection volume was 2 μL and the flow rate was set to 0.3 mL/min.
The mass spectrometric detection was operated in the multiple reaction monitoring (MRM) mode with the negative electrospray ionization (ESI). The optimized ESI parameters included ion spray voltage of 4500 V, temperature of 550 °C, curtain gas of 0.24 Mpa, nebulizer gas of 0.38 Mpa and heater gas of 0.38 Mpa. The parameters of MRM transitions, declustering potential (DP) and collision energy (CE) of nine analytes were optimized using a syringe infusion pump and are listed in Table 2. Data acquisition and analysis were processed by the Analyst software (V.1.6.2) from AB SCIEX (Concord, ON, Canada).
Table 2.
Multiple reaction monitoring conditions of nine analytes in negative ionization mode.
4.3.3. Method Validation
The quantitative method in this study was assessed by calculating the parameters linearity, precision, repeatability, stability, limit of detection (LOD), and limit of quantification (LOQ). The calibration curve linearity of each analyte was calculated by plotting the acquired peak areas versus concentrations of this calibration standard. The correlation coefficient (r) was used to estimate the linearity of calibration curves. The limits of detection and quantitation were set at a signal-to-noise ratio of 3:1 and 9:1, separately. The precision was determined by six repeated measurements of a certain concentration of mixed standard solution within a day and expressed by the relative standard deviation (RSD). The repeatability was evaluated by determination of the analytes in six independently prepared extracts of a leaf sample, which was expressed as RSD. To determine the extract stability, the same leaf extract was analyzed at 0, 2, 4, 8, 16, and 24 h at room temperature, respectively. Variations were expressed as RSD. The relevant results of method validation parameters were seen in Table S4 and showed that the established LC-MS/MS method was suitable for quantitative analysis of icariin analogues in Epimedium samples. The concentrations of nine flavonoid analytes in E. pubescens leaf samples were calculated using their corresponding calibration curves, which were constructed using the series working standard solutions. Their absolute content was expressed by the amount per gram leaf dry biomass.
4.4. Widely-Targeted Metabolomic Analysis of E. Pubescens Leaves
4.4.1. Leaf Metabolite Extraction
The freeze-dried leaf was crushed into a fine powder using a laboratory mixer mill (MM 400, Retsch) with a zirconia bead for 1.5 min at 30 Hz. 100 mg of leaf powder was weighed and extracted overnight at 4 °C with 1.2 mL of 70% methanol, vortexed for six times and then centrifuged at 10,000 rpm for 10 min. The supernatants were collected and filtered via 0.22 μm membranes and then transferred into the inner vials for UPLC-ESI-MS/MS analysis. Simultaneously, a quality control sample (QC) was prepared by mixing all of the samples.
4.4.2. UPLC- ESI-Q TRAP-MS/MS Analysis of E. Pubescens Leaf Metabolomes
A UPLC system (SHIMADZU, Kyoto, Japan) connected with 6500 QTRAP mass spectrometer (AB SCIEX, Foster City, CA, USA) and equipped with an ESI source was applied to conduct the metabolomic analysis. A Waters ACQUITY UPLC HSS T3 C18 column (2.1 mm × 100 mm, 1.8 μm) was used to separate the metabolites in E. pubescens extracts. The column temperature maintained at 40 °C. The mobile phase consisted of a binary solvent system with water containing 0.04% acetic acid (A) and ACN containing 0.04% acetic acid (B), and run under the following gradient parameters: 5–95% B at 0–10 min, 95–95% B at 10–11 min, 95–5% B at 11–11.1 min and 5% of B for 2.9 min to re-equilibrate the column. The injection volume was 2 μL and the flow rate was set to 0.35 mL/min. Linear ion trap (LIT) and triple quadrupole (QQQ) scans were acquired on the 6500 QTRAP mass spectrometer in negative and positive ion modes, which was controlled by the Analyst software (V.1.6.3, AB SCIEX). The ESI operating parameters were set as: source temperature, 550 °C; ion spray voltage, 5500 V for the positive ion mode and –4500 V for the negative ion mode; ion source gas I, 50 psi; ion source gas II, 60 psi; curtain gas, 30 psi; the collision gas (CAD) was high. Instrument tuning and mass calibration were performed with 10 and 100 μmol/L polypropylene glycol solutions in QQQ and LIT modes, respectively. The mass spectrometric detection was operated in MRM mode with collision gas (nitrogen) set to 5 psi. DP and CE for individual MRM transitions were acquired by further DP and CE optimization. A specific set of MRM transitions were monitored for each period based on the metabolites eluted within this period [18].
During the analysis, the quality control sample was injected recurrently throughout the analytical run to monitor the UPLC-MS/MS system. E. pubescens samples were loaded in the random order.
4.4.3. Data Processing, Metabolite Identification and Quantitation and Multivariate Statistical Analysis
The secondary mass spectrum data were acquired and pre-processed using the Analyst software (V.1.6.3, AB SCIEX). The isotope signal, the repeated signals such as K+, Na+, NH4+, and fragments from the high molecular weight metabolites were excluded in the analysis. The characteristic ions of each compound were screened out by the triple quadrupole rod, and their signal intensities were detected in MRM mode. The metabolites in E. pubescens leaves were determined based on the secondary spectrum information of the Metware database MWDB (Metware Biotechnology Co., Ltd. Wuhan, China). Meantime, the mass spectrometry file was imported to the MultiaQuant software 3.0.3 for peak detection, integration and correction. The corrected peak area of the strongest secondary characteristic ion (cps, count per second) was used to quantify the relative content of the identified metabolite, which was further used for the below multivariate analysis (MVA) and the identification of differential metabolites with E. pubescens leaf development through the full-flowering stage till the harvest stage.
The peak area data were log2-transformed, mean-centered and unit variance scaled prior to PCA (principal component analysis) and OPLS-DA (orthogonal to partial least squares-discriminate analysis). PCA was performed using the statistics function prcomp within R package (Ver. 3.5.0) (www.r-project.org). OPLS-DA was conducted using R package MetaboAnalystR (Ver. 1.0.1). A permutation test (200 permutations) was performed to validate the fitness of OPLS-DA models. The differentially regulated metabolites between two compared groups were determined by VIP ≥ 1 and |Log2FC (fold change)| ≥ 1. The developmental changing patterns of the differentially regulated metabolites in E. pubescens leaves were visualized using the hierarchical cluster analysis (HCA) (pheatmap, R Ver. 1.0.12) and K-means cluster.
4.4.4. KEGG Pathway Analysis of the Identified Metabolites
Identified metabolites were annotated using KEGG Compound database and mapped to KEGG Pathway database (http://www.kegg.jp/kegg). KEGG pathway enrichment analysis of differential metabolites was done in MSEA (metabolite sets enrichment analysis). Their significance was determined by the hypergeometric test and was set as the corrected p < 0.05.
Supplementary Materials
Supplementary materials can be found at https://www.mdpi.com/1420-3049/25/1/137/s1. Figure S1. Representative extraction MRM chromatograms (XIC) of nine reference standards in negative ion mode. Figure S2. The overlapped total ion chromatograms of E. pubescens QC samples showing the accuracy and reproducibility of metabolite detection operated on our analytic platform. (A) positive ESI mode and (B) negative ESI mode. Figure S3. Permutation tests on OPLS-DA models. The horizontal line represented R2Y and Q2 calculated in the original OPLS-DA model. R2′Y and Q2′ calculated by permutation tests. Table S1 The identified metabolites and their expression profiles in E. pubescens leaves. Table S2. List of differential metabolites in E. pubescens leaves. Table S3. KEGG enrichment analysis of differential metabolites in six pairwise comparisons. Unique compound and compound referred to the number of the differential compounds assigned to the pathway separately in two compared stages and in all six comparisons. Uni_all and compound_all referred to the total number of differential compounds assigned to all KEGG pathways and the total number of the compounds assigned to all KEGG pathways. Table S4. Method validation for simultaneous quantification of icariin analogues in E. pubescens samples.
Author Contributions
Conceptualization, X.L.; Formal analysis, Z.Q. and D.L.; Funding acquisition, X.L.; Investigation, Z.Q., Y.C., C.Z., R.A. and Q.Z.; Project administration, X.L.; Resources, X.L.; Supervision, X.L.; Writing—original draft, Z.Q.; Writing—review and editing, D.L. All authors have read and agreed to the published version of the manuscript.
Funding
This research was supported by CAMS Initiative for Innovative Medicine (2017-I2M-3-013) and the National Key Research and Development Program of China (2017YFC1700706).
Conflicts of Interest
The authors declare no conflict of interest.
References
- Ma, H.; He, X.; Yang, Y.; Li, M.; Hao, D.; Jia, Z. The genus Epimedium: An ethnopharmacological and phytochemical review. J. Ethnopharmacol. 2011, 134, 519–541. [Google Scholar] [CrossRef] [PubMed]
- Jiang, J.; Song, J.; Jia, X.-B. Phytochemistry and Ethnopharmacology of Epimedium L. Species. Chin. Herb. Med. 2015, 7, 204–222. [Google Scholar] [CrossRef]
- Shi, Q.H.; Lv, L.; Li, L.; Zhao, L.; Zhang, G.Q. Analysis of the essential oil from two varieties of epimediums by GC-MS. J. Pharm, Pract. 2011, 29, 445–448. [Google Scholar]
- Fernie, A.R.; Trethewey, R.N.; Krotzky, A.J.; Willmitzer, L. Metabolite profiling: From diagnostics to systems biology. Nat. Rev. Mol. Cell Boil. 2004, 5, 763–769. [Google Scholar] [CrossRef]
- Chinese Pharmacopoeia Commission. Pharmacopoeia of the People’s Republic of China; China Medical Science Press: Beijing, China, 2015. [Google Scholar]
- Wang, Y.; Yuan, L.; Li, Y.B.; Zhang, Y.J. Analysis on chemical constituents of Epimedii Folium by UPLC-Q-TOF-MS. Chin. Traditional and Herbal Drugs 2017, 48, 2625–2631. [Google Scholar]
- Zhang, L.; Zhang, X.; Ji, H.; Wang, W.; Liu, J.; Wang, F.; Xie, F.; Yu, Y.; Qin, Y.; Wang, X. Metabolic profiling of tobacco leaves at different growth stages or different stalk positions by gas chromatography–mass spectrometry. Ind. Crop. Prod. 2018, 116, 46–55. [Google Scholar] [CrossRef]
- An, J.H.; Yuk, H.J.; Kim, D.-Y.; Nho, C.W.; Lee, N.; Ryu, H.W.; Oh, S.-R. Evaluation of phytochemicals in Agastache rugosa (Fisch. & C.A.Mey.) Kuntze at different growth stages by UPLC-QTof-MS. Ind. Crop. Prod. 2018, 112, 608–616. [Google Scholar]
- Nadi, R.; Golein, B.; Gómez-Cadenas, A.; Arbona, V. Developmental Stage- and Genotype-Dependent Regulation of Specialized Metabolite Accumulation in Fruit Tissues of Different Citrus Varieties. Int. J. Mol. Sci. 2019, 20, 1245. [Google Scholar] [CrossRef]
- Lee, H.-J.; Jeong, J.; Alves, A.C.; Han, S.-T.; In, G.; Kim, E.-H.; Jeong, W.-S.; Hong, Y.-S. Metabolomic understanding of intrinsic physiology in Panax ginseng during whole growing seasons. J. Ginseng Res. 2019, 43, 654–665. [Google Scholar] [CrossRef]
- Wu, H.; Guo, J.; Chen, S.; Liu, X.; Zhou, Y.; Zhang, X.; Xu, X. Recent developments in qualitative and quantitative analysis of phytochemical constituents and their metabolites using liquid chromatography–mass spectrometry. J. Pharm. Biomed. Anal. 2013, 72, 267–291. [Google Scholar] [CrossRef]
- Liu, J.; Liu, Y.; Wang, Y.; Abozeid, A.; Zu, Y.-G.; Tang, Z.-H. The integration of GC–MS and LC–MS to assay the metabolomics profiling in Panax ginseng and Panax quinquefolius reveals a tissue- and species-specific connectivity of primary metabolites and ginsenosides accumulation. J. Pharm. Biomed. Anal. 2017, 135, 176–185. [Google Scholar] [CrossRef]
- Wang, T.; Zou, Q.; Guo, Q.; Yang, F.; Wu, L.; Zhang, W. Widely Targeted Metabolomics Analysis Reveals the Effect of Flooding Stress on the Synthesis of Flavonoids in Chrysanthemum morifolium. Molecules 2019, 24, 3695. [Google Scholar] [CrossRef]
- Li, L.; Liu, M.; Shi, K.; Yu, Z.; Zhou, Y.; Fan, R.; Shi, Q. Dynamic Changes in Metabolite Accumulation and the Transcriptome during Leaf Growth and Development in Eucommia ulmoides. Int. J. Mol. Sci. 2019, 20, 4030. [Google Scholar] [CrossRef] [PubMed]
- Schrimpe-Rutledge, A.C.; Codreanu, S.G.; Sherrod, S.D.; McLean, J.A. Untargeted Metabolomics Strategies-Challenges and Emerging Directions. J. Am. Soc. Mass Spectrom. 2016, 27, 1897–1905. [Google Scholar] [CrossRef] [PubMed]
- Roberts, L.D.; Souza, A.L.; Gerszten, R.E.; Clish, C.B. Targeted metabolomics. Curr. Protoc. Mol. Boil. 2012, 98, Unit30.2-24. [Google Scholar] [CrossRef] [PubMed]
- Ribbenstedt, A.; Ziarrusta, H.; Benskin, J.P. Development, characterization and comparisons of targeted and non-targeted metabolomics methods. PLoS ONE 2018, 13, e0207082. [Google Scholar] [CrossRef]
- Chen, W.; Gong, L.; Guo, Z.; Wang, W.; Zhang, H.; Liu, X.; Yu, S.; Xiong, L.; Luo, J. A Novel Integrated Method for Large-Scale Detection, Identification, and Quantification of Widely Targeted Metabolites: Application in the Study of Rice Metabolomics. Mol. Plant 2013, 6, 1769–1780. [Google Scholar] [CrossRef]
- Zhou, J.; Liu, H.; Liu, Y.; Liu, J.; Zhao, X.; Yin, Y. Development and Evaluation of a Parallel Reaction Monitoring Strategy for Large-Scale Targeted Metabolomics Quantification. Anal. Chem. 2016, 88, 4478–4486. [Google Scholar] [CrossRef]
- Zhou, J.; Yin, Y. Strategies for large-scale targeted metabolomics quantification by liquid chromatography-mass spectrometry. Analyst 2016, 141, 6362–6373. [Google Scholar] [CrossRef]
- Kang, S.; Zhang, W.; Zheng, J.; Lu, J.; Lian, C.J.; Ma, S.C. Investigation of fingerprint and assay of flavonoid glycosides in Epmedii Folium. Drug Stand. Chin. 2018, 19, 359–375. [Google Scholar]
- Dong, B.; Wang, K.P.; Guo, T.W.; Zhang, D.W.; Dong, Q.S.; Zhang, C.W.; Zhang, G.H. Correlation analysis on content of active component in Epimedium brevicornum Maxi and soil nutrients in Gansu province. Lishizhen Med. Mater. Med. Res. 2015, 26, 2027–2028. [Google Scholar]
- Pan, J.; Guo, B. Effects of Light Intensity on the Growth, Photosynthetic Characteristics, and Flavonoid Content of Epimedium pseudowushanense B.L.Guo. Molecules 2016, 21, 1475. [Google Scholar] [CrossRef] [PubMed]
- Tan, Y.F.; Liang, W.N. Content determination of icariine in Epimedium pubescens and study on its optimum harvest seasons. China Pharm. 2019, 28, 8–10. [Google Scholar]
- Zuo, J.P.; An, X.H. Content determination of epimedin c and icariin in Epimedium from different harvest seasons by HPLC. China Pharm. 2019, 28, 8–10. [Google Scholar]
- He, S.Z.; Wang, Y.Y.; Xu, W.F.; Huang, M. Research on flavonoids in leave of Epimedium myrianthum and Epimedium acuminatum in Guizhou for different growth phase. Guizhou Sci. 2008, 26, 34–37. [Google Scholar]
- Ren, L.F.; Dong, C.M.; Su, X.H.; Du, Z.H. Research on suitable harvest period of Epimedium sagittatum. Mod. Chin. Med. 2018, 20, 999–1002. [Google Scholar]
- Tang, C.F.; Huang, W.H.; Peng, Y.D.; Guo, B.L. The influence of growth time on flavonoid constituents of Epimedium koreanum Nakai. China J. Chin. Mater. Med. 2007, 32, 2438–2440. [Google Scholar]
- Jia, M.G.; Sun, W.J.; Zhou, J.Y.; Zhu, C.D.; Xu, D.B. Determination of 2 flavonoids in Epimedium wushanense in different growing seasons by HPLC. Lishizhen Med. Mater. Med. Res. 2006, 17, 1473–1475. [Google Scholar]
- Liu, J.; Liu, Y.; Wang, Y.; Abozeid, A.; Zu, Y.-G.; Zhang, X.-N.; Tang, Z.-H. GC-MS Metabolomic Analysis to Reveal the Metabolites and Biological Pathways Involved in the Developmental Stages and Tissue Response of Panax ginseng. Molecules 2017, 22, 496. [Google Scholar] [CrossRef]
- Huang, W.; Zeng, S.; Xiao, G.; Wei, G.; Liao, S.; Chen, J.; Sun, W.; Lv, H.; Wang, Y. Elucidating the biosynthetic and regulatory mechanisms of flavonoid-derived bioactive components in Epimedium sagittatum. Front. Plant Sci. 2015, 6. [Google Scholar] [CrossRef]
- Huang, W.; Lv, H.; Wang, Y. Functional Characterization of a Novel R2R3-MYB Transcription Factor Modulating the Flavonoid Biosynthetic Pathway from Epimedium sagittatum. Front. Plant Sci. 2017, 8. [Google Scholar] [CrossRef] [PubMed]


© 2019 by the authors. Licensee MDPI, Basel, Switzerland. This article is an open access article distributed under the terms and conditions of the Creative Commons Attribution (CC BY) license (http://creativecommons.org/licenses/by/4.0/).