Abstract
Despite studies on thermal comfort being consolidated in the scientific literature, people’s well-being in some specific conditions and places, such as hospitals, requires to be further explored. The paper describes the methodological approach adopted to evaluate thermal comfort level and perception of pregnant women hosted in the obstetric ward of a test-bed case (Sant’Orsola hospital in Bologna, Italy). The methodology adopts a mixed approach that compares the results of on-site monitoring by probe (as quantitative data) with the ones of a survey (questionnaire form) delivered to the involved subjects (as qualitative data) to understand if metabolic alteration may influence the pregnant women’s perception of comfort conditions. The first follows ISO 7730, the second, ISO 10551. The comparison between the instrumental collected data and the outcomes of the survey revealed a wide gap between TSV (Thermal Sensation Vote) and PMVm (Predicted Mean Vote, measured on-site). The reason can be identified in the use of a standardized metabolic unit from ISO that does not correctly reflect the physiologic condition of pregnant women. Following a trial and error methodology, a met value for pregnant women is accordingly proposed. Moreover, an adaptive thermal comfort approach is adopted. This research is a first step towards the definition of specific thermal comfort in a hospital ward hosting pregnant women and more generally offers a reflection about the need to define specific met in the standards for some particular categories (children, elderly, pregnant women, etc.) when investigating thermal comfort.
1. Introduction
Since the beginning of the last century, the relevance of thermal comfort arose in relation to environmental conditions in workplaces and to potential situations of stress for end-users as highlighted by A. Pharo Gagge [1], where the first principle of thermodynamics was theorized with relation to the human body. However, it is only with the studies of the Danish researcher P.O. Fanger that an index of comfort and well-being, referred to as thermal comfort, was defined years later. Accordingly, ASHRAE 55 [2] and ISO 7730 [3] define thermal comfort standard as “that condition of mind that expresses satisfaction with the thermal environment and is assessed by subjective evaluation”. These standards define how to calculate Predicted Mean Vote (PMV) and Predicted Percentage Dissatisfied (PPD) in indoor environments, both applied to healthy people.
During the last decade, a number of studies further developed the above-mentioned definition following different approaches to demonstrate how thermal comfort could be influenced by several factors dealing with the indoor environment and human physical conditions [4,5,6,7]. Despite the huge efforts spent in this field, there is still a limited attention paid to specific environmental or biophysical conditions such as difference of gender [8,9], range of age (children or elderly [10,11,12]), state of health [13], state of alteration, or particular state as pregnancy that may alter the conventional perception of comfort.
As evidenced by Parsons [14] the perception of thermal comfort changes if referring to men or women due to natural differences, but also with relation to different behaviours or habits: females tend to be cooler than males in cool conditions because they are physiologically more sensitive to temperature. Similarly, a recent study by Fabbri [15] on indoor comfort in primary schools, evidenced how children understand thermal comfort differently. These physiological differences may be increased in particular situations or in specific building typologies where pre-defined thermal conditions are set, as happens in schools or hospitals.
Hospitals are extremely complex buildings that have been widely investigated by researchers as reported by Salonen et al. [16] with a specific focus on the effects of the thermal environment, and many studies tried to systematically rate the comfort perception in different hospital in Sweden [17], Belgium [18], Taiwan [19]. San Josè Alonso et al. [20] linked the so-called sick building symptoms to three main causes: building characteristics, ventilation, pollution.
Specific studies have been carried out by Balaras [21], Dascalaki [22] and Van Gaever [18] on an operating room (OR) with the purpose to reduce the risk of infection, to improve the design efficiency for space and indoor condition, to assess the well-being of the surgical staff. Melhado [23] evaluated the thermal risk for the patient in operating rooms directly linking it to thermal conditions. Thermal comfort requirements are consequently set according to the function and the potentially related condition of stress as it is assumed that thermal perception impacts on work performances of medical staff [24].
1.1. Scientific Literature
The scientific literature offers a dedicated section to patients, whose particular physical conditions are evidenced as a very relevant factor by the World Health Organization (WHO) [25], assuming that appropriate thermal parameters could improve the healing therapy [13]. Therefore indoor thermal comfort is widely considered a priority issue in hospitals and related studies. Despite patients’ metabolism being already investigated in the literature, the correlation with thermal comfort especially with reference to pregnant women is still an open field of research. This sounds particularly interesting because pregnancy is not a pathological status even if this temporary condition produces an alteration of normal metabolism due to a number of factors linked to the body’s physiological adaptation, to hormonal variations and psychological aspects. In normal situations, pregnant women spend a couple of days in the hospital before and after the birth to complete the medical protocols and it is expected they consider the thermal comfort perceived in the ward similar to the one of their own house. The perception of comfort is indeed a key element in this specific condition and generally with relation to the users of the hospital typology.
However, performing a literature review in Scopus, using “patient in hospital” as keyword, over a million results dealing with medical issues are obtained and refining the process within the engineering and architectural field, most of the residual papers were focused on the environmental characteristics influencing thermal comfort [17,22,26] and the indoor environmental comfort [27,28], rather than on patients as key subject. A limited number of studies are addressed on analysing the perception according to age and gender diversity [29,30,31,32].
Despite it dates back to 2012, the paper from Khodakarami and Nasroallhi [33] is still one of the best in providing a quite good picture of the available scientific literature in this field. Surprisingly, the relevance of this topic was clearly highlighted in a work developed in 1977 [34], where the relation between the patient comfort and the effect of radiant ceiling heating in a hospital ward was investigated. This paper is still a milestone in the field and can be quoted in the history of this research branch.
As evidenced by Sattayakorn et al. [35], thermal comfort in hospitals is particularly analysed in Asian countries and tropical regions such as in Malaysia [28], Singapore [26], Taiwan [19], while the main source of reports across Europe come from Belgium [36], Greece [37] and Italy [38,39]. Other studies are connected to age or gender [14], role (e.g., nurse) [24] and some hospital-specific functions such as operating rooms [40]. The other key topic of the proposed study, dealing with Adaptive thermal comfort, is reported in some previous research works by R. De Dear [31,41,42,43], F. Nicol [44], Humphreys [45] and others [7].
The main subject of the research reported in this paper is strictly connected with rating thermal sensation of pregnant women comparing in situ monitoring data by a probe with the perceived one by a pool of testing patients. This approach has already been tested in a study performed to investigate the level of thermal comfort understanding by very young end-users in a kindergarten [15]. Unlike young children, who required a guided activity for completing the proposed survey, pregnant women are able to be independent in understanding the survey questions and to properly express their peculiar condition and sensations when filling the proposed form. The survey revealed that the patients do not consider architectural and behavioural features (such as bedding, clothes, services, room shape, etc.) too much relevant or at least able to influence the final outcomes.
Thermal comfort represents a key topic in several studies on building energy performance and energy efficiency with relation to standards and regulations. Accordingly, heating and cooling systems (HVAC) conventionally work using indoor thermal comfort set-point defined by the local controller. However, recent studies investigated the relationship between HVAC activation and human behaviour in influencing energy consumption.
With relation to public buildings, the analysis and evaluation of indoor thermal comfort usually considered the average value of indoor temperature (even if in some typologies and functions, such as schools and hospitals, it is harder to properly consider a unique average value as the users require very specific thermal comfort conditions). This paper assumes a specific background in the scientific literature review by Yang et al. [46] reporting the implications of thermal comfort standards in energy consumption. It includes studies of thermal comfort and adaptive models in office, school and residential buildings. Conclusions highlight the relevant influence of human behaviour with relation to perceived comfort conditions and consequent impact on energy demand without providing figures or simulations. A 1999 research from Bond et al. [47] correlates thermal and lighting comfort level with energy consumption. Two decades later, the excellent review of Jung e Jazizadeh [48] includes the relevant role of users in occupancy and comfort with relation to building energy efficiency. The work of Krokas et al [49] proposes an algorithm to correlate the cumulative energy costs with the thermal comfort score (in PPD, Predicted Percentage of Dissatisfied) in order to optimize building energy management system. Buratti et al [50] propose a simple method to correlate PMV (predicted mean vote) with HVAC indoor set-point temperature. It also proposes (Buratti et al., [51]) a 13-value thermal comfort scale to improve energy efficiency in schools. Jazizadeh and Jung [52] report a case study where HVAC are activated according to a personalized thermal comfort measurement by an RGB video image. Zhang et al [53,54] introduce an algorithm to correlate thermal comfort, indoor airspeed and air conditioning system, while Chaudahuri et al [55] adopt an artificial neural network within the same scope. Unfortunately, none of the mentioned studies includes the hospital typology as a case study, that still remains a lack in the specific scientific literature.
The closet work to the proposed research is the one from Ugursal and Culp [56] that considers the effect of temperature and metabolic rate on thermal comfort.
1.2. Thermal Comfort in Hospital: Observation about the Specific Case of Pregnancy
In the case of hospital buildings, energy consumption is strictly correlated to thermal comfort, especially in the case of the hospital ward, where, usually, the indoor temperature set-point is defined by law or national standards and/or following the hospital management rules. Thus, the indoor temperature set-point is not correlated to thermal comfort sensation. The proposed approach suggests that, if a more accurate thermal comfort sensation correlated to the patient (pregnant woman in the specific case) is obtained, HVAC can be set and activated according to more appropriate metering (e.g., with smart sensors) to reduce energy demand while improving the quality of the patients’ stay.
The novelty and originality of the paper concern two main aspects:
- The focus on pregnant women, as the subject with a different metabolic condition, is something that in the scientific literature about thermal comfort is still missing and helps in reflecting on comfort perception with relation to measured values and pre-defined standards,
- The adopted methodology combines survey and measured data to find an equivalent metabolism (met) that should be used to simulate PMV and thermal comfort following standards ASHRAE 55 [2] and ISO 7730 [3] and, consequently, to set HVAC system to improve building energy efficiency.
Additionally, it must be said that the study is not specifically aimed to measure a precise thermal comfort or metabolism value but rather to investigate pregnant woman in a cognitive phase concerning the building features and their perceived level with relation to a thermal comfort status. These outcomes were intended to drive renovation scenario with the purpose to improve the quality of stay as required by the hospital administration in a broader cooperation agreement aimed to address some retrofitting options.
This is the reason why the study was not originally planned to include several hospitals and enlarging the pool of patients for the survey. Thus, the authors are aware that the 55 participants to the survey are not representative from a statistical point of view to extend the validity of outcomes according to a more general perspective (even because the perception can be indirectly influenced by other factors such as the perceived quality of the healthcare system, etc.), however, the authors are also convinced that comparing the in situ measurement with a user-centred survey can be of interest for the scientific community in terms of methodological approach and of potential impacts in re-addressing the standards for very specific categories in further studies. Assuming a generalization of comfort level is not possible for all kind of subjects and some specific categories such as children, elderly and sick people are not included in ISO 7730 and ASHRAE 55 with dedicated standards further studies will be needed and pregnant women might be added as a fourth specific group to be investigated in future studies on thermal comfort.
2. Research Aims
The paper reports the outcomes of a study aimed to directly measure thermal comfort parameters perceived by pregnant women spending their stay in the in-patient rooms. The scope was to compare the individual assessment given by the user subject (TSE Thermal Sensation Vote) with the objective value measured by the probe, and PMV (Predicted Mean Value) calculation following ISO 7730 and ASHRAE 55.
The proposed research methodology is based on comparing TSV and PMV (for a pregnant woman) which is a widely validated and commonly used approach in thermal comfort research fields. Assuming the lack of specific literature and the limited knowledge in this field, the present research can be considered a pioneering study, that can be of help in improving the current standard guidelines. The specific goal of the study is to evaluate the thermal comfort for pregnant women by comparing the in situ measured values and the perceived ones in the testbed case of the obstetrical hospital wing. An additional expected result is to gain an estimation of the specific value of the metabolic unit for pregnant women.
3. Materials and Methods
The research is based on two different and complementary methods, whose outcomes were compared and critically evaluated. Both the methods were operatively implemented in the same day and conditions in the test-bed case in the obstetrical hospital wing.
- The first one follows an instrumental on-site standard approach where a monitoring activity was performed with adequate instruments located in a typical in-patient room (sample room),
- The second one follows a subjective approach where the pregnant patients and the other staff are asked to fill a survey to express their state of comfort/discomfort with relation to environmental conditions.
The purpose is to evaluate the thermal sensation through a specific survey and to compare it with the monitored data by the in situ probes.
As reported in Figure 1 a mixed approach was adopted including both qualitative (survey to define TSV) and quantitative (indoor monitoring, to measure PMV following standards) data.
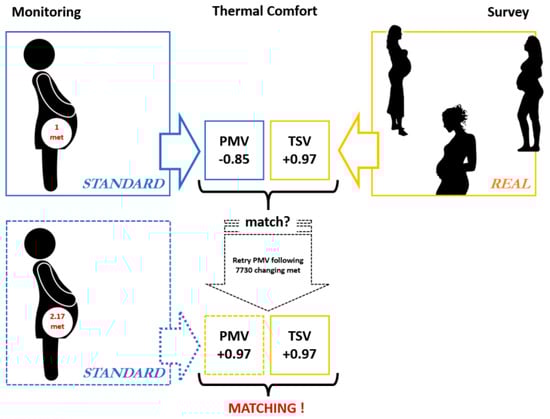
Figure 1.
Research methodology flowchart.
3.1. Standard Approach: on-Site Indoor Thermal Comfort Monitoring
The on-site measurement was conducted using the microclimate station HD32.3 produced by DeltaOHM. The device is pretty small (28 cm × 4.5 cm × 4 cm) and it does not emit any sound or radiation during the monitoring activity, therefore it can be located inside the in-patient room without creating any kind of disturb. Datalogger allows to measure all data input to obtain PMV and PPD indexes: air temperature, mean radiant temperature, relative humidity and airspeed. The instrument picked up and stored three different data typologies: temperature, relative humidity and airspeed as reported in Table 1.

Table 1.
Datalogger HD 32.3 by DeltaOHM. Probe characteristics index Predicted Mean Vote (PMV) and Predicted Percentage Dissatisfied (PPD) (brand DeltaOhm Index WBGT–PMV–PPD).
3.2. Subjective Approach: Thermal Comfort Survey
The subjective approach consists of a survey with specific questions to let pregnant women express their level of comfort/discomfort in relation to environmental conditions. The structure of the survey and the way it was delivered to the subjects was agreed with the Hospital Administration staff who informed the ward responsible and the involved people of the purpose and the conditions of the study to comply with the regulations in this field. The related ethical issues and data protection (GDPR) are part of the agreement, and all personal data are considered strictly confidential, so no sensible data were collected and the ones used for the research purpose are aggregated. The ward normally hosts three categories of subjects: patients, staff people and visitors. The survey is aimed at only the patients (pregnant women). The testing pool composition is confidential for privacy reasons, however the 55 pregnant women involved range between 25 and 35 years old. The survey was prepared following standards ISO 10551 [57]. Several studies adopt the subjecting approach by submitting surveys [48,49,50,51,52,53,54,55,56,57,58,59,60,61,62]. Sometimes, particular conditions or particular users, such as children in a 4–5 years age range [15,63], require the survey to be integrated or adapted to facilitate the understanding and the filling procedure. A correct understanding of the questions is absolutely necessary to avoid any bias or cognitive error. Therefore, in this study each question has been targeted in order to gain reliable information about the indoor comfort condition in the hospital room by adult women. The question form follows the instruction for using the judgement scale provided from the standards. The questions are formulated according to three key elements based on the following format: How are you feeling? how do you find something? and how would you prefer to be?
The survey was submitted to all the ward’s users with the aim to consider possible differences, but for the scope of this research, it is of particular importance to understand the pregnant’s feeling in a very precise moment and her preferences if different from the feeling. Thus just the pregnants’ answers were taken into account in the analysis of the results.
As Appendix A reports the survey includes six questions about four main topics as temperature, smell, air quality and illumination perception inside the room.
Multiple choice forms were used for the answers making the survey easier and quicker to fill and ensuring comparable results as ISO 10551 requires. The structure of the scale has a symmetric form, it runs from +3 which represent the highest level of satisfaction to −3 which is the lowest. In the middle 0 is the neutral state. The survey is easy to understand and fast to fill, the answer words were carefully selected for each language in order to avoid misunderstandings. Moreover, considering the multi-ethnic population of the obstetric ward, surveys were translated into five different languages Italian, French, English, Arabic and Russian to involve the largest number of subject as possible. Each participant is asked to declare her age and qualification as pregnant, visitors or caretakers. The complete English version of the survey is provided as Appendix to this paper. There are several factors that may influence the reliability of answers such as moment of the day the pregnant is involved, her state (tired or asleep), etc.
From a first overview of the outcomes, a different perception of thermal conditions emerges between pregnant and staff people. This was absolutely expected as the patients are usually in a sedentary activity while caretakers are working around them, thus they should have different feeling and perception.
4. Theory: the Test-Bed Case Study
4.1. Obstetrical Ward in S.Orsola-Malpighi Hospital in Bologna (Italy)
The described methodology was tested in the obstetrical ward of the Hospital Sant’Orsola-Malpighi in Bologna, which is one of the two main hospitals of the city. The building hosting the maternity division of the hospital is an h-shaped volume (Figure 2 and Figure 3) originally erected in 1933 and then enlarged and updated during the following decades (1997). It is currently a four-storey building and the obstetric ward is located on the first floor of the north wing with a total capacity of 40 bedrooms. On average, more than 250 childbirths per month take place in the obstetric ward of this hospital. The main constructive features (thermal transmittance in W/m2K) of the building can be listed as follows:
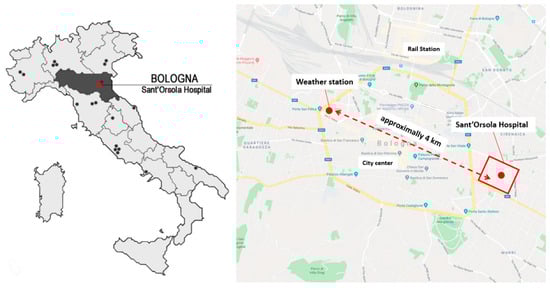
Figure 2.
Case study location.
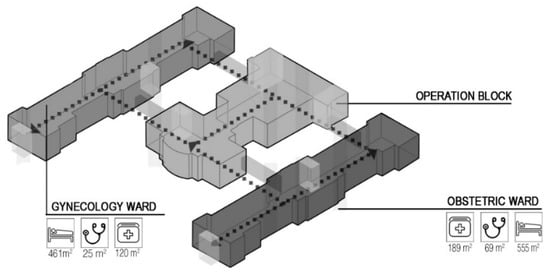
Figure 3.
Sant’Orsola-Malpighi Hospital- First floor.
- Composite concrete floor slabs (U = 1.43 W/m2K),
- Structural bearing clay masonry cm 42 thickness (U = 0.98 W/m2K),
- Double glazed timber framed window (Uav = 2.20 W/m2K).
Following the described methodological approach a typical room (n° 15 on the first floor) was selected as a basic unit. The room where monitoring datalogger was placed has a surface of 36 m2, with a window of 1.2 × 1.5 m, without en suite bathroom (currently not fulfilling the national rules and explaining the demand for renovation).
Bologna is a city located in the middle-northern part of Italy, (lat. 44.31 N, long. 11.17 E), in the middle of the Po valley. Following the classification of Koppen [64,65], the weather is Humid Subtropical Climate(Cfa) and it is characterized by a range of latitudes 20° to 35°, mild cold in winter and hot and sunny summers, weak wind and focused rain particularly during autumn and spring seasons. Climate outdoor data, referring to the 24th of November 2017 (day of the measurements), are reported below in Table 2 and Figure 4.
Table 2.
Bologna outdoor climate data 24th of November 2017. Greyline marks are referred to the survey duration.
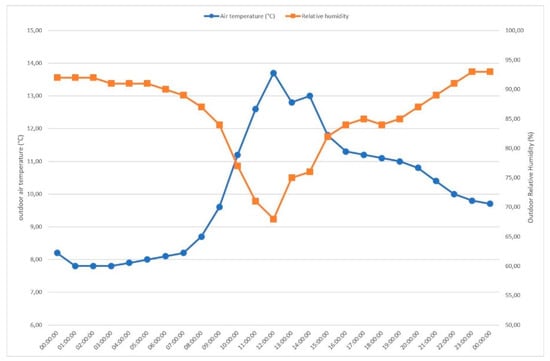
Figure 4.
Bologna outdoor air temperature and relative humidity 24th of November 2017 (by Dexter ARPAER [66]).
4.2. Monitoring Activities
The monitoring activities were implemented in room number 15, which represents the typical in-patient room of the obstetric ward and directly assigned by the management staff.
Restricting rules within the obstetrical ward limited the time in which the research could be implemented and a specific authorization was received from the hospital management to proceed to ask pregnant women for their informed consensus to be part of the process.
The activity took place on the 24th of November 2017 and it started at 9 am and finished at 11. During this time no visitors were allowed and a very limited staff activity was registered.
Data measurement were collected every 15 seconds for three hours storing totally 758 measures. Crucial importance was given to the probe placement: an appropriate position ensures the correct performance. Indeed it was located on a table next to the door (h=100 cm).
Figure 5 and Figure 6 provide the obstetric ward and room plans while Figure 7 and Figure 8 the monitored room and the data-logger. The best location for the probe was to place it in the middle of the room in order to avoid any contact with the wall radiant temperature but the only position allowed by the room layout and ordinary activities was to place it next to the door.
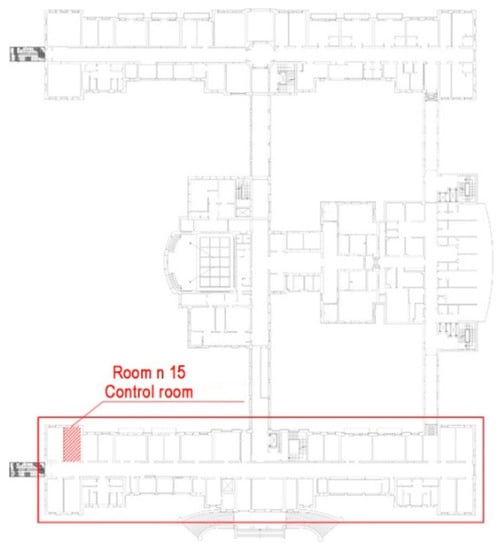
Figure 5.
Plan of Obstetric ward and inpatient room number 15 (pregnant room).
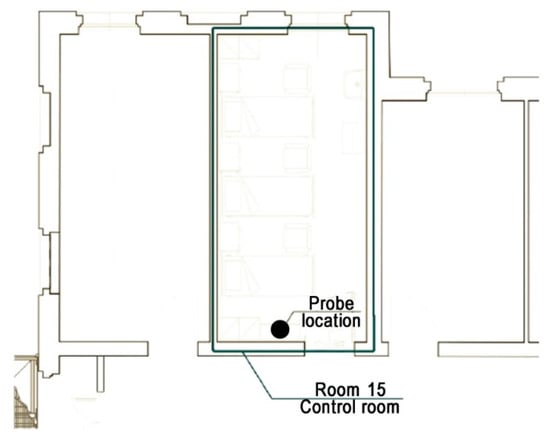
Figure 6.
Detail of in-patient room number 15 (control room).
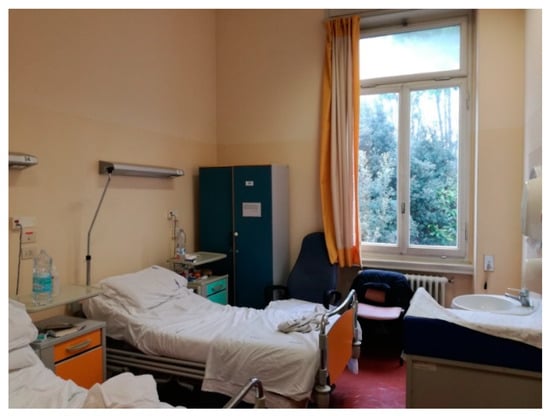
Figure 7.
Picture of control room n.15.
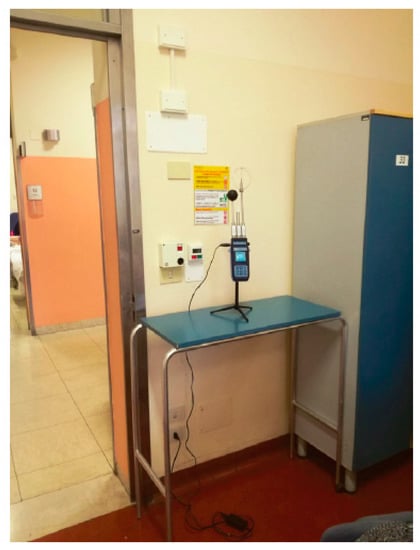
Figure 8.
Picture of datalogger position in control room n.15.
In accordance with the hospital policies, it was decided to choose a discrete location without invading the private space of pregnant women within the room. Furthermore, it has to be remarked that wall radiant temperature (in the case of positing too closed to the wall) can be considered not influent because does not affect the result. According to the research purpose the presence of pregnant women (and people in the room) is considered the priority in order to make the two approaches comparable. The research activities were performed while the pregnant women were hosted in the room. Room number 15 is assumed as control room considering that the other room (hosting two, three or four beds) have very similar characteristics (geometry, number of windows, features, furniture, etc.). An empty room was available for double-checking or in the case of emergency the test was suspended.
During the monitoring activity, the device was not moved from its positioning for three hours and it was not altered by any external agents. The window was not opened for the entire duration of the test.
4.3. Survey Interviews
The surveying activity started as soon as the probe was located and it lasted one hour and half in total. Firstly, the surveys were delivered room by room to the users (pregnant women mainly) followed by a synthetic explanation about the research and its purpose. Some of them were enthusiastic to take part while others were focused on their own concerns (pain, tiredness, nursing time) and they asked for some help to fill the survey or refused to join. At the end of the time, the number of completed surveys by pregnant was 55 over 57. The majority of the target group for this activity were the pregnant women (55), while 10 were visitors and 13 were caretaker. The results were processed considering only the 55 surveys of pregnant patients.
The study has been carried out on the 24th of November of 2017 from 10 am to 12 am. The pregnant women, who took part in the survey, were included in a range of age between 20 and 35 years old. The majority were Italian while ten women belonged to different ethnic groups from Arabian and African countries. Due to data protection it is not allowed to individually report age and nationality. The surveys were submitted to all the patients, both pregnant women and those who have already given birth. In the obstetric ward, the patients have usually an overall stay of a week (arrival is usually 2–3 days before the expected birth date and the leave is 2–3 days after the birth). The local circumstance was registered: some pregnant women were alone and others with their own partner, the most were in their rooms and few in the corridor with children held in their arms, one of the patient was over 40 years old.
4.4. Adaptive approach
The air temperature, airspeed and relative humidity values were measured by the datalogger. As explained in paragraph 4.2, this is relevant for two reasons:
- It allows to define the PMV value, following the ISO 7730 and ASHRAE 55, in room number 15 used as ‘reference room’ (as ‘test room’) to compare PMV and TSV (see par. 5.2),
- Once the microclimate indoor parameters are measured, it is possible to adopt an adaptive approach for thermal comfort with relation to the ‘test room’ as already demonstrated and set in several studies [30,67,68].
As clearly reported by de Dear et Al. [41] and applied to some case studies [69,70,71], the adaptive approach allows to compare the indoor temperature with the optimal comfort indoor temperature. Figure 9 reports the results related to the monitoring activity, carried out on the 24th of November 2017, following the ANSI/ASHRAE 55 [2]. The red bullets represent the indoor temperature (°C), measured by the datalogger during the survey, expressed within the average time. It can be noted that indoor temperature is higher than the Optimal Comfort Temperature and very closed to the Tupper 80% limit, thus it can be argued the room has a “slightly warmer” temperature. If PMV assessed by the datalogger is compared with Optimal Comfort Temperature according to ASHRAE 55, the temperature of the room is +1 °C higher than the optimal one. This can impact on the outcomes of the survey and on TSV which is mainly reported as 0.97 (see the following paragraph).
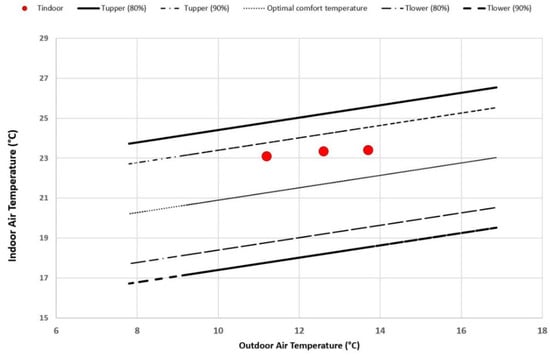
Figure 9.
Adaptive thermal comfort following ASHRAE 55 [72].
4.5. Accuracy
The study involves a limited number of people in one test-bed and it would certainly benefit of an enlarged number of cases (despite the potential different characteristics of the buildings may affect the comparability of the outcomes). Thus, it can be assumed that, despite the limitations, boundary conditions were fixed and did not alter the results. However, it has to be remarked that the specific patient typology (pregnant women) can belong to two different subcategories: those who have already given birth and those who are ready to. These two conditions produce some slight differences in body reaction that may generate different perception of thermal comfort. This can be avoided creating dedicated categories if a larger number of participants is made available. The attention paid by the pregnant towards the survey generally depended on their mood and physical conditions. During the activity the majority of pregnant women were glad to join the research in order to improve the thermal comfort and help pregnant women to be hosted in the future in having a more suitable and comfortable experience. In the field of monitoring, the accuracy is usually linked to the duration: the more it lasts, the most it is considered accurate. However, in this kind of study the focus is not on duration but rather in the chance to compare real data captured on-site with the pregnant perception. In this case the activity lasted 3 hours, the only ones considered acceptable by the hospital management with relation to the ordinary activity performed in the ward. It has to be remarked that any kind of decision or action within this study was required to be evaluated, accepted and approved by the hospital management staff and director, complying the current rules and policies.
Despite these limitations, the study faces a quite innovative issue in the field considering the very specific typology of a user (pregnant women) and can be considered a pioneering analysis in term of thermal comfort applied to a specific branch.
4.6. Limits of the study
The reduced number of people attending the survey is certainly a limitation of the study, however, considering the circumstances and the restrictions given by the hospital administration, the pool is acceptable for a pioneering study as already demonstrated in the literature with studies based on quite reduced samples such as Del Ferraro et. al. [73] with only 30 subjects or Wang [32] with only 16 subjects. This is quite frequent and reasonable when the research operates within hospitals or one very specific field of investigation. Furthermore, the survey delivery depends on a number of relevant people: the decision of the ward responsible, the approval of the medical staff, the availability of the patients. All these considered, the scope is to demonstrate the validity of the proposed methodology with the purpose to replicate it in other case studies related to the field of thermal comfort in hospitals and particularly dealing with pregnant women. The goal is not to generalize the outcomes, but rather to encourage the inclusion of very specific categories in other studies as well as in the standards definition. Never the less, it is important to clarify that:
- The research is aimed to evaluate if the proposed methodology combining survey and in situ monitoring (dealing with the specific case of thermal comfort perception of pregnant women) is effective to achieve positive results to be replicated elsewhere.
- The research activities were performed in the specific site despite a number of restrictions (that usually do not affect other building typologies) and therefore the standard protocols were not literally followed all the time.
- The datalogger and the probe were placed according to ISO 7726 [74] prescriptions taking into account the medical activity.
- The choice of the used instruments depended on the test room characteristics. A BABUC system was not a viable option due to the size that would affect both the ordinary activity in the room and consequently the outcomes of the study.
- The local thermal discomfort was not included in the study as it was considered too much specific considering the all mentioned boundary conditions.
5. Results
According to the research goals, this section individually reports the results regarding PMV by the data-logger (PMVm) and by the survey (TSV) to compare the two in order to gain a metabolic unit.
5.1. Monitoring Data and Survey Results
5.1.1. PMVm (Measured by Datalogger)
The monitoring result has been calculated using Deltalog 10 by Deltaohm 10. Once the storage monitored data have been downloaded, it was necessary to introduce the clothing resistance value and the metabolic unit value of the users in order to obtain the PMV value. According to ISO 7730 PMV calculation refers to a standard person wearing conventional clothing-in this specific case pregnants wear a long thin vest and their underwear (as cotton-pyjamas) plus the bedding sheet – corresponding to 0.6 clo, and 1 met giving a PMVm value of −0.85 (slightly cool).
5.1.2. TSV (Obtained by the Survey)
Since the thermal perception is subjective, in order to compare different comfort level, statistic values are used within a range of people. The TSV has been obtained following standard ISO 10551 that provides a scale of judgment for thermal comfort in order to obtain reliable and comparable data upon subjective perceptions. The survey results are reported in Table 3 (and related Appendix A and Appendix B). Table 3 shows the results for each question with the scope to turn the subjective perception into calculated and comparable measures.
Table 3.
TSV data for each survey questions. The complete calculation are reported in Appendix point B.
Figure 10 reports the frequency and cumulative TSV curve with reference to questionnaire 1 “What do you feel in this moment”. Answers with major frequency are “Neutral” and “Really hot” with the residual ones dealing with a warm sensation. Considering that the research is not conducted in a laboratory but in real conditions (on-site), a direct correlation between the measured temperature and the questionnaire outcomes is not possible. It can be assumed that temperature was homogeneous during the survey period.
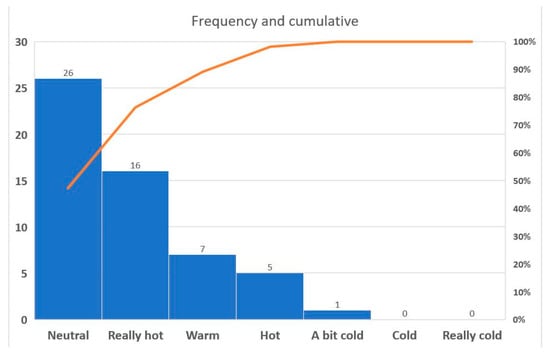
Figure 10.
Questionnaire results TSV (Thermal Sensation Vote) frequency and cumulative curve.
Table 4 reports the temperature captured by the datalogger and the optimal comfort temperature. It can be noted that air temperature is 0.5 °C higher than mean radiant temperature and 1.4 °C–1.8 °C higher than the Optimal Comfort Temperature. This leads to reflect on two main issues: indoor temperature is perceived as warmer than the optimal one and this can influence the survey outcomes, this is mainly due to the HVAC Heating Ventilation and Air-Conditioning systems and not to the walls and windows (otherwise mean radiant temperature Tr would be higher). The ward temperature is to be assumed a bit higher than the 20 °C–22 °C required by the Italian regulation, even if this is not directly linked to patients request. It can be motivated as a precautionary decision of the management staff to prevent discomfort. The outcomes of the study suggest reconsidering this decision.
Table 4.
Monitoring temperature during the survey.
The answer to the second question “How would you prefer the environment in this moment” was mostly−0.22 TSV that means patients would rather prefer a slightly colder environment.
5.2. Comparison between Pmvm and Tsv
The comparison between the PMVm and TSV shows a relevant difference in values. The obtained TSV was +0.97 (warm) (Table 3) while the PMVm was −0.85 (slightly cool) (Table 5) calculated following ISO 7730 by Deltaohm probe. This gap is more than accuracy levels used for whole parameter following Romano d’Ambrosio et al. [75] research about the role of measurement accuracy on the thermal environment assessment. This clearly evidences that pregnant women feel an altered comfort sensation compared to usual standards that are probably due to their particular metabolic condition. As a consequence, an interesting outcome of the study is to investigate which is the met value to be adopted in order to have PMVm (calculated according to ISO 7730) matching with TSV obtained by the survey (+0.97). Thus a corresponding met value for pregnant women is obtained. Assuming the boundary conditions are the same, as well as the clothing, the specific met value has been calculated following the “trial and error methods”.
Table 5.
Trial and error method: cases and results.
Starting from the data collecting during the monitoring activity, the met value has been calculated through Deltalog ISO 7730 software in 5 different trials. Table 5 reports the trials and the achieved results.
Trial number zero corresponds to the PMVm value based on the ISO 7730 standard. Using the trial and error method, different met values were supposed. As Table 5 shows, by increasing the met value, the gap between TSV and PMVm slightly reduces. In trial 5, the supposed met value (2.17 met= 125.60 W/m2) representing the real metabolic condition of pregnant women allows us to obtain TSV matches PMVm (equal to +0.97). Figure 11 shows the graphic elaborated by Deltalog Program with 2.17 met and 0.65 clo as parameters.
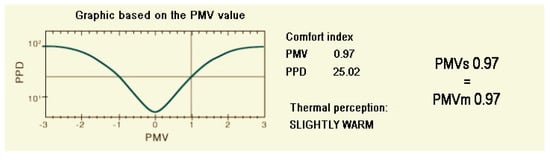
Figure 11.
Graphics of PMV results report on graphics “PPD as a function of PMV”.
6. Discussion
The research evidenced in this paper reported that for pregnant women in a typical sedentary condition when hosted in the in-patient room, the met value corresponds to 2.17. That is more than two times the standard one (1.0 met) for conventional people following ISO 7730. This result proves that different physiological conditions of the human body require different metabolic data input in order to properly evaluate thermal comfort. More in detail, it can be noted that the issue related to the metabolic rate should have to be faced more appropriately on a physiological basis, meaning that a theoretically correct methodology needs to “define” an “average pregnant individual”. However, this can be very difficult for several reasons as the ISO 8996 [76] definition of the metabolism for an “average individual” already demonstrates (Appendix C). With relation to the thermal comfort perception of pregnant women in medical and physiological fields the studies of Butte et al. [72] or Crume et al. [77] represent useful references as well as those of Piers et al. [78], Lawrence et al [79] for measurement and energy cost of common daily activities despite they are not directly connected to the scope of this research.
The study is not aimed to provide definitions but to obtain an equivalent value of met that should be used in ISO 7730 or ASHRAE 55 with relation to a pregnant woman involved in this kind of investigation. The same approach has already been adopted (and validated) in a past study on children groups involved in the monitoring of indoor comfort conditions in kindergartens (Fabbri [15,63]). There were no guidelines from previous studies on this kind of research activity in a hospital ward and consequently all decisions were taken discussing with the hospital management about the possible conflicts with their protocols and everyday activities. Once all the process was agreed, during the implementation phase, some of the pregnant women were in the beds, others standing in their rooms and others near to the corridor. These differences were not considered affecting the survey delivery, however, this should be taken into account in future studies to properly consider any influence of additional thermal resistance (Icl) when comparing TSV and PMV. During PMVm (par. 5.1) a standard value of 1 met corresponding to sedentary condition was adopted according to ISO 7730. The main goal was to compare an ISO 7730 “standard person” with a pregnant woman whose real metabolism is unknown.
The probe location may represent a limitation, but the chosen place was the only one acceptable for the ward responsible without creating any disturbance, and this cannot have influenced the results significantly and, despite to be taken into account for future studies, it does not affect the methodology and its replicability.
One of the main goals is to suggest a reflection on the inadequacy of PMV to consider the condition of some specific subjects such as pregnant women but also children, elderly, etc.
The research outcomes confirm that the adopted methodological approach allows us to validate the results and can be replicated elsewhere in different contexts. It gives adequate relevance to the subjective judgement which was compared and checked by the objective measurements. It is also an effective method to gain standardized results. Considering the first outcomes of this research, further studies can be encouraged and a reflection about the need to update the current standards can certainly become a priority in the short-mid terms.
The research did not take into account the adaptive comfort because in its original purpose, it was focused on the metabolic unit and because at the beginning of the study a so wide gap between the PMVm and the TSV was not expected. Consequently, the reason for these differences was investigated through simulation and trial-error method postponing the issue of adaptive comfort to a separate study. Despite the number of people (55) filling the survey may sound limited, the scope of the study was not to achieve a generalized result but to make a first step in including the specific category of pregnant women in thermal comfort standards. With reference to the adoption to Adaptive Thermal Comfort (par 4.4), it has to be remarked that the reference room has an indoor temperature 1 °C higher than the optimal comfort temperature that is set considering the outdoor temperature.
Can this influence the response of pregnant women during the survey? A study by Wang [31] proves uncertainty analysis in survey of subjective occupant evaluation compared to in situ measurements. Humphreys [80] highlights that the impact of metabolic rate on thermal comfort prediction is significant and it is not preferable to base the evaluation only on PMV when met is higher than 1.4 heat production [81]. Accordingly, in order to have a TSV comparable with the measured PMV, 2.17 met is needed and this is clearly higher than the limit of 1.4.
However, the comparability of this value can be discussed. Thus, according to the iteration of the calculation method, as reported in par. 5.2, an estimation of the thermal sensation of pregnant women can be obtained.
The response of the subjects can be influenced by a higher indoor temperature compared to the optimal comfort temperature, but this does not really affect the patient condition too much as they stay in the ward without experiencing a temperature difference between indoor and outdoor climate and they move within the ward without staying in their beds all day long.
Despite the topic requires further investigation and research (that the authors are willing to encourage with this paper) it has to be noted that existing studies on Adaptive Thermal Comfort in the literature are mostly focused on educational spaces or schools and not on hospitals and obstetric wards. Thus dedicated attention to pregnant women can be considered a first original and novel attempt of this study in the field.
7. Conclusions
This analysis represents a starting point that requires to be further improved. Future studies could involve a wider range of survey’s samples or could work with different hospitals or different wards in one or more countries. It’d be also possible to repeat the process in different periods (in summer and in winter), or even in a different time of day in order to gather possible changes and obtain a more refined picture. In the case of hospitals, it is important to remember that it can be often very difficult to follow the step-by-step protocols envisaged by standards and literature for other building typologies (such as offices, schools, housing).
Further research should investigate if the gained metabolic value for pregnant women is valid in all climate and cultural environment or may be influenced by local conditions. Moreover, future research should improve this first step comparing a group of pregnant women with a group of patient women or a group of nurses. A final remark deals with a core decision in the methodological approach: when more than forty years ago Fanger created the PMV model (about Fanger’s impact see [82]), he worked in a climate room basing its observation and studies on students and adults with moderate sedentary activities. However, the increasing complexity of today lifestyle and the progress in this research sector lead to a more sophisticated level of investigation that may require an in situ approach where subjects are monitored in real conditions.
Author Contributions
Authors equally contributed to all sections.
Funding
This research received no external funding.
Acknowledgments
The authors want to express their gratitude to Sant’Orsola-Malpighi Hospital and particularly to Ing. Daniela Pedrini who approved and supported this research, to the obstetric ward staff who helped in presenting the activities to the pregnant women involved and to all the people who took part to the survey. A special thank goes to the pregnant patients who accepted to cooperate in one of the most exciting and complex moment of their own life. Their help and generosity were an essential part of this research.
Conflicts of Interest
The authors declare no conflict of interest.
Appendix A
Submitted survey (English version)

Appendix B
Survey results tables
1) What do you fell in this moment (results).
| Question | Number of Answers | Standard Grade | Value (* ) |
| Really hot | 16 | 2 | 32.00 |
| Hot | 5 | 3 | 15.00 |
| Neutral | 26 | 0 | 0 |
| Warm | 7 | 1 | 7.00 |
| A bit cold | 1 | -1 | 1.00 |
| Cold | 0 | -2 | 0 |
| Really cold | 0 | -3 | 0 |
| Total | 55 | 53 | |
| TSV (**) | +0.97 | ||
| (*) equal to (n.answer) x (standard grade) (**) equal to (Total value)/(Total number of answer). | |||
2) How would you prefer the environment at this moment (results).
| Question | Number of Answers | Standard Grade | Value (* ) |
| Colder | 1 | −2 | −2.00 |
| A little bit warmer | 5 | 1 | 5.00 |
| A little bit colder | 15 | −1 | −15.00 |
| As it is | 34 | 0 | 0 |
| Warmer | 0 | 2 | 0 |
| Total | 55 | −12.00 | |
| TSV (**) | −0.22 | ||
| (*) equal to (n.answer) x (standard grade) (**) equal to (Total value)/(Total number of answer). | |||
3) In your opinion. how is the air quality? (smells. etc…) (results)
| Question | Number of Answers | Standard Grade | Value(*) |
| Good | 20 | 1 | 20.00 |
| Discrete | 22 | 2 | 44.00 |
| Unbearable | 2 | 3 | 6.00 |
| Perfect | 10 | 0 | 0 |
| Total | 55 | 70 | |
| Result (**) | +1.27 | ||
| (*) equal to (n.answer) x (standard grade) (**) equal to (Total value)/(Total number of answer). | |||
4) In your opinion. how is the lighting in this room? (results)
| Question | Number of Answers | Standard Grade | Value(*) |
| Too dark | 2 | -2 | −4.00 |
| Well illuminated | 34 | 0 | 0 |
| Slightly dark | 10 | -1 | −10.00 |
| Too bright | 8 | 2 | 16.00 |
| Total | 55 | 2 | |
| Result (**) | +0.04 | ||
| (*) equal to (n.answer) x (standard grade) (**) equal to (Total value)/(Total number of answer). | |||
3 bis) From 1 (bad smell) to 5 (no smell. good) which grade would you give to this room? (results).
| Question | Number of Answers | Standard Grade | Value(* ) |
| 0 (no answer) | 2 | 0 | 0 |
| 1 (bad smell) | 0 | 1 | 0 |
| 2 | 5 | 2 | 10.00 |
| 3 | 19 | 3 | 57.00 |
| 4 | 17 | 4 | 68.00 |
| 5 (no smell. good) | 11 | 5 | 55.00 |
| Total | 55 | 190.00 | |
| Result (**) | +3.45 | ||
| (*) equal to (n.answer) x (standard grade) (**) equal to (Total value)/(Total number of answer). | |||
4 bis). From 1 (dark) to 5 (too bright ) which grade would you give to this room? (results)
| Question | Number of Answers | Standard Grade | Value(* ) |
| 0 (no answer) | 1 | 0 | 0 |
| 1 (dark) | 0 | 1 | 0 |
| 2 | 6 | 2 | 12.00 |
| 3 (neutral) | 25 | 3 | 75.00 |
| 4 | 19 | 4 | 76.00 |
| 5 (too bright) | 4 | 5 | 20.00 |
| Total | 55 | 183 | |
| Result (**) | +3.33 | ||
| (*) equal to (n.answer) x (standard grade) (**) equal to (Total value)/(Total number of answer). | |||
Appendix C
Following ISO 8996 par.7.1.2 “Determination of metabolic rate from oxygen consumption rate”

Considering RQ = 0.85, it derives that EE = 5.68, and for an hypothetical normal person (pregnant women) 1.6 m tall, 55 kg weight ADU = 1.56 m2 and considering 200 ml/min (week 0 equal to 13.5 l/h) e 250 ml/min (week 38 equal to 15 l/h)
It is obtained that M is:
| (week 0) | M | 48.05 | W/m2 |
| (week 38) | M | 54.60 | W/m2 |
so met is equal to:
| (week 0) | met | 0.83 |
| (week 38) | met | 0.94 |
These results are quite different from the observed ones during the study where met is obtained starting from the analysis of thermal sensation (TSV). This discrepancy confirms the need to put more attention towards this very specific field.
References
- Gagge, A.P. The Linearity Criterion as Applied to Partitional Calorimetry. Am. J. Physiol. 1936, 31, 656–668. [Google Scholar] [CrossRef]
- ASHRAE. ASHRAE 55 Thermal Environmental Conditions for Human Occupancy; ASHRAE: Atlanta, GA, USA, 2010. [Google Scholar]
- ISO. ISO 7730 Ergonomics of the Thermal Environment—Analytical Determination and Interpretation of Thermal Comfort Using Calculation of the PMV and PPD Indices and Local Thermal Comfort Criteria; ISO: Geneva, Switzerland, 2005. [Google Scholar]
- Rupp, R.F.; Vásquez, N.G.; Lamberts, R. A review of human thermal comfort in the built environment. Energy Build. 2015, 105, 178–205. [Google Scholar] [CrossRef]
- Fabbri, K. Indoor Thermal Comfort Perception; Springer International Publishing: Cham, Switzerland, 2015; ISBN 978-3-319-18650-4. [Google Scholar]
- Djamila, H. Indoor thermal comfort predictions: Selected issues and trends. Renew. Sustain. Energy Rev. 2017, 74, 569–580. [Google Scholar] [CrossRef]
- Olesen, B.W.; Parsons, K.C. Introduction to thermal comfort standards and to the proposed new version of EN ISO 7730. Energy Build. 2002, 34, 537–548. [Google Scholar] [CrossRef]
- Karjalainen, S. Gender differences in thermal comfort and use of thermostats in everyday thermal environments. Build. Environ. 2007, 42, 1594–1603. [Google Scholar] [CrossRef]
- Zhe, Y.; Lin, B.; Ghahramani, A.; de Dear, R.; He, Y.; Luo, M.; Wang, Z. Individual difference in thermal comfort: A literature review. Build. Environ. 2018, 138, 181–193. [Google Scholar]
- Soebarto, V.; Zhang, H.; Schiavon, S. A thermal comfort environmental chamber study of older and younger people. Build. Environ. 2019, 155, 1–14. [Google Scholar] [CrossRef]
- Schellen, L.; van Marken Lichtenbelt, W.D.; Loomans, M.G.L.C.; Frijns, A.J.H. Thermal comfort, physiological responses and performance during exposure to a moderate temperature drift. In Proceedings of the Healthy Buildings 2009, Syracuse, NY, USA, 13–17 September 2009; pp. 17–22. [Google Scholar]
- Havenith, G. Temperature regulation and technology. Gerontechnology 2008, 1, 41–49. [Google Scholar] [CrossRef]
- Huisman, E.R.C.M.; Morales, E.; van Hoof, J.; Kort, H.S.M. Healing environment: A review of the impact of physical environmental factors on users. Build. Environ. 2012, 58, 70–80. [Google Scholar] [CrossRef]
- Parsons, K.C. The effects of gender, acclimation state, the opportunity to adjust clothing and physical disability on requirements for thermal comfort. Energy Build. 2002, 34, 593–599. [Google Scholar] [CrossRef]
- Fabbri, K. Thermal comfort evaluation in kindergarten: PMV and PPD measurement through datalogger and questionnaire. Build. Environ. 2013, 68, 202–214. [Google Scholar] [CrossRef]
- Salonen, H.; Kurnitski, J.; Kosonen, R.; Hellgren, U.; Lappalainen, S. The effects of the thermal environment on occupants’ responses in health care facilities: A literature review. In Proceedings of the 9th International Conference on Indoor Air Quality, Ventilation & Energy Conservation in Buildings (IAQVEC2016), Songdo, Korea, 23–26 October2016. [Google Scholar]
- Skoog, J.; Fransson, N.; Jagemar, L. Thermal environment in Swedish hospitals: Summer and winter measurements. Energy Build. 2005, 37, 872–877. [Google Scholar] [CrossRef]
- Van Gaever, R.; Jacobs, V.A.; Diltoer, M.; Peeters, L.; Vanlanduit, S. Thermal comfort of the surgical staff in the operating room. Build. Environ. 2014, 81, 37–41. [Google Scholar] [CrossRef]
- Hwang, R.L.; Lin, T.P.; Cheng, M.J.; Chien, J.H. Patient thermal comfort requirement for hospital environments in Taiwan. Build. Environ. 2007, 42, 2980–2987. [Google Scholar] [CrossRef]
- San José-Alonso, J.; Velasco-Gomez, E.; Rey-Martínez, F.; Alvarez-Guerra, M.; Gallego Peláez, C. Study on environmental quality of a surgical block. Energy Build. 1999, 29, 179–187. [Google Scholar] [CrossRef]
- Balaras, C.A.; Dascalaki, E.; Gaglia, A. HVAC and indoor thermal conditions in hospital operating rooms. Energy Build. 2007, 39, 454–470. [Google Scholar] [CrossRef]
- Dascalaki, E.G.; Gaglia, A.G.; Balaras, C.A.; Lagoudi, A. Indoor environmental quality in Hellenic hospital operating rooms. Energy Build. 2009, 41, 551–560. [Google Scholar] [CrossRef]
- Melhado, M.; Hensen, J.L.M.; Loomans, M. Literature review of staff thermal comfort and patient “thermal risks” in operating rooms. In Proceedings of the 8th International Conference and Exhibition on Healthy Buildings 2006, Lisboa, Portugal, 4–8 June 2006; pp. 11–14. [Google Scholar]
- Derks, M.T.H.; Mishra, A.K.; Loomans, M.G.L.C.; Kort, H.S.M. Understanding thermal comfort perception of nurses in a hospital ward work environment. Build. Environ. 2018, 140, 119–127. [Google Scholar] [CrossRef]
- Ormandy, D.; Ezratty, V. Health and thermal comfort: From WHO guidance to housing strategies. Energy Policy 2012, 49, 116–121. [Google Scholar] [CrossRef]
- Lan, L.; Tushar, W.; Otto, K.; Yuen, C.; Wood, K.L. Thermal comfort improvement of naturally ventilated patient wards in Singapore. Energy Build. 2017, 154, 499–512. [Google Scholar] [CrossRef]
- Czarniecki, W.; Kopacz, M.; Okołowicz, W.; Gajewski, J.; Grzedziński, E. Investigations of the microclimate in hospital wards. Energy Build. 1991, 16, 727–733. [Google Scholar] [CrossRef]
- Khalid, W.; Zaki, S.A.; Rijal, H.B.; Yakub, F. Investigation of comfort temperature and thermal adaptation for patients and visitors in Malaysian hospitals. Energy Build. 2019, 183, 484–499. [Google Scholar] [CrossRef]
- Nicol, F.; Humphreys, M.; Roaf, S. Adaptive Thermal Comfort: Principles and Practice; Routledge: London, UK, 2012; pp. 1–175. [Google Scholar]
- Needelman, J.; Kurtzman, E.T.; Kizer, K.W. Performance measurement of nursing care. Med. Care Res. Rev. 2007, 64, 10S–43S. [Google Scholar] [CrossRef] [PubMed]
- Wang, J.; Wang, Z.; de Dear, R.; Luo, M.; Ghahramani, A.; Lin, B. The uncertainty of subjective thermal comfort measurement. Energy Build. 2018, 181, 38–49. [Google Scholar] [CrossRef]
- Kim, J.; Schiavon, S.; Brager, G. Personal comfort models—A new paradigm in thermal comfort for occupant-centric environmental control. Build. Environ. 2018, 132, 114–124. [Google Scholar] [CrossRef]
- Khodakarami, J.; Nasrollahi, N. Thermal comfort in hospitals – A literature review. Renew. Sustain. Energy Rev. 2012, 16, 4071–4077. [Google Scholar] [CrossRef]
- Smith, R.M.; Rae, A. Patient comfort and radiant ceiling heating in a hospital ward. Build. Environ. 1977, 12, 143–146. [Google Scholar] [CrossRef]
- Sattayakorn, S.; Ichinose, M.; Sasaki, R. Clarifying thermal comfort of healthcare occupants in tropical region: A case of indoor environment in Thai hospitals. Energy Build. 2017, 149, 45–57. [Google Scholar] [CrossRef]
- Verheyen, J.; Theys, N.; Allonsius, L.; Descamps, F. Thermal comfort of patients: Objective and subjective measurements in patient rooms of a Belgian healthcare facility. Build. Environ. 2011, 46, 1195–1204. [Google Scholar] [CrossRef]
- Pantavou, K.; Theoharatos, G.; Mavrakis, A.; Santamouris, M. Evaluating thermal comfort conditions and health responses during an extremely hot summer in Athens. Build. Environ. 2011, 46, 339–344. [Google Scholar] [CrossRef]
- Del Ferraro, S.; Iavicoli, S.; Russo, S.; Molinaro, V. A field study on thermal comfort in an Italian hospital considering differences in gender and age. Appl. Ergon. 2015, 50, 177–184. [Google Scholar] [CrossRef] [PubMed]
- De Giuli, V.; Zecchin, R.; Salmaso, L.; Corain, L.; De Carli, M. Measured and perceived indoor environmental quality: Padua Hospital case study. Build. Environ. 2013, 59, 211–226. [Google Scholar] [CrossRef]
- Ho, S.H.; Rosario, L.; Rahman, M.M. Three-dimensional analysis for hospital operating room thermal comfort and contaminant removal. Appl. Therm. Eng. 2009, 29, 2080–2092. [Google Scholar] [CrossRef]
- De Dear, R.J.; Brager, G.; Cooper, D. Developing an Adaptive Model of Thermal Comfort and Preference. ASHRAE Trans. 1998, 104, 1–18. [Google Scholar]
- Morgan, C.; de Dear, R. Weather, clothing and thermal adaptation to indoor climate. Clim. Res. 2003, 24, 267–284. [Google Scholar] [CrossRef]
- Luo, M.; de Dear, R.; Ji, W.; Bin, C.; Lin, B.; Ouyang, Q.; Zhu, Y. The dynamics of thermal comfort expectations: The problem, challenge and impication. Build. Environ. 2016, 95, 322–329. [Google Scholar] [CrossRef]
- Nicol, F.; Stevenson, F. Adaptive comfort in an unpredictable world. Build. Res. Inf. 2013, 41, 255–258. [Google Scholar] [CrossRef]
- Humphreys, M.A.; Rijal, H.B.; Nicol, J.F. Updating the adaptive relation between climate and comfort indoors; new insights and an extended database. Build. Environ. 2013, 63, 40–55. [Google Scholar] [CrossRef]
- Yang, L.; Yan, H.; Lam, J.C. Thermal comfort and building energy consumption implications—A review. Appl. Energy 2014, 115, 164–173. [Google Scholar] [CrossRef]
- Bond, M.A.; Probert, S.D. Energy thrift and thermal comfort in public houses. Appl. Energy 1999, 62, 1–65. [Google Scholar] [CrossRef]
- Jung, W.; Jazizadeh, F. Human-in-the-loop HVAC operations: A quantitative review on occupancy, comfort, and energy-efficiency dimensions. Appl. Energy 2019, 239, 1471–1508. [Google Scholar] [CrossRef]
- Korkas, C.D.; Baldi, S.; Michailidis, I.; Kosmatopoulos, E.B. Intelligent energy and thermal comfort management in grid-connected microgrids with heterogeneous occupancy schedule. Appl. Energy 2015, 149, 194–203. [Google Scholar] [CrossRef]
- Buratti, C.; Ricciardi, P.; Vergoni, M. HVAC systems testing and check: A simplified model to predict thermal comfort conditions in moderate environments. Appl. Energy 2013, 104, 117–127. [Google Scholar] [CrossRef]
- Buratti, C.; Palladino, D.; Ricciardi, P. Application of a new 13-value thermal comfort scale to moderate environments. Appl. Energy 2016, 180, 859–866. [Google Scholar] [CrossRef]
- Jazizadeh, F.; Jung, W. Personalized thermal comfort inference using RGB video images for distributed HVAC control. Appl. Energy 2018, 220, 829–841. [Google Scholar] [CrossRef]
- Zhang, S.; Cheng, Y.; Fang, Z.; Huan, C.; Lin, Z. Optimization of room air temperature in stratum-ventilated rooms for both thermal comfort and energy saving. Appl. Energy 2017, 204, 420–431. [Google Scholar] [CrossRef]
- Tang, R.; Wang, S. Model predictive control for thermal energy storage and thermal comfort optimization of building demand response in smart grids. Appl. Energy 2019, 242, 873–882. [Google Scholar] [CrossRef]
- Chaudhuri, T.; Soh, Y.C.; Li, H.; Xie, L. A feedforward neural network based indoor-climate control framework for thermal comfort and energy saving in buildings. Appl. Energy 2019, 248, 44–53. [Google Scholar] [CrossRef]
- Uǧursal, A.; Culp, C.H. The effect of temperature, metabolic rate and dynamic localized airflow on thermal comfort. Appl. Energy 2013, 111, 64–73. [Google Scholar] [CrossRef]
- ISO. ISO 10551, Ergonomics of the Thermal Environment—Assessment of the Influence of the Thermal Environment Using Subjective Judgement Scales; ISO: Geneva, Switzerland, 2019. [Google Scholar]
- Fabi, V.; Andersen, R.K.; Corgnati, S. Accounting for the Uncertainty Related to Building Occupants with Regards to Visual Comfort: A Literature Survey on Drivers and Models. Buildings 2016, 6, 5. [Google Scholar] [CrossRef]
- Martinez-Molina, A.; Boarin, P.; Tort-Ausina, I.; Vivancos, J.L. Assessing visitors’ thermal comfort in historic museum buildings: Results from a Post-Occupancy Evaluation on a case study. Build. Environ. 2018, 132, 291–302. [Google Scholar] [CrossRef]
- Dili, A.S.; Naseer, M.A.; Varghese, T.Z. Thermal comfort study of Kerala traditional residential buildings based on questionnaire survey among occupants of traditional and modern buildings. Energy Build. 2010, 42, 2139–2150. [Google Scholar] [CrossRef]
- Healy, J.D.; Clinch, J.P. Fuel poverty, thermal comfort and occupancy: Results of a national household-survey in Ireland. Appl. Energy 2002, 73, 329–343. [Google Scholar] [CrossRef]
- Fabbri, K. How to use online surveys to understand human behaviour concerning window opening in terms of building energy performance. Adv. Build. Energy Res. 2015, 1–27. [Google Scholar] [CrossRef]
- Fabbri, K.; Boeri, A. IAQ evaluation in kindergarten: The Italian case of Asilo Diana. Adv. Build. Energy Res. 2014, 8, 241–258. [Google Scholar] [CrossRef]
- Köppen, W.; Geiger, R. Das Geographische System der Klimate. Handb. Klimatol. 1936, 1, 7–30. [Google Scholar]
- Kottek, M.; Grieser, J.; Beck, C.; Rudolf, B.; Rubel, F. World map of the Koppen- Geiger climate classification updated. Meteorol. Z. 2006, 15, 259–263. [Google Scholar] [CrossRef]
- ARPAE Emilia Romagna. Available online: http://www.smr.arpa.emr.it/dext3r/ (accessed on 25 August 2019).
- Nicol, F. Adaptive thermal comfort standards in the hot-humid tropics. Energy Build. 2004, 36, 628–637. [Google Scholar] [CrossRef]
- Song, Y.; Sun, Y.; Luo, S.; Hou, J.; Kim, J.; Parkinson, T.; De Dear, R. Indoor environment and adaptive thermal comfort models in residential buildings in Tianjin, China. Procedia Eng. 2017, 205, 1627–1634. [Google Scholar] [CrossRef]
- Coley, D.; Herrera, M.; Fosas, D.; Liu, C.; Vellei, M. Probabilistic adaptive thermal comfort for resilient design. Build. Environ. 2017, 123, 109–118. [Google Scholar] [CrossRef]
- Zaki, S.A.; Damiati, S.A.; Rijal, H.B.; Hagishima, A.; Abd Razak, A. Adaptive thermal comfort in university classrooms in Malaysia and Japan. Build. Environ. 2017, 122, 294–306. [Google Scholar] [CrossRef]
- Carlucci, S.; Bai, L.; de Dear, R.; Yang, L. Review of adaptive thermal comfort models in built environmental regulatory documents. Build. Environ. 2018, 137, 73–89. [Google Scholar] [CrossRef]
- Butte, N.F.; Wong, W.W.; Treuth, M.S.; Ellis, K.J.; Smith, E.O.B. Energy requirements during pregnancy based on total energy expenditure and energy deposition. Am. J. Clin. Nutr. 2004, 79, 1078–1087. [Google Scholar] [CrossRef] [PubMed]
- Liu, C.; Zhou, G.; Li, H. Analysis of Thermal Environment in a Hospital Operating Room. Procedia Eng. 2015, 121, 735–742. [Google Scholar] [CrossRef]
- ISO. EN ISO 7726 Ergonomics of the Thermal Environment - Instruments for Measuring Physical Quantities; ISO: Geneva, Switzerland, 2001. [Google Scholar]
- D’Ambrosio Alfano, F.R.; Palella, B.I.; Riccio, G. The role of measurement accuracy on the thermal environment assessment by means of PMV index. Build. Environ. 2011, 46, 1361–1369. [Google Scholar] [CrossRef]
- ISO. ISO 8996 Ergonomics of the Thermal Environment Determination of Metabolic Rate; ISO: Geneva, Switzerland, 2005. [Google Scholar]
- Crume, T.L.; Shapiro, A.L.; Brinton, J.T.; Glueck, D.H.; Martinez, M.; Kohn, M.; Harrod, C.; Friedman, J.E.; Dabelea, D. Maternal fuels and metabolic measures during pregnancy and neonatal body composition: The healthy start study. J. Clin. Endocrinol. Metab. 2015, 100, 1672–1680. [Google Scholar] [CrossRef]
- Piers, L.S.; Diggavi, S.N.; Thangam, S.; Van Raaij, J.M.A.; Shetty, P.S.; Hautvast, J.G.A.J. Changes in energy expenditure, anthropometry, and energy intake during the course of pregnancy and lactation in well-nourished Indian women. Am. J. Clin. Nutr. 1995, 61, 501–513. [Google Scholar] [CrossRef]
- Lawrence, M.; Singh, J.; Lawrence, F.; Whitehead, R.G. The energy cost of common daily activities in African women: Increased expenditure in pregnancy? Am. J. Clin. Nutr. 1985, 42, 753–763. [Google Scholar] [CrossRef]
- Humphreys, M.A.; Fergus Nicol, J. The validity of ISO-PMV for predicting comfort votes in every-day thermal environments. Energy Build. 2002, 34, 667–684. [Google Scholar] [CrossRef]
- Humphreys, M.A.; Fergus Nicol, J.; Luo, M.; Wang, Z.; Ke, K.; Cao, B.; Zhai, Y.; Zhou, X. Human metabolic rate and thermal comfort in buildings: The problem and challenge. Build. Environ. 2002, 131, 44–52. [Google Scholar]
- d’Ambrosio Alfano, F.R.; Olesen, B.W.; Palella, B.I. Povl Ole Fanger’s impact ten years later. Energy Build. 2017, 152, 243–249. [Google Scholar] [CrossRef]
© 2019 by the authors. Licensee MDPI, Basel, Switzerland. This article is an open access article distributed under the terms and conditions of the Creative Commons Attribution (CC BY) license (http://creativecommons.org/licenses/by/4.0/).