1. Introduction
Guarantee is an important way to solve the financing problem of companies. A good guarantee system can improve the credit rating of companies and enhance their financing ability. However, non-standard guarantee behavior can also worsen the financial status of the company and even harm the local economic environment. Since the chain reaction of China’s “Fujian Guarantee Circle” in 2000, the guarantee network risk has always been a hot issue of concern to the government and companies. The negative “Domino” effect caused by it not only endangers the local financial ecology, but also forms regional financial risk, which will even spread across regions and pose a huge threat to the Chinese economy. In 2011, Zhengzhou Chengtai and Shengwo guarantee events caused capital chain rupture in a number of enterprises in Henan, and the chain reaction caused Henan to fall into guarantee crisis. In 2012, Zhongdan Company fraudulently defrauded SME (small- and medium-size enterprise) loans. The risk broke out at the beginning of the year and the “Domino” effect affected up to 294 enterprises, with the amount of obligation close to 1.3 billion yuan. In the second half of 2012, the risk of steel trade had concentrated exposure, and the bad debts reached 40 billion, with credit crisis spreading to the surrounding areas. In 2014, executives of Huitong guarantee, the largest private guarantee company in Sichuan, escaped with money, causing 5 billion funds to be implicated. Enterprises and banks in the guarantee network are facing huge risks. Ma, Zhang and Liu (2009) show that the risk of the guarantee circle originates from the “guarantee warranty,” which is intensified by the “default information” of the enterprise and the “group response” of the bank’s debt recovery, finally triggering the crisis of the guarantee circle [
1]. Aleksiejuk (2001) and Angelini (2004) found that loans or credits between banks are widespread around the world [
2,
3]. According to the directed penetration model, the large amount of inter-bank credits can lead to penetration phase change characterized by bank bankruptcy expansion to the entire bank network. Upper and Worms (2004) also found that credit risk associated with interbank loans may lead to a “Domino” effect [
4].
With the rapid development of China’s economy, the number of guarantee networks formed by corporate debt financing has also increased year by year. The distribution of guarantee networks in China’s provinces obtained through the guarantee data of CSMAR (China Stock Market & Accounting Research) database is shown in
Figure 1. It can be found from
Figure 1 that there are obvious spatial differences in the number of China’s guarantee networks. Where, Beijing, the Yangtze River Delta, and Guangdong have the largest number of guarantee networks. Once the guarantee network risk breaks out, successive insurance-removal of enterprises will follow, banks will compete for loan collection, the trust between banks and enterprises will drop sharply, and the regional financial ecology will be damaged, which will cause an adverse impact on the development of the real economy [
5].
Compared with China, the developed market economy countries in Europe and the United States have more diversified financing channels, and quite different legal and regulatory environments from China. Therefore, there is no prevalence of mutual guarantee loans between enterprises. China’s guarantee network has also become a relatively unique phenomenon in the international credit market. At present, Chinese scholars’ research on the factors affecting guarantee network risk mainly covers social capital [
6], guarantee model [
7] and institutional environment [
8] and so on. However, there are not many studies on guarantee network risk in foreign countries, mainly focusing on credit default risk contagion [
9,
10,
11,
12,
13]. The research in these aspects carries certain reference value.
Seen from the existing research, there are many studies on the risk of interbank network in the world and abundant referential studies on credit default risk contagion. However, the research on the risk of corporate guarantee network is insufficient. Due to the limitation of research perspective, the exploration of its influencing factors is still limited. As there lacks exploration of the influencing factors from the spatial and temporal perspectives, the applicability of existing intelligent algorithms in the identification of risk factors for guarantee networks is still controversial, and the accuracy of identification of risk factors for guarantee networks needs to be improved. Based on the necessity of choosing an appropriate technique and the requirements of high accuracy for methodology applications, we decided to study the internal and external factors of the formation of China’s guarantee network from the perspective of spatial and temporal differences and wanted to better identify the risks of China’s guarantee network by selecting appropriate intelligent identification algorithm. At the same time, a prediction accuracy test is performed on the logistic regression modelling after the selected sample training, which will provide more valuable references for the management layer of the listed companies, banks and governments to control guarantee network risks.
Compared with the existing research, the contributions of this paper include two aspects. Firstly, a logistic regression algorithm is used to explore the spatial and temporal differences of the risk factors of guarantee network in China. Secondly, based on the characteristics of Chinese regional economic development, the logistic regression algorithm is discussed in the differences of risk identification accuracy of guarantee network respectively from the national, eastern, central and western spatial dimension. Our work will help governments, banks and listed companies in different regions of China to identify and prevent the risks of guarantee network better.
2. Literature Review
2.1. Formation of Guarantee Network Risk
Currently, most of the existing research is carried out from the external environment and internal factors of the risk of the guarantee network.
From the perspective of external environment, Liu and Cao (2016) [
14] pointed out that local government’s performance pursuit and financial market reform and profit-seeking behavior of company shareholders are important causes of formation of risk of the guarantee circle. Jian (2012) [
15] found that in areas with rapid economic growth, imperfect banking systems and low levels of legal implementation, it is easier for companies to form guarantee circles and then risk of guarantee circles spreads. Wan and Wei (2009) [
8] found that the defects of the financial system and excessive financing needs of major shareholders are the reasons for the formation of the risk of guarantee circle. In terms of information dissemination, Yang and Hu (2006) [
16] pointed out that SME credit guarantees are more prone to problems under asymmetric information. Bester (1987) [
17] also found that the credit market needs a certain structure to reach balance in the case of incomplete information. Wang and Cai (2005) [
18] found that China used the guarantee of “central bank”—hidden government guarantee institutions to reduce the possible financial risks. Li and Lin (2017) [
19] pointed out that macro environment has a significant impact on China’s credit guarantee industry, but the scale, experience and potential compensation risk are the most important indicators to measure ability or performance of individual credit guarantee companies. Qian and Strahan (2007) [
20] found that the decisive factors for banks to sign loans include the degree of legal protection, the rights of creditors and whether there are guarantee institutions.
Seen from internal factors, Zhang and Yang (2013) [
21] analyzed from the external environment that the amount of external guarantees and the amount of loans affected the formation of corporate risks In terms of corporate behavior, Cleary (1999) [
22] found that companies with higher credit ratings are more cautious about investment behavior than companies with lower credit ratings. Berkman (2009) [
23] found that the possibility of guarantee is less likely for companies with smaller scale and higher profits. Li (2018) [
24] pointed out that the collateral value of the enterprise will determine the quality of the guarantee circle. Once one or more enterprises have credit defaults, the enterprises that guarantee them will have a debt crisis, which will even cause a snowball effect. Berger and Udell (2002) [
25] found that in the process of bank and corporate lending, banks need a large amount of corporate information provided by intermediary information agencies, and once the company information is wrong, the guarantee behavior will bring risk. Liu and Liu (2017) [
26] found that the formation of parent-subsidiary guarantees is more aimed at improving the company’s own financing capabilities and obtaining more financial support. Liu, Zhang and Zhang (2013) [
27] considered there are four influencing factors in SME group financing: basic situation of entrepreneurs, the credit status of enterprises, years of existence of the enterprises, and the degree of cooperation between clustered SMEs. Leng et al. (2016) [
7] found that the impact of the company’s leverage ratio and profitability on the company’s guarantee behavior takes the threshold value as the boundary, and company exhibits different behavioral characteristics on both sides of the threshold value. Feng (2005) [
28] found that most of the guarantee behaviors are based on well-known relationships. Therefore, the more scientific method is to observe and analyze the incentives of guarantee behavior from the internal management structure of the enterprise.
For a more intuitive understanding of risk factors, we summarizy the guarantee network risk factors in
Table 1.
The above literature indicates that researchers focus on the risk factors of the guarantee network from an internal or external perspective rather than an overall perspective. At the same time, due to China’s unique large-scale guarantee network, the economic development level of different regions also results in big differences in the number of guarantee networks, so spatial factor is an important factor influencing the risk of the guarantee network. In addition, in the past 10 years, China’s economy has developed rapidly, and the corporate financing environment has also changed over time. However, the existing literature rarely considers the evolution of the guarantee network risk factors brought by the time factor. In view of this, this study will comprehensively consider the influence of spatial and temporal differences, and combine internal financial characteristics of the enterprise and the external environmental differences to analyze the risk factors of the guarantee network in detail. Only in this way can the regional positioning and risk control of the guarantee network risk be accurately carried out.
2.2. Comparison of Risk Identification Methods
At present, the mainstream risk of identification intelligent algorithms include neural network, support vector machine, decision tree, k-nearest neighbor algorithm, etc. The applicable risks, advantages and disadvantages are shown in
Table 2.
2.3. Application of Logistic Regression Algorithm
Logistic regression is also called log probability regression. The algorithm is a binary classification algorithm that expresses the probability of an event occurring in the form of a conditional probability distribution, i.e., P(Y|X). Here X is an n-dimensional vector, and the value of Y is 0 or 1, indicating whether this event occurs or not. To make the output result in form of two values, we use logistic function. The function form is as follows:
Then, construct a linear boundary function with the following form:
Based on the above two functions, building a prediction function:
Therefore, the probability of event occurrence (i.e., Y = 1) is , and the probability that the event does not occur is .
Finally, using the maximum likelihood method to estimate the parameters into to discriminate. In the discrimination, if is greater than 0.5, the event is considered to have occurred, and vice versa.
Despite the widespread use of the logistic approach, it is used less to identify guarantee network risk factors. In this study we chose logistic method as an effective means to identify the risk factors of the guarantee network. Compared with other methods, it has the following advantages:
(1) Logistic regression is mainly used for risk prediction and is applicable to the prediction of the future development status and level of the market. It is in line with the subject we are exploring: the identification of risk factors affecting the guarantee network. Jiang and Sun (2001) [
38] used logistic regression method to study the impact of weakened corporate governance identified by the four indicators on the formation of financial crisis. Zhu and Pan (2015) [
39] selected 17 secondary indicators to establish an evaluation model for financial risk of SMEs, and tested validity of the model using logistic regression. Wu and Ying (2013) [
40] used logistic method-based model to predict the amount of customer loss at different stages of the life cycle and thus reduce the company’s customer loss risk.
(2) Logistic regression can use a hypothesis testing tool to distinguish the significance and relative importance of variables, and there are multiple distribution hypotheses. Zhou and Ma (2005) [
41] used logistic to study the impact of the company’s shareholding structure and company regional distribution on the probability of statement correction in the event of major financial problems. Cheng and Wen (2016) [
42] compared various binary selection models such as Probit, Logistic and Extreme Value models from the perspective of model prediction accuracy and fitness to screen out the best method for calculating default degree.
(3) The logistic regression model has two values for dichotomous dependent variable, that is, the dependent variable. The nonlinear classification statistical method often used in the analysis is suitable for studying whether enterprises of different provinces, cities and years are included in the guarantee network. When investigating the default probability of customers, Yu and Zhan (2004) [
43] established a regression model based on logistic to predict the probability of default and redefine the independent variables as a set of linear combinations.
(4) At the same time, logistic regression is a quite practical algorithm with a wide application range, such as in medical aspects. Pedersen et al. (2018) [
44] used logical regression to examine the association between hydrochlorothiazide use and the risk for MCC (Merkel Cell Carcinoma) and MAST (Malignant Adnexal Skin Tumors). For public health, Berry et al. (2018) [
45] used logistic regression to study the relationship between e-cigarettes and smoking cessation. For urban planning, Liu Hui et al. (2017) [
46] used logistic regression to study the delineation of resource-exhausted urban growth boundaries, and so on. It can be seen that the application of logistic regression has a wide range.
Based on the data characteristics in identification of risk factors of the guarantee network, logistic regression model is a suitable method for identifying risk factors. Therefore, this study is based on financial indicators of listed companies in 31 provinces, municipalities and autonomous regions (excluding Hong Kong, Macau and Taiwan) and the economic development level of each province in 2008–2017 to identify risk factors of sustainable guarantee network from spatial and temporal scales.
3. Variable Selection, Model Framework and Data Source
3.1. Variable Selection
In this study the influencing factors were divided into two different levels: the internal financial level and the external economic level.
First, the internal financial factors of the company were divided into variables of five different dimensions: the company’s profitability, solvency, operational capability, development capability and the correlation between executives and the company. These five variables were used to characterize the impact effect of the company. These five variables are specifically expressed as follows:
(1) Profitability of the company: by referring to Yu and Zhou (2013) [
47], the company’s return on assets (ROA) is used to characterize the enterprise’s profitability. A higher return on assets of the company means the company has better profitability. The calculation formula for ROA is:
(2) The company’s solvency: by referring to Feng et al. (2016) [
48], the company’s debt asset ratio is used to describe profitability of the company. A higher debt asset ratio of the company means the company has worse solvency. The formula for calculating the debt asset ratio is:
(3) The company’s operational capability: by referring to Chen (2017) [
49], the company’s total assets turnover is used to describe the operational capability of the company. A higher total assets turnover means better operational capability of the company. The formula for calculating the total assets turnover is:
(4) The enterprise’s development capability: by referring to Qi (2008) [
50], net profit growth rate of the enterprise is used to describe the development capability of the enterprise. A greater net profit growth rate means stronger development capability of the enterprise. The formula for calculating net profit growth rate is:
(5) The degree of correlation between executives and the company: this study characterizes the degree of correlation between executives and the company based on whether executives receive salary. The dummy variable P is introduced. When P is equal to 0, it means that the executive does not receive salary, and the degree of correlation between the executive and the company is considered to be low. When P is equal to 1, the executive is paid, and the correlation between the executive and the company is considered to be high.
In addition, for the impact of external economic factors, we used GDP (Gross Domestic Product) of the province where the company is located (unit: 100 million yuan) to characterize the level of regional economic development [
51], and then examined the external factors that affect the company’s accession to the guarantee network.
3.2. Model Framework
A logistic regression model was constructed by comprehensively considering the impact of the above six variables on the company’s guarantee network. Where, considering the delay in decision of the listed company, that is, the listed company only observes the situation of the previous year in the decision-making, this study performed regression of the explanatory variables after a period of delay, so the model is expressed as:
where
β1~
β6 are the regression coefficients of each variable;
β0 indicates the intercept term;
yit represents whether the
i-th company is in the guarantee network at the
t-th year. If so, 1 is taken, if not, then 0;
ROAit−1,
DARit−1,
TATit−1,
NPGRit−1 represent the return on assets, debt asset ratio, total assets turnover and net profit growth rate of the
i-th company in the
t − 1 year;
GDPit−1 represents the
GDP of the
i-th company in the
t − 1 year;
Pit−1 represents the dummy variable.
3.3. Data Source
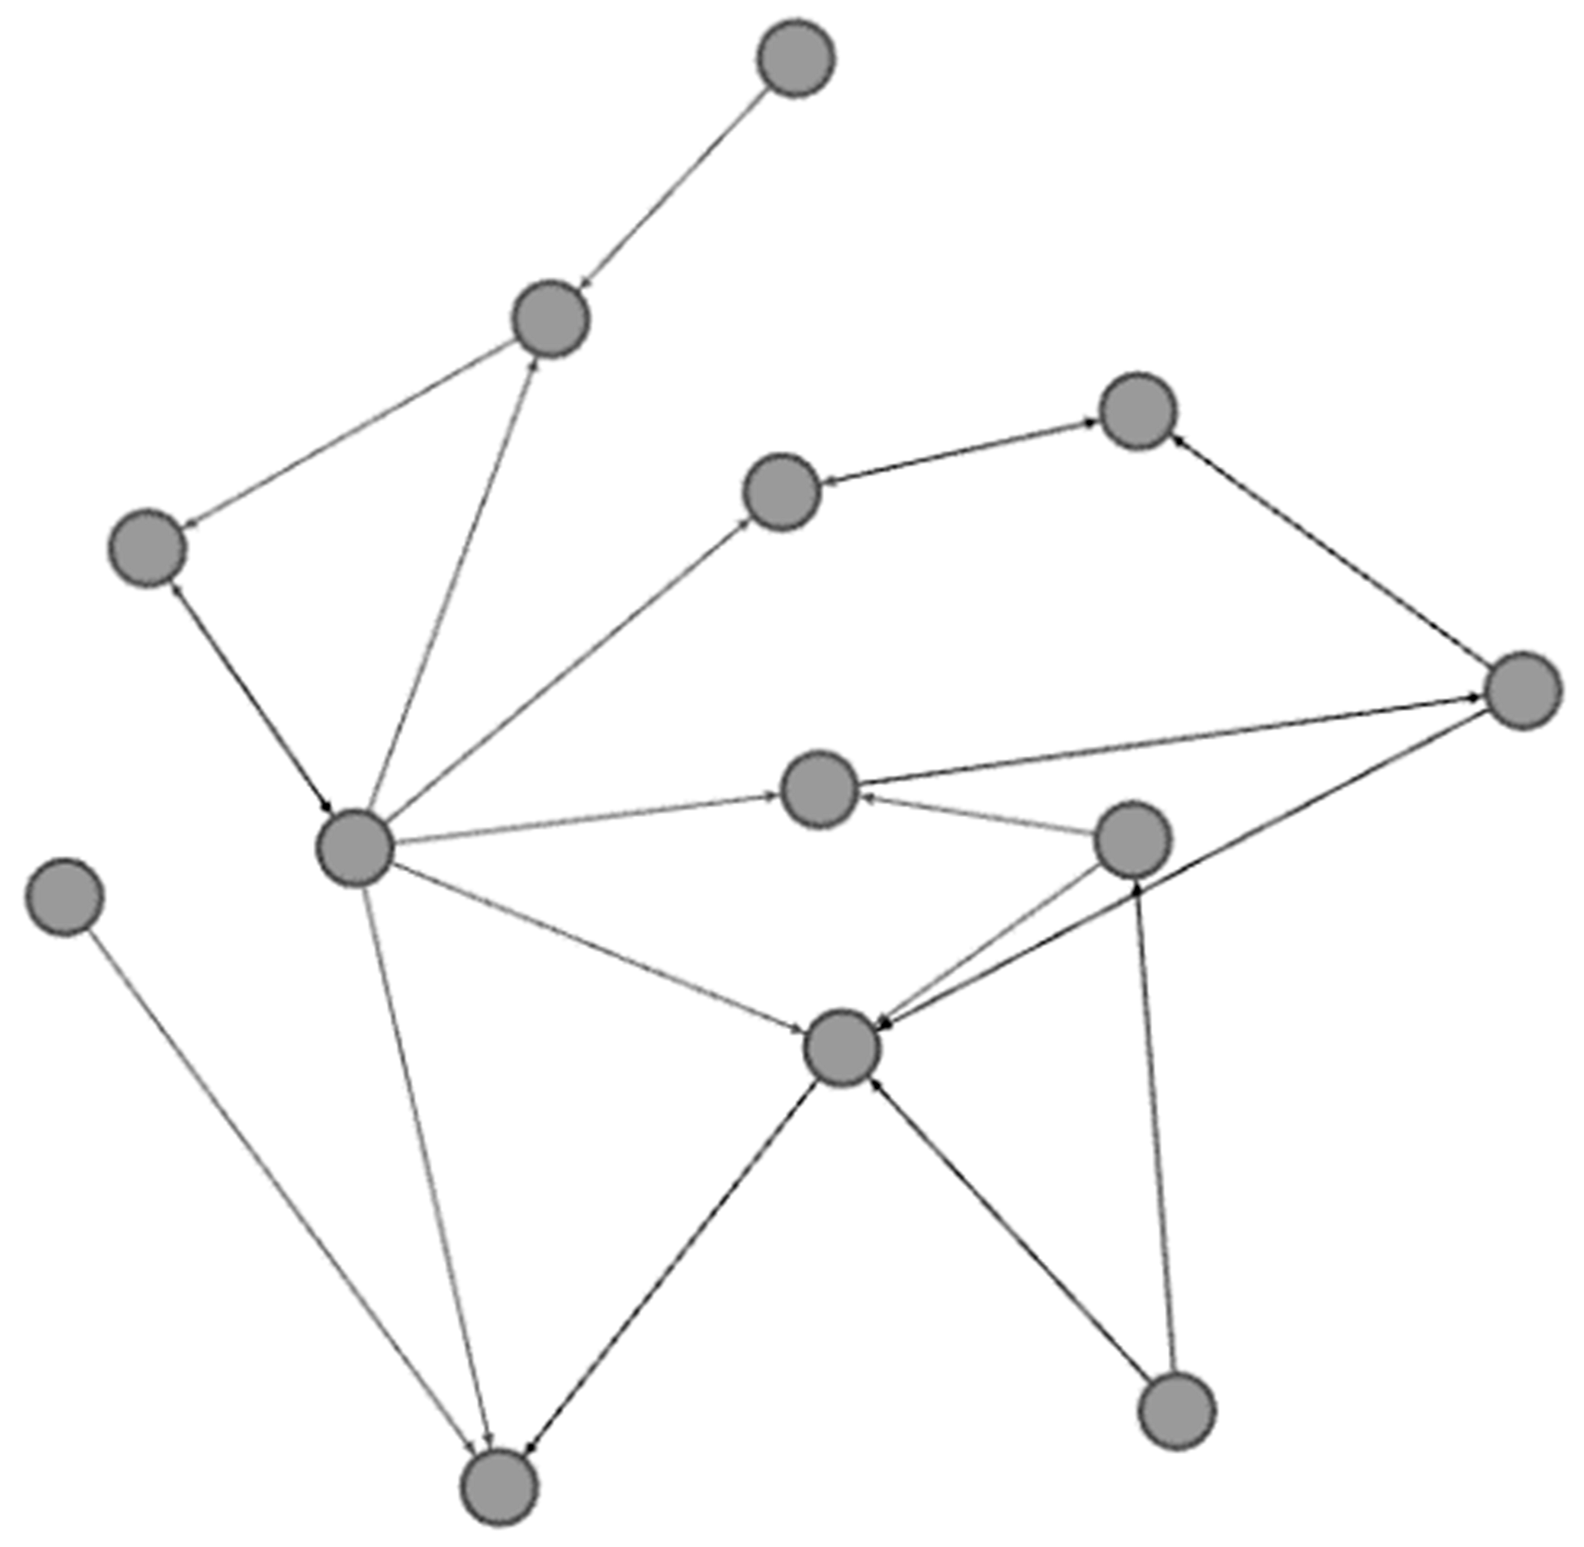
The data in this study is panel data of listed companies during 2008–2017. The data covers 31 provinces, municipalities and autonomous regions in China (excluding Hong Kong, Macau and Taiwan). The return on assets, debt asset ratio, total assets turnover, net profit growth rate and whether the company executives receive salary are all from the CSMAR database; the original data of the guarantee network also derives from the CSMAR database. The annual guarantees of each listed company are found in the database, and a guarantee network is constructed according to the guarantee. As shown in
Figure 2, it is a schematic diagram of a guarantee network. The points in the figure represent each company. The company pointed to by the arrow in the figure is the company being guaranteed. It can be seen that the guarantee network is a very complicated network structure. The annual GDP of each province in each year comes from the National Data Website of the National Bureau of Statistics of the People’s Republic of China.
The study obtained data from 648 listed companies nationwide during the 10 years from 2008 to 2017. There was a total of 6480 data from various provinces, municipalities and autonomous regions. The analysis software for this study was Stata13.
4. Research Results
4.1. Analysis of the Number of Guarantee Networks of Listed Companies in China
First, descriptive statistics were undertaken on the number of guarantees of listed companies, and the statistics of the number of guarantee networks of listed companies in China from 2008 to 2017 were obtained, as shown in
Table 3.
According to
Table 3, from a national perspective, it can be found that the number of guarantee networks of listed companies has increased rapidly between 2008 and 2017, from 257 in 2008 to 4947 in 2017, and the average annual growth rate has reached 38.90%. However, the growth rate in recent years has been declining. The growth rate in 2013–2017 is 59.43% lower than that in 2008–2013, but there is still a growth rate of 21.56%. It can be seen that the phenomenon of guarantee network is very severe among Chinese listed companies.
From the eastern perspective, since the eastern region is China’s area with the best economic development and the fastest growing speed, and its economic activities are very active, the number of guarantee networks in the east is the highest among the three regions regardless of year 2008 or 2017, which accounts for more than 50% of the country. Although the east has a lower growth rate than the central region, we believe that because the number of guarantee networks in the east has reached 172 by 2008, the base is large, which leads to a lower growth rate than the central region. It can be seen that the guarantee phenomenon of listed companies in the eastern region is the most serious, which is highly probable to form complex and dense guarantee circles, and the risk of large-scale companies’ bankruptcy due to implication is relatively huge.
From the central perspective, although the number of guarantee networks of listed companies in the central region was only 40 in 2008, it reached 850 by 2017, with an average annual growth rate of 40.44%, exceeding the national average growth rate and being the highest growth rate among the three regions. Additionally, it can be found that the average annual growth rate of the central region in 2013–2017 still reaches 21.35%. We believe that the reason for this phenomenon may be that the country has accelerated the development of the central region in recent years, and intensified efforts to improve the overall economic strength and level of the central region. Moreover, it can be found that the central region has experienced a significant increase in the level of economic development in recent years, which has also led to aggravated phenomenon of guarantee among listed companies. It can be seen that for the central region, although the current number of guarantees is not as large as that of the eastern region, if the constraints are not tightened to slow down the trend of growth, increased risks will be eventually inevitable.
From the western perspective, since the western region has a relatively backward development level compared to the eastern and central regions, the number of guarantee networks of listed companies in the region is less than that in the eastern region, and the growth rate is also lower than that in the central region. The number grows from 45 in 2008 to 886 in 2017, with an average annual growth rate of merely 38.90%. In addition, the average annual growth rate from 2013 to 2017 is only 21.15%, which is the lowest among the three regions. It can be been seen that guarantee phenomenon is not as serious as that in the east and the central region, but it still shows a fast-growing rate.
In summary, whether from a national perspective or from the perspective of the three regions of the eastern, central and western regions, the number of listed companies’ guarantee networks presents a trend of rapid improvement, and displays a very obvious regional difference. In terms of the number of guarantee networks, the eastern region has the highest number of guarantee networks, while the central region has the lowest number of guarantee networks. In terms of the growth rate of the number of guarantee networks, the central region has the highest growth rate, which is beyond the growth rate of the eastern region, while the western region has the lowest growth rate. Although growth rate in each region is slowing down, the central region slows down at a rate significantly slower than that of the eastern and western regions. As to what the cause of the above phenomenon and the formation of guarantee network is, we then undertook analyses from both spatial and temporal scales.
4.2. Temporal Scale Analysis on Guarantee Network of Listed Companies
We first analyzed the effect of various factors on the possibility of listed companies’ accession to the guarantee network based on temporal scale. The regression results are shown in
Table 4.
The results are only the results of the three variables of the listed company’s debt asset ratio, total assets turnover and GDP of the province in which it is located, while other variables (the company’s return on assets, whether executives receive salary and net profit growth rate) are not shown in the results considering its insignificance every year. The chi2 values of every year are all below the 1% significance level, so the annual regression results of every year are considered to be significantly effective.
According to the regression results, the company’s debt asset ratio and the number of guarantees of listed companies have a positive marginal effect in 2008–2017. That is, the company’s solvency has a reverse impact on the possibility of listed companies’ accession to the guarantee network. According to the regression results, it can be found that as the marginal effect increases with the increase of the year, and the impact gradually deepens from 0.0007047 in 2008 to 0.0020054 in 2017. It indicates that on the temporal scale, the company’s solvency has a reverse impact on the possibility of listed companies’ accession to the guarantee network, and this impact is gradually deepened with time.
The company’s total assets turnover is significant in 2008–2011 and 2015, and not significant in other years. At the same time, basically after 2008, the absolute z value of total assets turnover gets smaller and smaller over time, which indicates that the operating capacity of listed companies has a reverse impact on the possibility of joining the guarantee network, but this impact gradually disappears with time. The reason for this is that, with the reform of China’s economy, listed companies’ operating capacity is getting stronger and stronger in general, so the company’s total assets turnover is gradually no longer the basis for judging whether the listed company joins the guarantee network.
The GDP of the provinces where the listed companies are located is significant in 2011 and 2017, and is below the significance level of 1% in 2017. At the same time, it can be found that z value of GDP is gradually increasing with time, indicating that the GDP of the provinces where the listed companies are located has changed with time, and the impact on the possibility of listed companies’ accession to guarantee network is increasing. The reason may be that China’s overall GDP growth is very stable over time, which thus gradually becomes the basis for listed companies’ accession to guarantee network.
In general, the ability of the listed company’s total asset-liability ratio and the GDP of the province to influence the possibility of listed companies joining the guarantee network becomes stronger over time. The ability of the listed company’s total asset turnover rate to influence the possibility of listed companies joining the guarantee network becomes weaker over time. Therefore, with the change of time, when the listed company judges whether to join the guarantee network, it will take its own solvency and the economic level of the region into more consideration, while pay less attention to its operational capacity. In conclusion, when the government and banks monitor and judge the risks of guarantee network, they can strengthen the consideration of the solvency of listed companies and the regional economic capabilities, and weaken the consideration of the operating capabilities of listed companies.
4.3. Spatial Scale Analysis on Guarantee Network of Listed Companies
In addition to the analysis on the temporal scale, we also carried out logistic regression analysis of the country and the eastern, central and western regions on the spatial scale. The regression results obtained are shown in
Table 5. It can be seen from the table that most variables of the four models have significant z statistic values, and the significance level is relatively high. Moreover, chi2 values of each model are significant at the significance level of 1%. It shows that each model has high degree of fitting, indicating that from the four spatial scales of the country, eastern, central and western regions, the established model has a strong comprehensive explanation for the formation of the listed company guarantee network.
4.3.1. Regional Comparison
(1) From a national perspective, first, we analyzed the company’s own factors. Although the company’s net profit growth rate has a positive impact on the possibility of listed companies’ accession to the guarantee network, it is not significant and there is an insignificant impact on all eastern, central and western regions. Therefore, the company’s development ability is believed to have little impact on the possibilities of a companies’ accession to the guarantee network. The companies’ return on assets (ROA) has a positive impact on the companies’ possibilities of joining the guarantee network. The marginal effect of ROA is 0.0018622. That is, when the ROA is increased by 1%, the possibility of listed companies’ accession to the guarantee network will increase by 0.0018622 and pass the 5% significance level. It is believed that at the national scale, the companies’ profitability has a positive impact on the possibility of listed companies’ accession to guarantee network. The company’s solvency and operational capabilities passed the 1% significance test. It is believed that both have a strong impact on the formation of the guarantee network. Moreover, there is a positive relationship between the company’s debt asset ratio and the possibility of listed companies’ accession to the guarantee network. That is, solvency is inversely related to the latter. The company’s operational capability has an inverse relationship with the listed company’s accession to the guarantee network. The dummy variables of whether the company executives receive salary are not significant, indicating whether there is close relationship between the executives and the company will not affect whether the listed company join the guarantee network. Second, geographic factors were analyzed. The GDP of the provinces where the companies are located has a positive impact on whether the listed companies join the guarantee circle, and has passed the significance test at the 1% level. According to the marginal effect of GDP, when the GDP of the province where listed companies are located increases by 100 million yuan, the possibility of listed companies’ accession to the guarantee circle will increase by 0.00000201. The reason is that the improvement of the regional development level will make listed companies have more funds to guarantee other companies, thus are more accessible to the guarantee network.
(2) From the perspective of the eastern region, first, we analyzed the company’s own factors. The marginal effect of the companies’ return on assets (ROA) is greater than zero, but it did not pass the significance test. Therefore, in the eastern region, the profitability of listed companies has no influence on the possibility of listed companies’ accession to the guarantee circle. The companies’ solvency passed the 1% significance test, which, like the national scale, has a reverse impact on the possibility of listed companies’ accession to the guarantee circle. The company’s operational capability passed the 1% significance test, and, like the national scale, it also has a reverse impact on the possibility of listed companies’ accession to the guarantee circle. The dummy variables of whether the company executives receive salary are not significant. Therefore, whether the executives in the eastern region are closely related to the listed companies has no influence on the possibility of accession to the guarantee circle. Second, we analyzed the geographic factors. The GDP of the provinces where the companies are located has a positive impact on the possibility of listed companies’ accession to the guarantee circle, which is below the significance level of 1%. It suggests that when the GDP of the provinces is increased by 100 million yuan, the probability of listed companies’ accession to the guarantee network will increase by 0.00000307.
(3) From the perspective of the central region, first of all, we analyzed the company’s own factors. The companies’ return on assets (ROA) has a positive relationship with the companies’ possibility of joining the guarantee circle, but did not pass the test. Therefore, in the central region, the profitability of listed companies does not affect the possibility of listed companies’ accession to the guarantee circle. The company’s total assets turnover is below the significance level of 10%, indicating that in the central region, the operating capability of listed companies has an impact on the possibility of listed companies’ accession to the guarantee circle. The company’s debt asset ratio is below the significance level of 1%, and the marginal effect is greater than zero, so the solvency of listed companies is inversely related to the possibility of joining the guarantee network. Finally, the dummy variables of whether the company executives receive salary are not significant. Therefore, whether the executives in the central region are closely related to the listed companies does not affect the possibility of the companies’ accession to the guarantee circle. Second, we analyzed the geographic factors. In the central region, the GDP of the provinces where the companies are located is below the significance level of 1%, but its marginal effect is 0.00000525, which is larger than that in the national, eastern and western regions, indicating that geographical factors in the central region have great influence on the possibility of listed companies’ accession to the guarantee circle.
(4) From the perspective of the western region, first of all, we analyzed the company’s own factors. The companies’ return on assets (ROA) is not significant, so in the western region, the profitability of listed companies does not affect the possibility of listed companies’ accession to the guarantee circle. The company’s total assets turnover is below the significance level of 1%, indicating that in the western region, operating capacity of listed companies has an impact on their possibility of joining the guarantee network. The company’s debt asset ratio is below the significance level of 5%, indicating that the solvency of listed companies has an impact on their likelihood of joining the guarantee network. Finally, the dummy variable of whether the company executives receive salary is below the 5% significance level, and the marginal effect is less than zero, indicating that in the western region, whether the company executives are closely related to the company affects the companies’ possibilities of joining the guarantee network. Moreover, when the company’s executives have closer relationship with the company, the possibility of the company’s accession to the guarantee network will decline. The reason is that when the company executives are closely related to the company, their interests are highly linked to the company, and they will be cautious when deciding whether to guarantee, and will not easily join the guarantee network. Second, we analyzed the geographic factors. In the western region, the GDP of the provinces where the listed companies are located is below the significance level of 1%, which also indicates that geographical factors have a positive impact on the possibility of listed companies’ accession to the guarantee network.
4.3.2. Comparison of Indicators
At the level of the companies’ own factors, both companies’ solvency and operational capabilities have a reverse impact on their possibility of joining the guarantee network. The central region’s solvency has the greatest impact, and the western region’s operational capacity has the greatest impact. The companies’ development ability is not significant on these four scales; the companies’ profitability is significant across the country; and whether the company executives are closely related to the company gradually becomes significant as the region moves westward. On the geographical level, the GDP of the regions where listed companies are located passes the 1% significance level on four scales, showing the most prominent impact on the central region.
4.3.3. Comparison of Prediction Accuracy
According to Ashraf, Félix and Serrasqueiro (2019) [
52], in order to test the prediction accuracy of the logistic regression model obtained from the training of sample companies in various regions, data of 300 listed companies nationwide that did not join the regression (150 joined the guarantee network, 150 did not join the guarantee network) and 200 listed companies that did not join the regression in various regions (100 joined the guarantee network and 100 did not join the guarantee network) were obtained as prediction samples. The results of the prediction accuracy test are shown in
Table 6.
According to the results of the above table, when predicting the behavior of enterprises joining the guarantee network, the training model of the western sample enterprises has the highest prediction accuracy, and the prediction accuracy is the lowest in the central region. When predicting enterprises’ failure to join the guarantee network, the training model of the central sample enterprises has the highest prediction accuracy, while the prediction accuracy is the lowest in the eastern region. In addition, the accuracy of prediction results in all regions is above 70%, the total average accuracy rate is 81.22%, the average of the first type of error rate is 14.67%, and the average of the second type of error rate is 22.89%. The logistic regression model is believed to have a good predictive effect and high practicality for judging whether a listed company has the possibility of joining the guarantee network.
5. Discussion
(1) During the study period, the number of guarantee networks of listed companies in the country, eastern, central and western regions increased very rapidly, but the speed showed a slowdown. Where, the number of eastern guarantee companies is the largest, and the growth rate of the central part is the fastest. The reason is that the economic development in the central region has accelerated in recent years. In the past few years, the growth rate in the west has been the slowest, which is because the economic development level in the western region is relatively backward compared to the eastern and central regions.
(2) From the perspective of spatial scale, first of all, at the level of company’s own factors, company’s solvency and operational capacity have a reverse impact on their possibility of joining the guarantee network, and the significance level is at 1% except in the central region. The company development capabilities are not significant on all the four scales; the company profitability is significant across the country; and whether the company executives are closely related to the company gradually becomes significant as the region moves westward. On the geographical level, the GDP of the regions where listed companies are located pass the 1% significance level on four scales, but the impact on the central region is the most prominent. The reason may be that in recent years, China has paid more attention to the development of the central region. Therefore, listed companies in the central region will consider the GDP of their provinces more when considering whether to join the guarantee network.
(3) From the time scale, first of all, at the level of the company’s own factors, the solvency of listed companies has a reverse impact on the possibility of listed companies’ accession to the guarantee network, and this impact is increasing with the increase of years. The operating capacity of listed companies was significant in 2008–2011 and 2015, and insignificant in the remaining years. At the same time, as the years increased, the impact is gradually weakened; whether listed company executives are closely related to the company, profitability and development capacity of the company has no impact on their possibility of joining the guarantee network. At the geographic level, the GDP of the provinces where the listed companies are located has a positive impact on the possibility of listed companies’ accession to the guarantee network in 2011 and 2017. There is no impact in the remaining years, but the impact is gradually increasing over time.
6. Suggestions
First of all, due to the needs of China’s economic growth and the company’s needs for funds, the rising trend of the number of listed companies’ guarantee networks is difficult to change in a short period of time, but the government must control the rate of growth and shall not allow its growth rate to be further increased, otherwise it is easy to lead to large-scale corporate financial crisis and large-scale bankruptcy crisis.
Secondly, according to the results of this study, on the spatial scale, there is a positive relationship between the profitability of listed companies and their possibility of joining the guarantee network across the country. Therefore, if the government wants to control the growth in the number of guarantee networks and the expansion of guarantee risks, attention can be focused on those listed companies with better profitability, that is, listed companies with higher return on assets, to control the amount of guarantees and the risks of guarantees. Meanwhile, those companies with poor solvency must be effectively supervised. These companies are more likely to join the guarantee network, and the possibility of risk is also greater.
Finally, it is hoped that the government can improve the guarantee standards and procedures, not only binding the guarantee company, but also managing and examining the company applying for guarantee. The company applying for guarantee should be strictly investigated to reduce the risk of bad debts.
7. Conclusions
According to the above regression results, first, seen from the spatial scale:
(1) Nationally, the profitability, solvency and operational capability of listed companies are the factors influencing companies’ accession to the guarantee network. Listed companies with stronger profitability, weaker solvency and operational capability are easier to join the guarantee network. Meanwhile, greater risks will be faced due to weaker solvency and operational capability. The GDP of the provinces where the listed companies are located will also affect their accession to the guarantee network. The higher the GDP is, the more likely that the listed company will join the guarantee network.
(2) In the eastern region, the solvency and operational capability of listed companies are the factors influencing companies’ accession to the guarantee network, and the impact of the two is the same as that across the whole country. The GDP of the provinces where the listed companies are located will also affect companies’ accession to the guarantee network.
(3) In the central region, the solvency and operational capability of listed companies are the factors influencing companies’ accession to the guarantee network, and the impact of solvency and operational capacity is the same as that of the national region; the GDP of the provinces where the listed companies are located will also affect companies’ accession to the guarantee network.
(4) In the western region, the solvency and operational capability of listed companies and whether the listed company executives are closely related with the companies are the factors influencing companies’ accession to the guarantee network. The impact of solvency and operational capacity is the same as that in the eastern region. The closer the company’s executives are related with the company, the less likely that the companies will join the guarantee network. GDP of the provinces where the listed companies are located will also affect their accession to the guarantee network.
Therefore, from the spatial scale, on the whole, the factors influencing listed companies’ accession to the guarantee network include its profitability, solvency, operational capability and GDP of the provinces where it is located. Therefore, to control the risk of the guarantee network, attention can be focused on those listed companies with better profitability, poor solvency, poor operational capabilities and higher GDP in the provinces where they are located. These companies are more likely to join the guarantee network and have greater risks. For the central and western regions, attention should also be paid to those listed companies whose executives are not closely related with the companies. These companies are also more likely to join the guarantee network, thus posing greater risks.
Meanwhile, from the perspective of temporal scale, the solvency of listed companies and the GDP of the provinces where they are located are gradually becoming an important factor affecting listed companies’ accession to the guarantee network, while the operational capability has gradually reduced influence on listed companies’ accession to the guarantee network. Therefore, in the future, more attention should be paid to listed companies with weaker solvency and higher GDP in their provinces. These companies are increasingly likely to join the guarantee network and the risks will be increasingly higher.
The research in this paper also put forward aspects for further study. First, in terms of method, logistic regression can only solve the linearly separable two-classification problem. When considering the problem of nonlinearity, it will lead to the decrease of precision. Secondly, the research in this paper only judges whether the guarantee network risk will be formed. It fails to effectively judge the risk status of the formed guarantee network. Therefore, we hope to start from the aspect of evaluating the risk of guarantee network in the future. We want to evaluate the security network risk in a region, and prevent and resolve the risks more effectively.


