Assessment of Potentially Toxic Elements in Technosols by Tailings Derived from Pb–Zn–Ag Mining Activities at San Quintín (Ciudad Real, Spain): Some Insights into the Importance of Integral Studies to Evaluate Metal Contamination Pollution Hazards

 ,
,  , ,
, ,  ,
,
Abstract
1. Introduction
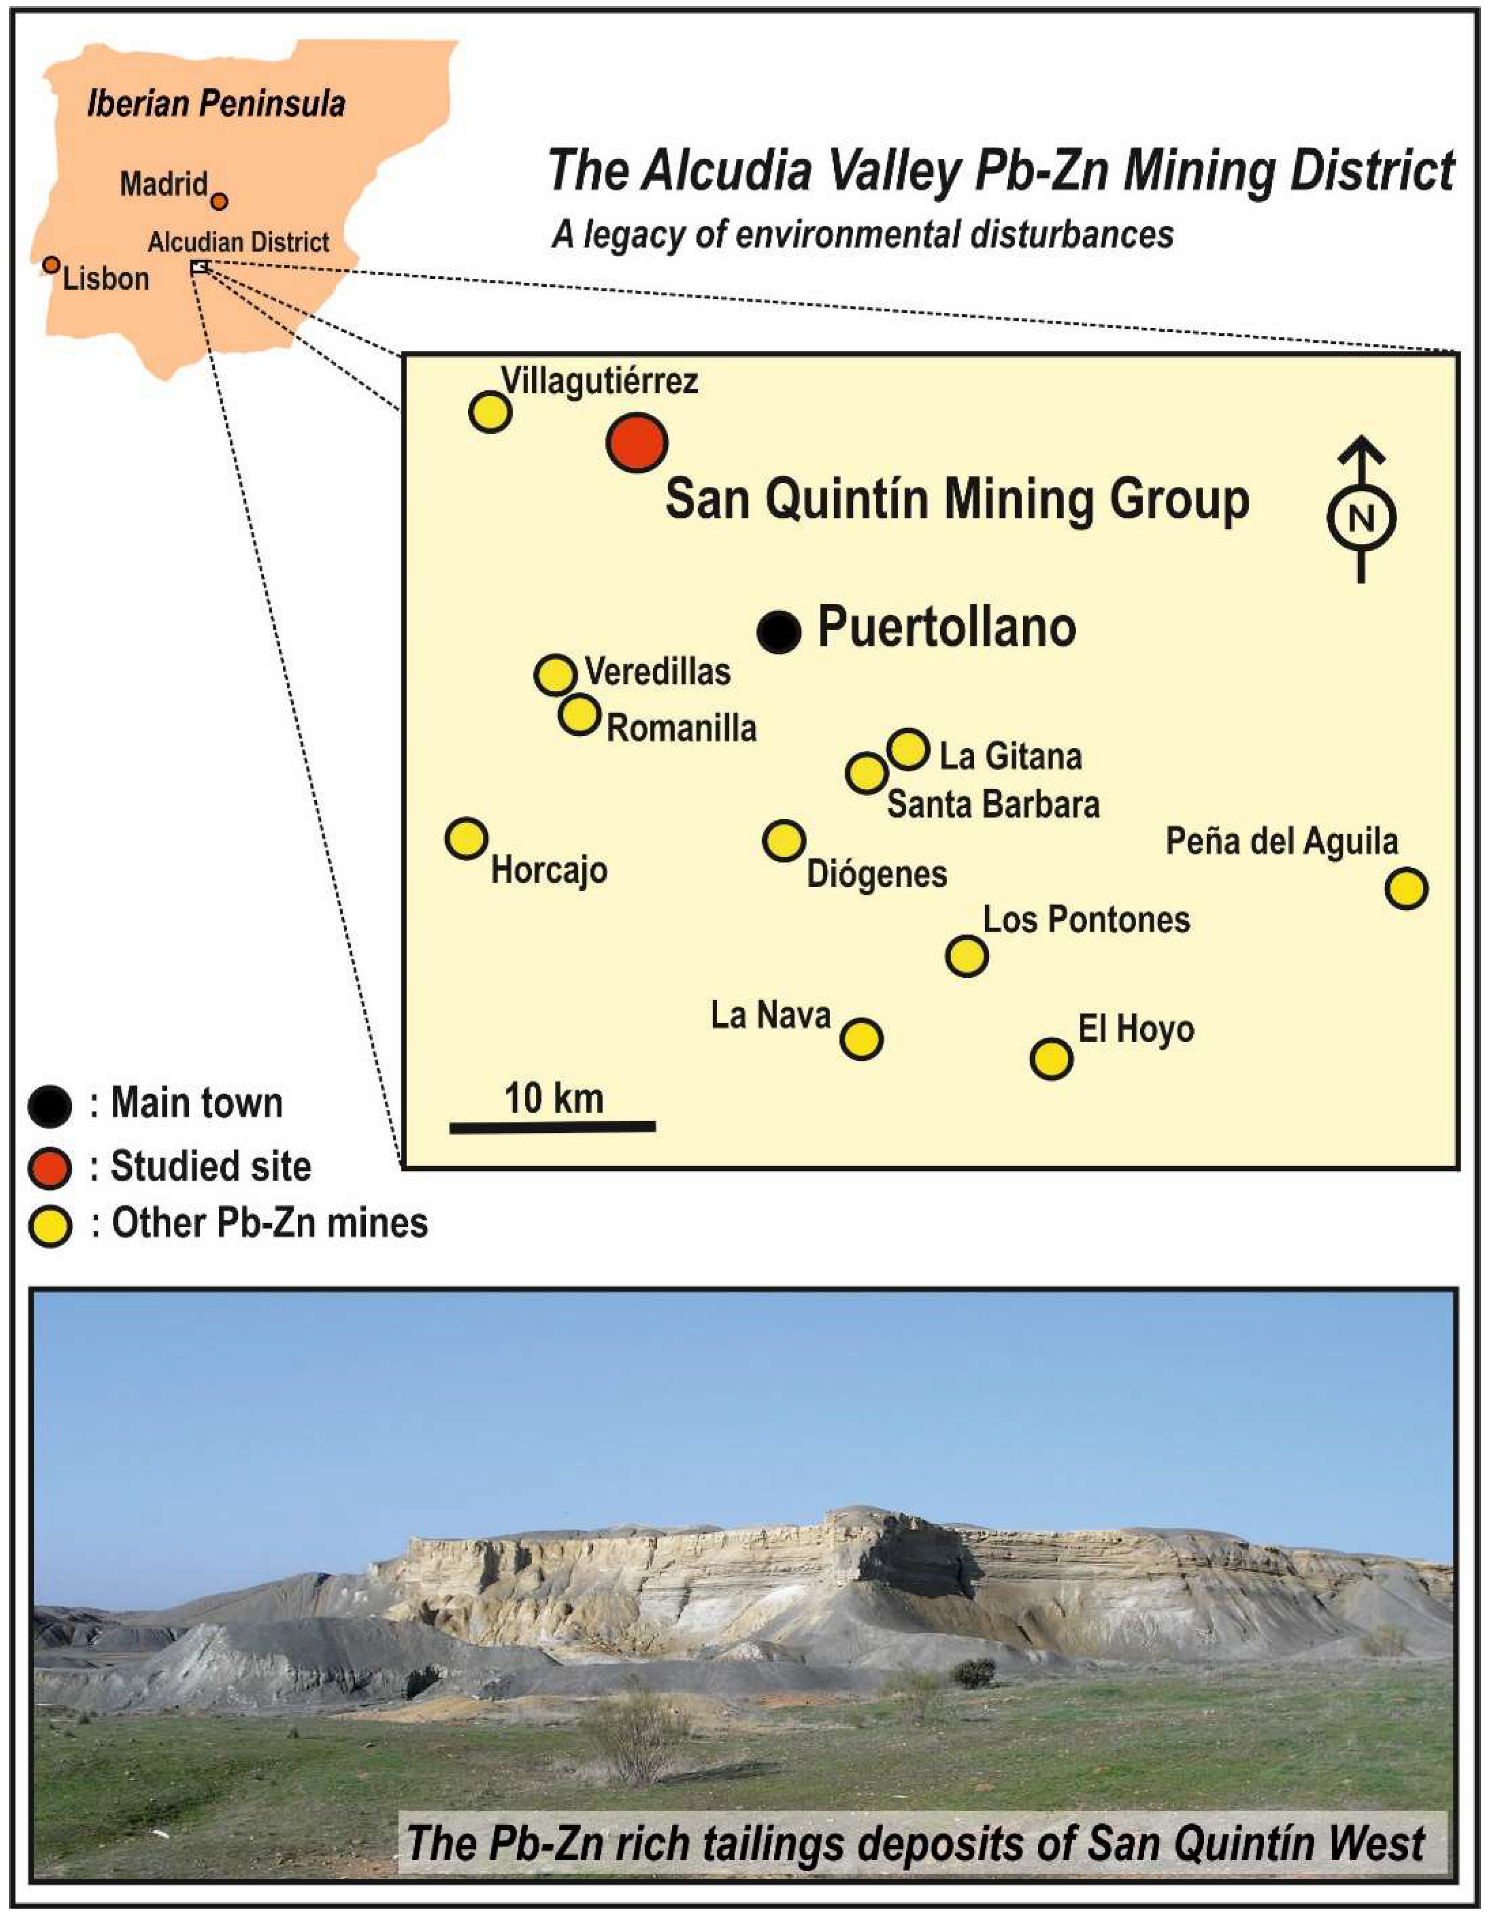
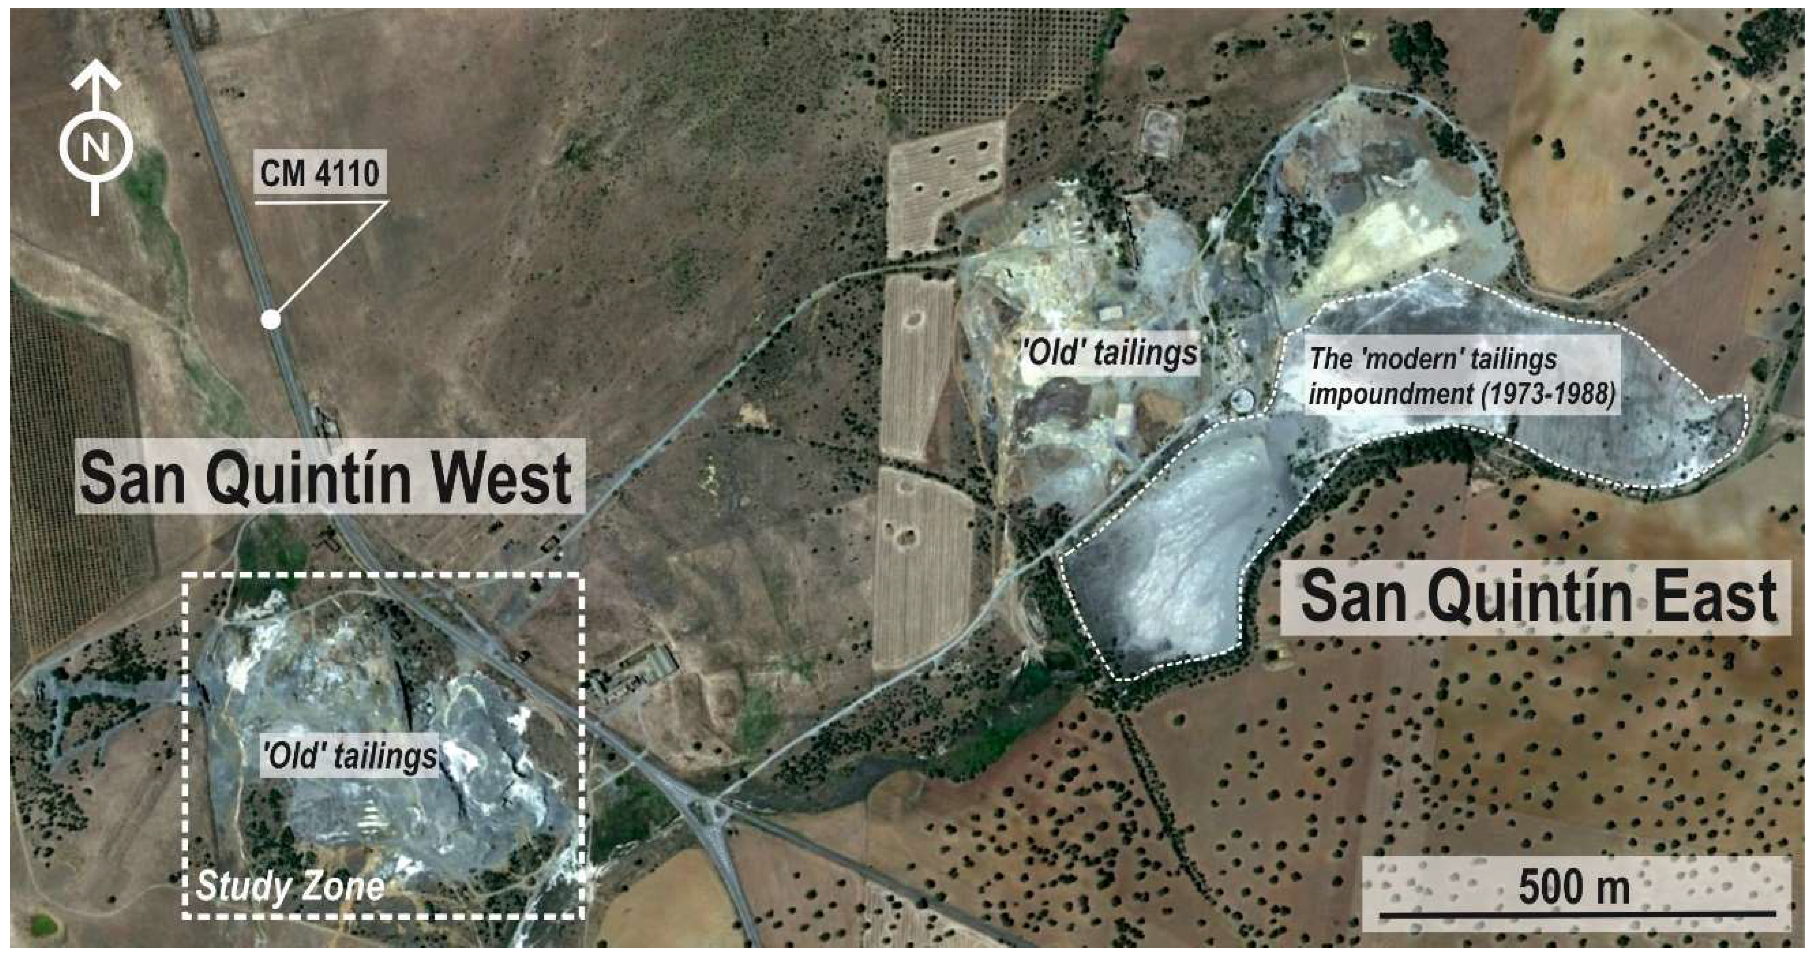
2. Studied Area
3. Sampling and Analysis
3.1. Sampling
3.2. Chemical and Mineralogical Analysis
3.3. Geochemical Indicators
3.4. Mobility of Potentially Toxic Elements (PTE)
3.5. Toxicity Tests
3.5.1. Seed Germination Bioassay
3.5.2. Ostracod Toxicity Test
3.6. Geostatistical Analysis
4. Results and Discussion
4.1. Mineralogy and Geochemistry of Soil Samples
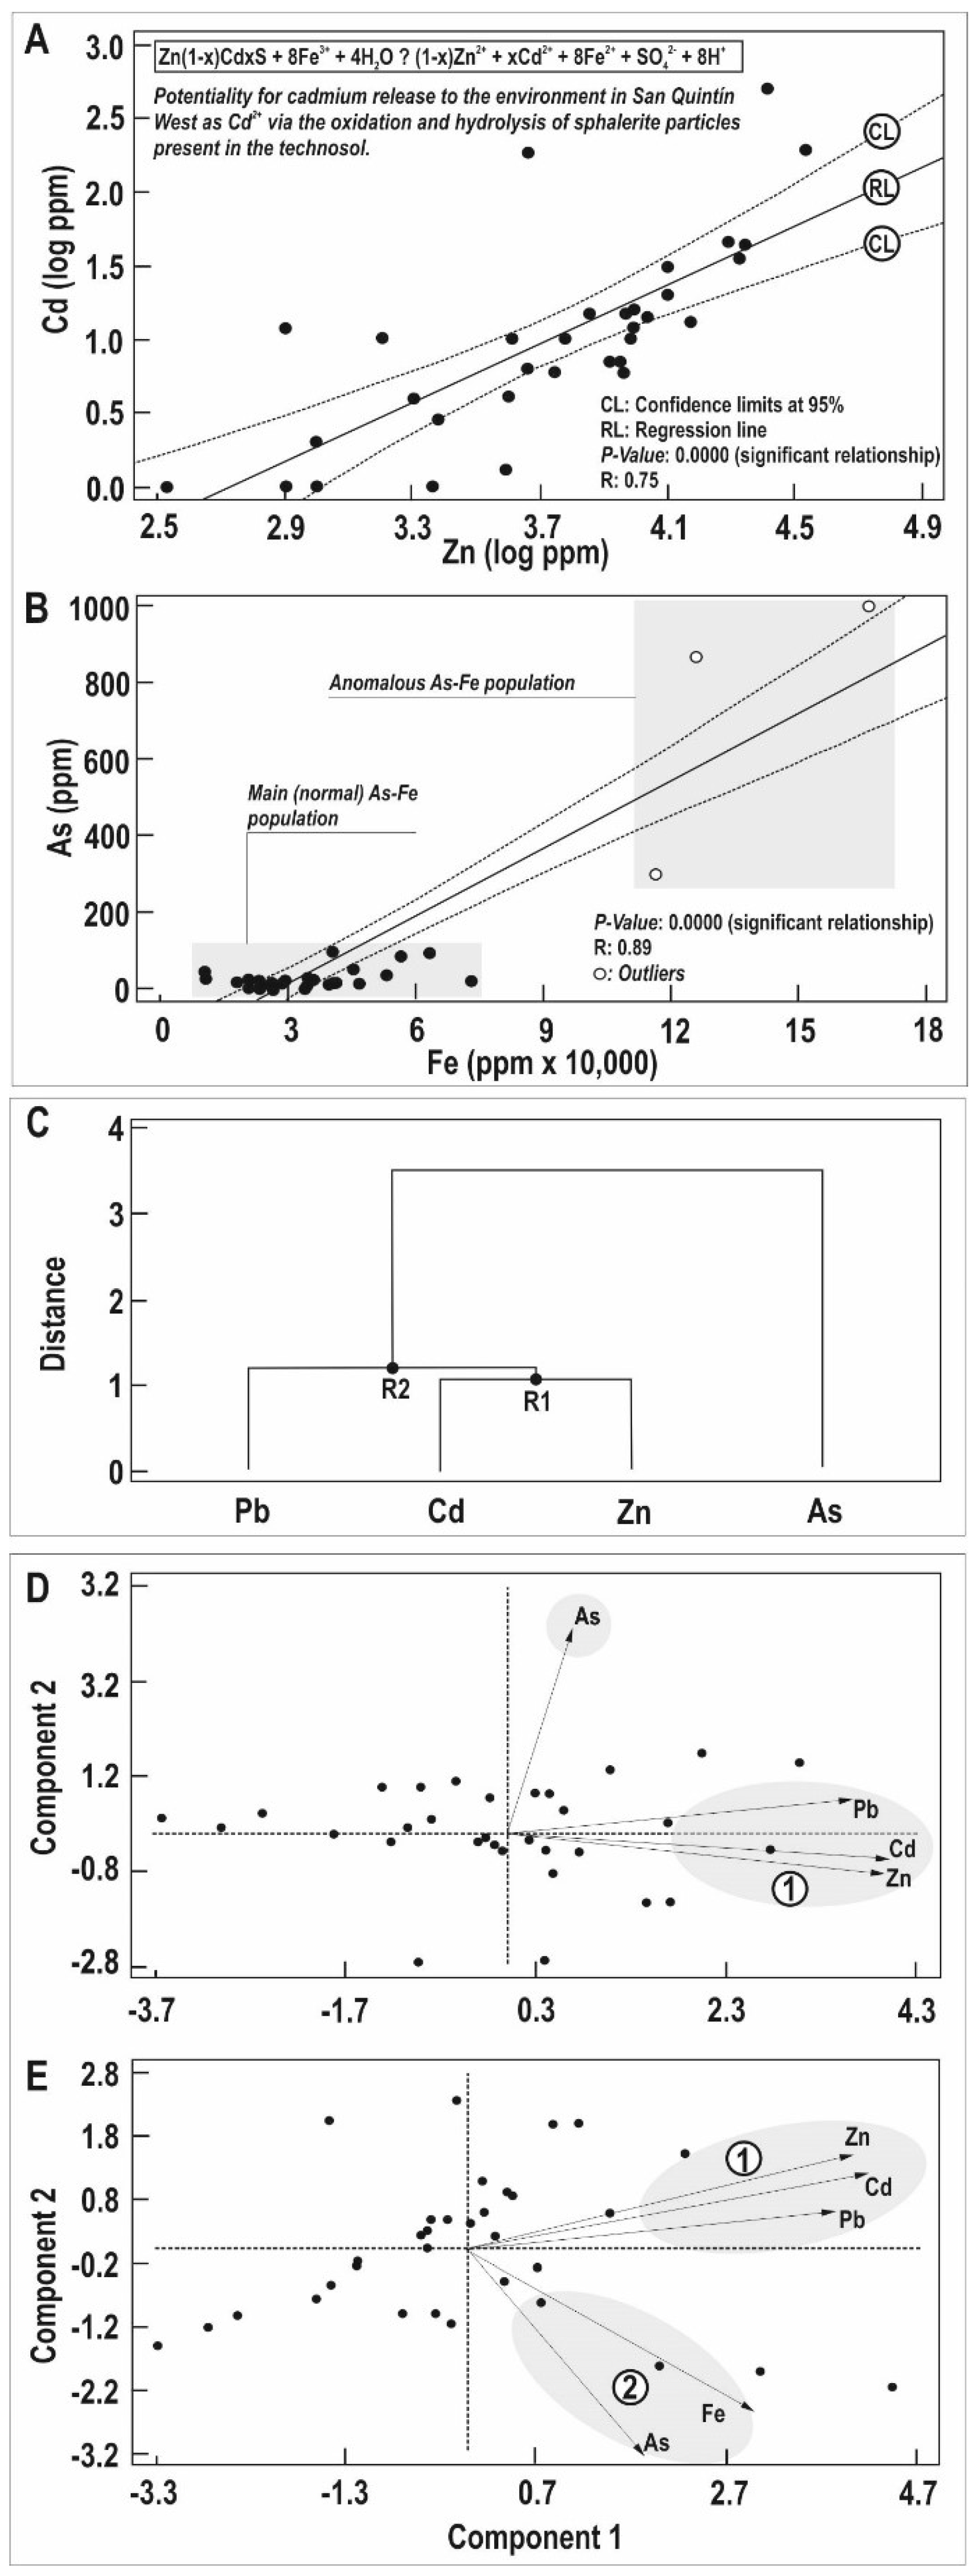
4.2. Mobility of PTEs
4.3. Bioassays Results
5. Conclusions
Author Contributions
Funding
Conflicts of Interest
References
- Castillo, S.; de la Rosa, J.; Sánchez de la Campa, J.D.; González-Castanedo, Y.; Fernández-Caliani, J.C.; González, I.; Romero, A. Contribution of mine wastes to atmospheric metal deposition in the surrounding area of an abandoned heavily polluted mining district (Rio Tinto mines, Spain). Sci. Total Environ. 2013, 449, 363–372. [Google Scholar] [CrossRef] [PubMed]
- Valente, T.M.; Leal Gomes, C.L. Occurrence, properties and pollution potential of environmental minerals in acid mine drainage. Sci. Total Environ. 2009, 407, 1135–1152. [Google Scholar] [CrossRef] [PubMed]
- Valente, T.M.; Antunes, M.; Braga, M.A.; Pamplona, J. Geochemistry and mineralogy of ochre-precipitates formed as waste products of passive mine water treatment. Geochem. Explor. Environ. Anal. 2011, 11, 103–106. [Google Scholar] [CrossRef]
- Adamo, P.; Denaix, L.; Terribile, F.; Zampella, M. Characterization of heavy metals in contaminated volcanic soils of the Solofrana river valley (southern Italy). Geoderma 2003, 117, 347–366. [Google Scholar] [CrossRef]
- Muller, G. Index of geoaccumulation in sediments of the Rhine River. Geojournal 1969, 2, 108–118. [Google Scholar]
- Covelli, S.; Fontolan, G. Application of a normalization procedure in determining regional geochemical baselines. Environ. Geol. 1997, 30, 34–45. [Google Scholar] [CrossRef]
- Tomlinson, D.L.; Wilson, J.G.; Harris, C.R.; Jeffrey, D.W. Problems in the assessments of heavy-metal levels in estuaries and formation of a pollution index. Helgol. Meeresunters. 1980, 33, 566–575. [Google Scholar] [CrossRef]
- García-Lorenzo, G.L.; Martínez-Sánchez, M.J.; Pérez-Sirvent, C.; Molina, J. Ecotoxicological evaluation for the screening of areas polluted by mining activities. Ecotoxicology 2009, 18, 1007–1086. [Google Scholar] [CrossRef]
- Rodríguez, L.; Ruiz, E.; Alonso-Azcárate, J.; Rincón, J. Heavy metal distribution and chemical speciation in tailings and soils around a Pb-Zn mine in Spain. J. Environ. Manag. 2009, 90, 1106–1116. [Google Scholar] [CrossRef]
- Martín-Crespo, T.; Gómez-Ortiz, D.; Martín-Velázquez, S.; Esbrí, J.M.; de Ignacio-San José, C.; Sánchez-García, M.J.; Montoya-Montes, I.; Martín-González, F. Abandoned mine tailings in cultural itineraries: Don Quixote Route (Spain). Eng. Geol. 2015, 197, 82–93. [Google Scholar] [CrossRef]
- Higueras, P.; Esbrí, J.M.; García-Ordiales, E.; González-Corrochano, B.; López-Berdonces, M.A.; García-Noguero, E.M.; Alonso-Azcárate, J.; Martínez-Coronado, A. Potentially harmful elements in soils and holm-oak trees (Quercus ilex L.) growing in mining sites at the Valle de Alcudia Pb-Zn district (Spain)—Some clues on plant metal uptake. J. Geochem. Explor. 2017, 182, 166–179. [Google Scholar] [CrossRef]
- Sánchez-Donoso, R.; Martín-Duque, J.F.; Crespo, E.; Higueras, P. Tailing’s geomorphology of the San Quintín mining site (Spain): Landform catalogue, aeolian erosion and environmental implications. Environ. Earth Sci. 2019, 78, 166. [Google Scholar] [CrossRef]
- Palero-Fernández, F.J.; Martín-Izard, A. Trace element contents in galena and sphalerite from ore deposits of the Alcudia Valley mineral field (Eastern Sierra Morena, Spain). J. Geochem. Explor. 2005, 86, 1–25. [Google Scholar] [CrossRef]
- Rossiter, D. Proposal for a New Reference Group for the World Reference Base for Soil Resources (WRB) 2006: The Technosols. 2005. Available online: http://citeseerx.ist.psu.edu/viewdoc/download;jsessionid=21FBCCD60158CCC50E3D86DCCEA3C5E4?doi=10.1.1.114.1742&rep=rep1&type=pdf (accessed on 5 June 2019).
- AENOR. Characterization of Waste. Leaching. Compliance Test for Leaching of Granular Waste Materials and Sludges. Part 4: One Stage Batch Test at a Liquid to Solid Ratio of 10 l/kg for Materials with Particle Size Below 10 mm (without or with Size Reduction); AENOR: Madrid, Spain, 2003. [Google Scholar]
- Chung, F.H. Quantitative interpretation of X-ray diffraction patterns. I. Matrix-flushing method of quantitative multicomponent analysis. J. Appl. Crystallogr. 1974, 7, 519–525. [Google Scholar] [CrossRef]
- Chung, F.H. Quantitative interpretation of X-ray diffraction patterns. III. Simultaneous determination of a set of reference intensities. J. Appl. Crystallogr. 1975, 8, 17–19. [Google Scholar] [CrossRef]
- Jorfi, S.; Maleki, R.; Jaafarzadeh, N.; Ahmadi, M. Pollution load index for heavy metals in Mian-Ab plain soil, Khuzestan, Iran. Data Brief. 2017, 15, 584–590. [Google Scholar] [CrossRef] [PubMed]
- García-Lorenzo, M.L.; Pérez-Sirvent, C.; Molina-Ruiz, J.; Martínez-Sánchez, M.J. Mobility indices for the assessment of metal contamination in soils affected by old mining activities. J. Geochem. Explor. 2014, 147, 117–129. [Google Scholar] [CrossRef]
- OECD. Guideline of the OECD for Testing Chemical Products-Terrestrial Plants; Growth Test Method, 208; OECD: Paris, France, 1984. [Google Scholar]
- Phytotoxkit. Seed Germination and Early Growth Microbiotest with Higher Plants. In Standard Operation Procedure; MicroBioTests Inc.: Gent, Belgium, 2004; pp. 1–34. [Google Scholar]
- Liu, J.; Dazzo, F.B.; Glagoleva, O.; Yu, B.; Jain, A.K. CMEIAS: A computer-aided system for the image analysis of bacterial morphotypes in microbial communities. Microb. Ecol. 2001, 41, 173–194. [Google Scholar] [CrossRef] [PubMed]
- Ostracodtoxkit, F. “Direct Contact” Toxicity Tests for Freshwater Sediments. In Standard Operational Procedure; MicroBioTests Inc.: Gent, Belgium, 2001; pp. 1–37. [Google Scholar]
- Persoone, G.; Marsalek, B.; Blinova, I.; Torokne, A.; Zarina, D.; Manusadzianas, L.; Nalecz-Jawecki, G.; Tofan, L.; Stepanova, N.; Tothova, L.; et al. A practical and user-friendly toxicity classification system with microbiotests for natural waters and wastewaters. Environ. Toxicol. 2003, 18, 395–402. [Google Scholar] [CrossRef] [PubMed]
- Clark, I. Practical Geostatistics. Geostokos Ltd., Central Scotland. 2001, p. 19. Available online: http://www.kriging.com/PG1979/PG1979.pdf (accessed on 15 April 2019).
- Jiménez Ballesta, R.; Conde Bueno, P.; Martín Rubí, J.A.; García Giménez, R. Niveles de fondo geoquímico e influencia del marco geológico en las concentraciones edafoquímicas de base de suelos seleccionados de Castilla-La Mancha. Estudios Geológicos 2010, 66, 123–130. [Google Scholar] [CrossRef]
- Bravo, S.; García-Ordiales, E.; García-Navarro, F.J.; Amorós, J.A.; Pérez-de-los-Reyes, C.; Jiménez-Ballesta, R.; Esbrí, J.M.; García-Noguero, E.M.; Higueras, P. Geochemical distribution of major and trace elements in agricultural soils of Castilla-La Mancha (central Spain): Finding criteria for baselines and delimiting regional anomalies. Environ. Sci. Pollut. Res. 2019, 26, 3100–3114. [Google Scholar] [CrossRef] [PubMed]
- Navarro, M.C.; Pérez-Sirvent, C.; Martínez-Sánchez, M.J.; Vidal, J.; Tovar, P.J.; Bech, J. Abandoned mine sites as a source of contamination by heavy metals: A case study in a semi-arid zone. J. Geochem. Explor. 2008, 96, 183–193. [Google Scholar] [CrossRef]
- Oyarzun, R.; Lillo, J.; López García, J.A.; Esbrí, J.M.; Cubas, P.; Llanos, W.; Higueras, P. The Mazarrón Pb-(Ag)-Zn mining district (SE Spain) as a source of heavy metal contamination in a semiarid realm: Geochemical data from mine wastes, soils, and stream sediments. J. Geochem. Explor. 2011, 109, 113–124. [Google Scholar] [CrossRef]
- Schwartz, M.O. Cadmium in zinc deposits: Economic geology of a polluting element. Int. Geol. Rev. 2000, 42, 445–469. [Google Scholar] [CrossRef]
- Lin, Y.; Tiegeng, L. Sphalerite chemistry, Niujiaotang Cd-rich zinc deposit, Guizhou, Southwest China. Chin. J. Geochem. 1999, 18, 62–68. [Google Scholar] [CrossRef]
- O’Day, P.A. Chemistry and mineralogy of arsenic. Elements 2006, 2, 77–83. [Google Scholar] [CrossRef]
- Seaman, J.C.; Bertsch, P.M.; Strom, R.N. Characterization of colloids mobilized from southeastern coastal plains sediments. Environ. Sci. Technol. 1997, 31, 2782–2790. [Google Scholar] [CrossRef]
- Smith, K.S. Metal Sorption on Mineral Surfaces: An Overview with Examples Relating to Mineral Deposits. In The Environmental Geochemistry of Mineral Deposits; Reviews in Economic Geology; Plumlee, G.S., Logsdon, M.J., Eds.; Society of Economic Geologists: Chelsea, MI, USA, 1999; pp. 161–182. [Google Scholar]
- Smedley, P.L.; Kinniburgh, D.G. A review of the source, behaviour and distribution of arsenic in natural waters. Appl. Geochem. 2002, 17, 517–568. [Google Scholar] [CrossRef]
- Meng, X.; Korfiatis, G.P.; Bang, S.; Bang, K.W. Combined effects of anions on arsenic removal by iron hydroxides. Toxicol. Lett. 2002, 133, 103–111. [Google Scholar] [CrossRef]
- Kohler, U.; Luniak, M. Data inspection using biplots. Stata J. 2005, 5, 208–223. [Google Scholar] [CrossRef]
- Martínez-Sánchez, M.J.; Pérez-Sirvent, C.; García-Lorenzo, M.L.; Martínez-López, S.; Bech, J.; Hernández, C.; Martínez, L.B.; Molina, J. Ecoefficient In Situ Technologies for the Remediation of Sites Affected by Old Mining Activities: The Case of Portman Bay. In Assessment, Restoration and Reclamation of Mining Influenced Soils; Bech, J., Bini, C., Pashkevich, M.A., Eds.; Academic Press: Cambridge, MA, USA, 2017; pp. 355–373. [Google Scholar] [CrossRef]
- Martínez-Sánchez, M.J.; Pérez-Sirvent, C.; García-Lorenzo, M.L.; Martínez-López, S.; Bech, J.; García-Tenorio, R.; Bolívar, J.P. Use of bioassays for the assessment of areas affected by phosphate industry wastes. J. Geochem. Explor. 2014, 147, 130–138. [Google Scholar] [CrossRef]


| Percent Toxic Effect (PE) | Class | Hazard |
|---|---|---|
| ≤20% | Class I | No acute hazard |
| 20% ≤ PE< 50% | Class II | Slight acute hazard |
| 50% ≤ PE< 100% | Class III | Acute hazard |
| PE 100% in at least one test | Class IV | High acute hazard |
| PE 100% in all tests | Class V | Very high acute hazard |
| Element (mg kg−1) | Pb | Zn | Cd | As | Fe | Reference |
|---|---|---|---|---|---|---|
| San Quintín West (SQW) | ||||||
| Mean | 18,036 | 8825 | 38 | 88 | 42,597 | This work |
| Geometric mean | 12,177 | 5408 | 10 | 16 | ||
| Standard deviation | 13,409 | 8075 | 35 | 226 | 33,943 | |
| Minimum | 1000 | 340 | 1 | 1 | 10,500 | |
| Maximum | 48,600 | 34,200 | 200 | 1000 | 166,900 | |
| Blanco | 600 | 1 | 11 | |||
| Background values Castilla la Mancha | ||||||
| CLM-B | 17.9 | 35.0 | 3.9 ** | 6.5 | XX * | ** Bravo et al. [27] * Jiménez-Ballesta et al. [26] |
| CLM-RL | 27.1 | 57.2 | 4.4 ** | 14.1 | XX * | |
| Other Pb-Zn mining sites in SE Spain | ||||||
| Cabezo Rajao (soils & mine wastes) | 8000 | 12,500 | 41 | 315 | Navarro et al. [28] | |
| Mazarrón District (tailings) | 12,401 | 6101 | 15 | 654 | Oyarzun et al. [29] | |
| 10,304 | 5120 | 12 | 497 | Oyarzun et al. [29] | ||
| Phyllosilicates | Feldspars | Quartz | Gypsum | Plumbojarosite | Anglesite | Alunite | Hematite + Goethite | Amorphous | |
|---|---|---|---|---|---|---|---|---|---|
| S1 | 28 | 12 | 31 | 6 | 3 | 2 | 3 | 10 | 6 |
| S2 | 22 | 17 | 29 | 8 | 3 | 3 | 8 | 6 | 5 |
| S3 | 18 | 10 | 22 | 15 | 6 | 3 | 9 | 11 | 6 |
| S4 | 27 | 20 | 41 | 0 | 2 | 2 | 3 | 2 | 4 |
| S5 | 33 | 18 | 36 | 0 | 1 | 1 | 3 | 3 | 4 |
| S6 | 18 | 12 | 19 | 11 | 6 | 5 | 14 | 9 | 6 |
| S7 | 27 | 17 | 25 | 7 | 3 | 3 | 7 | 5 | 5 |
| S8 | 19 | 9 | 29 | 15 | 12 | 2 | 5 | 5 | 5 |
| S9 | 26 | 12 | 32 | 8 | 2 | 3 | 8 | 6 | 4 |
| S10 | 22 | 15 | 29 | 9 | 4 | 3 | 7 | 6 | 5 |
| S11 | 11 | 8 | 11 | 36 | 20 | 0 | 2 | 4 | 9 |
| S12 | 21 | 16 | 31 | 8 | 3 | 2 | 4 | 10 | 6 |
| S13 | 21 | 14 | 30 | 9 | 4 | 3 | 9 | 7 | 5 |
| S14 | 25 | 12 | 30 | 8 | 4 | 3 | 8 | 7 | 5 |
| S15 | 20 | 14 | 23 | 11 | 3 | 4 | 11 | 9 | 6 |
| S16 | 23 | 14 | 23 | 8 | 9 | 3 | 7 | 6 | 6 |
| S17 | 19 | 11 | 16 | 0 | 30 | 2 | 6 | 7 | 9 |
| S18 | 10 | 8 | 9 | 3 | 50 | 2 | 5 | 5 | 10 |
| S19 | 18 | 10 | 25 | 6 | 27 | 2 | 3 | 4 | 6 |
| S20 | 16 | 11 | 22 | 5 | 26 | 2 | 5 | 7 | 7 |
| S21 | 31 | 12 | 41 | 4 | 1 | 2 | 2 | 4 | 4 |
| S22 | 14 | 13 | 25 | 6 | 24 | 2 | 5 | 5 | 7 |
| S23 | 9 | 15 | 10 | 6 | 0 | 10 | 26 | 14 | 9 |
| S24 | 20 | 13 | 19 | 9 | 4 | 5 | 14 | 8 | 7 |
| S25 | 5 | 7 | 2 | 2 | 68 | 1 | 2 | 4 | 9 |
| S26 | 13 | 19 | 13 | 7 | 5 | 6 | 17 | 12 | 8 |
| S27 | 18 | 4 | 58 | 0 | 4 | 0 | 0 | 12 | 3 |
| S28 | 14 | 7 | 15 | 10 | 41 | 1 | 1 | 4 | 7 |
| S29 | 14 | 14 | 36 | 9 | 12 | 3 | 0 | 7 | 4 |
| S30 | 21 | 19 | 21 | 3 | 22 | 1 | 0 | 5 | 7 |
| S31 | 9 | 7 | 4 | 8 | 53 | 3 | 3 | 5 | 10 |
| S32 | 22 | 10 | 42 | 12 | 4 | 2 | 0 | 5 | 4 |
| S33 | 21 | 12 | 41 | 0 | 8 | 2 | 3 | 9 | 4 |
| Pb | As | Cd | Fe | Zn | |
|---|---|---|---|---|---|
| Mean (mg kg−1) | 5 | 3 | 19 | 1856 | <dl |
| Extraction % | 0.04 | 19 | 39 | 7 | <dl |
| Germination Inhibition (%) | Root Inhibition (%) | Ostracodtoxkit | Class | |||||
|---|---|---|---|---|---|---|---|---|
| Ls | Sa | Ss | Ls | Sa | Ss | |||
| S1 | 12 | 10 | 10 | 36 | 61 | 3 | 100 | IV |
| S2 | 100 | 40 | 30 | 100 | 81 | 55 | 100 | V |
| S3 | 10 | 10 | 10 | 29 | 40 | 51 | 100 | IV |
| S4 | 20 | 20 | 30 | 44 | 15 | 39 | 100 | IV |
| S5 | 0 | 10 | 10 | 0 | 0 | 2 | 100 | IV |
| S6 | 100 | 100 | 95 | 100 | 100 | 87 | 100 | V |
| S7 | 44 | 20 | 10 | 62 | 64 | 0 | 100 | IV |
| S8 | 33 | 50 | 10 | 93 | 88 | 95 | 100 | IV |
| S9 | 87 | 60 | 0 | 92 | 85 | 73 | 100 | IV |
| S10 | 22 | 30 | 20 | 77 | 84 | 43 | 100 | IV |
| S11 | 10 | 60 | 20 | 89 | 85 | 90 | 100 | IV |
| S12 | 0 | 10 | 10 | 68 | 65 | 65 | 100 | IV |
| S13 | 10 | 10 | 10 | 63 | 34 | 56 | 100 | IV |
| S14 | 20 | 10 | 10 | 47 | 26 | 21 | 100 | IV |
| S15 | 10 | 10 | 10 | 73 | 72 | 35 | 100 | IV |
| S16 | 17 | 20 | 20 | 80 | 71 | 79 | 100 | IV |
| S17 | 20 | 20 | 10 | 74 | 78 | 65 | 100 | IV |
| S18 | 50 | 100 | 78 | 100 | 100 | 86 | 100 | IV |
| S19 | 25 | 0 | 0 | 81 | 79 | 77 | 100 | IV |
| S20 | 0 | 10 | 20 | 30 | 1 | 33 | 100 | IV |
| S21 | 12 | 20 | 10 | 0 | 0 | 10 | 100 | IV |
| S22 | 100 | 100 | 100 | 100 | 100 | 100 | 100 | V |
| S23 | 100 | 100 | 100 | 100 | 100 | 100 | 100 | V |
| S24 | 100 | 100 | 100 | 100 | 100 | 100 | 100 | V |
| S25 | 100 | 100 | 100 | 100 | 100 | 100 | 100 | V |
| S26 | 17 | 20 | 20 | 90 | 89 | 81 | 100 | IV |
| S27 | 15 | 10 | 8 | 100 | 100 | 84 | 100 | IV |
| S28 | 0 | 20 | 20 | 61 | 32 | 53 | 100 | IV |
| S29 | 11 | 90 | 40 | 100 | 100 | 91 | 100 | IV |
| S30 | 22 | 70 | 30 | 75 | 100 | 74 | 100 | IV |
| S31 | 15 | 10 | 8 | 100 | 100 | 84 | 100 | IV |
| S32 | 0 | 10 | 20 | 26 | 5 | 33 | 100 | IV |
| S33 (Blanco) | 0 | 0 | 0 | 10 | 0 | 36 | 49 | II |
| pH | EC | Pb (mg/kg) | As (mg/kg) | Cd (mg/kg) | Fe (mg/kg) | Zn (mg/kg) | GI L. Sativum | GI S. Alba | GI S.Saccharatum | RI L. Sativum | RI S. alba | RI S.Saccharatum | PLI | |
| EC | −0.49 * | |||||||||||||
| Pb (mg/kg) | −0.25 | 0.59 * | ||||||||||||
| As (mg/kg) | −0.40 * | 0.59 * | 0.40 * | |||||||||||
| Cd (mg/kg) | −0.29 | 0.65 * | 0.45 * | 0.66 * | ||||||||||
| Fe (mg/kg) | −0.48 * | 0.53 * | 0.31 | 0.88 * | 0.56 * | |||||||||
| Zn (mg/kg) | 0.14 | 0.59 * | 0.52 * | 0.43 * | 0.59 * | 0.30 | ||||||||
| GI L. Sativum | −0.39 * | 0.76 * | 0.46 * | 0.33 | 0.43 * | 0.26 | 0.51 * | |||||||
| GI S. Alba | −0.61 * | 0.70* | 0.42 * | 0.37* | 0.35 * | 0.36 * | 0.38 * | 0.77 * | ||||||
| GI S.Saccharatum | −0.66 * | 0.80 * | 0.49 * | 0.49* | 0.50 * | 0.48 * | 0.36 * | 0.70 * | 0.86 * | |||||
| RI L. Sativum | −0.01 | 0.25 | 0.14 | 0.03 | 0.07 | 0.01 | 0.14 | 0.12 | 0.14 | 0.11 | ||||
| RI S. alba | −0.55 * | 0.59 * | 0.45 * | 0.24 | 0.30 | 0.28 | 0.30 | 0.62 * | 0.70 * | 0.54 * | 0.20 | |||
| RI S.Saccharatum | −0.64 * | 0.65 * | 0.52 * | 0.29 | 0.35 | 0.33 | 0.20 | 0.54 * | 0.73 * | 0.60 * | 0.12 | 0.76 * | ||
| PLI | −0.38 * | 0.69 * | 0.51 * | 0.93 * | 0.85 * | 0.84 * | 0.60 * | 0.43 * | 0.42 * | 0.53 * | 0.08 | 0.35 | 0.37 * | |
| NMI | −0.45 * | 0.45 * | 0.03 | 0.05 | 0.03 | 0.22 | −0.14 | 0.36 * | 0.32 * | 0.47 * | 0.03 | 0.20 | 0.29 | 0.04 |
© 2019 by the authors. Licensee MDPI, Basel, Switzerland. This article is an open access article distributed under the terms and conditions of the Creative Commons Attribution (CC BY) license (http://creativecommons.org/licenses/by/4.0/).
Share and Cite
García-Lorenzo, M.L.; Crespo-Feo, E.; Esbrí, J.M.; Higueras, P.; Grau, P.; Crespo, I.; Sánchez-Donoso, R. Assessment of Potentially Toxic Elements in Technosols by Tailings Derived from Pb–Zn–Ag Mining Activities at San Quintín (Ciudad Real, Spain): Some Insights into the Importance of Integral Studies to Evaluate Metal Contamination Pollution Hazards. Minerals 2019, 9, 346. https://doi.org/10.3390/min9060346
García-Lorenzo ML, Crespo-Feo E, Esbrí JM, Higueras P, Grau P, Crespo I, Sánchez-Donoso R. Assessment of Potentially Toxic Elements in Technosols by Tailings Derived from Pb–Zn–Ag Mining Activities at San Quintín (Ciudad Real, Spain): Some Insights into the Importance of Integral Studies to Evaluate Metal Contamination Pollution Hazards. Minerals. 2019; 9(6):346. https://doi.org/10.3390/min9060346
Chicago/Turabian StyleGarcía-Lorenzo, Mari Luz, Elena Crespo-Feo, Jose María Esbrí, Pablo Higueras, Patricia Grau, Isabel Crespo, and Ramón Sánchez-Donoso. 2019. "Assessment of Potentially Toxic Elements in Technosols by Tailings Derived from Pb–Zn–Ag Mining Activities at San Quintín (Ciudad Real, Spain): Some Insights into the Importance of Integral Studies to Evaluate Metal Contamination Pollution Hazards" Minerals 9, no. 6: 346. https://doi.org/10.3390/min9060346
APA StyleGarcía-Lorenzo, M. L., Crespo-Feo, E., Esbrí, J. M., Higueras, P., Grau, P., Crespo, I., & Sánchez-Donoso, R. (2019). Assessment of Potentially Toxic Elements in Technosols by Tailings Derived from Pb–Zn–Ag Mining Activities at San Quintín (Ciudad Real, Spain): Some Insights into the Importance of Integral Studies to Evaluate Metal Contamination Pollution Hazards. Minerals, 9(6), 346. https://doi.org/10.3390/min9060346