Abstract
The dramatic growth of the world’s population is increasing the pressure on natural resources, particularly on soil systems. At the same time, inappropriate agricultural practices are causing widespread soil degradation. Improved management of soil resources and identification of the potential agricultural capability of soils is therefore needed to prevent further land degradation, particularly in dryland areas such as Egypt. Here, we present a case study in the El-Fayoum depression (Northern Egypt) to model and map soil suitability for 12 typical Mediterranean crops. Two management scenarios were analyzed: the current situation (CS) and an optimal scenario (OS) of soil variables. The Almagra model was applied to estimate soil suitability under CS and OS. Management options based on the CS assessment were proposed to reduce some limiting factors: a fixed value of 2 dSm−1 for soil salinity and 5% for sodium saturation; these defined the OS. Under optimal management, the OS scenario showed potential, where a notable increase of the area covered by a high suitability class (around 80%) for annual and semi-annual crops was observed. There was also a marked increase (about 70% for CS and 50% for OS) for perennial crops shifting from the marginal to moderate soil suitability class. The results reveal the importance of proper management to massively alter soil suitability into better states in order to achieve sustainable land use in this fertile agro-ecosystem.
1. Introduction
The dramatic increase of the world’s population is inducing enormous pressure on natural resources [1,2]. This pressure causes multiple environmental problems for land and water systems [3], and therefore, appropriate land-use and management strategies are needed to reduce the magnitude of these human impacts [4,5]. Agricultural activities have a direct effect on soils’ physical, chemical, and biological properties [6], resulting in environmental problems such as soil degradation [7], waterlogging [8], salinization/alkalization [9], and contamination [10,11]. These environmental problems affect soil quality and crop productivity, reducing food production capacity and food security.
Water scarcity is also a serious constraint for agriculture in drylands, where land is highly vulnerable to land degradation due to aridity [9]. At the global scale, Africa is highly affected by desertification, with over 45% of the land exposed to this process [12]. This issue calls for the urgent improvement of agricultural practices and water use efficiency [13] in order to reduce environmental problems and prevent further degradation [14]. Irrigation is often used to alleviate water scarcity, and often inappropriate irrigation practices induce soil salinization and soil sodicity, which are major causes of land degradation [15]. The excess of salts may cause clay dispersion and create soil crusts, decreasing permeability and soil productivity, but suitable agricultural land management may also improve conditions [16]. Although drainage problems occur naturally, agricultural land management can exacerbate it [16]. Improving soils’ physical properties facilitates sodium leaching, and decreases salinity and sodicity effects in soils [17].
Agriculture is the main economic activity in Egypt and supports the livelihoods of approximately 55% of the population, contributing to around 20% of foreign exchange earnings, and approximately 30% of Egypt’s commodity exports [18]. Agricultural land in Egypt represents approximately 3.8 Mha and the main crops cultivated are wheat, cotton, maize, sunflower, clovers, tomatoes, aromatic and medicinal plants, mangoes, olives, and citrus [18]. In the largely fertile Nile valley, soil productivity is restricted by salinity as result of irrigation and by urban sprawl over productive soils. Such unsustainable management results in land degradation, with implications for soil productivity, food production, and food security [19,20,21].
Land evaluation involves determination of the land potential for agricultural purposes [22,23] and its main objective is to manage and improve land in a sustainable way to increase its potential for human uses [22,24]. Land suitability status is based on intrinsic properties of soils (e.g., parent materials, soil texture and depth) and characteristics that can be altered by human management (e.g., drainage, salinity, nutrient concentration and vegetation cover) [25,26]. Several land evaluation guidelines have been created in the last decades (e.g., [22,25,26,27,28,29,30,31]).
The evolution of technology and models capable of analyzing a large number of variables has increased the sophistication of land suitability analyses [32,33]. Furthermore, the development of geographical information systems (GIS) and geostatistical techniques has allowed improved spatial processing of information on the variables that affect land degradation and land suitability, which are important for sustainable use of agricultural areas [6]. Soil and land evaluation models, hypothetical scenarios of agriculture management, and spatial analyses are valuable tools for land managers and decision makers to achieve sustainable land-use planning and management for targeted areas [34,35,36]. The Micro Land Evaluation Information System has been extensively used worldwide for land suitability assessment (MicroLEIS, [29,30,37]). The MicroLEIS focuses on an integrated system of soil, climate, and agriculture management databases for land evaluation and contains two sets of models related to land suitability and land vulnerability. These models have been widely used for: (i) land degradation evaluation and prediction of optimal land-use and management practices, and (ii) assisting decision makers in solving agro-ecological problems (e.g., [36,38,39,40,41,42,43,44]). The Almagra model is one of the main components of the MicroLEIS DSS that was designed for land suitability evaluation [45].
Given the importance of the agricultural sector in Egypt, there is a strong need for assessments of the agricultural potential of the existing soils. This is especially important in an area extremely vulnerable to land degradation and where soil productivity is important for food security. In this study, the Almagra model was used to evaluate soil suitability in the El-Fayoum depression (Northern Egypt). The main objectives were to: (i) assess soil suitability in relation to cultivation of 12 Mediterranean crops (annual, semi-annual, and perennial) under current scenario (CS) and optimal scenarios (OS) of soil management, and (ii) to obtain the spatial distribution of soil suitability under the proposed scenarios based on physiographic units.
2. Material and Methods
2.1. Study Area
The El-Fayoum depression is located within the El-Fayoum region (western desert of Egypt) at coordinates 29°02′–29°35′ N and 30°23′–31°05′ E (Figure 1). Monthly mean temperature and precipitation inside and outside of the depression are shown in Figure S1.
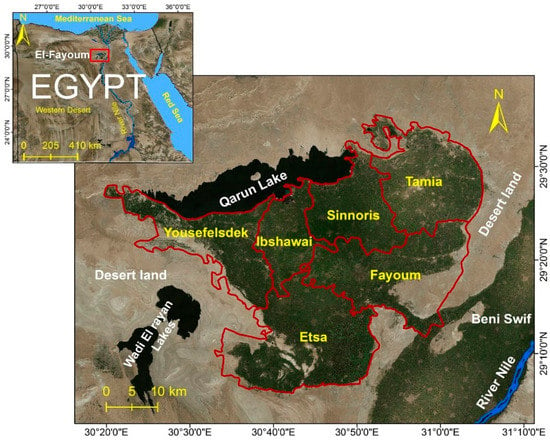
Figure 1.
Location of the El-Fayoum depression within Egypt.
The El-Fayoum altitude ranges between −52 to 141 m in relation to mean sea level and has a flat topography (Figure 2A,B). According to Reference [46], the soils of the El-Fayoum depression belong to the Aridisol and Entisol soil groups. The dominant soil subgroup is the Vertic Torrifluvent that covers an area of 43% of the study area; the other subgroups are Typic Haplocalcids, Typic Torrifluvents, Typic Haplogypsids, Typic Haplosalids, and Typic Torripsamments [47]. The depression is linked to the Nile River by the canal of Hawara that transports the water to the depression. The study area involves six districts (Tamia, Sinnoris, Ibshawai, Fayoum, Yousef El Sadik, and Itsa). Agriculture is the main activity in the study area and the total cultivated land is 177,802 ha [18].
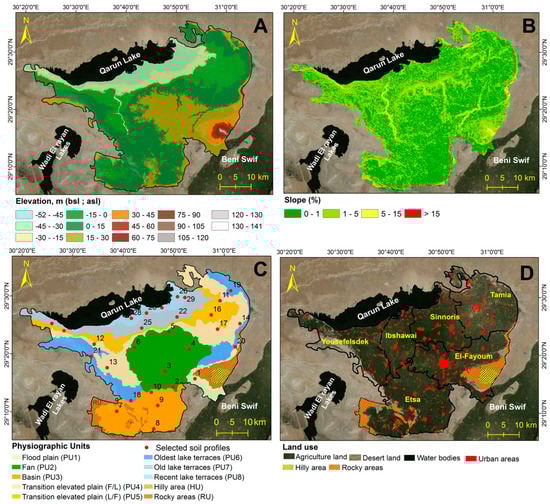
Figure 2.
Study area: (A) elevation, (B) slope, (C) sampled sites and physiographic units, and (D) land use.
2.2. Soil and Climate Databases
Twenty-nine soil profiles were selected from the studies of [48,49] to analyze the soil characteristics in the current situation (CS). Each of these profiles was the average of three individual points (Figure 2C). For this study, we selected the most important soil variables (model input) to evaluate soil quality, e.g., electrical conductivity (EC), exchangeable sodium percentage (ESP%) pH, carbonate content (CaCO3), texture, organic matter (OM), and cation exchange capacity (CEC). Agroclimatic parameters such as evapotranspiration and aridity index (ARi, numbers of arid months in which the actual precipitation was lower than the evapotranspiration) were calculated from El-Fayoum weather station data from the period 1962–2006 [50]. Water supply from the Nile for irrigation (2.64 × 10⁹ m3/year) was also considered in the models. The monthly distribution of these parameters is shown in Figure S1.
2.3. Soil Suitability Evaluation
Almagra Model
This model is considered as a qualitative biophysical evaluation model that uses the diagnostic criteria of soil variables and the favorable conditions for crop growth within MicroLEIS ([30,45,51], Figure S2). This model is more practical to use than other land suitability models [52]. The Almagra model has been used and calibrated in previous studies in Mediterranean regions [37,41,53,54,55]. In this study, the Almagra model defined soil suitability within five different classes (Figure S3): optimum (S1), high (S2), moderate (S3), marginal (S4), and not suitable (S5) for twelve traditional crops that included annuals, e.g., wheat, sunflower, sugar beet, melon, potato, soybean, cotton, and corn; semi-annuals, e.g., alfalfa; and perennials, e.g., olive, citrus, and peach. The level of generalization of the variables was dependent on the crop requirement for each soil variable using the “most limiting factor” approach to identify the soil suitability classes. Here, the Almagra model was applied to evaluate the CS of soil suitability for the twelve Mediterranean crops considering all the soil limiting factors in the El-Fayoum depression. The optimal scenario was based on the soil variables that could be managed, such as EC, ESP%, and drainage, without taking into account the interaction between them. Soil depth and texture were not considered as these variables are not easily modified. The soil suitability classes were further divided into 18 subclasses depending on the number of limiting factors in each soil suitability class (Figure S3).
The suggested optimal scenario (OS) was determined according to the following equation:
where; OS: optimal scenario; CS: current situation; URs: units of reduction.
OS = CS − URs
The units of reduction were defined based on the CS assessment to meet the proposed fixed value of the OS in order to increase final soil suitability to S2 (high soil suitability). The proposed fixed values of each manageable soil factor are highlighted in green boxes in Figure S2. Accordingly, when soil suitability under CS is S5 or S4 (marginal and not suitable, respectively), these will require higher URs compared to S3 (moderate), which need lower reduction units to meet the fixed value of OS for each soil variable. For soil salinity, the OS was proposed to decrease ES classes (ranged from slightly saline to high saline) to a fixed value of 2 dSm−1 (non-saline class). In terms of ESP%, the intended value of the OS was 5%. Finally, as the drainage factor is a qualitative parameter in the Almagra model, the OS was aimed to enhance the drainage from “very poor”, “poor”, and “moderate”, to “good” drainage status.
2.4. Spatial Analysis
A Landsat 8 satellite image (path/raw: 177/40 acquired in July 2016) was used as a base map for the spatial analysis of the studied variables. The image was masked to the study area based on the administrative boundaries of the El-Fayoum depression using ArcGIS 10.4 [56].
The Shuttle Radar Topographic Mission (SRTM) digital elevation model (DEM) produced by NASA (version 3, 30 m resolution, updated on 6 August 2015) was downloaded from the US Geological Survey website using EarthExplorer. The DEM of the El-Fayoum depression was subset to the study area to accurately allocate the physiographic units [49,57]. The slope percentage was calculated based on the DEM using the spatial analysis tools in ArcMap and the slope classes were generated based on the Soil Survey Manual [58,59].
In order to obtain more reliable results, the largest extended urban areas (>10 hectare) were excluded from the total area coverage. A supervised classification procedure by maximum likelihood classifier was used to separate the urban areas from other land cover classes. All area coverages (km2 and %) for the physiographic units and urban areas were calculated in the attribute table using ArcMap.
To display the spatial distribution of soil salinity and sodium saturation percentage of the soil profiles under CS and URs, these variables were interpolated using ArcMap. This interpolation considered the values of the soil input factor as well as the DEM using Co-Kriging. Additionally, inverse distance weighting (IDW) was executed to spatially represent the distribution of soil suitability for the twelve studied crops under CS and OS, as well as the total average of soil suitability.
2.5. Statistical Analysis for Soil Factors
All soil variables analyzed were tested for normality using the Shapiro–Wilk normality test. Data were log transformed as necessary for analysis, but all presented data were non-transformed for ease of interpretation. Differences among physiographical units for each soil property were tested using a one-way ANOVA test. The SPSS 23 software [60] was used at a 95% confidence interval (significance level of α = 0.05). The main descriptive statistical parameters (maximum, minimum, and mean) were also generated.
3. Results and Discussion
3.1. Spatial Analysis and Soil Physiochemical Properties
3.1.1. Physiographic Units
Eight physiographic units were distinguished in the area besides the hilly and rocky areas (Figure 2C, Table 1). When considering the entire study area (with the urban area excluded), the fan physiographic unit represented one fifth of the study area (20%). The transition elevated plains (fluvial/lacustrine) covered an area of 30% and around the same area percentage (30%) was allocated to lake terraces (oldest, old, and recent). The uncultivated areas: rocky area (RU), and hilly area (HU) covering 105 and 22 km2 respectively, were excluded from the geometric area calculation for the evaluation process. The total urban area obtained was 115 km2 (Figure 2D) which represents around 6% of the area coverage.

Table 1.
The main physiographic units (PU), soil taxonomy according to the United States Department of Agriculture (USDA, 2014) and area coverage by km2 and % for the studied area. VTFE, Vertic Torrifluvents; TTFE, Typic Torrifluvents; TTPE, Typic Torripsamments; THCI, Typic Haplocalcids; THGI, Typic Haplogypsids; THIS, Typic Haplosalids.
3.1.2. Soil Properties
Almost all physiographic units were represented by four profiles except the flood plain unit (PU1), which was represented by only one soil profile, and the fan unit (PU2), which was represented by five. Table 2 illustrates the mean values of the soil factors in each physiographic unit. The elevated mean value of the EC was assigned to the recent lake terraces unit (PU8), adjacent to Qarun Lake, with a value of 31.9 dSm−1. The elevated EC in the soil close to Qarun lake could be caused by the percolation of the saline lake water, which can eventually lead to a rising water table within the soil profile depth [14]. Generally, the soils’ pH ranged from 7.54 to 8.87 (from slightly to strongly alkaline). The highest mean value of CaCO3 content in the El-Fayoum soils was 19.71%, which was observed in the elevated plain (Lacustrine/Fluvial) unit (PU5), while the lowest mean value (3.96%) was observed in the PU1-Flood plain. Several soil texture classes were found in the study area, from sand (>90% sand) to clay (around 65% clay). The heavy texture (clay content of 45%–60%) was primarily found in the PU2-fan physiographic unit. The mean values of exchangeable sodium percentage ranged from 8.72 to 19.83% based on the type of the physiographic unit, while the highest CEC value occurred within the fan physiographic unit with highest amount of clay. Generally, the El-Fayoum depression soils were poor in organic matter, with around 80% of the studied area having less than 1.5%. Deeper profiles (120–150 cm) were observed in the flood plain, fan, and basin physiographic units. Sand, silt, and clay contents differed significantly (p < 0.05) among physiographic units, but the rest of the variables (e.g., EC, pH, CaCO3, OM, and ESP) were not significantly different.
Table 2.
The mean values of the soil factors that were used in the suitability model for each physiographic unit. PU1, Flood plain; PU2, Fan; PU3, Basin; PU4, Transition elevated plain A; PU5, Transition elevated plain B; PU6, Oldest lake terraces; PU7, Old lake terraces; PU8, Recent lake terraces; EC, electric conductivity; OM, organic matter; ESP, exchangeable sodium percentage; CEC, cation exchange capacity.
3.2. Soil Factors under Current and Optimal Scenarios
3.2.1. Soil Salinity
Around 70% of the study area had a slight-to-moderate soil salinity with EC ranging between 2 and 6 dSm−1 under CS (Table 3). Approximately 5% of the study area showed extreme salinity (>16 dSm−1) (Figure 3a).
Table 3.
Area (km2 and %) of each soil salinity class and sodium saturation in the study area.
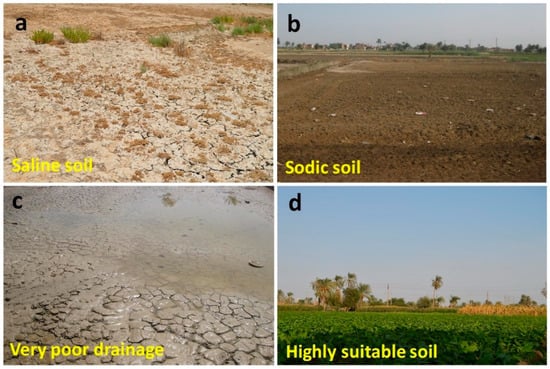
Figure 3.
Highly saline soil (a), sodic soil (b), and very poorly drained soil (c) compared with the highly suitable soil, planted with sugar beet and corn (d) in El-Fayoum.
Under the optimal scenario, all salinity classes were decreased to 2 dSm−1 (non-saline soil) with more than two-thirds of the study area assigned as slight-to-moderately saline soil (Table 3). The maximum soil salinity values (>16 dSm−1) were observed in PU8 under CS and OS (Figure 4A,B). On the other hand, the non-saline soil (<2 dSm−1) resulted in no reduction and the highest salinity classes (10–16 dSm−1) in 8 to 14 units of reduction (Figure 4A,B).
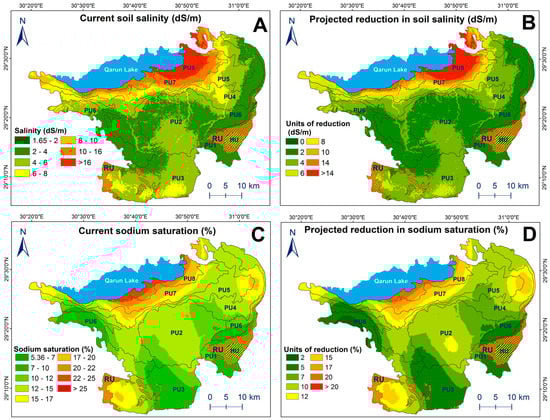
Figure 4.
Spatial distribution of soil salinity under the current situation (CS) and the projected reduction units in the optimal scenario (OS) scenario (A,B); and the spatial distribution of sodium saturation under the current situation and the projected reduction in the OS scenario units (C,D).
Different soil management options have been suggested to reduce soil salinity, such as removal of salts from the soil root zone through a leaching process via low salinity water [61]. However, the growth rates of plants under salt stress often vary between cultivars and strongly differ between plant species [62,63].
3.2.2. Sodium Saturation
In around 39% of the study area, sodium saturation ranged from 12 to 15% under CS (Table 3). Low-sodium saturation (5–12%) represented around 37% of the study area, and high-sodium saturation (20–25%) covered <5% of the area (Figure 3b). Therefore, 37% of the study area can be improved to the intended value (5%) with 5–7 reduction units, and 7–10 reduction units are needed to enhance 39% of the study area. The spatial distribution of sodium saturation under CS and the projected reduction units of sodium saturation for each class are shown in (Figure 4C,D).
The increased sodium saturation and salinization in arid and semiarid regions negatively affect soils’ physical properties such as soil structure and hydraulic conductivity, and consequently adversely impact crop yield, and if the exchangeable sodium percentage passes 15, these soils are classified as sodic soils [64,65]. On the other hand, high-sodium saturation could be improved by the addition of gypsum [16,17,66]. The addition of gypsum leads to the replacement of sodium with calcium on soil particles, which directly affects soil aggregation and reduces pH [17,67]. Thus, the incorporation of calcium using gypsum has proved to enhance soil particle aggregation, thus creating an adequate soil physical condition for nutrient uptake in sodic soils [68].
3.2.3. Drainage
Agriculture drainage in the studied area ranged from excessive (PU6) to very poor (PU8) (Figure 3c), and the dominant drainage status was the poor class under CS. Adequate drainage is essential to discharge leached salts from locations that have suffered from salinity problems [69,70]. In El-Fayoum, the main source of irrigation is Bahr Youssif (an old branch of the River Nile) with a water salinity value < 0.4 dSm−1. An optimum drainage status may be achieved by the addition of OM and gypsum, that would directly enhance soils’ physiochemical properties and consequently improves soil suitability [71,72]. Additionally, reducing tillage in sandy soils [73] and adding sand in the cases of clayey soil with very poor drainage [74,75], could lead to increased agriculture suitability under OS. An improved irrigation and drainage system could additionally help to recover and enhance soil properties, although over-irrigation could lead to decreasing soil suitability [76].
3.3. Soil Suitability
3.3.1. General Evaluation of Current Situation (CS) and Optimal Scenario (OS)
Table 4 shows how the Almagra model classified the three soil profile examples, and also illustrates the improvement in suitability classifications under the OS compared with the CS. Generally, the non-suitable class (S5) occurred mainly in the physiographic unit PU8 (Figure 5). For the perennial crops (citrus, peach, and olive), the main area assigned was the marginal suitability class (S4), and for the rest of the studied crops, the dominant classes were moderate (S3) and marginal (S4). High salinity, elevated sodium saturation, poor drainage, and heavy texture were observed as limiting factors in the physiographic units PU4 and PU5.
Table 4.
Soil suitability classifications according to the Almagra model. Each soil profile was classified on a scale from 1 (best) to 5 (worst) for each subclass, based on the specific requirements for each crop. The final classification was determined by the worst subclasses (in red), which was indicated by their letter. The crops were: I, wheat; II, corn; III, melon; IV, potato; V, soybean; VI, cotton; VII, sunflower; VIII, sugar beet; IX, alfalfa; X, peach; XI, citrus fruits; XII, olive. CS, Current Situation; OS, Optimal Scenario.
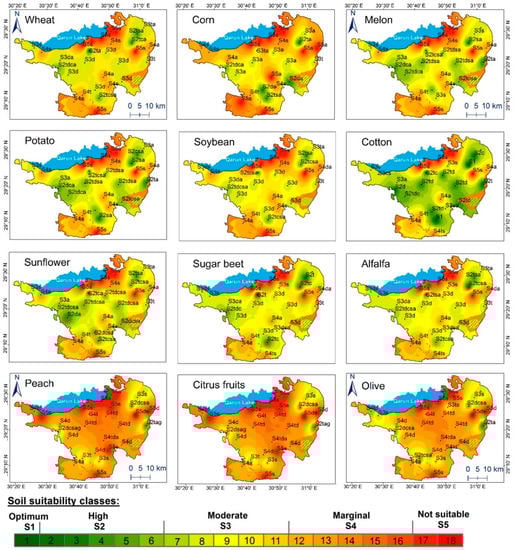
Figure 5.
Spatial distribution of the soil suitability classes under the current situation of soil factors, according to the application of the Almagra model in the El-Fayoum depression. The Main limiting factors; s, salinity; d, drainage; a, sodium saturation; t, texture; c, carbonate content; g, profile development.
According to the spatial distribution (Figure 5) under CS, the average of soil suitability for each crop was classified as: cotton > sugar beet > wheat, melon, potato, soybean sunflower, and alfalfa > corn > olive > citrus, and peach. Soil suitability assessments for annual and semi-annual crops under CS were mostly classified as moderate in the adjacent south-western areas of Qarun Lake to not suitable for almost all crops in the south-eastern soils (Figure 5).
While under the OS, the marginal and moderated classes changed to high suitability (Figure 5 and Figure 6). Importantly, there was at least one factor limiting soil suitability and preventing classification as optimum (Table 4). Although for all annual and semi-annual crops, the dominating soil suitability class was S2 (high), where the moderate and marginal suitability classes were predominant under perennials crops due to the difficulty of managing or improving soil factors, such as soil texture, high carbonate content, and soil depth (Figure 6).
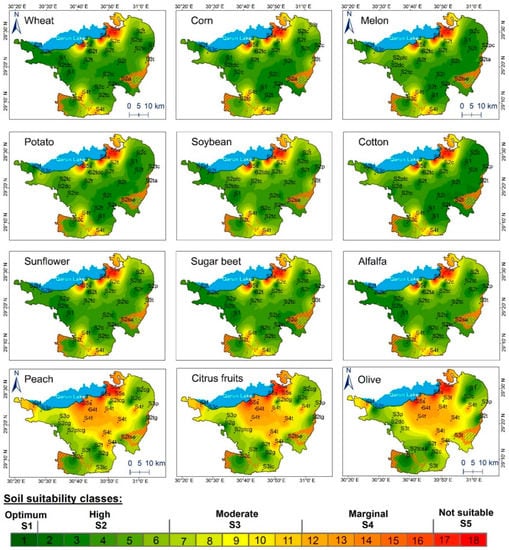
Figure 6.
Spatial analysis of soil suitability classes under the projected improvement of soil factors, according to the application of the Almagra model in the El-Fayoum depression. The main limiting factors: t, texture; c, carbonate content; p, soil depth; g, profile development s, salinity; d, drainage; a, sodium saturation.
3.3.2. Soil Suitability for Studied Crops
El-Fayoum soils are inherently very fertile, but with poor management and environmental conditions, the salinity levels and the ESP have increased in the area, which significantly affects the suitability of the studied crops [77,78]. Reducing the severity of the manageable soil limiting factors (EC, ESP, and drainage), where possible, resulted in an increase of soil suitability for all the studied crops under OS. Only areas with extreme salinity and shallow soil profile depths were excluded from the OS, as the modification of these factors would be unfeasible (Figure 7). Under CS, the main soil suitability subclasses were represented by subclasses 7 to 17, which covers the suitability classes of S3 and S4 for the most evaluated crops (Figure 4). With the application of the OS, the moderate and marginal suitability classes (S3 and S4, respectively) shifted to the high suitability class (S2) (Table 5).
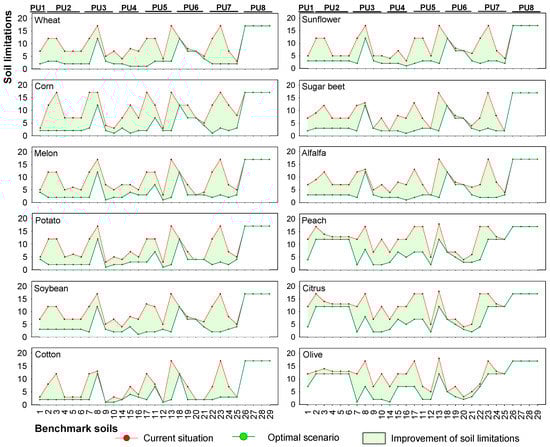
Figure 7.
Improvement degree of soil suitability evaluation under the OS compared with CS for each benchmark soil for twelve Mediterranean crops. Lower values on the y-axis represent low soil limitations and better suitability. PU1, Flood plain; PU2, Fan; PU3, Basin; PU4, Transition elevated plain A; PU5, Transition elevated plain B; PU6, Oldest lake terraces; PU7, Old lake terraces; PU8, Recent lake terraces.
Table 5.
Area (%) of soil suitability classes for the 12 crops under the CS (A) and OS (B).
The studied annual and semi-annual crops were wheat, corn, melon, potato, soybean, cotton, sunflower, sugar beet, and alfalfa. Under CS, the S3 and S4 soil suitability classes for wheat covered 95% of the study area (1187 km2 and 403 km2, respectively), whereas under OS, 79% (1314 km2) of the area improved to S2. For the corn crops, around 93% of the study area was S3 and S4 classes (881 km2 and 664 km2, respectively) under CS. In OS, the S2 class occupied 78%, 1298 km2 (Figure 8). Regarding melon crop, the S3 and S4 classes covered around 91% of the study area (1150 km2 and 362 km2, respectively) under CS. However, with the application of OS, the area of the S2 class increased substantially from 119 km2 to 1350 km2, which represented 81% of the study area. Under the CS, 88% of the study area was classified as S3 and S4 for potato crop (1150 km2 and 317 km2, respectively), which was enhanced under the OS to the S2 class covering an area of 1342 km2. The S3 and S4 classes covered 90% of the study area (1175 km2 and 431 km2, respectively) for soybean under CS. However, with the implementation of the OS, the S2 class improved to cover an area of 1287 km2 (77%) (Table 5, Figure 5, Figure 6 and Figure 8). Cotton is one of the strategic economic crops in Egypt [79]. In the El-Fayoum depression, the soil suitability for cotton under CS ranged from S2, S3, and to S4, with a coverage of 29%, 58%, and 12%, respectively. Applying the OS enhanced the area coverage for S2 to represent 81% (1357 km2). The S3 and S4 classes for sunflower under CS represented 90% of the study area (70% and 21%, respectively), whereas with OS, the S2 class represented 1299 km2 (78%) of the study area. For the sugar beet crop, 93% of the study area was allocated for the S3 and S4 classes (77% and 16%, respectively), while under the OS, the area of S2 increased to 1299 km2 (78%). Finally, the S3 and S4 classes for alfalfa under CS covered 96% of the study area (79% and 17%, respectively); however, with OS, the area coverage for S2 was improved to cover 1299 km2 (Table 5, Figure 4, Figure 5 and Figure 7). Regarding subclasses, the subclass 4 represented the large area for almost all annual and semi-annual crops studied, except for cotton and sunflower the subclass 3 represented the maximum extension.
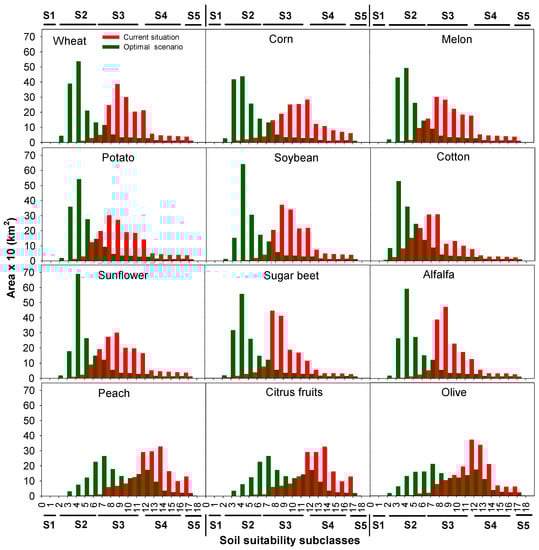
Figure 8.
Soil suitability subclasses area (km2) under CS and OS.
Three perennials crops were studied; peach, citrus, and olive. Under CS, around 91% of the study area was covered with S3 and S4 classes (21% and 71%, respectively) for peach and citrus. After implementing the OS, the area of S2 and S3 increased to around 28% and 50%, respectively. The S3 and S4 classes for olive under CS covered 95% of the study area (32% and 63%, respectively), which enhanced to S2 and S3 classes and covered areas of 533 km2 (32%) and 44% (739 km2), respectively (Table 5, Figure 4, Figure 5 and Figure 7).
Under CS, the average of soil suitability for the 12 studied crops was assigned to moderate and marginal suitability classes representing 71% and 25% of the study area, respectively (Figure 9). At the subclass level, the maximum area coverage of 378 km2 (23%) was occupied by subclass 10 (S3 class). Remarkably, with the application of the OS, a notable improvement was observed, as approximately 75% (1248 km2) of the study area was highly suitable for all evaluated crops. Conversely, the marginal suitability class was assigned to <5% of the area. The subclass 5 (S2 class) had a maximum area of 622 km2 (37%) compared to the rest of soil suitability subclasses.
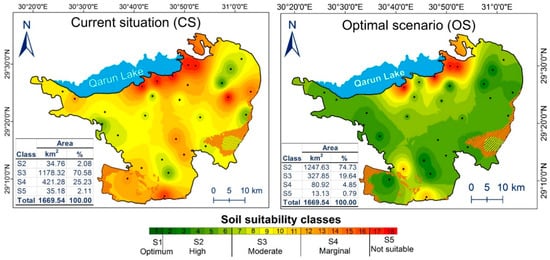
Figure 9.
The total average of soil suitability for the 12 studied crops under current and optimal scenarios.
Successful sustainable agricultural management programs rely on the best choice of suitable crops for specific land in specific environmental conditions. There is robust interaction between soil characteristics and crop requirements. Thus, when the soil qualities fail to meet the requirements of the crop (soil suitability assigned as marginal or not suitable), this can be amended in some cases by improving soil management [80]. Enhancing agricultural management practices via improving soil physiochemical characteristics helps to raise soil suitability for optimal production of maize, melon, and olive [81,82,83]. Improving soil suitability for potato, maize, and alfalfa needs substantial efforts of soil management to increase crop production [84]. Reference [85] found that the most limiting factors of soil suitability for wheat production were elevated soil salinity and alkalinity. Additionally, they applied a qualitative model for evaluating soil suitability to assist decision makers for sustainable agriculture planning and economic productivity of soil resources in Iran. While, in the north-western region of Libya, Reference [86] reported that the main limiting factors of soil suitability for wheat, maize, alfalfa, sunflower, soybean, potato, citrus, and olives crops were soil salinity, soil texture, alkaline pH, calcium carbonate, and soil depth. Their findings are consistent with this research’s observations.
Several scientists have utilized a computer/GIS-based model for mapping soil suitability [45,85,87,88,89]. The spatial analysis of soil suitability has a vital role in carrying out agriculture management processes [85,90]. Reference [91] used a soil evaluation model to estimate the land suitability of wheat, sugar beet, potato, and alfalfa in Iran. On the other hand, Reference [92] introduce a Bayesian network model, ALECA (Agroecological Land Evaluation for Coffea arabica L.), to evaluate land suitability for coffee production. Other scientists have utilized multi-criteria decision-making processes to provide accurate estimations of land suitability for different crops such as citrus [93], tobacco [94], and tea [95].
4. Conclusions
In this study, the application of the Almagra soil suitability model, a component of the MicroLEIS, allowed for predictions of agriculture soil suitability for twelve Mediterranean crops. The model identified the most suitable crops and the optimal spatial distribution under current and optimal management scenarios. The assessment of soil suitability under the current situation (CS) of soil factors helps to distinguish the most limiting soil factors. Likewise, applying the soil suitability model under the improvement of manageable limiting factors such as soil salinity, sodium saturation, and drainage assists in predicting the degree of improvement in soil suitability under the proposed optimal scenario (OS).
Consequently, the Almagra model assisted in identifying which of the studied crops were suitable to grow and where under the CS and the OS. The soil suitability classes varied spatially from optimum to non-suitable classes depending on the crop type and the possibility of soil factor improvements in case of the OS. Generally, under the CS of soil factors, the dominant soil suitability classes in the El-Fayoum depression were the moderate and marginal classes. On the other hand, the highly suitable class was dominant under the projected improvement of the manageable soil factors. Cotton was the most suitable current crop, while under optimal management, the suitability for all crops improved except for the perennial crops (i.e., peach, citrus fruits, and olive trees), where the most limiting factors for these crops are soil texture, depth, soil profile development, and carbonate content which are inflexible to modification. The total average of soil suitability for the twelve Mediterranean crops under CS were cotton > sugar beet > wheat, melon, potato, soybean sunflower, and alfalfa > corn > olive > citrus, and peach.
The assessment of soil suitability can help decision makers recognize the most limiting soil factors. Assessing the potential for improvement of manageable limiting factors such as soil salinity, sodium saturation, and drainage may assist in predicting the degree of improvement in soil suitability under the proposed OS. Mapping current soil suitability in this study and its improvement potential therefore provides valuable information to decision makers for appropriate land-use planning and sustainable development in the El-Fayoum depression.
Supplementary Materials
The following are available online at https://www.mdpi.com/2071-1050/11/6/1588/s1.
Author Contributions
Conceptualization, S.K.A.-E., N.B. and M.M.; Introduction, A.C., H.M., Z.Z.; Methodology, D.D. and A.J.; Results and discussions, S.K.A.-E., N.B., P.P. and M.M.; Reviewing and conclusions, L.J. and P.P. Funding Acquisition, Z.Z.
Funding
This research was funded by Talented Young Scientist Program (TYSP), China Science and Technology Exchange Center), grant number P150I3315, and the Independent Innovation Fund of Agricultural Science and Technology, Jiangsu Province, grant number CX (17)1001, and The APC was funded by Independent Innovation Fund of Agricultural Science and Technology, Jiangsu Province.
Conflicts of Interest
The authors declare no conflict of interest.
References
- Santana-Cordero, A.M.; Ariza, E.; Romagosa, F. Studying the historical evolution of ecosystem services to inform management policies for developed shorelines. Environ. Sci. Policy 2016, 64, 18–29. [Google Scholar] [CrossRef]
- Hanh, H.Q.; Azadi, H.; Dogot, T.; Ton, V.D.; Lebailly, P. Dynamics of Agrarian Systems and Land Use Change in North Vietnam. Land Degrad. Dev. 2017, 28, 799–810. [Google Scholar] [CrossRef]
- Tengberg, A.; Radstake, F.; Zhang, K.; Dunn, B. Scaling up of Sustainable Land Management in the Western People’s Republic of China: Evaluation of a 10-Year Partnership. Land Degrad. Dev. 2016, 27, 134–144. [Google Scholar] [CrossRef]
- Lal, R. Soils and sustainable agriculture: A review. Agron. Sustain. Dev. 2009, 28, 57–64. [Google Scholar] [CrossRef]
- Brevik, E.C. The potential impact of climate change on soil properties and processes and corresponding influence on food security. Agriculture 2013, 3, 398–417. [Google Scholar] [CrossRef]
- Brevik, E.; Calzolari, C.; Miller, B.; Pereira, P.; Kabala, C.; Baumgarten, A.; Jordán, A. Historical perspectives and future needs in soil mapping, classification and pedological modelling. Geoderma 2016, 264, 256–274. [Google Scholar] [CrossRef]
- Panagos, P.; Borrelli, P.; Poesen, J.; Ballabio, C.; Lugato, E.; Meusburger, K.; Montanarella, L.; Alewell, C. The new assessment of soil loss by water erosion in Europe. Environ. Sci. Policy 2015, 54, 438–447. [Google Scholar] [CrossRef]
- Singh, A. Soil salinization and waterlogging: A threat to environment and agricultural sustainability. Ecol. Indic. 2016, 57, 128–130. [Google Scholar] [CrossRef]
- Velmurugan, A.; Swarnam, T.P.; Ambast, S.K.; Kumar, N. Managing waterlogging and soil salinity with a permanent raised bed and furrow system in coastal lowlands of humid tropics. Agric. Water Manag. 2016, 168, 56–67. [Google Scholar] [CrossRef]
- Sam, K.; Coulon, F.; Prpich, G. Working towards an integrated land contamination management framework for Nigeria. Sci. Total Environ. 2016, 571, 916–925. [Google Scholar] [CrossRef] [PubMed]
- Chartzoulakis, K.; Bertaki, M. Sustainable Water Management in Agriculture under Climate Change. Agric. Agric. Sci. Procedia 2015, 4, 88–98. [Google Scholar] [CrossRef]
- Longjun, C. UN Convention to Combat Desertification. In Encyclopedia of Environmental Health; Nriagu, J.O., Ed.; Elsevier: Burlington, NJ, USA, 2011; pp. 504–517. ISBN 9780444522726. [Google Scholar]
- Zhou, D.; Wang, X.; Shi, M. Human driving forces of oasis expansion in Northwestern china during the last decade—A case of study of the Heihe river basin. Land Degrad. Dev. 2017, 28, 412–420. [Google Scholar] [CrossRef]
- Ali, M. Management of salt-affected soils. In Practices of Irrigation & On-Farm Water Management; Springer: New York, NY, USA, 2011; Volume 2, pp. 271–325. [Google Scholar]
- Daliakopoulos, I.N.; Tsanis, I.K.; Koutroulis, A.; Kourgialas, N.N.; Varouchakis, A.E.; Karatzas, G.P.; Ritsema, C.J. The threat of soil salinity: A European scale review. Sci. Total Environ. 2016, 573, 727–739. [Google Scholar] [CrossRef] [PubMed]
- FAO (Food and Agriculture Organization). Salt-Affected Soils and Their Management; Soils Bulletin 39; FAO: Rome, Italy, 1988. [Google Scholar]
- Chi, C.M.; Zhao, C.W.; Sun, X.J.; Wang, Z.C. Reclamation of saline-sodic soil properties and improvement of rice (Oriza sativa L.) growth and yield using desulfurized gypsum in the west of Songnen Plain, northeast China. Geoderma 2012, 187, 24–30. [Google Scholar] [CrossRef]
- CAPMAS. Egypt Statistical Yearbook Population. 2015. Available online: http://www.capmas.gov.eg/Pages/Publications.aspx?page_id=5104&YearID=23011 (accessed on 12 July 2017).
- Gouda, A.A.; Hosseini, M.; Masoumi, H.E. The Status of Urban and Suburban Sprawl in Egypt and Iran. GeoScape 2016, 10, 1–15. [Google Scholar] [CrossRef]
- Negm, A.M.; Saavedra, O.; El-Adawy, A. Nile Delta Biography: Challenges and Opportunities. In The Nile Delta, The Handbook of Environmental Chemistry; Negm, A.M., Ed.; Springer: Cham, Switzerland, 2016; pp. 1–16. [Google Scholar]
- Mahmoud, H.; Divigalpitiya, P. Modeling Future Land Use and Land-Cover Change in the Asyut Region Using Markov Chains and Cellular Automata. In Smart and Sustainable Planning for Cities and Region; Springer: Cham, Switzerland, 2017; pp. 99–112. [Google Scholar]
- FAO (Food and Agriculture Organization). Land Evaluation: Towards a Revised Framework; Land and Water Discussion Paper 6; FAO: Rome, Italy, 2007; p. 107. [Google Scholar]
- Anaya-Romero, M.; Abd-Elmabod, S.K.; Muñoz-Rojas, M.; Castellano, G.; Ceacero, C.J.; Alvarez, S.; Méndez, M.; De la Rosa, D. Evaluating soil threats under climate change scenarios in the Andalusia region. Southern Spain. Land Degrad. Dev. 2015, 26, 441–449. [Google Scholar] [CrossRef]
- Rossiter, D.G. A Theoretical Framework for Land Evaluation. Geoderma 1996, 72, 165–202. [Google Scholar] [CrossRef]
- FAO (Food and Agriculture Organization). Guidelines: Land Evaluation for Irrigated Agriculture; Soils Bulletin 55; FAO: Rome, Italy, 1985. [Google Scholar]
- FAO (Food and Agriculture Organization). Guidelines for Land-Use Planning; FAO Development Series 1; FAO: Rome, Italy, 1993; p. 96. [Google Scholar]
- Sys, C.; Van Ranst, E.; Debaveye, J. Land Evaluation. Part 3: Crop Requirements; Agricultural Publications, General Administration of Development Cooperation: Belgium, Brussels, 1993; p. 199. [Google Scholar]
- Rossiter, D.G. ALES (Automated Land Evaluation System): A framework for land evaluation using a microcomputer. Soil Use Manag. 1990, 6, 7–20. [Google Scholar] [CrossRef]
- De la Rosa, D.; Moreno, J.A.; Garcia, L.V.; Almorza, J. MicroLEIS: A microcomputer-based Mediterranean land evaluation information system. Soil Use Manag. 1992, 8, 89–96. [Google Scholar] [CrossRef]
- De la Rosa, D.; Mayol, F.; Diaz-Pereira, E.; Fernandez, M. Aland evaluation decision support system (MicroLEIS DSS) for agricultural soil protection. Environ. Model. Softw. 2004, 19, 929–942. [Google Scholar] [CrossRef]
- Wenkel, K.O.; Berg, M.; Mirschel, W.; Wieland, R.; Nendel, C.; Köstner, B. LandCaRe DSS—An interactive decision support system for climate change impact assessment and the analysis of potential agricultural land use adaptation strategies. J. Environ. Manag. 2013, 127, S168–S183. [Google Scholar] [CrossRef] [PubMed]
- Pereira, P.; Brevik, E.; Munoz-Rojas, M.; Miller, B.; Smetanova, A.; Depellegrin, D.; Misiune, I.; Novara, A.; Cerda, A. Soil mapping and process modelling for sustainable land management. In Soil Mapping and Process Modelling for Sustainable Land Use Management; Pereira, P., Brevik, E., Munoz-Rojas, M., Miller, B., Eds.; Elsevier: Amsterdam, The Netherland, 2017; pp. 29–60. ISBN 9780128052006. [Google Scholar]
- Pereira, P.; Brevik, E.; Trevisani, S. Mapping the Environment. Sci. Total Environ. 2018, 610, 17–23. [Google Scholar] [CrossRef] [PubMed]
- Muñoz-Rojas, M.; Doro, L.; Ledda, L.; Francaviglia, R. Application of CarboSOIL model to predict the effects of climate change on soil organic carbon stocks in agro-silvo-pastoral Mediterranean management. Agric. Ecosyst. Environ. 2015, 202, 8–16. [Google Scholar] [CrossRef]
- Muñoz-Rojas, M.; Jordán, A.; Zavala, L.M.; De la Rosa, D.; Abd-Elmabod, S.K.; Anaya-Romero, M. Impact of land use and land cover changes on organic carbon stocks in Mediterranean soils (1956–2007). Land Degrad. Dev. 2015, 26, 168–179. [Google Scholar]
- Muñoz-Rojas, M.; Abd-Elmabod, S.K.; Zavala, L.M.; De la Rosa, D.; Jordán, A. Climate change impacts on soil organic carbon stocks of Mediterranean agricultural areas: A case study in Northern Egypt. Agric. Ecosyst. Environ. 2017, 238, 142–152. [Google Scholar] [CrossRef]
- De la Rosa, D. Soil Survey and Evaluation of Guadalquivir River Terraces, in Sevilla Province; Cent. Edaf. Cuarto Pub.: Seville, Spain, 1974. [Google Scholar]
- Farroni, A.; Magaldi, D.; Tallini, M. Total sediment transport by the rivers of Abruzzi (Central Italy): Prediction with the RAIZAL model. Bull. Eng. Geol. Environ. 2002, 61, 121–127. [Google Scholar]
- Erdogan, H.E.; Yüksel, M.; De La Rosa, D. Evaluation of Sustainable Land Management Using Agro-Ecological Evaluation Approach in Ceylanpınar State Farm (Turkey). Turk. J. Agric. For. 2003, 27, 15–22. [Google Scholar]
- López García, J.; Acosta, R.; Bojórquez Serrano, J.I. Aptitud relativa agrícola del municipio de Tuxpan, Nayarit, utilizando el modelo Almagra del Sistema MicroLEIS. Investig. Geogr. 2006, 59, 59–73. [Google Scholar] [CrossRef]
- Darwish, K.M.; Wahba, M.M.; Awad, F. Agricultural Soil Suitability of Haplo-Soils for Some Crops in Newly Reclaimed Areas of Egypt. Appl. Sci. Res. 2006, 12, 1235–1243. [Google Scholar]
- Bakr, N.; Bahnassy, M.H.; El-Badawi, M.M.; Ageeb, G.W.; Weindorf, D.C. Land capability evaluation in newly reclaimed areas: A case study in Bustan 3 area, Egypt. Soil Sur. Horiz. 2009, 51, 90–95. [Google Scholar] [CrossRef]
- Shahbazi, F.; De la Rosa, D.; Anaya-Romero, M.; Jafarzade, A.; Sarmadian, F.; Neyshaboury, M.; Oustam, S. Land use planning in Ahar area (Iran) using MicroLEIS DSS. Int. Agrophys. 2010, 22, 277–286. [Google Scholar]
- Muñoz-Rojas, M.; Jordán, A.; Zavala, L.M.; González-Peñaloza, F.A.; De la Rosa, D.; Pino-Mejias, R.; Anaya-Romero, M. Modelling soil organic C stocks in climate change scenarios: A CarboSOIL model application. Biogeosciences 2013, 10, 8253–8268. [Google Scholar]
- Abd-Elmabod, S.K.; Jordán, A.; Fleskens, L.; Phillips, J.D.; Muñoz-Rojas, M.; Van der Ploeg, M.; Anaya-Romero, M.; De la Rosa, D. Modelling agricultural suitability along soil transects under current conditions and improved scenario of soil factors. In Soil Mapping and Process Modeling for Sustainable Land Use Management; Elsevier: Amsterdam, The Netherland, 2017; pp. 193–219. ISBN 9780128052006. [Google Scholar]
- ASRT (Academy of Scientific Research and Technology). Preparation of Land Data Base for Agriculture Use” Fifth Report; ASRT: Cairo, Egypt, 2009. [Google Scholar]
- Soil Survey Staff. Keys to Soil Taxonomy, 12th ed.; United States Department of Agriculture, Natural Resources Conservation Service: Washington, DC, USA, 2014.
- Haroun, O.R. Soil Evaluation Systems as a Guide to Identify an Economical Feasibility Study for Agricultural Purposes in El-Fayoum Province, Egypt. Ph.D. Thesis, Faculty of Agriculture, El-Fayoum Cairo University, El-Fayoum, Egypt, 2004. [Google Scholar]
- Ali, R.R. Geomatics Based Soil Mapping and degradation risk Assessment of the Cultivated Land in El-Fayoum Depression Egypt. J. Soil Sci. 2005, 45, 349–360. [Google Scholar]
- CLAC (Central Laboratory for Agricultural Climate). The Climatic Normals-El Fayoum Station; Annual Report; Central Laboratory for Agricultural Climate CLAC: Cairo, Egypt, 2010. [Google Scholar]
- De la Rosa, D.; Cardona, F.; Paneque, G. Evaluación de suelos para diferentes usos agrícolas. Un sistema desarrollado para regiones mediterráneas. Anales de Edafología y Agrobiología 1977, 36, 1100–1112. [Google Scholar]
- Manna, P.; Basile, A.; Bonfante, A.; De Mascellis, R.; Terribile, F. Comparative Land Evaluation approaches: An itinerary from FAO framework to simulation modelling. Geoderma 2009, 150, 367–378. [Google Scholar] [CrossRef]
- De la Rosa, D.; Anaya-Romero, M.; Diaz-Pereira, E.; Heredia, N.; Shahbazi, F. Soil-Specific Agro-Ecological Strategies for Sustainable Land Use-A Case Study by Using MicrolEIS DSS in Sevilla Province (Spain). Land Use Policy 2009, 26, 1055–1065. [Google Scholar] [CrossRef]
- Aldabaa, A.A.; HaiLin, Z.; Shata, A.; El-Sawey, S.; Abdel-Hameed, A.; Schroder, J.L. Land suitability classification of a desert area in Egypt for some crops using MicrolEIS program. Am.-Eurasian J. Agric. Environ. Sci. 2010, 8, 80–94. [Google Scholar]
- Darwish, K.M.; Kawy, W.A. Land suitability decision support for assessing land use changes in areas west of Nile Delta, Egypt. Arab. J. Geosci. 2014, 7, 865–875. [Google Scholar] [CrossRef]
- ESRI (Environmental Systems Research Institute). ArcGIS Desktop: Release 10.4; Environmental Systems Research Institute: Redlands, CA, USA, 2016. [Google Scholar]
- Shendi, M.M. Pedological Studies on Soils Adjacent to Qarun Lake, Fayoum Governorate, Egypt. Master’s Thesis, Faculty of Agriculture, Cairo University, Giza, Egypt, 1984. [Google Scholar]
- Soil Survey Division Staff. Soil survey manual. In U.S. Department of Agriculture Handbook 18; Soil Conservation Service: Washington, DC, USA, 1993. [Google Scholar]
- IUSS (International Union of Soil Sciences); ISRIC (ISRIC World Soil Information); FAO (Food and Agriculture Organization). World Reference Base for Soil Resources and Communication; World Soil Resources Report 103; International Union of Soil Sciences, ISRIC World Soil Information, FAO: Rome, Italy, 2006. [Google Scholar]
- IBM SPSS. IBM SPSS Statistics for Windows, Version.23.0; IBM Corp.: Armonk, NY, USA, 2015. [Google Scholar]
- Zalacáin, D.; Martínez-Pérez, S.; Bienes, R.; García-Díaz, A.; Sastre-Merlín, A. Salt accumulation in soils and plants under reclaimed water irrigation in urban parks of Madrid (Spain). Agric. Water Manag. 2019, 213, 468–476. [Google Scholar] [CrossRef]
- Qadir, M.; Schubert, S. Degradation processes and nutrient constraints in sodic soils. Land Degrad. Dev. 2002, 13, 275–294. [Google Scholar] [CrossRef]
- Jacobsen, S.E.; Jensen, C.R.; Liu, F. Improving crop production in the arid Mediterranean climate. Field Crops Res. 2012, 128, 34–47. [Google Scholar] [CrossRef]
- Balks, M.R.; Bond, W.J.; Smith, C.J. Effects of sodium accumulation on soil physical properties under an effluent-irrigated plantation. Soil Res. 1998, 36, 821–830. [Google Scholar] [CrossRef]
- Paes, J.L.; Ruiz, H.A.; Fernandes, R.B.; Freire, M.B.; Barros, M.D.; Rocha, G.C. Hydraulic conductivity in response to exchangeable sodium percentage and solution salt concentration. Revista Ceres 2014, 61, 715–722. [Google Scholar] [CrossRef]
- Rasouli, F.; Pouya, A.K.; Karimian, N. Wheat yield and physico-chemical properties of a sodic soil from semi-arid area of Iran as affected by applied gypsum. Geoderma 2013, 193, 246–255. [Google Scholar] [CrossRef]
- Temiz, C.; Cayci, G. The effects of gypsum and mulch applications on reclamation parameters and physical properties of an alkali soil. Environ. Monit. Assess. 2018, 190, 347. [Google Scholar] [CrossRef] [PubMed]
- Anikwe, M.A.N.; Ibudialo, E.A.N. Influence of lime and gypsum application on soil properties and yield of cassava (Manihot esculenta Crantz.) in a degraded Ultisol in Agbani, Enugu Southeastern Nigeria. Soil Till. Res. 2016, 158, 32–38. [Google Scholar] [CrossRef]
- Abrol, I.P.; Jai Singh, P.Y.; Massoud, F.I. Salt-Affected Soils and Their Management; No. 39; Food & Agriculture Org.: Rome, Italy, 1988. [Google Scholar]
- Chang, X.; Gao, Z.; Wang, S.; Chen, H. Modelling long-term soil salinity dynamics using SaltMod in Hetao Irrigation District, China. Comput. Electron. Agric. 2019, 156, 447–458. [Google Scholar] [CrossRef]
- Hu, Z.Y.; Zaho, F.J.; McGrath, S.P. Sulphur fractionation in calcareous soils and bioavailability to plants. Plant Soil 2005, 268, 103–109. [Google Scholar] [CrossRef]
- Yazdanpanah, N.; Mahmoodabadi, M.; Cerdà, A. The impact of organic amendments on soil hydrology, structure and microbial respiration in semiarid lands. Geoderma 2016, 266, 58–65. [Google Scholar] [CrossRef]
- Assefa, T.; Jha, M.; Reyes, M.; Worqlul, A.W. Modeling the Impacts of Conservation Agriculture with a Drip Irrigation System on the Hydrology and Water Management in Sub-Saharan Africa. Sustainability 2018, 10, 19. [Google Scholar] [CrossRef]
- Park, T.W.; Kim, H.J.; Tanvir, M.T.; Lee, J.B.; Moon, S.G. Influence of coarse particles on the physical properties and quick undrained shear strength of fine-grained soils. Geomech. Eng. 2018, 14, 99–105. [Google Scholar]
- Feng, W.Q.; Li, C.; Yin, J.H.; Chen, J.; Liu, K. Physical model study on the clay–sand interface without and with geotextile separator. Acta Geotech. 2019, 1–17. [Google Scholar] [CrossRef]
- Valipour, M. Drainage, waterlogging, and salinity. Arch. Agron. Soil Sci. 2014, 60, 1625–1640. [Google Scholar] [CrossRef]
- Ali, R.R.; Abdel Kawy, W.A. Land degradation risk assessment of El Fayoum depression, Egypt. Arab J. Geosci. 2013, 6, 2767–2776. [Google Scholar] [CrossRef]
- Abd-Elmabod, S.K. Evaluation of Soil Degradation and Land Capability in Mediterranean Areas under Climate and Management Change Scenarios: (Andalusia Region, Spain and El-Fayoum Province, Egypt). Ph.D. Thesis, Universidad de Sevilla, Sevilla, Spain, 2014. [Google Scholar]
- Amin, A.A.; Gergis, M.F. Integrated management strategies for control of cotton key pests in middle Egypt. Agron. Res. 2006, 4, 121–128. [Google Scholar]
- Manrique, L.A.; Uehara, G. A Proposed Land Suitability Classification for Potato: I. Methodology 1. Soil Sci. Soc. Am. J. 1984, 48, 843–847. [Google Scholar] [CrossRef]
- Abagyeh, S.O.; Idoga, S.; Agber, P.I. Land suitability evaluation for maize (Zea mays) production in selected sites of the Mid-Benue valley, Nigeria. IJAPR 2016, 4, 46–51. [Google Scholar]
- Akinrinde, E.A.; Bello, O.S.; Ayegboyin, K.O.; Iroh, L. Added benefits of combined organic and mineral phosphate fertilizers applied to maize and melon. J. Food Agric. Environ. 2005, 3, 75. [Google Scholar]
- Kavvadias, V.; Papadopoulou, M.; Vavoulidou, E.; Theocharopoulos, S.; Repas, S.; Koubouris, G.; Psarras, G.; Kokkinos, G. Effect of addition of organic materials and irrigation practices on soil quality in olive groves. J. Water Clim. Chang. 2018, 9, 775–785. [Google Scholar] [CrossRef]
- Jafarzadeh, A.A.; Abbasi, G. Qualitative land suitability evaluation for the growth of onion, potato, maize, and alfalfa on soils of the Khalat pushan research station. Biologia 2006, 61, S349–S352. [Google Scholar] [CrossRef]
- Ashraf, S.; Afshari, H.; Munokyan, R.; Ebadi, A.G. Multicriteria land suitability evaluation for barley by using GIS in Damghan plain (Northeast of Iran). J. Food Agric. Environ. 2010, 8, 626–628. [Google Scholar]
- El-Aziz, S.H. Evaluation of land suitability for main irrigated crops in the North-Western Region of Libya. Eurasian J. Soil Sci. 2018, 7, 73–86. [Google Scholar] [CrossRef]
- Doolittle, J.; Dobos, R.; Peaslee, S.; Waltman, S.; Benham, E.; Tuttle, W. Revised Ground-Penetrating Radar Soil Suitability Maps. J. Environ. Eng. Geophys. 2010, 15, 111–118. [Google Scholar] [CrossRef]
- Ennaji, W.; Barakat, A.; El Baghdadi, M.; Oumenskou, H.; Aadraoui, M.; Karroum, L.A.; Hilali, A. GIS-based multi-criteria land suitability analysis for sustainable agriculture in the northeast area of Tadla plain (Morocco). J. Earth Syst. Sci. 2018, 127, 14. [Google Scholar] [CrossRef]
- Salkovic, E.; Djurovic, I.; Knezevic, M.; Popovic-Bugarin, V.; Topalovic, A. Digitization and Mapping of National Legacy Soil Data of Montenegro. Soil Water Res. 2018, 13, 83–89. [Google Scholar] [CrossRef]
- Liu, Y.-S.; Wang, J.-Y.; Guo, L.-Y. GIS-based assessment of land suitability for optimal allocation in the Qinling Mountains, China. Pedosphere 2006, 16, 579–586. [Google Scholar] [CrossRef]
- Safari, Y.; Esfandiarpour-Boroujeni, I.; Kamali, A.; Salehi, M.H.; Bagheri-Bodaghabadi, M. Qualitative land suitability evaluation for main irrigated crops in the shahrekord plain, Iran: A geostatistical approach compared with conventional method. Pedosphere 2013, 23, 767–778. [Google Scholar] [CrossRef]
- Lara-Estrada, L.D.; Rasche, L.; Schneider, U. Modeling land suitability for Coffea arabica L. in Central America. Environ. Model. Softw. 2017, 95, 96–209. [Google Scholar] [CrossRef]
- Zabihi, H.; Ahmad, A.; Vogeler, I.; Said, M.N.; Golmohammadi, M.; Golein, B.; Nilashi, M. Land suitability procedure for sustainable citrus planning using the application of the analytical network process approach and GIS. Comput. Electron. Agric. 2015, 117, 114–126. [Google Scholar] [CrossRef]
- Zhang, J.; Su, Y.; Wu, J.; Liang, H. GIS based land suitability assessment for tobacco production using AHP and fuzzy set in Shandong province of China. Comput. Electron. Agric. 2015, 114, 202–211. [Google Scholar] [CrossRef]
- Bo, L.; Zhang, F.; Zhang, L.W.; Huang, J.F.; Zhi-Feng, J.I.; Gupta, D.K. Comprehensive suitability evaluation of tea crops using GIS and a modified land ecological suitability evaluation model. Pedosphere 2012, 22, 122–130. [Google Scholar]


© 2019 by the authors. Licensee MDPI, Basel, Switzerland. This article is an open access article distributed under the terms and conditions of the Creative Commons Attribution (CC BY) license (http://creativecommons.org/licenses/by/4.0/).