Article

Introducing Temperature as Variable Parameter into Kinetic Models for Anaerobic Fermentation of Coffee Husk, Pulp and Mucilage

1
Tropics and Subtropics Group(440e), Institute of Agricultural Engineering, University of Hohenheim, 70599 Stuttgart, Germany
2
State Institute of Agricultural Engineering and Bioenergy, University of Hohenheim, 70599 Stuttgart, Germany
*
Author to whom correspondence should be addressed.
Appl. Sci. 2019, 9(3), 412; https://doi.org/10.3390/app9030412
Submission received: 12 December 2018 / Revised: 13 January 2019 / Accepted: 17 January 2019 / Published: 26 January 2019
(This article belongs to the Section Energy Science and Technology)

Abstract

:
Primary coffee processing generates important by-products—the pulp, husk and mucilage—while producing the green coffee beans. These by-products represent a large quantity of biomass and might create an adverse impact on environment if they are left to uncontrolled natural decay. In this study, the bio-methane formation potential of coffee husk, pulp and mucilage was examined in batch assays performed at 21 °C, 30 °C and 37 °C. The mean specific methane yield (SMY) from husk, pulp, and mucilage were 159.4, 244.7 and 294.5 L kg−1 volatile solids(VS), respectively, for a fermentation temperature of 37 °C; 156.8, 234.8 and 287.1 L kg−1 VS, respectively, for 30 °C; and 139.9, 196.2 and 255.9 L kg−1 VS, respectively, for 21°C. Two kinetic models, namely, the modified Logistic model (LOG) and the modified Gompertz model (GOM), were applied to fit experimental data and the respective kinetic constants were generated. Both models exhibited a very good fit to the measured data points (R2 > 0.987). The relationship of kinetic constants of substrates with fermentation temperatures was established and inserted into the LOG and GOM models; thus, generalized LOG and GOM models were obtained to predict SMY of the substrates at any temperature between 21 °C and 37 °C.

Graphical Abstract

1. Introduction

Coffee is processed in two stages: primary and secondary. Primary coffee processing includes all tasks from picking the coffee cherries to the production of green beans, and is often performed on site in coffee growing countries. During the secondary processing step, green beans are processed further into roasted or soluble coffee [1]. Primary coffee processing can be performed according to two different methods: either the wet or the dry method. For wet processing, the ripe fresh cherries are selectively picked from the tree and then pulped to remove skin and pulp (43.2% w/w) in one fraction, as well as mucilage and soluble sugars (11.8% w/w) in a second fraction, and finally the parchment (6.1% w/w) [2]. For dry processing, the cherries, regardless of their state of ripeness (ripe, unripe and overripe), are harvested simultaneously by stripping them from the branches, thus demanding less labor than the wet method. The whole cherries are dried for 3–4 weeks to reach a moisture content of 10–11% [3,4]. The husk is mechanically separated from the beans as a single-fraction comprising the outer skin, pulp, mucilage and parchment. The husk accounts for about half the weight of the dried cherries. Both wet and dry processing generate huge amounts of biomass by-products, which are often dumped into the hosting environment, thus causing severe environmental problems, and exposing neighboring populations to offensive odor, health risks, and the proliferation of insects [1,5,6]. The by-products, however, could be utilized employing proven biomass conversion technologies to produce renewable energy carriers, like biogas, ethanol, and biodiesel [7,8]. Biogas technology plays a vital role in sustainable environmental management and the proper handling of agro-industrial by-products [9].
The biogas yield from coffee processing by-products has been investigated by many researchers, but the bio-methane yield potential reported varies significantly [10,11,12,13]. Mixing different parts of the coffee by-products as a feedstock to a digester improve the bio-methane yield by buffering acid accumulation and supplementing of trace elements [14].
The rate and extent of bio-degradation are crucial in the anaerobic fermentation of agricultural residues, which in turn depends on the content and properties of lignocellulose and other factors (pH, temperature, moisture etc.) [15]. However, in a first approximation, lignin content has been proven to adequately predict the methane potential from agro-industrial wastes [16].
The modified Gompertz and logistic equations are the most widely used kinetic models in anaerobic fermentation to demonstrate bio-methane production. Several researchers applied the modified Gompertz model to fit experimental datasets from vinasse [17], cattle manure [18], municipal solid waste [19], water hyacinth [20] and poultry manure [21]. Likewise, the modified Logistic models have also been applied for different substrates [17,22,23]. The cumulated biogas yield from both models exhibits a sigmoidal shape. The S-shaped curve produced by the Gompertz model is asymmetrical while the Logistic model is symmetrical about their points of inflection [24,25]. Temperature is one of the most influential parameters in anaerobic digestion. It affects the growth and metabolic activities of microorganisms [26]. Anaerobic microorganisms function under three temperature ranges: psychrophilic (< 20 °C), mesophilic (20–45 °C) and thermophilic (45–60 °C). Rapid temperature change (±2 °C h−1) is harmful to methanogens, especially for the thermophile consortia [27]. Several models are applied to describe the effect of temperature on the rate of anaerobic fermentation. The Arrhenius model, for instance, was applied to estimate bacterial growth and product formation rate. However, the limitation of the model was the indefinite increase of the growth rate with increasing temperatures. The Ratkowsky models, however, predict that the bacterial growth rate increases with increasing temperatures from the initial to the optimum temperature and decreases when the temperature increases further [28]. Ying Jin, et al. [29] reported that the effect of temperature on the methane yield was insignificant at lower temperatures.
Models describing the kinetics of batch anaerobic digestion have been reviewed by researchers dealing with animal nutrition, biogas and landfill gas production [30]. In bio-methane potential (BMP) assays, biogas production is influenced mainly by the substrate degradation rate, as well as by the growth of microorganism populations, subsequently showing a lag-, growth- and asymptotic phase [31]. However, none of those models has considered temperature as a variable input parameter so far. The objective of this study was to determine the bio-methane yield of coffee husk, pulp and mucilage at fermentation temperatures of 21 °C, 30 °C and 37 °C, and to introduce temperature as an input parameter into two kinetic models, which are frequently used in biogas studies: the modified Gompertz model and the modified Logistic model.

2. Materials and Methods

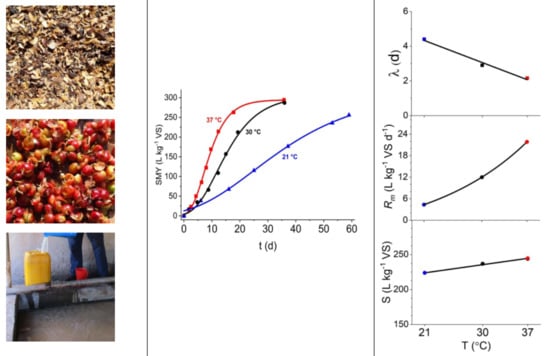
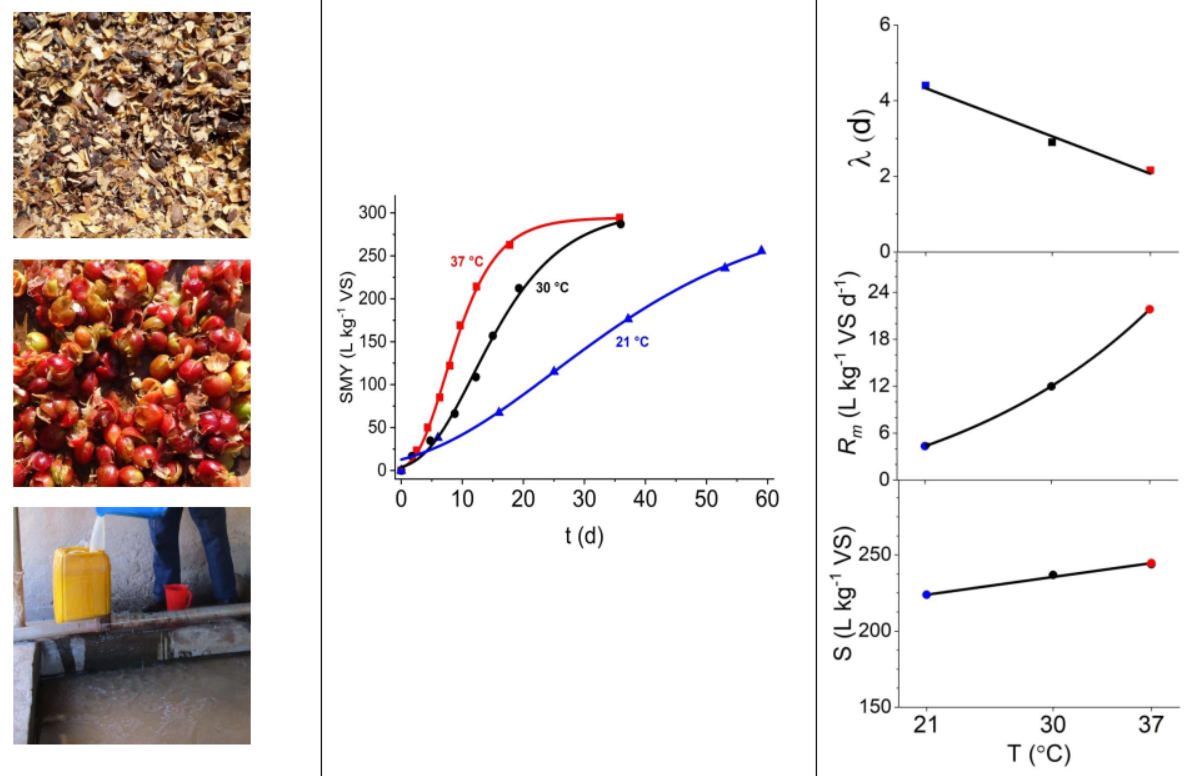
2.1. Raw Materials and Inoculum

The coffee husk, pulp and mucilage were collected from Gomma-2 estate coffee farm (7°55’16.32”N, 36°37’06.62”E) Jimma Zone, Oromia regional state, about 400 km south-west of Addis Ababa, Ethiopia. Gomma-2 coffee farm is one of the six Limmu coffee farms. The total area of the farm is 1495 ha, of which 1118 ha are covered with coffee trees. The farm is at moderate altitude (1500–1600 m a.s.l.) and receives 1380 mm of annual rainfall. The annual temperatures of some coffee growing areas in Ethiopia are presented in Table 1 [32]. It indicates the importance to investigate the bio-methane formation of coffee by-products at temperatures similar to the climatic conditions of the coffee growing areas..
The pulp was collected immediately after pulping of the cherries. The sample was piled and divided into four quarters. The opposite quarters were discarded and the remaining quarters taken for drying (according to DIN (Deutsches Institut für Normung) EN 14780). The mucilage was collected from the fermentation pits. The same procedures were followed for sampling. Both samples were collected every other day for a duration of a month. The samples were spread on a plastic sheet and sun dried. The husk was collected without a need of further drying. All samples underwent a size reduction to pass a 1 mm sieve and were shipped to the University of Hohenheim, Germany. The inoculum was obtained from the State Institute of Agricultural Engineering and Bioenergy, University of Hohenheim. It was cultivated in 300 L containers at 37 °C, and revitalized (2–5 Vol%) every 2 months with digestate from several biogas plants, under the institute’s standard procedure for biochemical methane potential (BMP) assays [33]. Prior to the BMP assay, the inoculum was digested for two weeks in order to allow adaptation of the anaerobic bacteria for the specific working temperatures and degassing. The inoculum had a total solids content of 5.0% and a volatile solids content of 61.6% of total solids.

2.2. Chemical Analysis

The proximate analysis (moisture, volatile solids and ash contents) of samples were performed according to DIN EN 14774-3:2010-02, DIN EN 12879::2000 and DIN EN 14775:2010-04, respectively. For the bio-chemical analysis, neutral detergent fiber, acid detergent fiber, acid detergent lignin, and crude fiber contents were determined by the AOAC (Association of Official Analytical Chemists) Official Method 973.18 (FibreBag Analysis System, Gerhardt, Königswinter, Germany). Sugars such as sucrose, glucose and fructose, and organic acids such as lactic acid, formic acid, acetic acid and propionic acid were determined as described by Haag, et al. [35]. The chemical characteristics of husks, pulp and mucilage were already presented in detail in a previous study of the authors [36].

2.3. Anaerobic Batch Digestion Tests

The Hohenheim biogas yield test (HBT) is a laboratory batch method used to determine the biogas and methane yield potential of substrates, following the German Engineers Association (VDI) Guideline 4630 [37] using 100-mL calibrated glass syringes as digesters. The syringes were fitted to a motorized rotor to enable continuous mixing of the samples. The anaerobic fermentation was operated for 60 days at a temperature of 21 °C and for 35 days at 30 °C and 37 °C. The syringes were filled with 30 g of the inoculum and 0.3 g of ground and dried samples [33]. A reference sample (hay) of known biogas and methane yield was used in order to verify the quality of the inoculum and the reliability of the digestion process. The blank variant was filled with about 50 g of inoculum alone. Biogas and methane yields were obtained by deducting the proportional biogas and methane yields from the blank variant. The biogas volume was measured according to the volume difference before and after emptying the gas inside the syringe. The biogas was injected into a methane sensor (Advanced Gasmitter, Pronova, Berlin, Germany), which was calibrated with ambient air and test gas (~60% CH4). The fermentation temperature and ambient air pressure were measured while taking the gas reading and used to normalize the gas yield at standard temperature and pressure (273.15 K, 101.325 kPa). The specific methane yield (L CH4 kg−1 VS) was calculated from the ratio of the net normalized methane yield to the amount of organic dry matter of substrate added in the digester. The biodegradability of substrates was calculated according to the mass ratio of the produced gas to the amount of VS loaded in the digester.

2.4. Data Fitting to Models

2.4.1. Modified Gompertz (GOM) Model

Assuming the kinetics of methane production to be a function of the growth rate of methane-forming bacteria in the batch digester, the volume of methane produced can be estimated with the GOM equation [18] as follows:
M t = S · exp { exp [ R m · e S ( λ t ) + 1 ] }
where Mt is cumulative methane (L kg−1 VS) produced at time t (d), S is the ultimate methane production potential (L kg−1 VS), Rm is maximum daily methane yield (L kg−1 VS d−1), λ is the lag time (d), which is the minimum time necessary to produce methane, and e is 2.7183. The parameters S, Rm and λ are constants that could be determined by applying non-linear regression equations.

2.4.2. Modified Logistic (LOG) Model

The LOG model (Equation (2)) also assumes that the rate of gas production is proportional to the amount of gas already produced, the maximum production rate and the ultimate gas yield [22,38]. The model is characterized by an exponential rise to the maximum and a final stabilization phase. The model comprises the same parameters as the GOM model.
M t = S { 1 + exp ( 4 R m ( λ t ) S + 2 ) }
The two models (LOG and GOM) were fitted to the data (cumulative methane yield and residence time) obtained from the BMP assay. The code was written in MATLAB® R2016b software in order to execute data fitting of models using the Levenberg–Marquardt algorithm [39] with the optimization function [lsqcurvefit]. The iteration process was initiated with arbitrary values of 1, 0 and 0 for S, Rm and λ respectively. Afterwards the kinetic constants were plotted against the temperature for each substrate. Curve fitting was executed on the kinetic constants to establish a mathematical relationship to the temperature. Consequently, the kinetic parameters were inserted to the LOG and GOM models to estimate the methane yield of husks, pulp and mucilage at any temperature ranging from 21 °C through 37 °C.

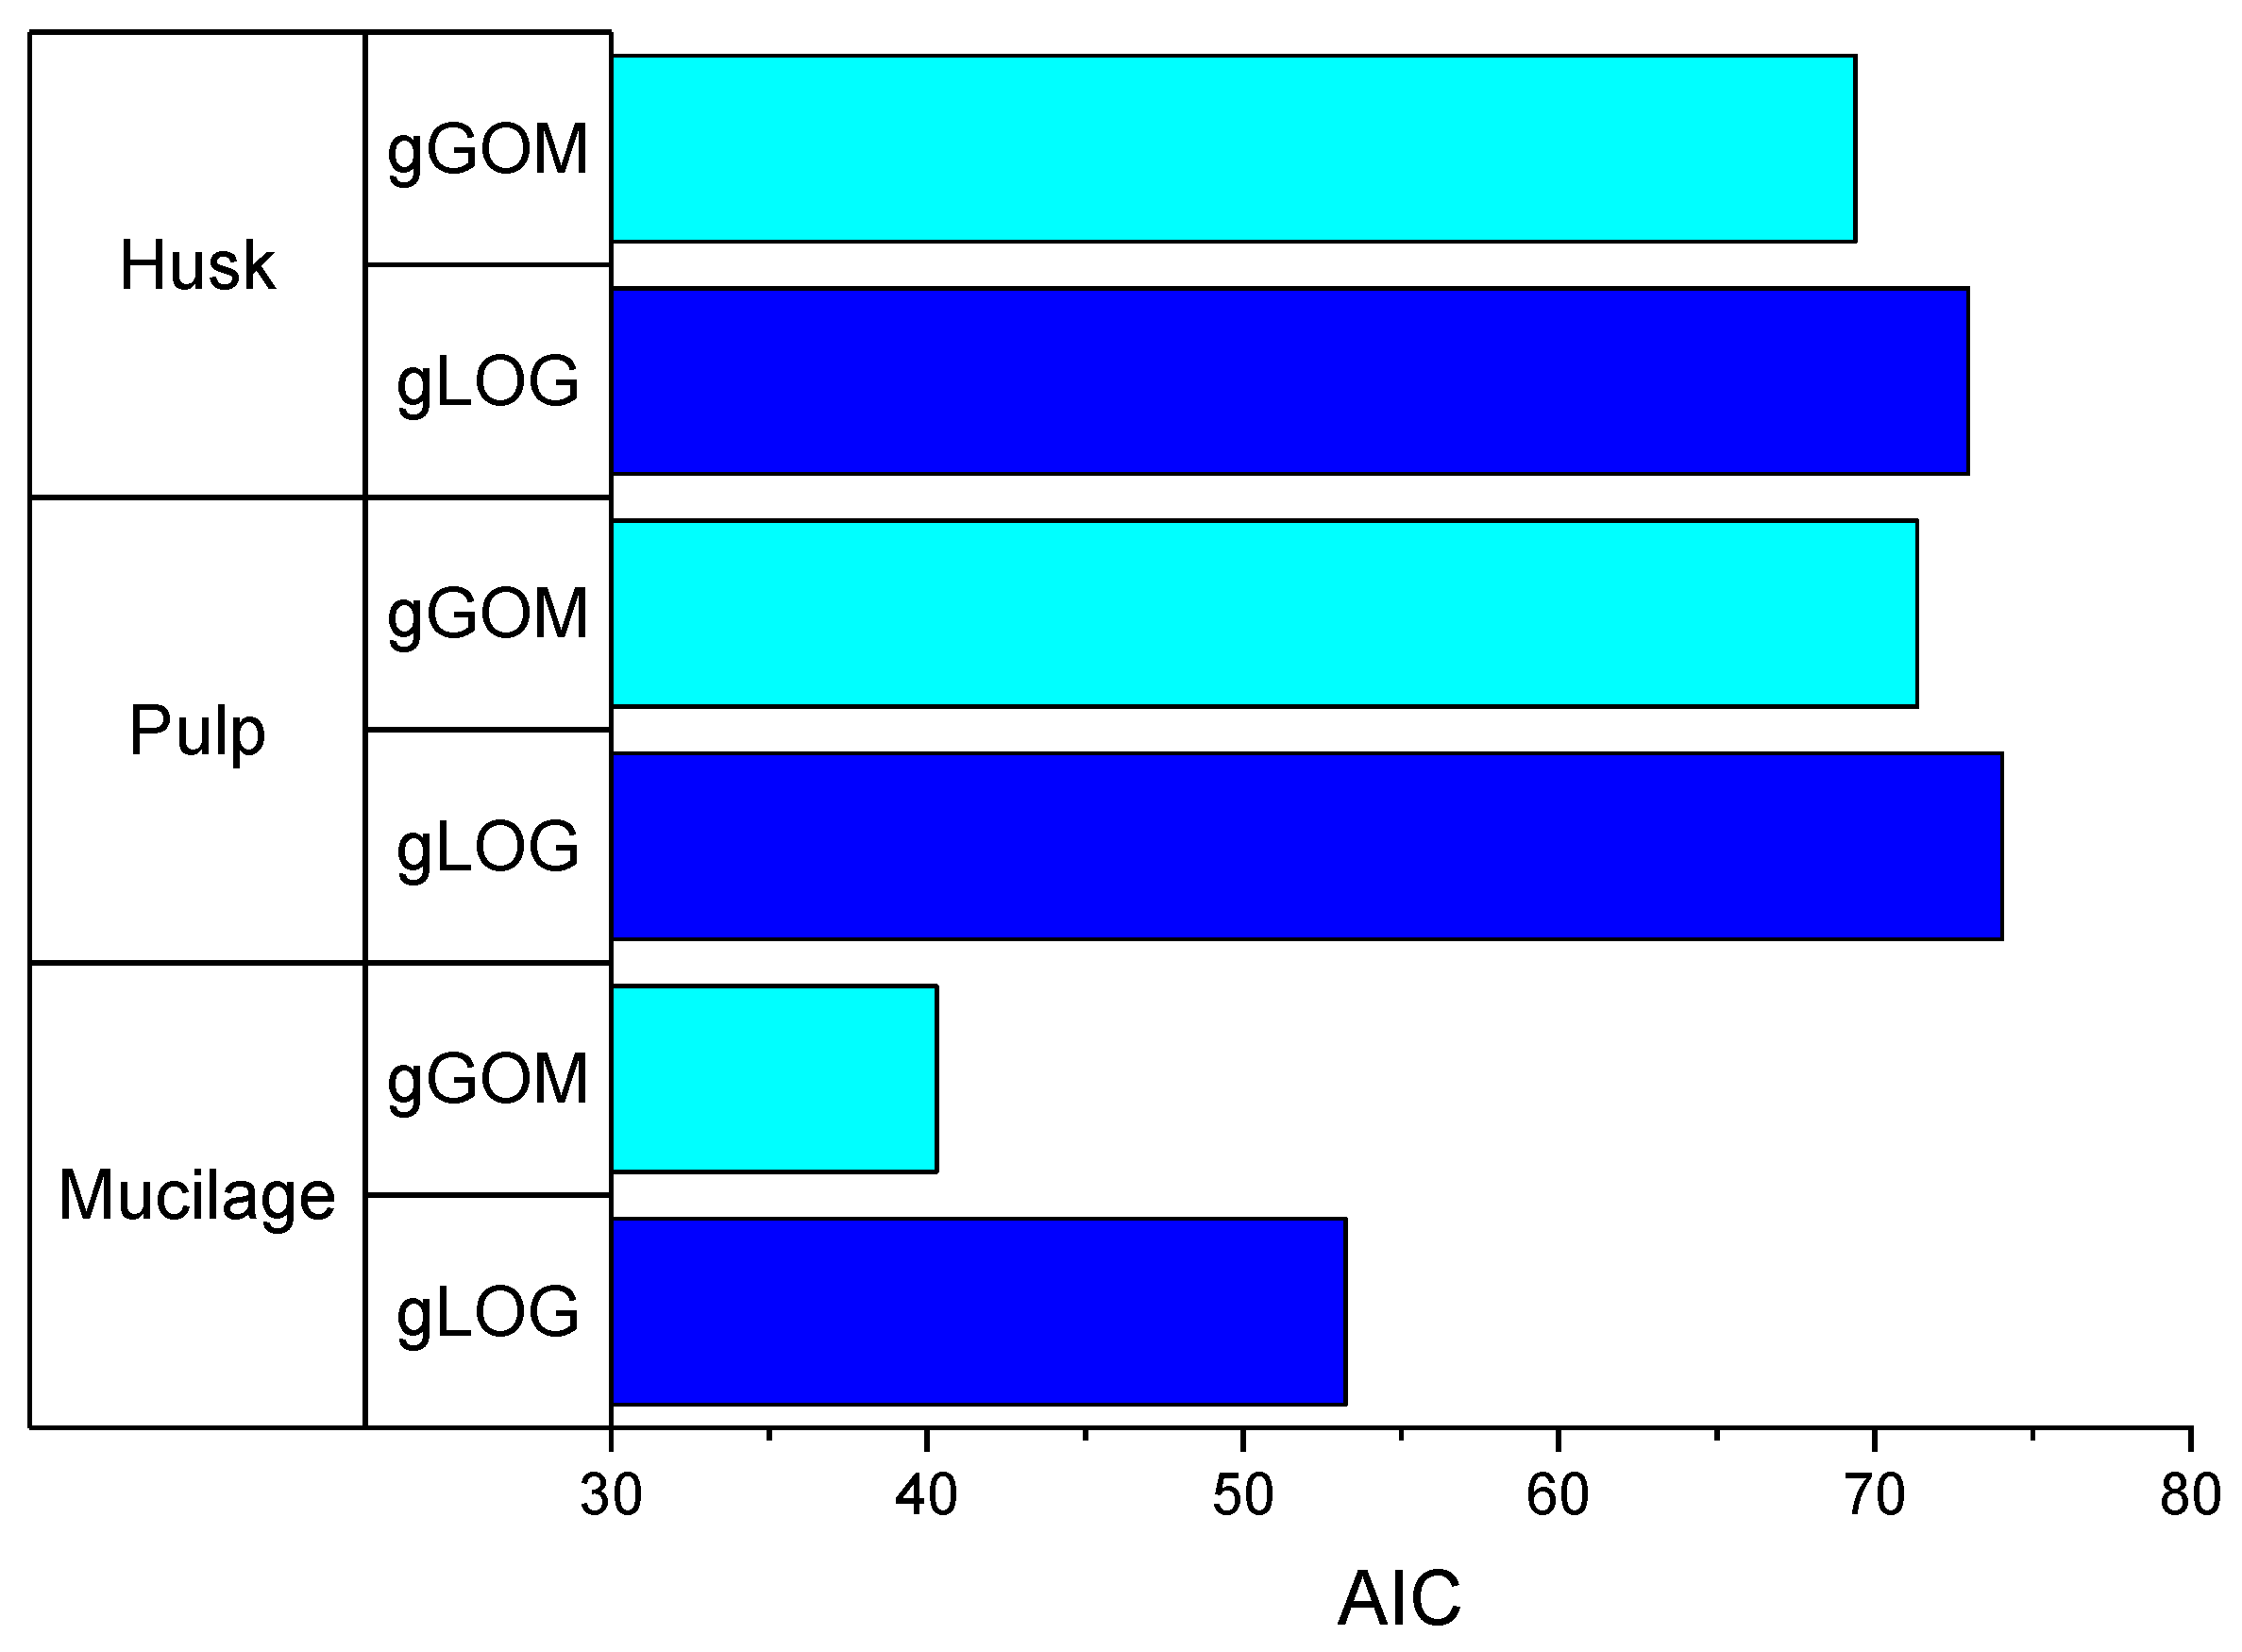
2.5. Statistical Analysis

Graphs were produced and other statistical analyses and data fittings were performed by OriginPro 2017 (OriginLab, Northampton, MA). The statistical parameters applied for evaluating the goodness of fit were: mean absolute error (MAE), residuals (e), and the coefficient of determination (R2) according to Equations (3)–(5).
M A E = 1 n j = 1 n | y j y ^ j |
e = y y ^
R 2 = 1 j = 1 n ( y j y ^ j ) 2 ( y j y ¯ ) 2
where y j is the experimental value for sample j, y ^ j represents the predicted values for sample j, n is the number of samples and y ¯ is the mean of experimental values.
Model selection was made by the Akaike information criterion (AIC) (Equation (6)), which summarizes the fitting of models to the dataset from each substrate:
AIC = n · ln ( R S S n ) + 2 ( N + 1 ) + 2 ( N + 1 ) ( N + 2 ) ( n N 2 )
where n is the number of data points, RSS is the residual sum of squares and N is the number of model parameters. AIC accounts for both the goodness of fit and the number of parameters in the models. Thus, the smaller the AIC value, the more a model is suitable.

3. Results and Discussion

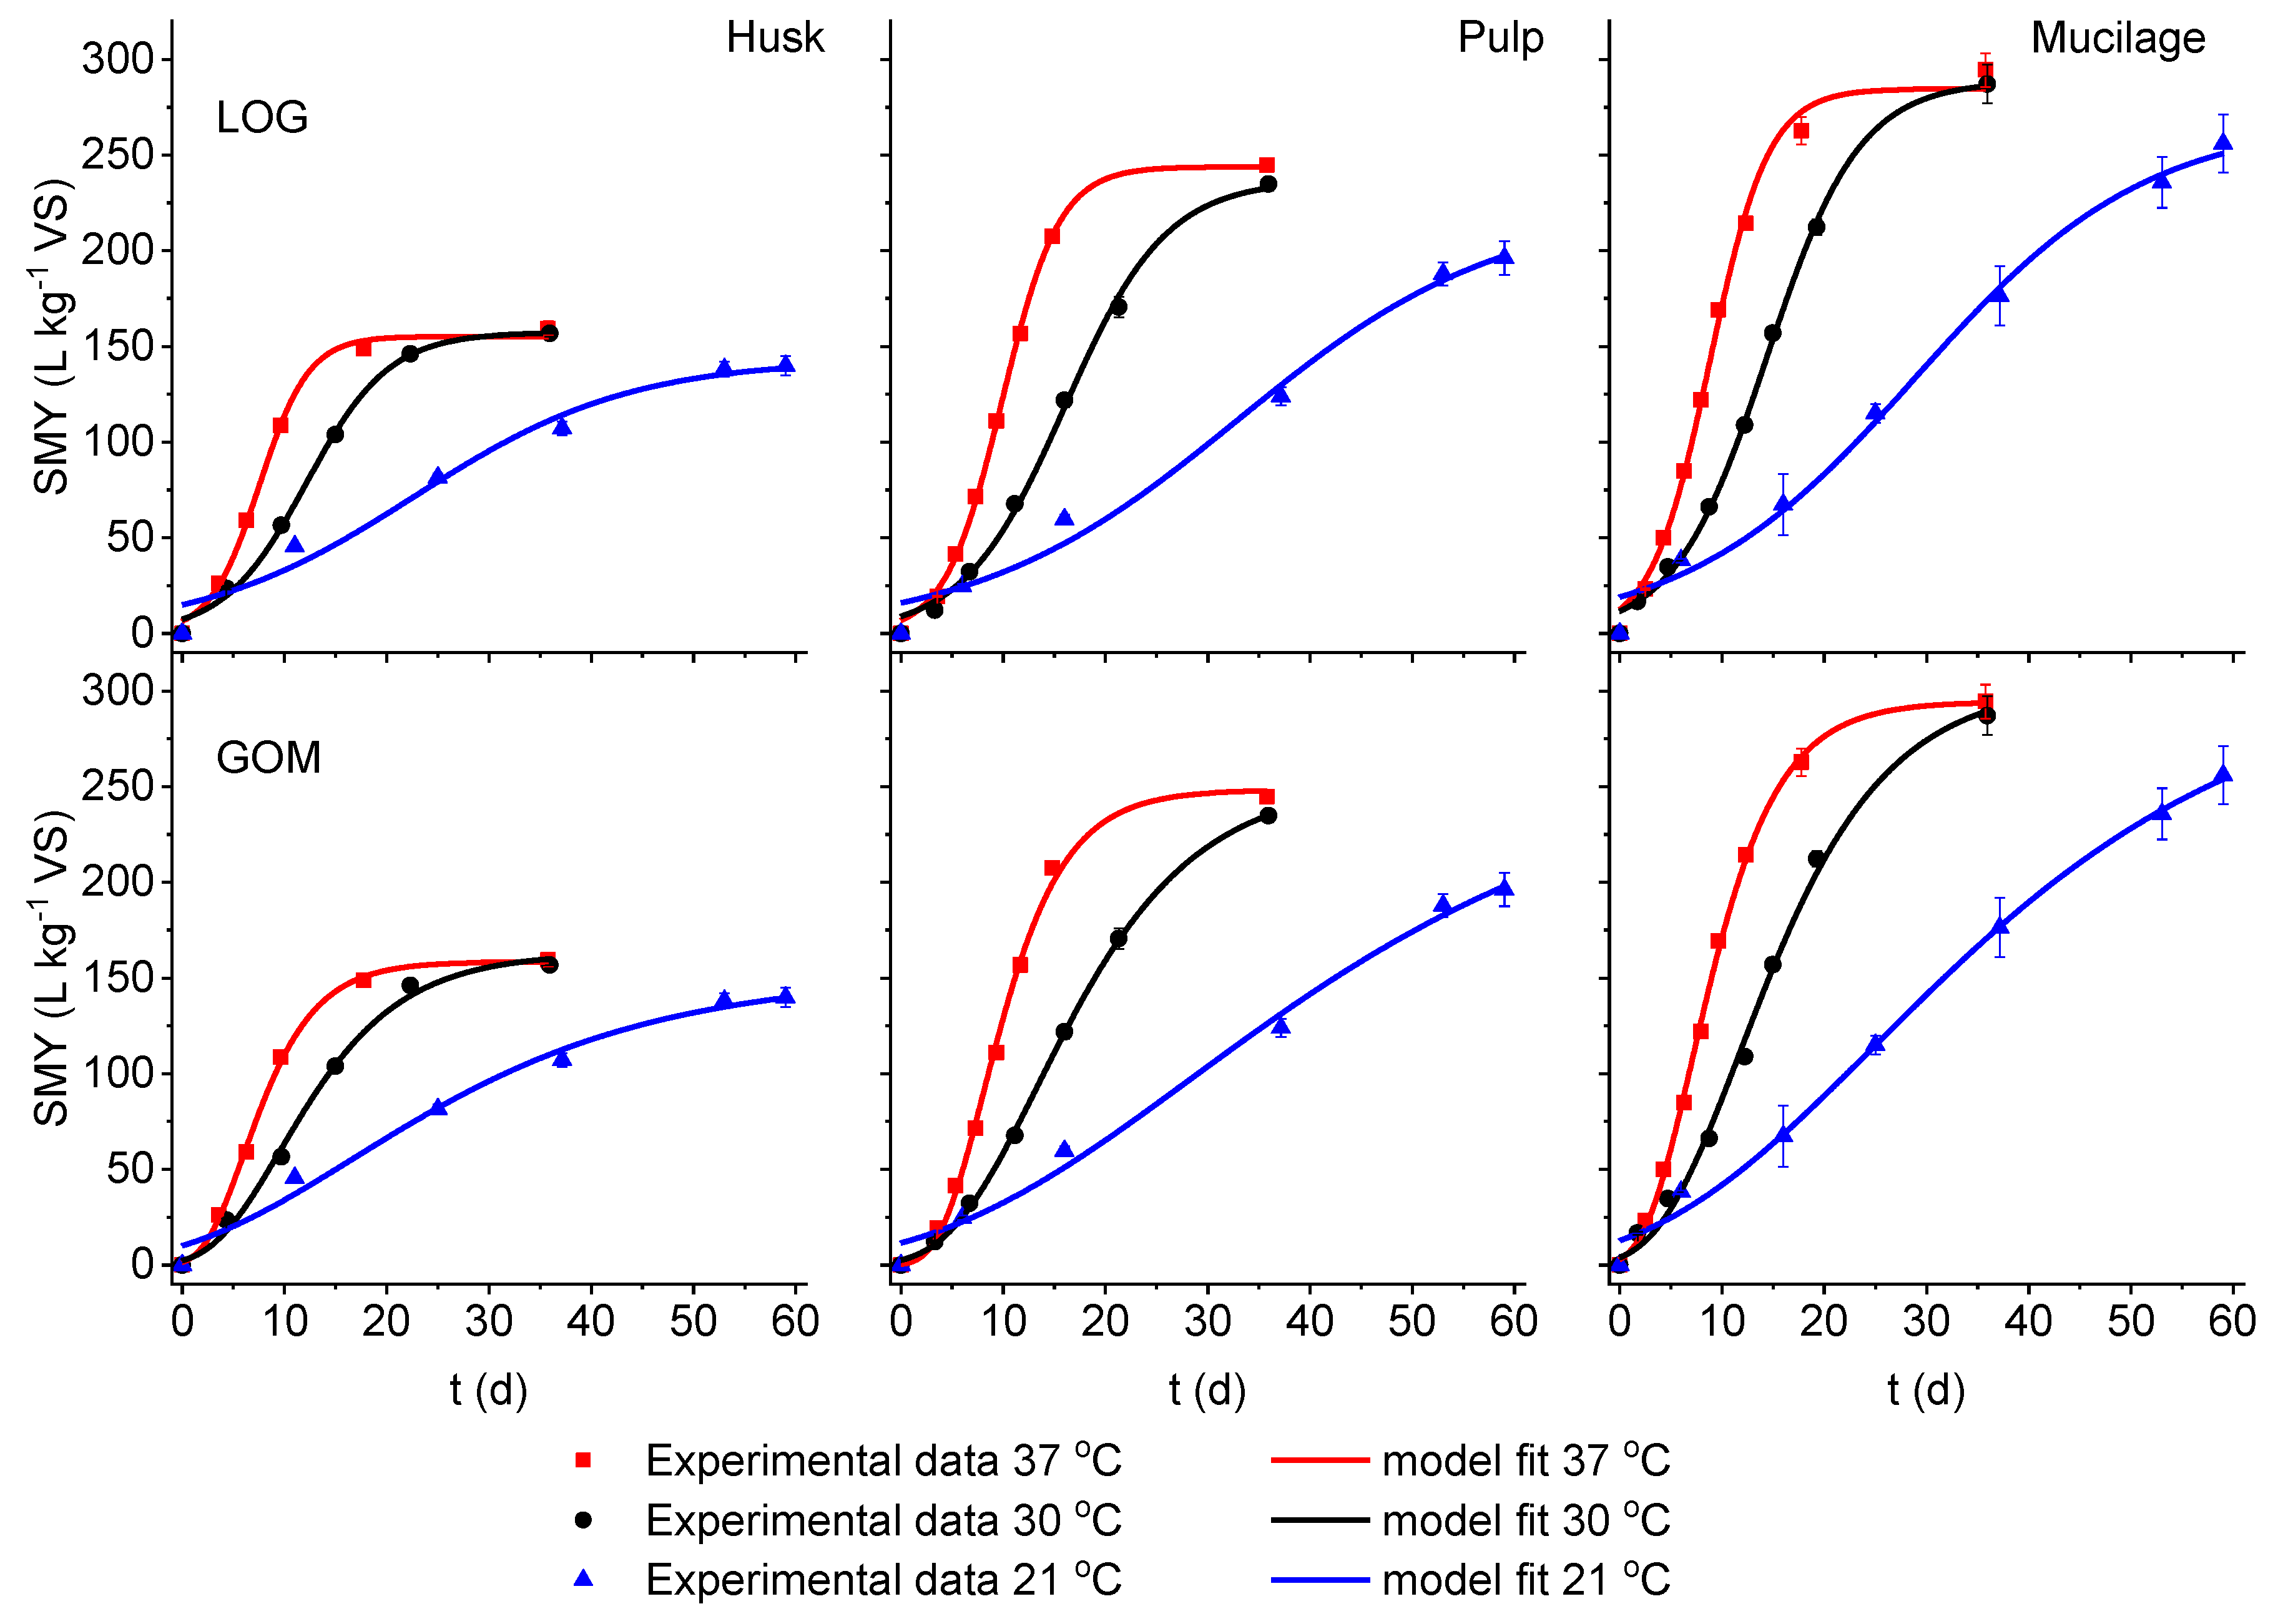
3.1. Model Fitting for Different Fermentation Temperatures

Figure 1 shows the measured methane yield from husks, pulp and mucilage at fermentation temperatures of 21 °C, 30 °C and 37 °C as data points in the course of the anaerobic batch assay. The methane recovery was faster in all batch assays at 37 °C compared to digestions at 30 °C and 21 °C. The specific methane yield (SMY) of substrates at the end of the batch assay was nearly equal for digestions at 30 °C and 37 °C. However, digestion at 21°C showed a slower methane recovery and a lower SMY at the end of the batch assay, even after a residence time of 60 days. The distance of the SMY curves clearly shows that higher fermentation temperatures favor quicker methane recovery. About 90% of the methane potential of pulp was recovered in two, three and seven weeks of the batch assay while digested at 37 °C, 30 °C and 21 °C, respectively. Khan, et al. [40] reported similar results from batch assay of banana stalk digested at 37 °C. The LOG and GOM models were fitted to experimental data points. Both models fit very well to the experimental data.
Table 2 shows the model parameters estimated by non-linear optimization and the goodness of fit. Both models estimated three parameters: the ultimate methane yield (S), maximum daily methane yield (Rm) and lag time (λ).
The LOG and GOM models basically have the same physical parameters, but in different mathematical arrangements. The MAE from the GOM model was less than in the LOG model regardless of substrate type. Furthermore, the MAE showed an increasing trend while fermentation temperatures decreased. This suggests that both models perform very well at an optimal digestion temperature of 37 °C. The GOM model fits very well for experimental data from husks, pulp and mucilage at all operating temperatures. Samples operated at 30 °C exhibited a lower methane production rate (Rm) and higher lag time (λ) than samples evaluated at the other operating temperatures. The pulp exhibited longer lag phases at the beginning of the digestion period. The highest methane yield was predicted from mucilage followed by pulp and husk.
The LOG model predicted the maximum methane production rate (Rm) and lag time (λ) higher than that of the GOM model. However, the SMY of digesters operated at 37 °C was underestimated by the LOG model. There was a slight difference in the correlation coefficients (R2) between the experimental dataset and the SMY predicted by the models.
Both the LOG and GOM models show an inherent short-coming for the starting condition of fermentation: both models estimate a non-zero methane yield at t = 0. This fact could be attributed to the original purpose of the models, which were designed to describe bacterial growth rather than the bacterial product (methane in our case) [31,41]. Fischer, Powrosnik and Beil [38] also reported non-zero methane yield from the LOG and GOM model at t = 0, and explained that the situation has no physical meaning.

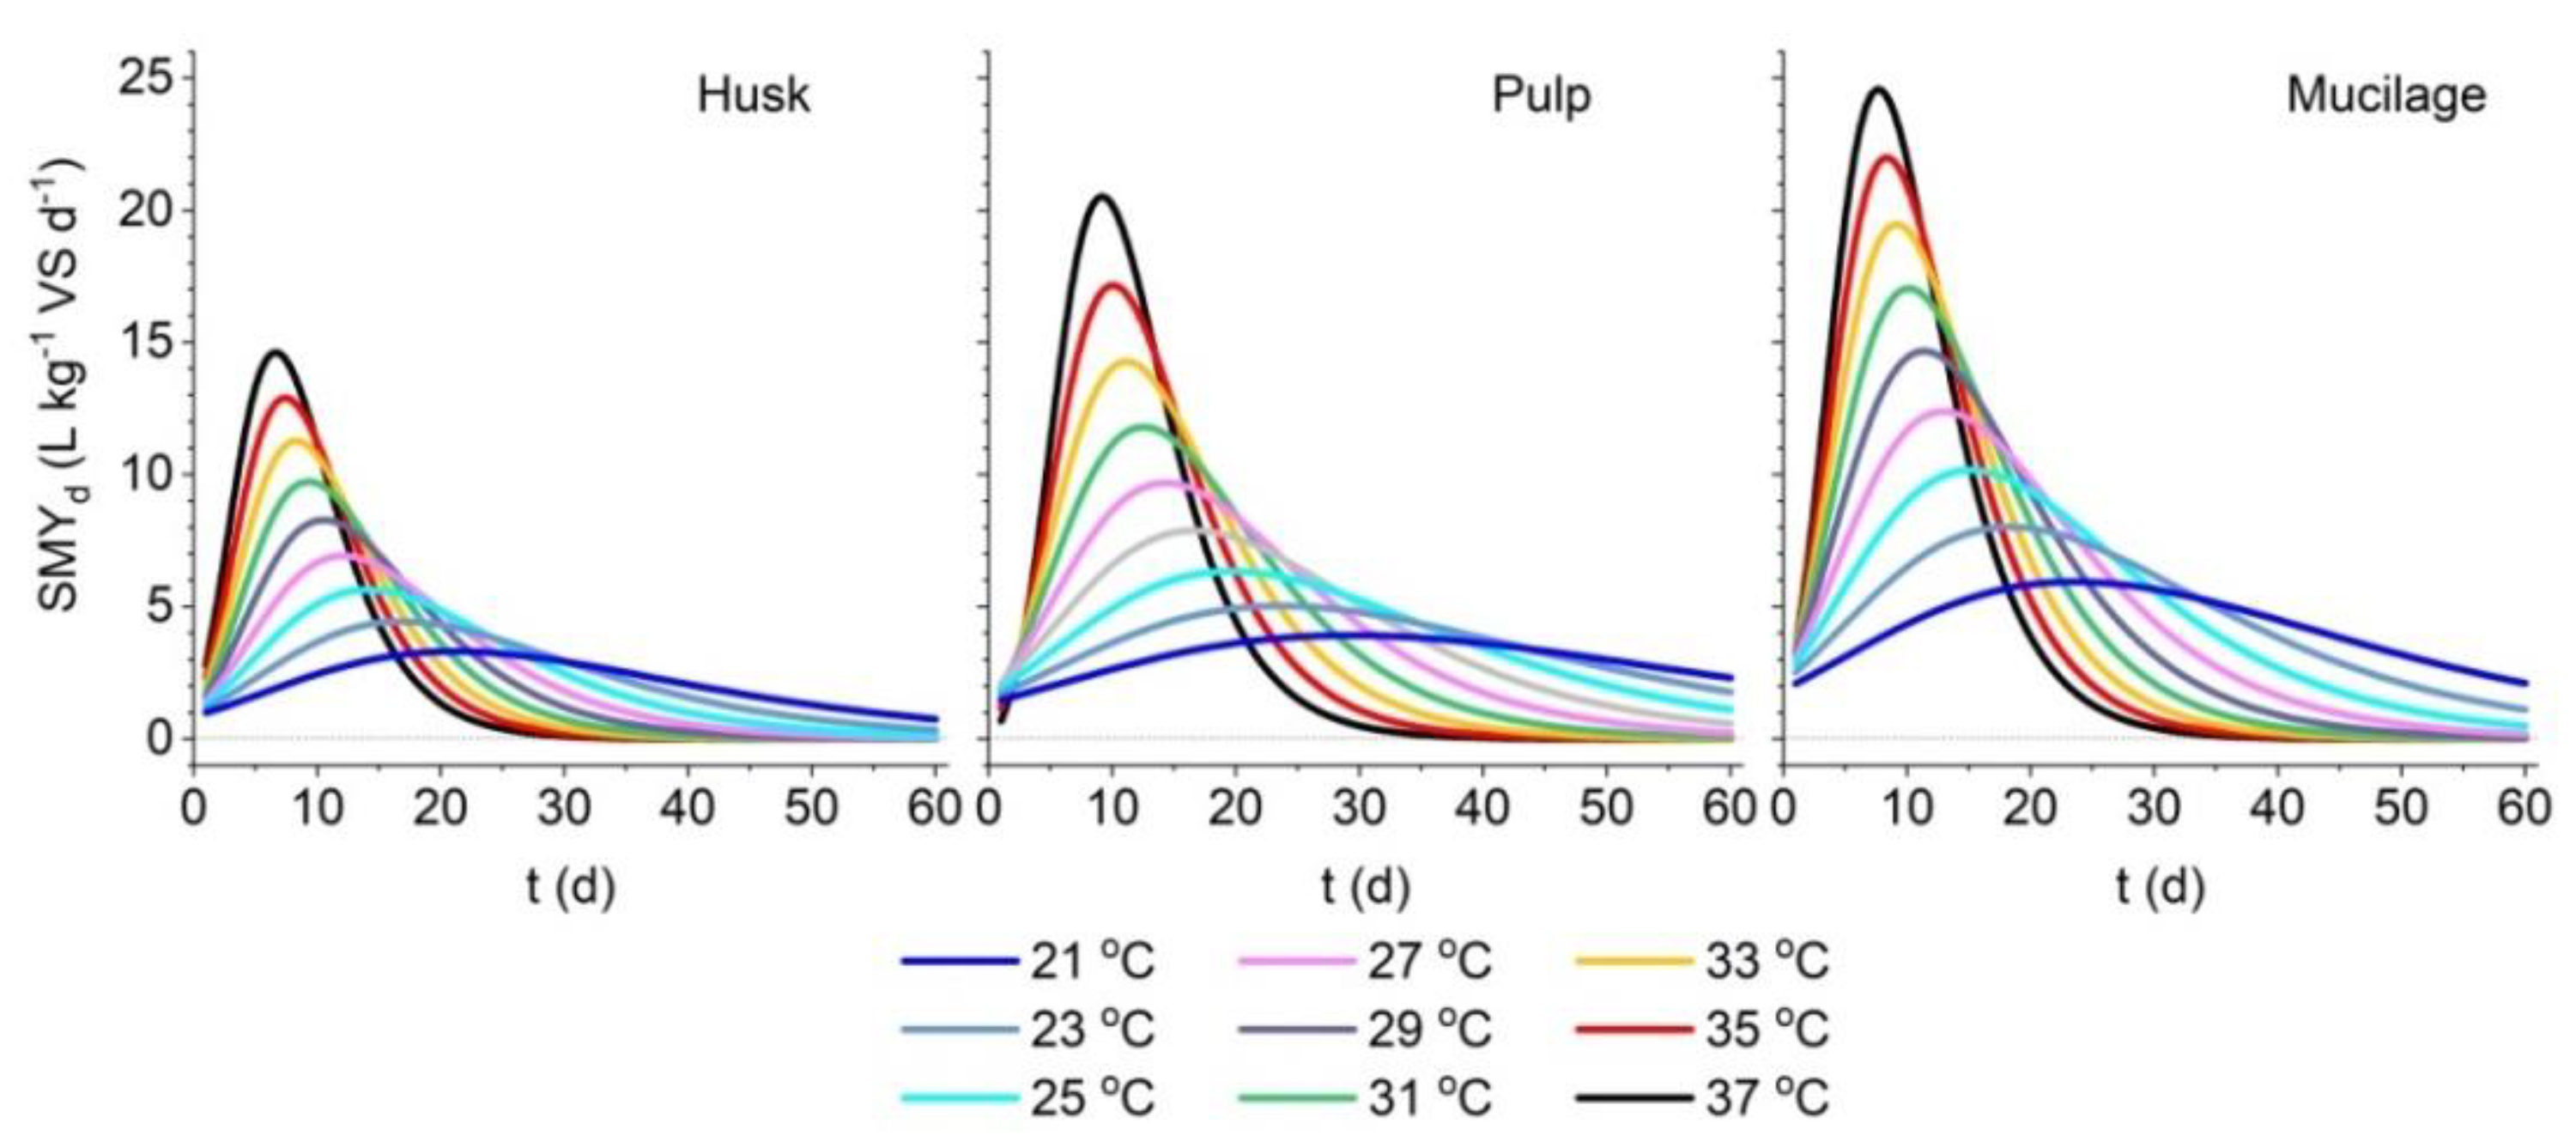
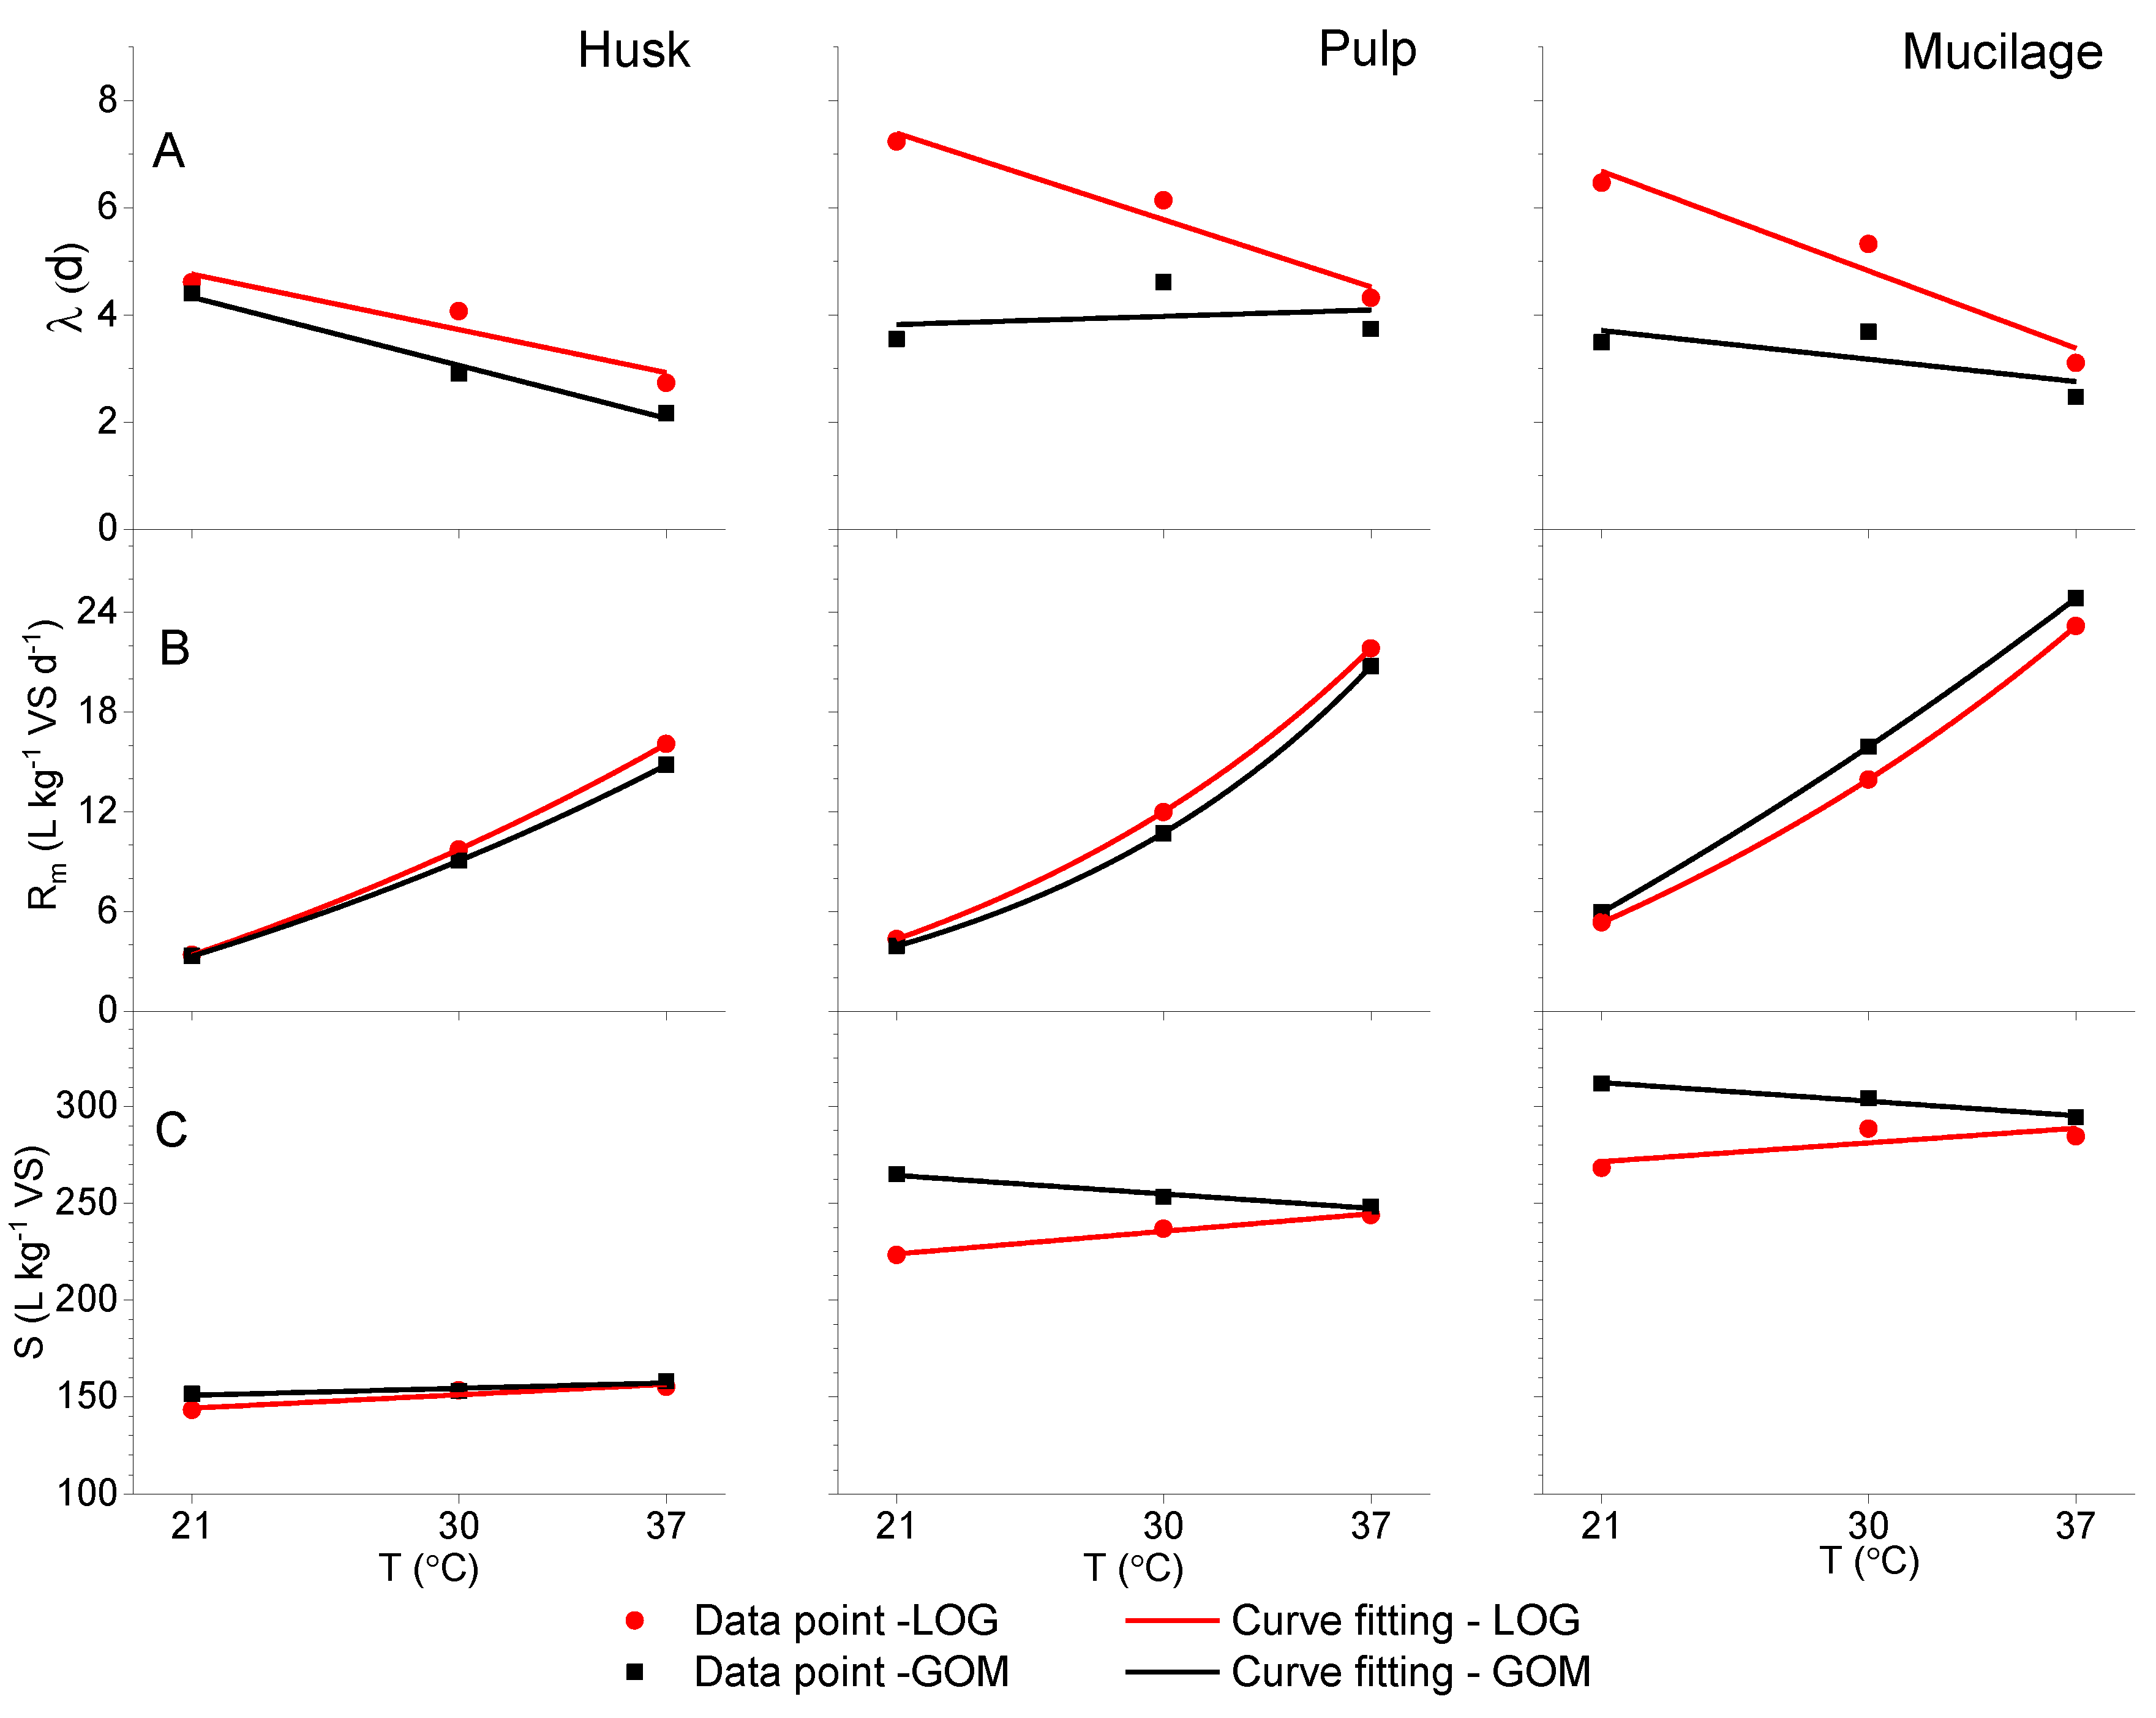
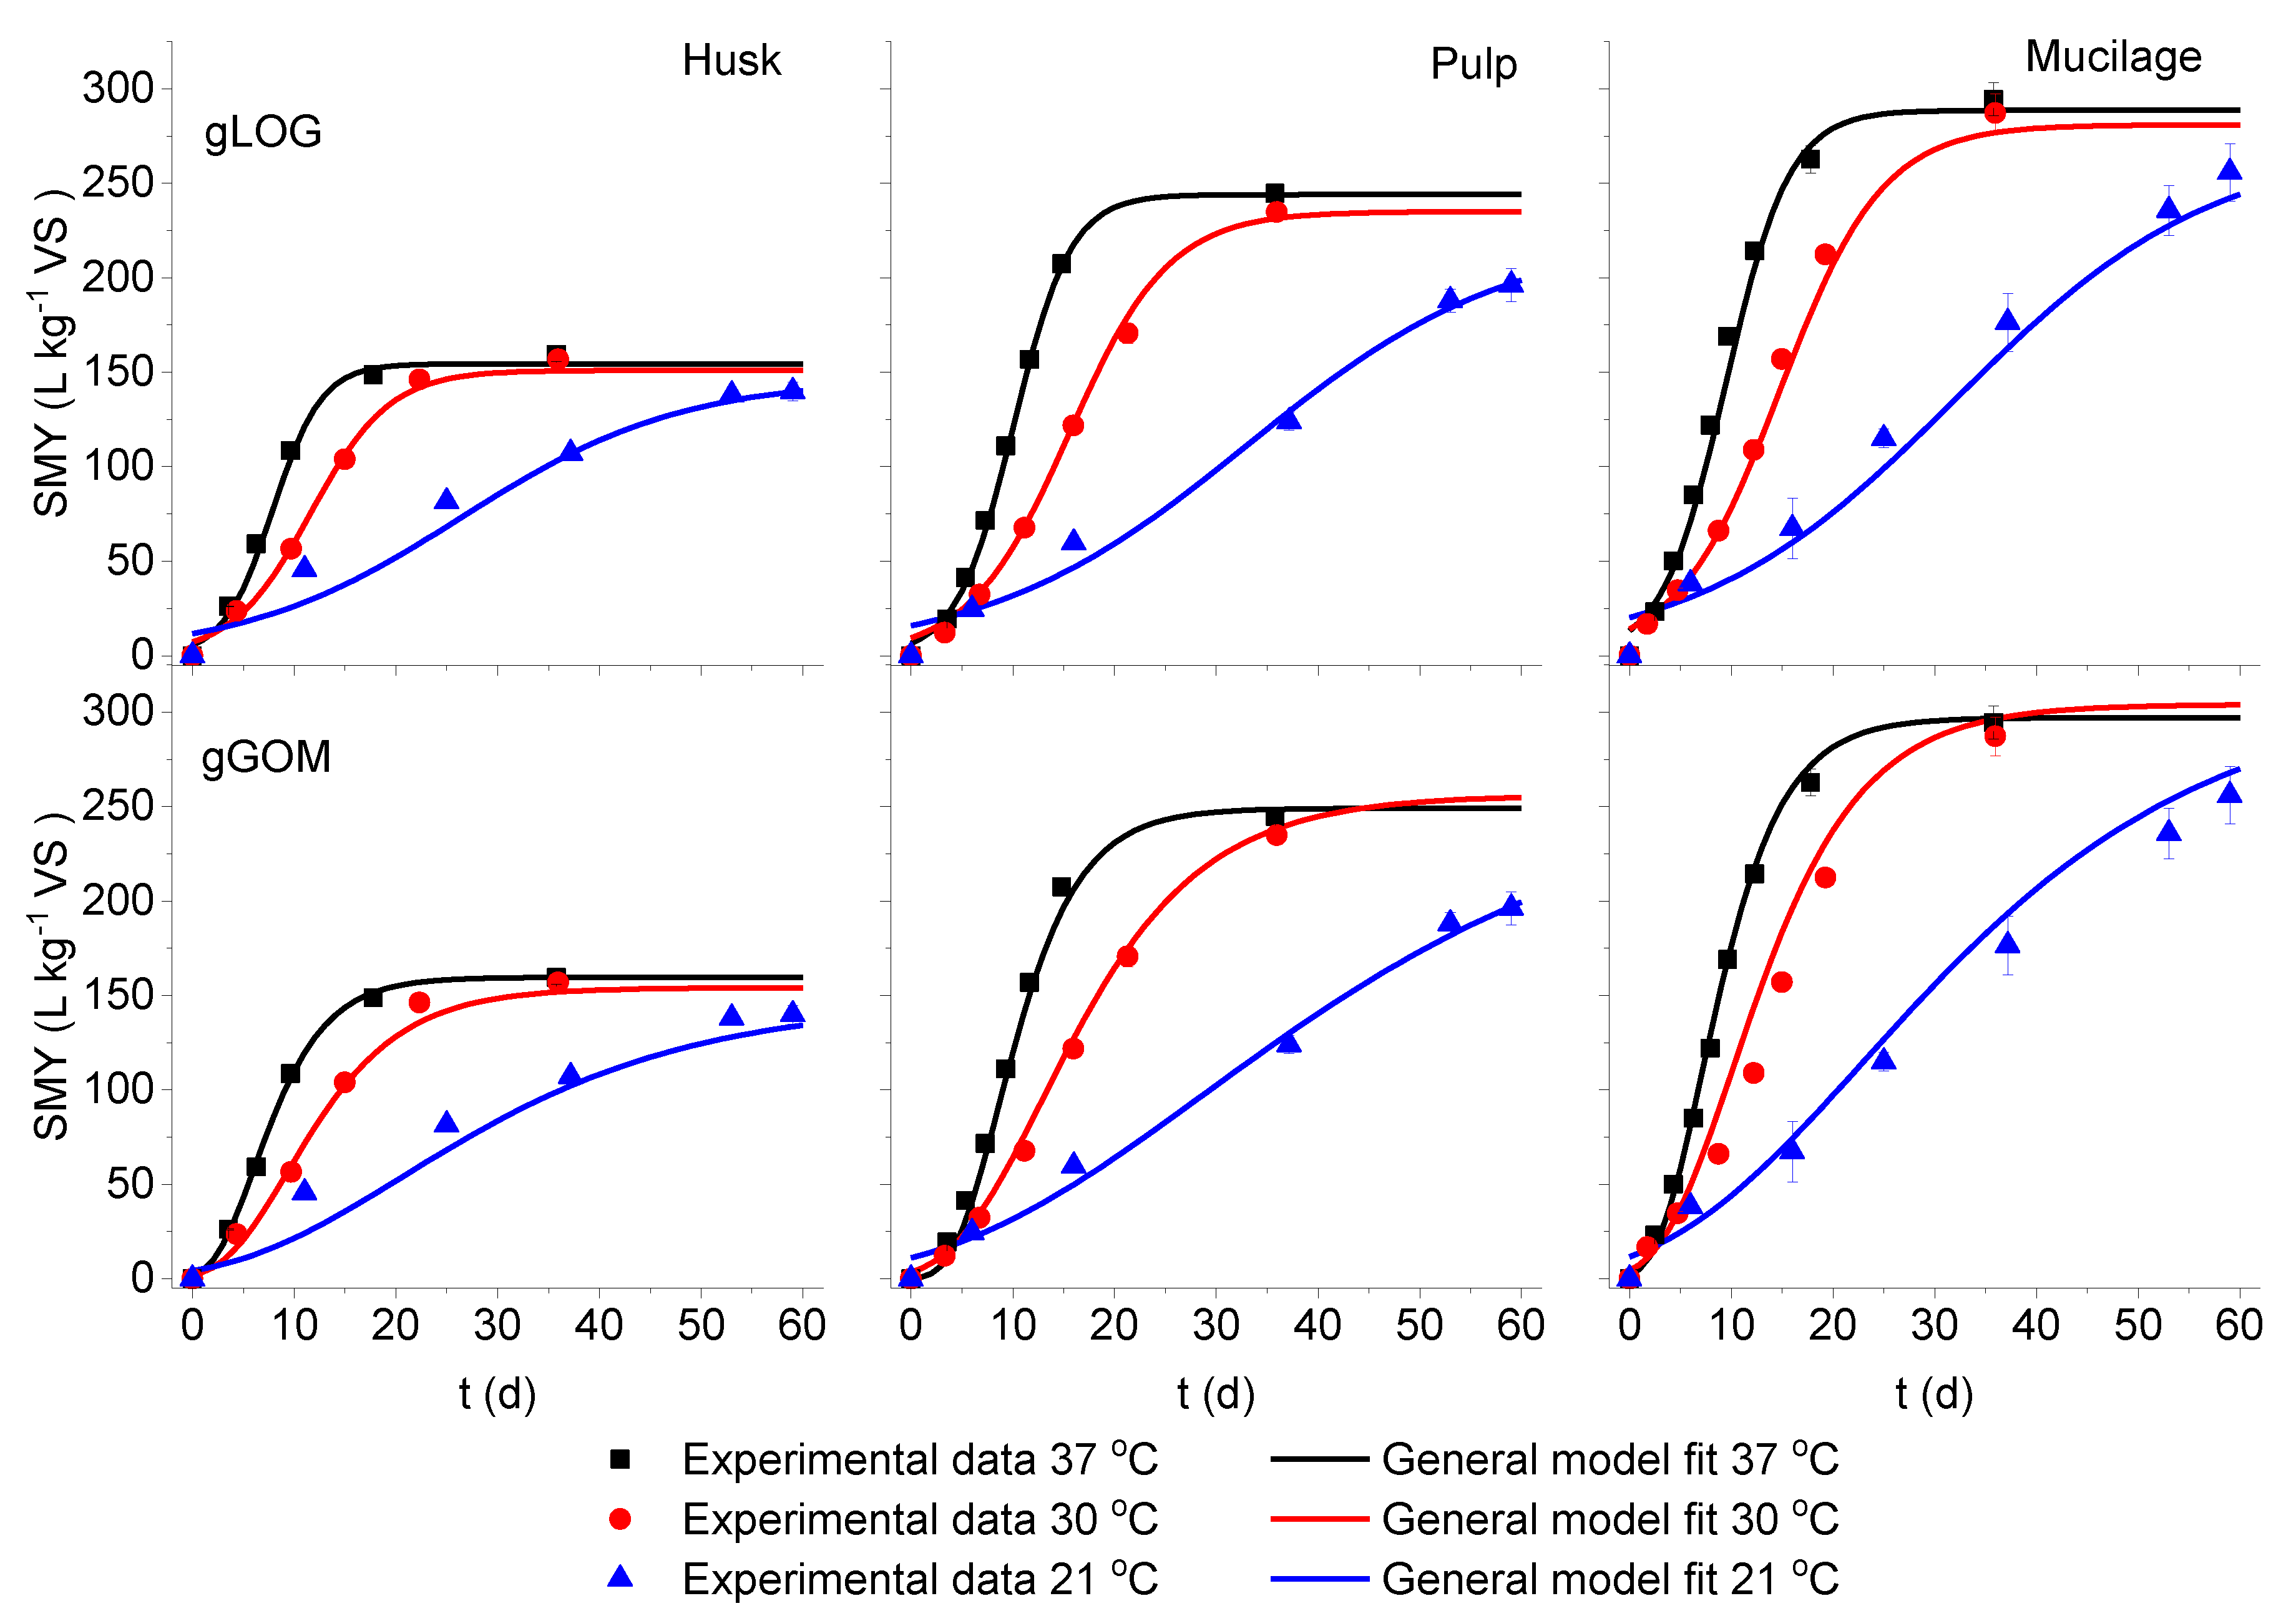
3.2. Model Fitting for Fermentation Temperature as an Input Variable

Figure 2 shows kinetic parameters (ultimate methane yield, maximum daily methane yield and lag period) of husks, pulp and mucilage determined from non-linear regression of the LOG and GOM models operated at 21 °C, 30 °C and 37 °C.
Fitting equations were established for the three parameters against the respective fermentation temperature T:
S = c 1 + c 2 · T
R m = c 3 + c 4 · e T 21 c 5
λ = c 6 + c 7 · T
The ultimate methane yield (S) and the lag period (λ) fit well with a linear equation while the maximum daily methane yield (Rm) fits with the exponential function. The coefficients c1–c7 are shown in Table 3.
The lag periods (λ) tend to decrease with increasing temperatures from 21 °C to 37 °C (Figure 2 A). In studies by Ying Jin, Zhenhu Hu and Wen [29], the lag period was represented by a hyperbolic type function, while growth of bacteria was examined in temperature ranges between 6 °C and 43 °C. The linear fit in this study (21 °C–37 °C) is similar to the results fromYing Jin, Zhenhu Hu and Wen [29] at the same temperature range.
The methane yield rate (Rm) increased with increasing temperatures for all substrates and there was only a small difference between the substrates, regardless of the model type (Figure 2B). The fitting equation indicated strong dependence of the methane yield rate on temperature. The highest yield rate from each fermentation temperature was recorded from mucilage followed by pulp and husks. The Ratkowsky, Hinshelwood and Schoolfield growth models estimate that the growth yield increases from a minimum temperature to the optimum temperature and then starts to decrease again [29]. In this study, the fermentation temperature did not exceed the optimum temperature of 37 °C and hence, did not show a decline. Pham, et al. [42] reported that the maximum daily methane yield rate rose exponentially within a range from low to optimal fermentation temperatures, in full-scale continuous feed biogas digesters fed with pig and cow manure.
The ultimate methane yield (S) prediction from the modified LOG model shows an increasing trend with increasing temperatures for all substrates; however, the GOM model shows a decreasing trend with increasing temperatures for pulp and mucilage (Figure 2C). Introducing Equations (7)– (9) into Equation (1) (GOM model) and Equation (2) (LOG model) leads to the generalized modified Logistic model (gLOG) and the generalized modified Gompertz model (gGOM) with fermentation temperature T as an input variable. Thus, parameter values (S, Rm and λ) were estimated for fermentation temperatures of 21 °C, 30 °C and 37 °C to generalize the models (Table 4). The performance of the generalized models was validated with the measured SMY and showed high goodness of fit (R2 > 0.959).
Figure 3 shows the measured experimental data fitted with the generalized models. The generalized models described the experimental data very well. However, both the gLOG and the gGOM model underestimated the SMY from husks within the first weeks of fermentation at 21 °C. At the same temperature, the SMY from mucilage was slightly underestimated by the generalized LOG model and overestimated by GOM models. The deviation of the estimates values from the measured values could be attributed to the performance of fitting equations to the parameter values prior to application in the generalized model. The generalized models fit the experimental data quite well and are acceptable (R2 > 0.98, MAE 4.32–10.4); therefore, the models are applicable to estimate the SMY of husks, pulp and mucilage at any fermentation temperature between 21 °C and 37 °C.
Figure 4 shows residual values in the specific methane yield, representing the difference between the measured values and the predictions from the gLOG and gGOM model results for each data point in the time series. The maximal residual values from gLOG and gGOM model fittings are 20.6 and 34.9, respectively. The residual plots, both from gLOG and gGOM, showed no specific pattern in the independent variable time (t) despite a slight drift in the residuals from the mucilage. Thus, the residuals indicated no bias in the fitting of the models. Hence, the generalized models performed well in predicting the methane yields.
Despite continuous methane production, both the LOG and GOM models estimated a negligible methane yield after 20 and 30 days from all sets of substrates fermented at 37 °C and 30 °C, respectively. Similar results by Wang, Lee, Dilbeck, Liebelt, Zhang and Ergas [25] and Fischer, Powrosnik and Beil [38] were reported. The reason could be attributed to the presence of slowly degradable substrate fractions, which neither the LOG nor the GOM models account for.

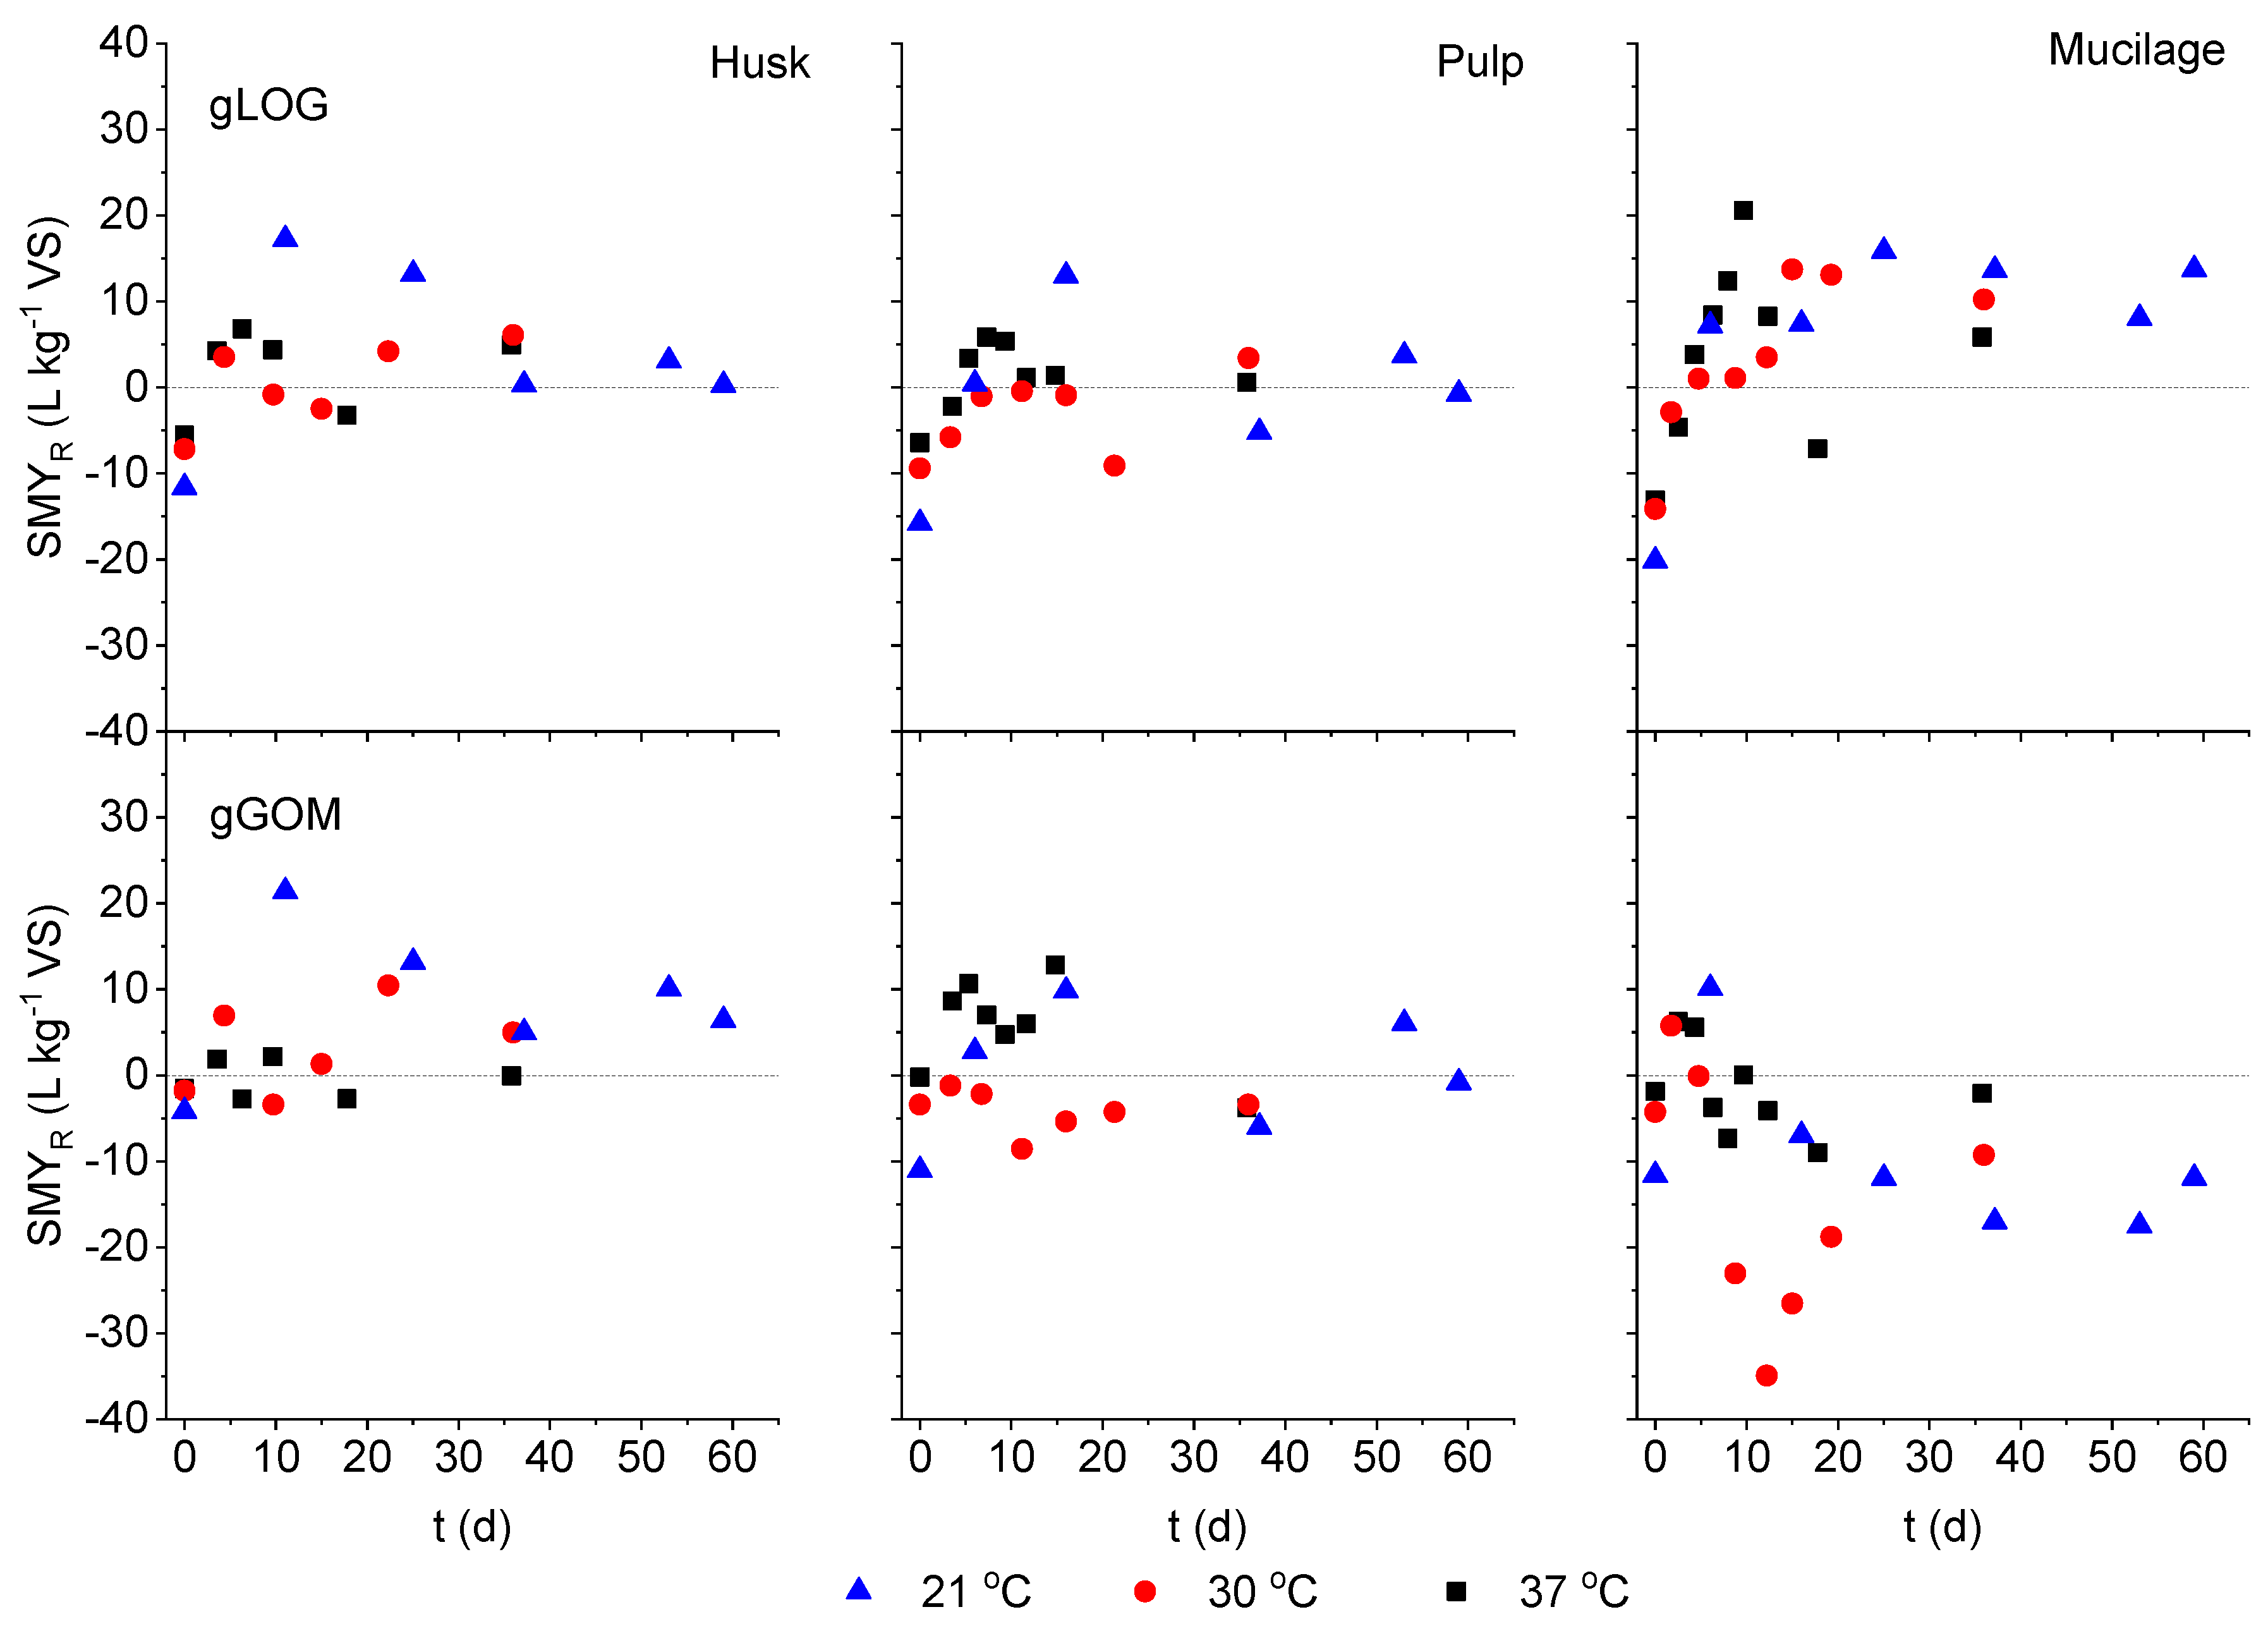
3.3. Model Validation

The performances of the gLOG and gGOM model with experimental datasets were compared based on the AIC values as shown in Figure 5. The bar represents the relative quality of the models for the methane yield dataset of each substrate regardless of fermentation temperature. The gGOM model showed lower AIC for all substrates, particularly for mucilage. Therefore, the gGOM model is better than the gLOG model to fit the experimental data set of methane yields from husks, pulp and mucilage.
Projections of the daily methane yield from husks, pulp and mucilage were made by the gGOM model, considering fermentation temperatures in a range from 21 °C to 37 °C (Figure 6). Thus, the maximum daily methane yields for all substrates occur at the earliest at the highest temperature of the fermentations. Moreover, the projections indicated that higher fermentation temperatures favor a quick recovery of methane in shorter hydraulic retention periods. However, digestion at lower temperatures required an extended hydraulic retention time to recover the methane formation potential of substrates, particularly from pulp and mucilage.

4. Conclusions

Coffee husks, pulp and mucilage were anaerobically digested in batch assay at 21 °C, 30 °C and 37 °C. The final methane yield reached similar values at different temperatures for each substrate, however, the required incubation time increased with deceasing temperature. The modified Logistic model (LOG) and modified Gompertz model (GOM) were applied to fit the experimental dataset and predict kinetic parameters (ultimate methane yield, maximum daily methane yield and the lag period) for the specific test temperatures. Mathematical relations were established between each parameter and digestion temperatures, indicating that both the LOG and GOM model could be generalized by introducing fermentation temperature as an input variable. The models allow the prediction of the bio-methane yield as well as the kinetic parameters at any temperature in the range between 21 °C and 37 °C, replacing further batch trials. For climatic conditions of Ethiopia, unheated digesters can work well in larger fermenter size to compensate for the lower digestion temperature. The authors recommend further research on the performance of digesters in colder climates, and kinetic models of different substrates for a wider range of fermentation temperatures. In further study, the co-fermentation of different waste fractions should also be investigated to take advantage of synergies as shown by the study of Pachapur, et al. [43].

Author Contributions

Conceptualization, B.C. and J.M.; Methodology, B.C., H.O., and J.M.; Investigation, B.C., H.O. and J.M.; Writing—Original Draft Preparation, B.C.; Writing—Review & Editing, B.C. and J.M.

Funding

This research was funded by the German Federal Ministry of Education and Research (BMBF) within the framework of the GlobE program in conjunction with the BiomassWeb project, grant number 031A258F.

Acknowledgments

The authors are grateful to the State Institute of Agricultural Engineering and Bioenergy and the laboratory staff members (University of Hohenheim) for the batch assay trials and physico-chemical analysis. Authors are indebted to Global Food Security (University of Hohenheim) for financial support. Authors are thankful to Mathieu Brulé for helpful suggestions during data analysis and Sabine Nugent for language editing.

Conflicts of Interest

The authors declare no conflict of interest.

Nomenclatures

SymbolDefinition
SMYspecific methane yield
BMPbio-chemical methane potential
GOMmodified Gompertz model
LOGmodified logistic model
gLOGgeneralized logistic model
gGOMgeneralized Gompertz model
AICAkaike information criterion
hahectare (=10,000 m2)
a.s.l.above sea level

References

  1. Franca, A.S.; Oliveira, L.S. Coffee processing solid wastes: Current uses and future perspectives. In Agricultural Wastes; Ashworth, G.S., Azevedo, P., Eds.; Nova Science Publishers, Inc.: Hauppauge, NY, USA, 2009; pp. 155–190. [Google Scholar]
  2. Gadhamshetty, V.; Arudchelvam, Y.; Nirmalakhandan, N.; Johnson, D.C. Modeling dark fermentation for biohydrogen production: ADM1-based model vs. Gompertz model. Int. J. Hydrogen Energy 2010, 35, 479–490. [Google Scholar] [CrossRef]
  3. Vincent, J.-C. Green Coffee Processing. In Coffee: Technology; Clarke, R., Macrae, R., Eds.; Elsevier Applied Science: London, UK, 1987; Volume 2. [Google Scholar]
  4. Oliveira, L.S.; Franca, A.S. An overview of the potential uses for coffee husks. In Coffee in health and disease prevention; Preedy, V.R., Ed.; Elsevier Inc.: New York, NY, USA, 2015; pp. 283–291. [Google Scholar] [CrossRef]
  5. Zayas Péerez, T.; Geissler, G.; Hernandez, F. Chemical oxygen demand reduction in coffee wastewater through chemical flocculation and advanced oxidation processes. J. Environ. Sci. 2007, 19, 300–305. [Google Scholar] [CrossRef]
  6. Devi, R.; Singh, V.; Kumar, A. COD and BOD reduction from coffee processing wastewater using Avacado peel carbon. Bioresour. Technol. 2008, 99, 1853–1860. [Google Scholar] [CrossRef]
  7. McKendry, P. Energy production from biomass (part 2): conversion technologies. Bioresour. Technol. 2002, 83, 47–54. [Google Scholar] [CrossRef]
  8. Gupta, A.; Verma, J.P. Sustainable bio-ethanol production from agro-residues: A review. Renew. Sustain. Energy Rev. 2015, 41, 550–567. [Google Scholar] [CrossRef]
  9. Mengistu, M.G.; Simane, B.; Eshete, G.; Workneh, T.S. A review on biogas technology and its contributions to sustainable rural livelihood in Ethiopia. Renew. Sust. Energy Rev. 2015, 48, 306–316. [Google Scholar] [CrossRef]
  10. Fischer, E.; Schmidt, T.; Hora, S.; Geirsdorf, J.; Stinner, W.; Scholwin, F. Agro-Industrial Biogas in Kenya; German International Cooperation (GIZ): Berlin, Germany, 2010. [Google Scholar]
  11. Ulsido, M.D.; Zeleke, G.; Li, M. Biogas potential assessment from a coffee husk: An option for solid waste management in Gidabo watershed of Ethiopia. In Proceedings of the 15th International Scientific Conference Engineering for Rural Development, Jelgava, Latvia, 25–27 May 2016; pp. 1348–1354. [Google Scholar]
  12. Kivaisi, A.K.; Rubindamayugi, M.S.T. The potential of agro-industrial residues for production of biogas and electricity in Tanzania. Renew. Energy 1996, 9, 917–921. [Google Scholar] [CrossRef]
  13. Chala, B.; Oechsner, H.; Fritz, T.; Latif, S.; Müller, J. Increasing the loading rate of continuous stirred tank reactor for coffee husk and pulp: Effect of trace elements supplement. Eng. Life Sci. 2018, 18, 551–561. [Google Scholar] [CrossRef]
  14. Yadvika; Santosh; Sreekrishnan, T.R.; Kohli, S.; Rana, V. Enhancement of biogas production from solid substrates using different techniques––a review. Bioresour. Technol. 2004, 95, 1–10. [Google Scholar] [CrossRef]
  15. Tong, X.; Smith, L.H.; McCarty, P.L. Methane fermentation of selected lignocellulosic materials. Biomass 1990, 21, 239–255. [Google Scholar] [CrossRef]
  16. Ahring, B.K.; Sandberg, M.; Angelidaki, I. Volatile fatty acids as indicators of process imbalance in anaerobic digestors. Appl. Microbiol. Biotechnol. 1995, 43, 559–565. [Google Scholar] [CrossRef]
  17. Syaichurrozi, I.; Budiyono; Sumardiono, S. Predicting kinetic model of biogas production and biodegradability organic materials: Biogas production from vinasse at variation of COD/N ratio. Bioresour. Technol. 2013, 149, 390–397. [Google Scholar] [CrossRef] [PubMed]
  18. Nyoman, W.I.; Seno, J.; Sunarso. The kinetic of biogas production rate from cattle manure in batch mode. Int. J. Chem. Biol. Eng. 2010, 3, 39–45. [Google Scholar]
  19. Zhu, B.; Gikas, P.; Zhang, R.; Lord, J.; Jenkins, B.; Li, X. Characteristics and biogas production potential of municipal solid wastes pretreated with a rotary drum reactor. Bioresour. Technol. 2009, 100, 1122–1129. [Google Scholar] [CrossRef] [PubMed]
  20. Patil, J.H.; Raj, M.A.; Muralidhara, P.L.; Desai, S.M.; Raju, G.K.M. Kinetics of Anaerobic Digestion of Water Hyacinth Using Poultry Litter as Inoculum. J. Environ. Dev. 2012, 3, 94–98. [Google Scholar]
  21. Adiga, S.; Ramya, R.; Shankar, B.B.; Patil, J.H.; Geetha, C.R. Kinetics of anaerobic digestion of water hyacinth, poultry litter, cow manure and primary sludge: A comparative study. Int. Conf. Biotechnol. Environ. Manag. 2012, 14, 73–78. [Google Scholar]
  22. Weissbach, F.; Parr, K.; Reinsdorf, U.; Warnke-Gurgel, C.; Losand, B. Losses of methane forming potential of pulpified sugar beets stored in open ground basins. LANDTECHNIK 2013, 68, 50–57. [Google Scholar]
  23. Chatterjee, T.; Chatterjee, B.K.; Majumdar, D.; Chakrabarti, P. Antibacterial effect of silver nanoparticles and the modeling of bacterial growth kinetics using a modified Gompertz model. Biochim. Biophys. Acta 2015, 1850, 299–306. [Google Scholar] [CrossRef]
  24. Franses, P.H. A method to select between Gompertz and logistic trend curves. Technol. Forecast. Soc. Chang. 1994, 45–49. [Google Scholar] [CrossRef]
  25. Wang, M.; Lee, E.; Dilbeck, M.P.; Liebelt, M.; Zhang, Q.; Ergas, S.J. Thermal pretreatment of microalgae for biomethane production: experimental studies, kinetics and energy analysis. J. Chem. Technol. Biotechnol. 2017, 92, 399–407. [Google Scholar] [CrossRef]
  26. Angelidaki, I.; Sanders, W. Assessment of the anaerobic biodegradability of macropollutants. Rev. Environ. Sci. Biotechnol. 2004, 3, 117–129. [Google Scholar] [CrossRef] [Green Version]
  27. Deublein, D.; Steinhauser, A. Biogas from Waste and Renewable Resources: An Introduction; John Wiley & Sons: Weinheim, Germany, 2011. [Google Scholar]
  28. Ratkowsky, D.A.; Lowry, R.K.; McMeekin, T.A.; Stokes, A.N.; Chandler, R.E. Model for bacterial culture growth rate throughout the entire biokinetic temperature range. J. Bacteriol. 1983, 154, 1222–1226. [Google Scholar] [PubMed]
  29. Jin, Y.; Hu, Z.; Wen, Z. Enhancing anaerobic digestibility and phosphorus recovery of dairy manure through microwave-based thermochemical pretreatment. Water Res. 2009, 43, 3493–3502. [Google Scholar] [CrossRef] [PubMed]
  30. Brulé, M.; Oechsner, H.; Jungbluth, T. Exponential model describing methane production kinetics in batch anaerobic digestion: A tool for evaluation of biochemical methane potential assays. Bioprocess Biosystems. Eng. 2014, 37, 1759–1770. [Google Scholar] [CrossRef] [PubMed]
  31. Zwietering, M.H.; Jongenburger, I.; Rombouts, F.M.; Van't Riet, K. Modeling of the bacterial growth curve. Appl. Environ. Microbiol. 1990, 56, 1875–1881. [Google Scholar] [PubMed]
  32. Fazzini, M.; Bisci, C.; Billi, P. The climate of Ethiopia. In Landscapes and Landforms of Ethiopia; Springer: Dordrecht, The Netherlands, 2015; pp. 65–87. [Google Scholar]
  33. Mittweg, G.; Oechsner, H.; Hahn, V.; Lemmer, A.; Reinhardt-Hanisch, A. Repeatability of a laboratory batch method to determine the specific biogas and methane yields. Eng. Life Sci. 2012, 12, 270–278. [Google Scholar] [CrossRef]
  34. Muñoz, G.; Grieser, J. CLIMWAT 2.0 for CROPWAT: A Climatic Database for Irrigation Planning and Management. Available online: http://www.fao.org/land-water/databases-and-software/climwat-for-cropwat/en/ and http://www.webcitation.org/75aQLq1E1 (Archived by WebCite®) (accessed on 21 January 2019).
  35. Haag, N.L.; Nägele, H.J.; Fritz, T.; Oechsner, H. Effects of ensiling treatments on lactic acid production and supplementary methane formation of maize and amaranth - An advanced green biorefining approach. Bioresour. Technol. 2015, 178, 217–225. [Google Scholar] [CrossRef] [PubMed]
  36. Chala, B.; Oechsner, H.; Latif, S.; Müller, J. Biogas Potential of Coffee Processing Waste in Ethiopia. Sustainability 2018, 10, 2678. [Google Scholar] [CrossRef]
  37. VDI. VDI 4630—Fermentation of Organic Materials : Characterisation of Substrate, Sampling, Collection of Material Data, Fermentation Tests; Verein Deutscher Ingenieure: Düsseldorf, Vietnam, 2006. [Google Scholar]
  38. Fischer, E.; Powrosnik, A.-M.; Beil, C. Assessment of process stability and biogas yield for the anaerobic digestion of horse dung in lab-scale. LANDTECHNIK 2013, 68, 248–251. [Google Scholar]
  39. Marquardt, D.W. An Algorithm for Least-Squares Estimation of Nonlinear Parameters. J. Soc. Ind. Appl. Math. 1963, 11, 431–441. [Google Scholar] [CrossRef]
  40. Khan, M.T.; Brulé, M.; Maurer, C.; Argyropoulos, D.; Müller, J.; Oechsner, H. Batch anaerobic digestion of banana waste-energy potential and modelling of methane production kinetics. Agric. Eng. Int. CIGR J. 2016, 18, 110–128. [Google Scholar]
  41. Shen, J.; Zhu, J. Development of General Gompertz Models and Their Simplified Two-Parameter Forms Based on Specific Microbial Growth Rate for Microbial Growth, Bio-Products and Substrate Consumption. Adv. Biotechnol. Microbiol. 2017, 4. [Google Scholar] [CrossRef]
  42. Pham, C.H.; Triolo, J.M.; Sommer, S.G. Predicting methane production in simple and unheated biogas digesters at low temperatures. Appl. Energy 2014, 136, 1–6. [Google Scholar] [CrossRef]
  43. Pachapur, V.L.; Sarma, S.J.; Brar, S.K.; Le Bihan, Y.; Buelna, G.; Verma, M. Biohydrogen production by co-fermentation of crude glycerol and apple pomace hydrolysate using co-culture of Enterobacter aerogenes and Clostridium butyricum. Bioresour. Technol. 2015, 193, 297–306. [Google Scholar] [CrossRef]
Figure 1. Measured specific methane yield (SMY) of coffee husks, pulp and mucilage in the course of batch residence time (t) at different fermentation temperatures and curves fitted with the modified Gompertz model (GOM) and modified Logistic model (LOG); error bars show standard deviation, n = 6.
Applsci 09 00412 g001
Figure 2. Lag period λ (A), maximum daily methane yield Rm (B) and ultimate methane yield S (C), from the modified Logistic model (LOG) and modified Gompertz model (GOM) vs. fermentation temperature T.
Applsci 09 00412 g002
Figure 3. Measured specific methane yield (SMY) of coffee husks, pulp and mucilage in the course of batch residence time (t) at different fermentation temperatures and curves fitted with the generalized modified Logistic model (gLOG) and generalized modified Gompertz model (gGOM); error bars show standard deviation, n = 6.
Applsci 09 00412 g003
Figure 4. Residual specific methane yield (SMYR) of husks, pulp and mucilage in the course of batch assay residence time (t) at different fermentation temperatures as compared to the prediction by generalized modified Logistic model (gLOG) and generalized modified Gompertz model (gGOM) vs residence time (t).
Applsci 09 00412 g004
Figure 5. Comparison of the generalized modified Logistic model (gLOG) and generalized modified Gompertz (gGOM) model on fitting experimental datasets with the Akaike information criterion (AIC) for husks, pulp and mucilage.
Applsci 09 00412 g005
Figure 6. Daily specific methane yield (SMYd) projections by the generalized modified Gompertz model (gGOM) for husk, pulp and mucilage at fermentation temperatures 21 °C–37 °C vs. residence time (t).
Applsci 09 00412 g006
Table 1. Temperature data for some of coffee growing areas in Ethiopia with elevation (H), mean annual temperature (T mean), mean annual maximum temperature (T max) and mean annual minimum temperature (T min) (adapted from [34]).
StationsH (m a.s.l.)T min (°C)T max (°C)T mean (°C)
Gambella48020.434.827.6
Arbaminch129017.929.623.8
Jinka143015.326.921.1
Agaro156012.328.220.3
Bonga172511.627.419.5
Harer185613.824.419.1
Gimbi187013.226.519.9
Yirga chefe192510.324.717.5
Gore200213.723.418.6
Nekemte208011.924.018.0
Table 2. Measured specific methane yield (SMY) of coffee husks, pulp and mucilage at different fermentation temperatures together with ultimate methane yield (S), maximum daily methane yield (Rm) and lag time (λ) as estimated by the modified Logistic model (LOG) and modified Gompertz model (GOM); mean ± SD. MAE: mean absolute error.
SubstrateDig. Temp (°C)SMY, measured (L kg−1 VS)ModelS (L kg−1 VS)Rm (L kg−1 VS d−1)λ (d)SMY, estimated (L kg−1 VS)Goodness of fit
R2MAE
Husk37159.4 ± 1.8LOG155.2 ± 3.916.1 ± 1.62.7 ± 0.5155.20.9972.888
GOM158.5 ± 2.414.8 ± 0.82.1 ± 0.3158.40.9972.334
30156.8 ± 2.6LOG157.3 ± 4.49.7 ± 0.84.1 ± 0.7156.90.9766.289
GOM163.0 ± 6.49.0 ± 0.93.0 ± 0.9160.00.9992.585
21139.9 ± 6.8LOG143.2 ± 12.23.4 ± 0.71.6 ± 4.9138.70.9974.186
GOM151.4 ± 13.73.3 ± 0.60.1 ±3.3139.60.9876.485
Pulp37244.7 ± 6.4LOG243.8 ± 3.721.8 ± 0.84.3 ± 0.2243.80.9965.909
GOM248.2 ± 5.320.7 ± 1.03.7 ± 0.3247.80.9983.230
30234.8 ± 2.9LOG236.6 ± 7.312.0 ± 0.86.1 ± 0.7232.70.9926.749
GOM253.3 ± 3.810.7 ± 0.34.6 ± 0.2235.10.9991.924
21196.2 ± 7.6LOG223.2 ± 29.54.3 ± 0.67.2 ± 3.7197.30.9953.607
GOM265.0 ± 52.63.9 ± 0.43.5 ± 2.7197.90.9874.660
Mucilage37294.5 ± 9.6LOG284.6 ± 7.024.8 ± 1.73.1 ± 0.4284.50.9983.317
GOM294.4 ± 3.923.2 ± 0.82.5 ± 0.2293.81.0001.377
30287.1 ± 11.1LOG288.5 ± 6.215.9 ± 0.85.3 ± 0.4286.10.9926.036
GOM304.2 ± 10.613.9 ± 0.93.8 ± 0.6289.50.9993.237
21255.9 ± 16.6LOG268.3 ± 16.96.0 ± 0.66.5 ± 2.3250.80.9965.411
GOM311.7 ± 27.55.3 ± 0.43.5 ± 1.6253.90.9954.112
Table 3. Coefficients c1-c7 for husks, pulp and mucilage, estimated for ultimate methane yield (S), maximum daily methane yield (Rm) and lag period (λ) for the modified Logistic model (LOG) and modified Gompertz model (GOM).
SubstratesModelSRmλ
c 1 c 2 c 3 c 4 c 5 c 6 c 7
HuskLOG137.00.50.6409.430.012.401.0007.170.10.905
GOM130.30.80.9996.420.585.931.0007.3−0.10.985
PulpLOG196.61.30.987−5.6810.0015.91.00011.2−0.20.954
GOM286.7−1.00.977−2.446.3612.40.9993.470.020.570
MucilageLOG248.91.10.646−14.319.6024.71.00011-0.20.937
GOM334.8-1.00.978-50.956.9055.81.0004.96-0.10.536
Table 4. Specific methane yield (SMY) of coffee husks, pulp and mucilage at different fermentation temperatures as estimated by the generalized modified Logistic model (gLOG) and generalized modified Gompertz model (gGOM) together with ultimate methane yield (S), maximum daily methane yield (Rm) and lag time (λ).
SubstrateDig. Temp (°C)ModelS (L kg−1 VS)Rm (L kg−1 VS d−1)λ (d)SMY estimated (L kg−1 VS)Goodness of fit
R2MAE
Husk37gLOG155.517.293.5154.50.9934.86
gGOM159.915.033.6159.51.0001.86
30gLOG152.09.864.2150.70.9944.05
gGOM154.39.074.3151.80.9974.82
21gLOG147.59.445.1139.60.9597.60
gGOM147.17.005.2133.50.98610.02
Pulp37gLOG244.721.673.8244.10.9983.29
gGOM249.720.674.2248.50.9926.72
30gLOG235.611.935.2231.40.9954.31
gGOM256.710.704.1238.20.9974.06
21gLOG223.94.327.0197.00.9876.48
gGOM265.73.923.9197.10.9916.08
Mucilage37gLOG289.623.163.6289.50.9899.30
gGOM297.824.901.3293.70.9984.06
30gLOG281.913.925.0277.70.9917.34
gGOM304.815.962.0294.40.96014.99
21gLOG272.05.306.8242.60.98012.15
gGOM313.86.002.9267.20.98112.27

