Impacts of Tourists’ Sociodemographic Characteristics on the Travel Motivation and Satisfaction: The Case of Protected Areas in South China


Abstract
:1. Introduction
2. Literature Review
3. Methodology
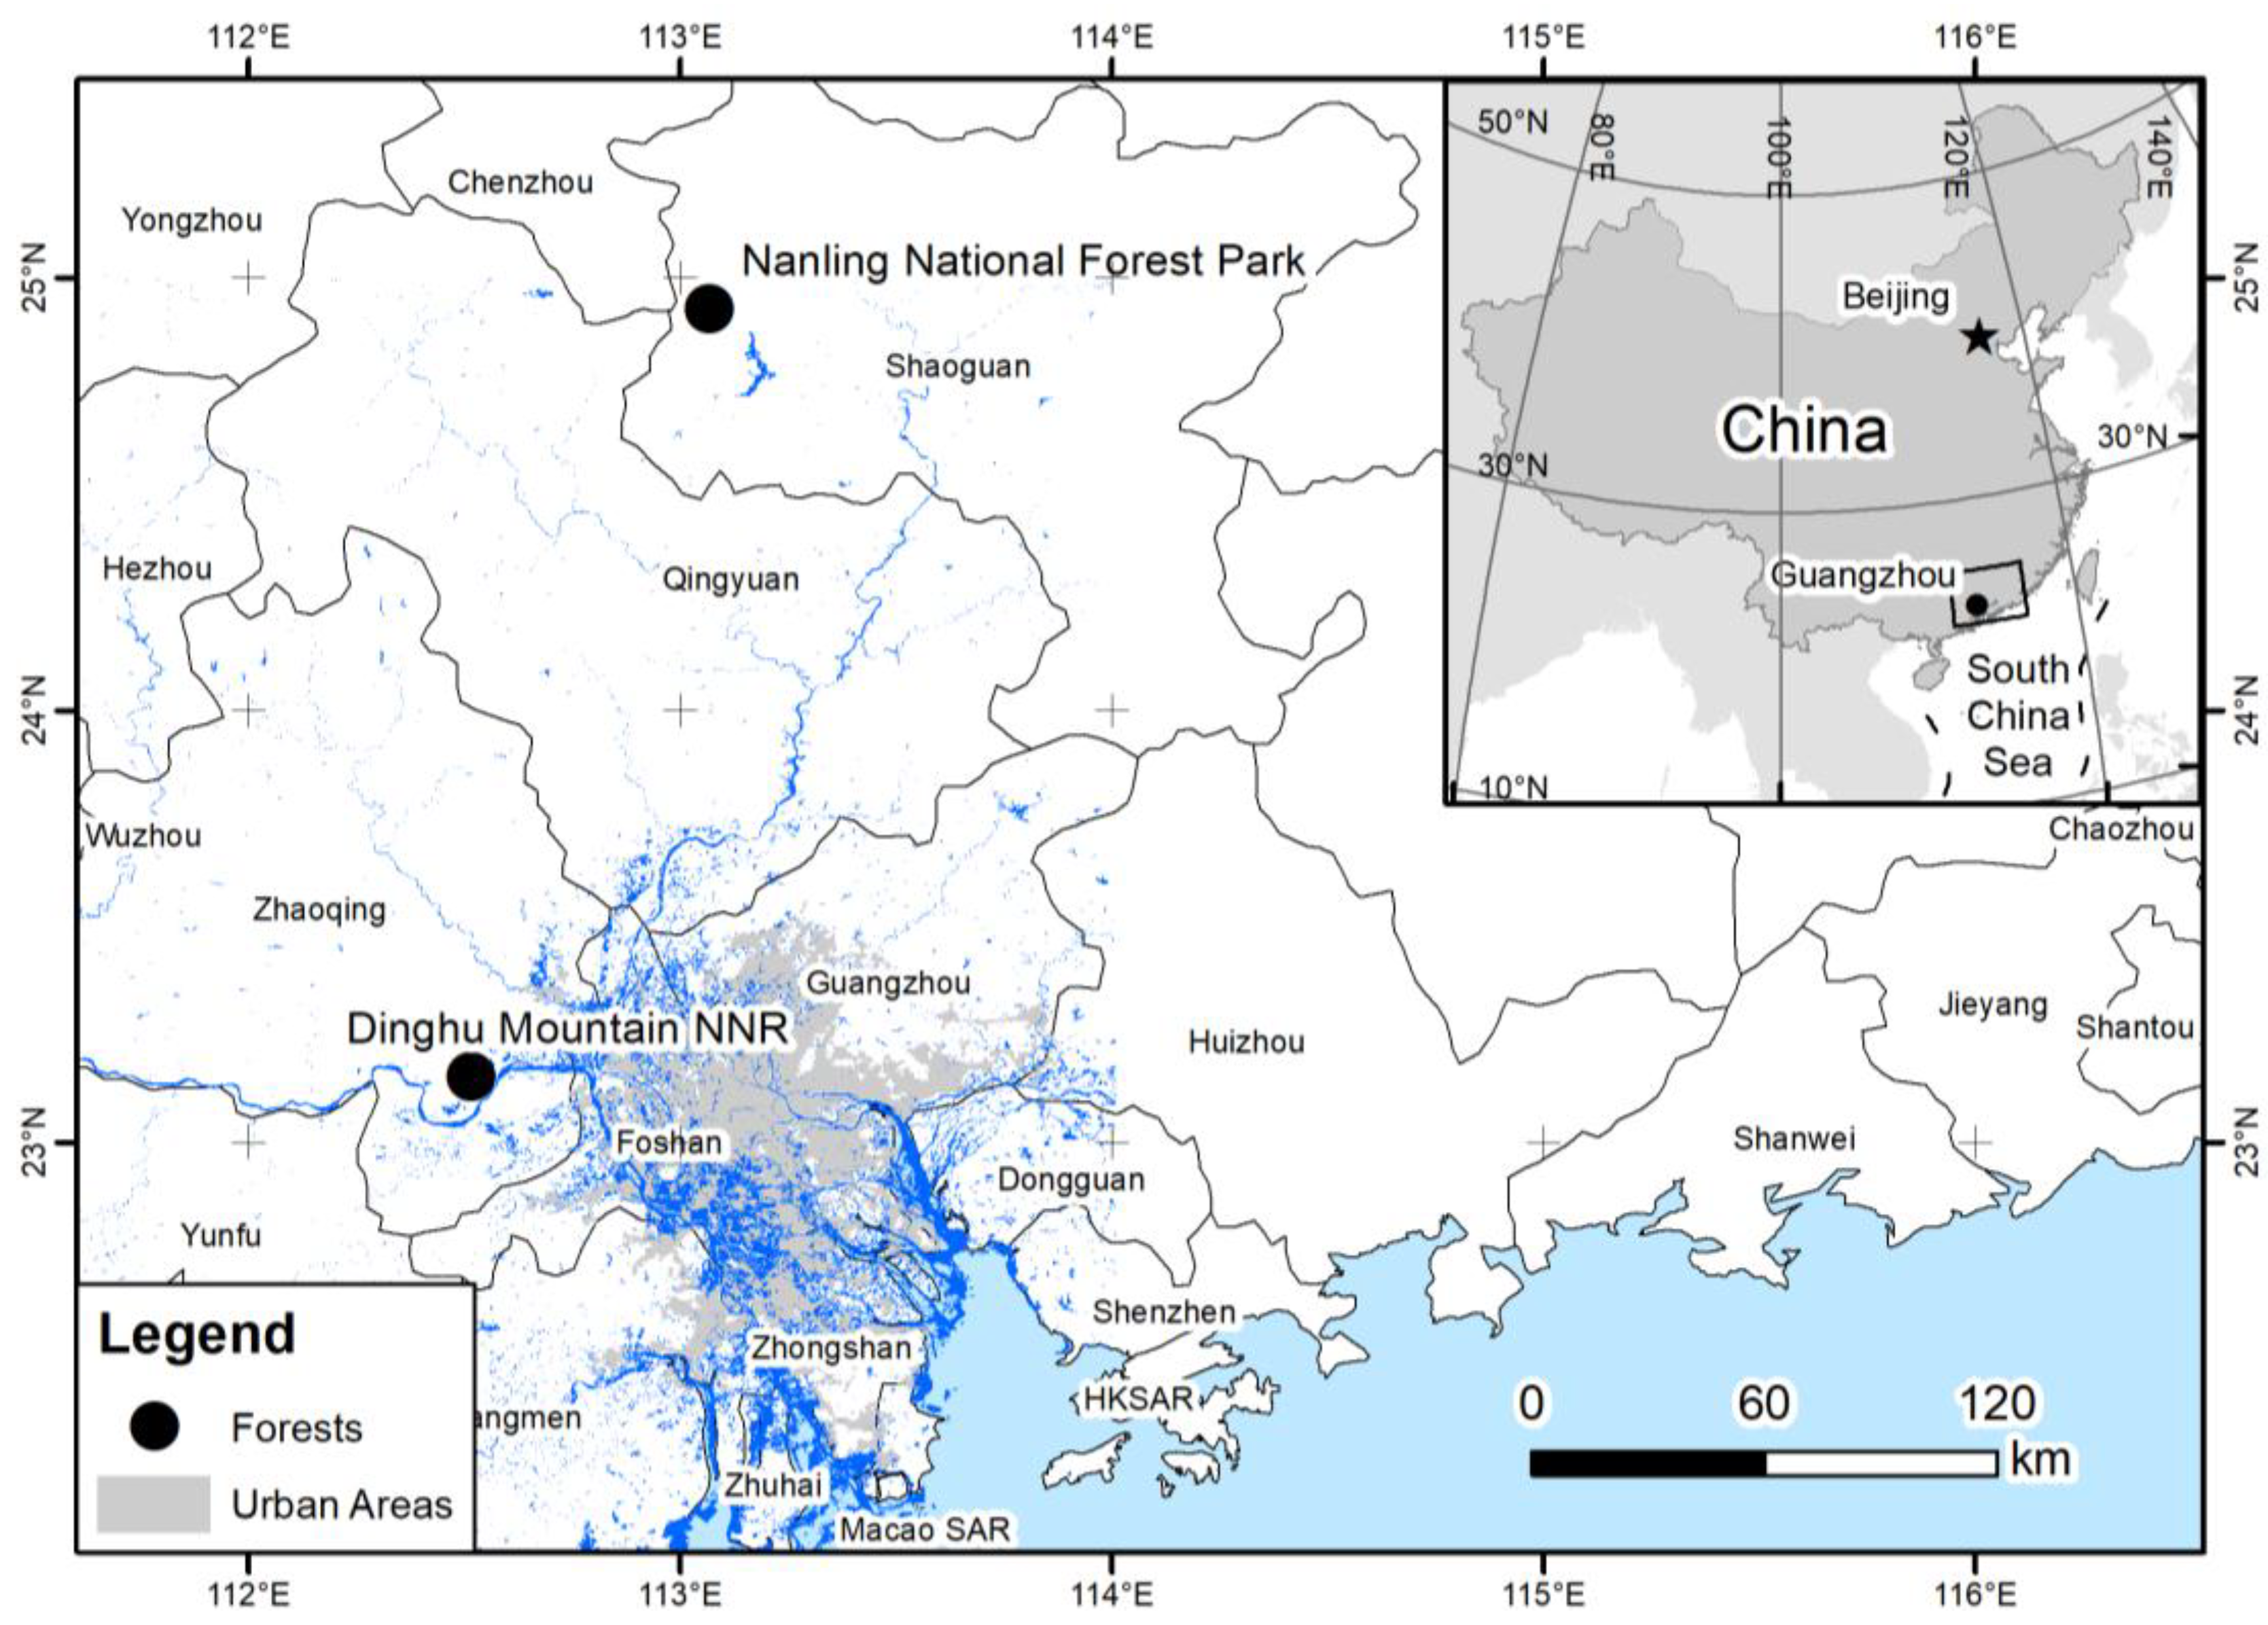
3.1. Study Area
3.2. Questionnaire Design
3.3. Sampling Method & Data Analysis
4. Results
4.1. Sociodemographic & Visitation Characteristics
4.2. Common Method Bias and Reliaiblity and Validitiy Test for EFA
4.3. Motivation of Respondents
4.4. Satisfaction Level of Respondents
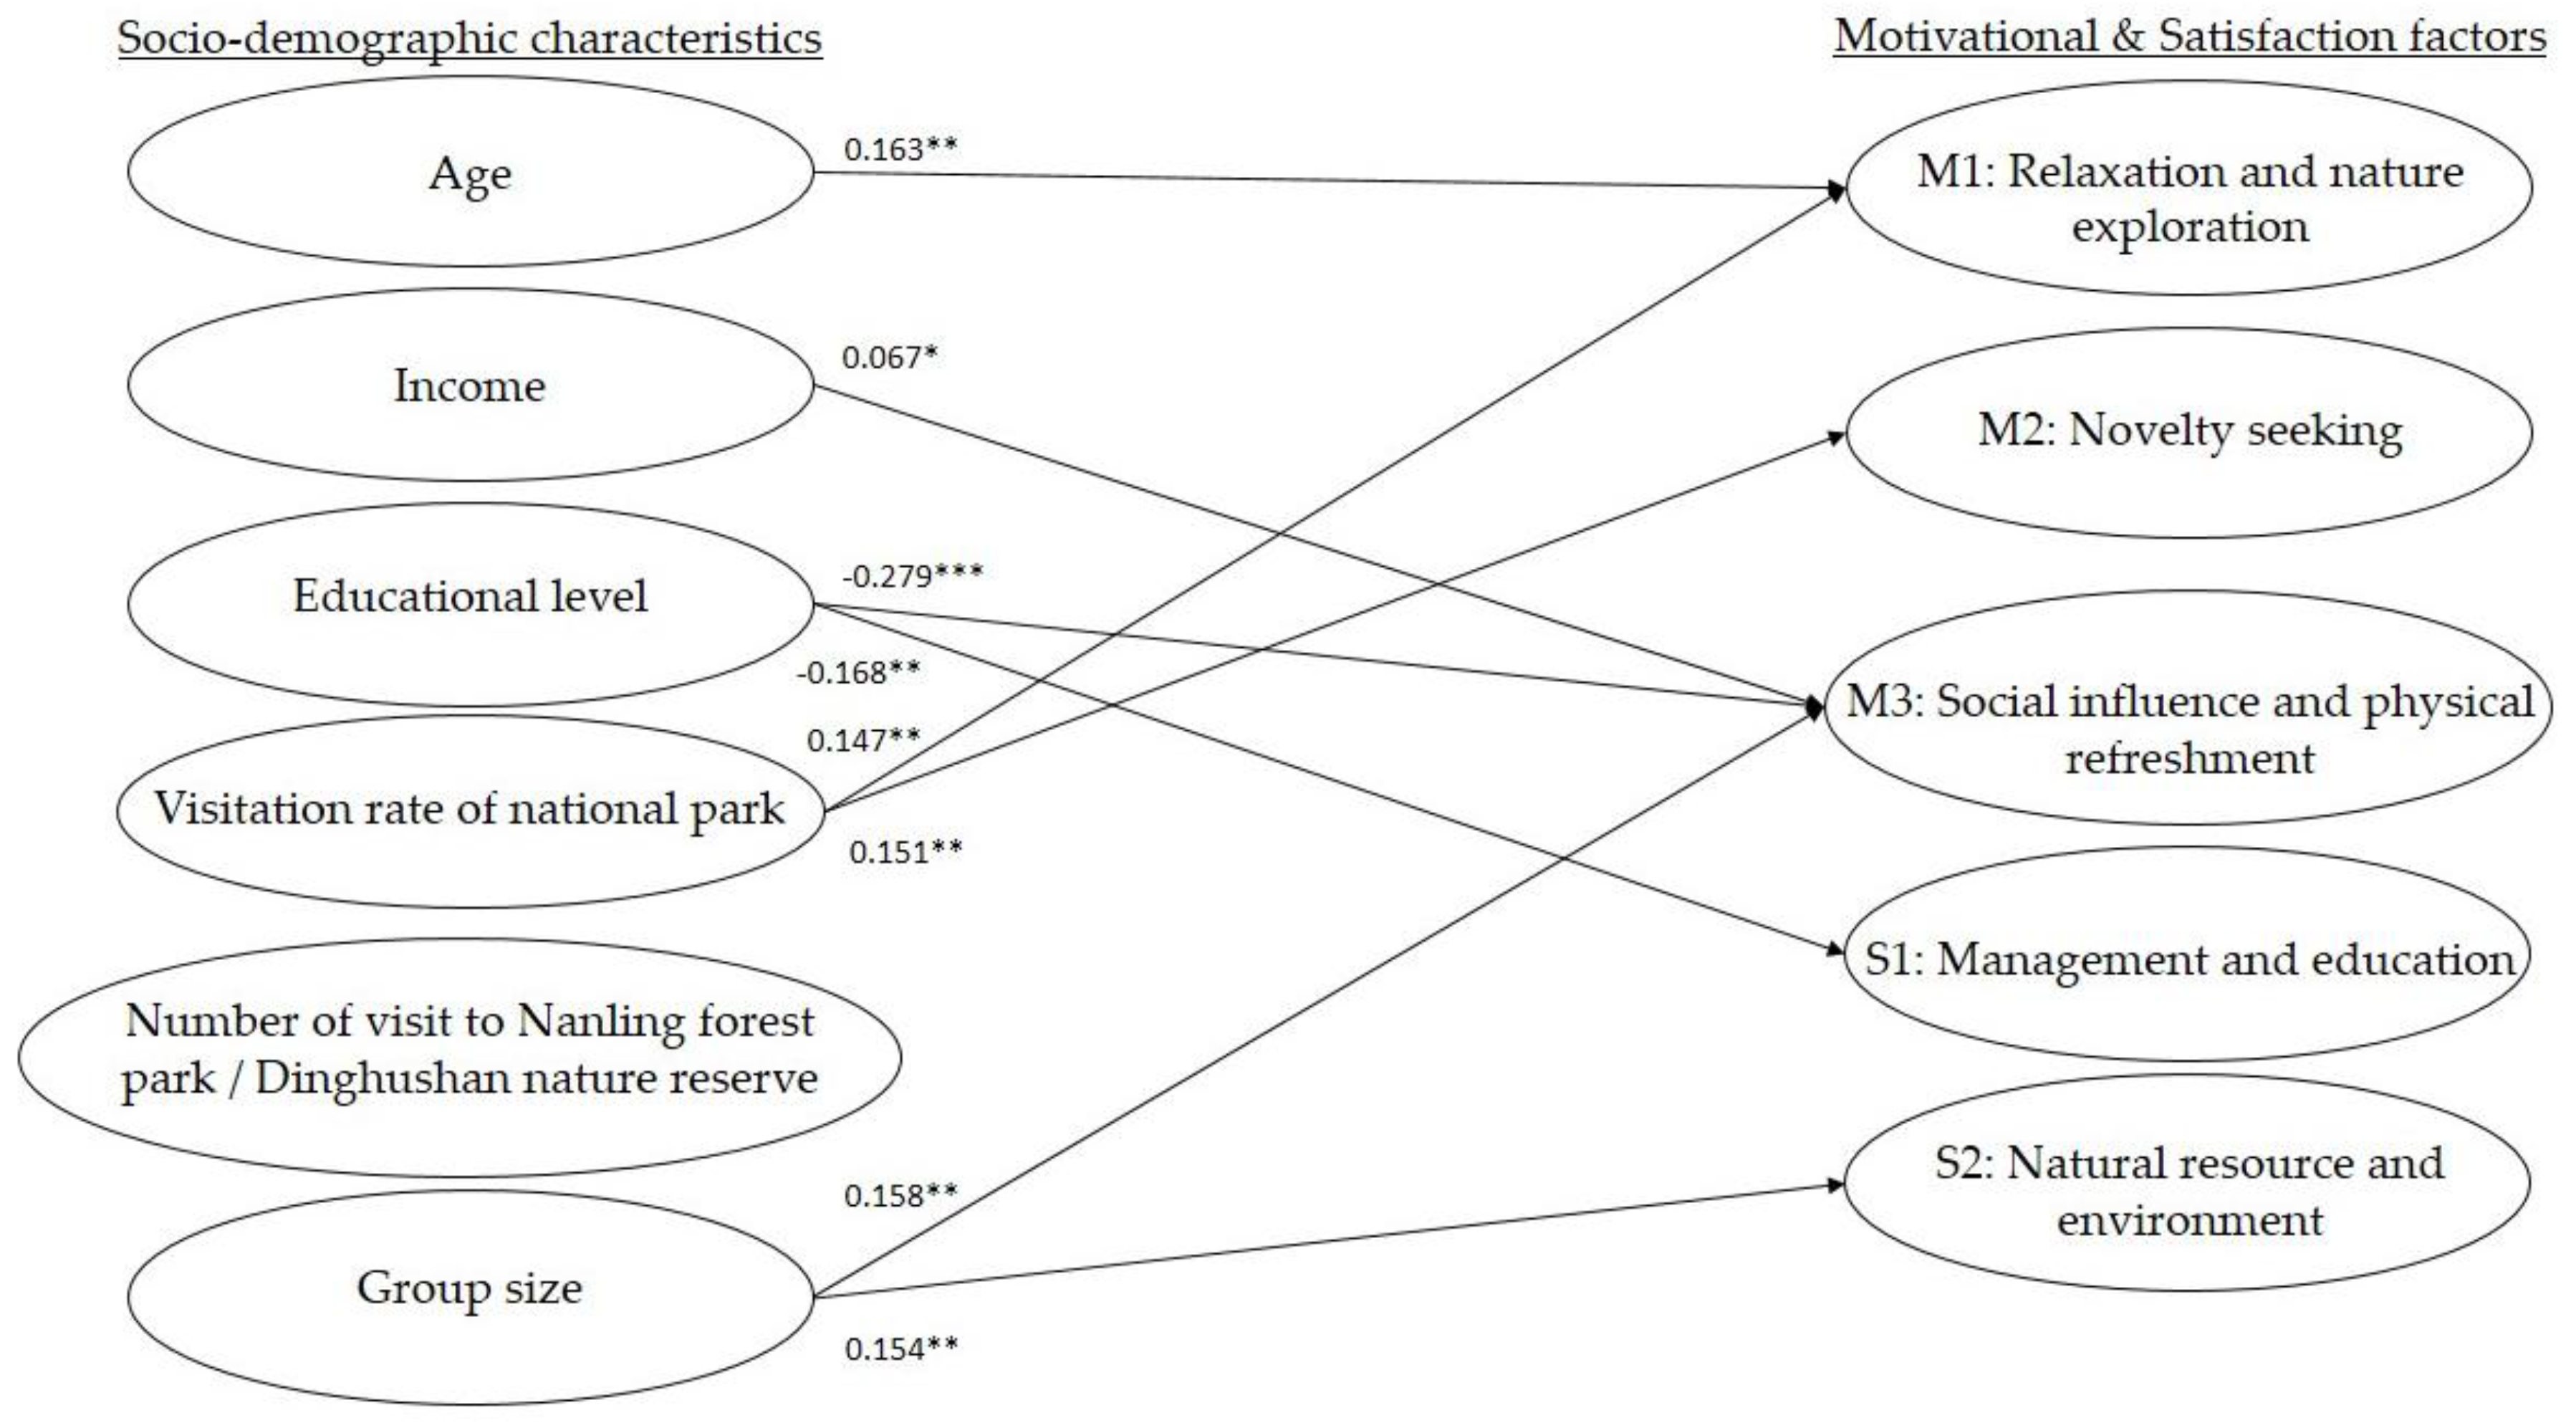
4.5. Association between Sociodemographic & Visitation Characteristics and Motivation
4.6. Association between Sociodemographic & Visitation Characteristics and Satisfaction
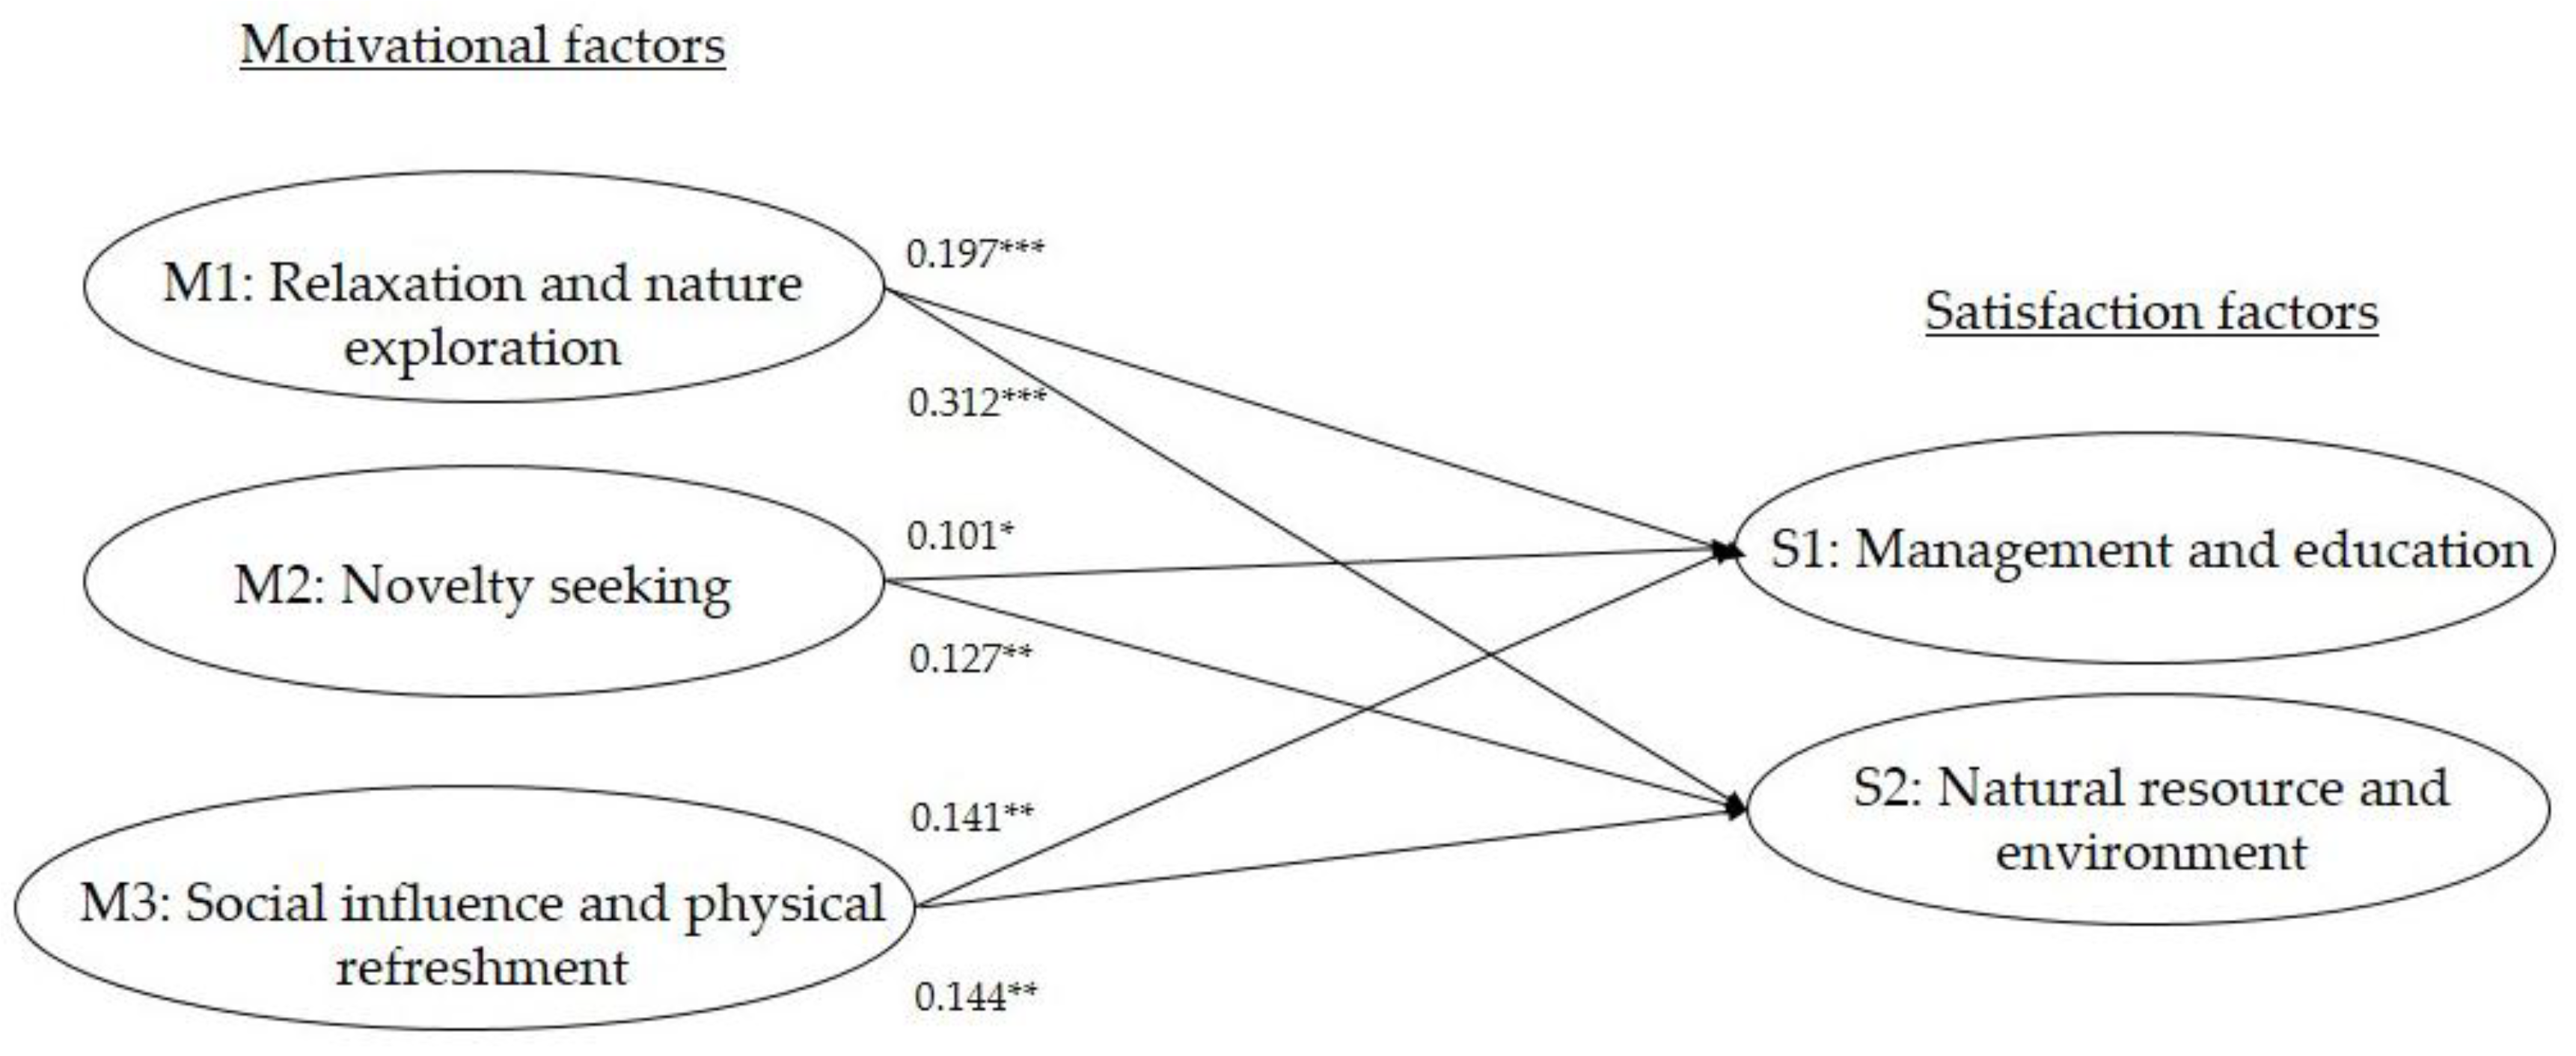
4.7. Association between Motivation and Satisfaction
5. Discussion
6. Conclusions
Author Contributions
Funding
Acknowledgments
Conflicts of Interest
References
- China Tourism Academy. Big Data of Chinese Outbound Tourist 2016; China Tourism Academy: Beijing, China, 2017.
- World Travel & Tourism Council. Travel & Tourism Economic Impact 2017, China; World Travel & Tourism Council: London, UK, 2017. [Google Scholar]
- Arlt, W. China’s Outbound Tourism; Routledge: Abingdon-on-Thames, UK, 2006. [Google Scholar]
- Farrell, K.; Westlund, H. China’s rapid urban ascent: An examination into the components of urban growth. Asian Geogr. 2018, 35, 85–106. [Google Scholar] [CrossRef]
- O’Connor, K.; Fuellhart, K.; Zhang, S. Change in the role of cities in China’s air transport 2005–2015. Asian Geogr. 2018. [Google Scholar] [CrossRef]
- The World Bank. Urban Population (% of Total). Available online: https://data.worldbank.org/topic/urban-development?locations=CN&view=chart (accessed on 23 January 2018).
- Matus, K.; Nam, K.M.; Selin, N.E.; Lamsal, L.N.; Reilly, J.M.; Paltsev, S. Health damages from air pollution in China. Glob. Environ. Chang. 2012, 22, 55–66. [Google Scholar] [CrossRef] [Green Version]
- Wang, Y. Environmental degradation and environmental threats in China. Environ. Monit. Assess. 2004, 90, 161–169. [Google Scholar] [CrossRef] [PubMed]
- Chan, R.Y. Determinants of Chinese consumers’ green purchase behavior. Psychol. Mark. 2001, 18, 389–413. [Google Scholar] [CrossRef]
- Li, W.; Han, N. Ecotourism management in China’s nature reserves. Ambio 2001, 30, 62–63. [Google Scholar] [CrossRef]
- State Forestry Administration of the People’s Republic of China. Development and Management of Forest Park in China 2015; State Forestry Administration of the People’s Republic of China: Beijing, China, 2015.
- Sparks, B.; Pan, G.W. Chinese outbound tourists: Understanding their attitudes, constraints and use of information sources. Tour. Manag. 2009, 30, 483–494. [Google Scholar] [CrossRef]
- Eagles, P.F.; McCool, S.F.; Haynes, C.D.; Phillips, A. Sustainable Tourism in Protected Areas: Guidelines for Planning and Management; IUCN: Gland, Switzerland, 2002; Volume 8. [Google Scholar]
- Lee, T.H. A structural model to examine how destination image, attitude, and motivation affect the future behavior of tourists. Leis. Sci. 2009, 31, 215–236. [Google Scholar] [CrossRef]
- Lee, A.K.; Abrahams, R.A. Naturalizing people, ethnicizing landscape: Promoting tourism in China’s rural periphery. Asian Geogr. 2018. [Google Scholar] [CrossRef]
- Adam, I.; Adongo, C.A.; Amuquandoh, F.E. A structural decompositional analysis of eco-visitors’ motivations, satisfaction and post-purchase behaviour. J. Ecotour. 2017, 1–22. [Google Scholar] [CrossRef]
- Kim, S.S.; Kim, M.; Park, J.; Guo, Y. Cave tourism: Tourists’ characteristics, motivations to visit, and the segmentation of their behavior. Asia Pac. J. Tour. Res. 2008, 13, 299–318. [Google Scholar] [CrossRef]
- Ozdemir, B.; Aksu, A.; Ehtiyar, R.; Çizel, B.; Çizel, R.B.; İçigen, E.T. Relationships among tourist profile, satisfaction and destination loyalty: Examining empirical evidences in Antalya region of Turkey. J. Hosp. Mark. Manag. 2012, 21, 506–540. [Google Scholar] [CrossRef]
- Tsiotsou, R.; Vasioti, E. Using demographics and leisure activities to predict satisfaction with tourism services in Greece. J. Hosp. Leis. Mark. 2006, 14, 69–82. [Google Scholar] [CrossRef]
- Jönsson, C.; Devonish, D. Does nationality, gender, and age affect travel motivation? A case of visitors to the Caribbean island of Barbados. J. Travel Tour. Mark. 2008, 25, 398–408. [Google Scholar] [CrossRef]
- Packer, J.; Ballantyne, R.; Hughes, K. Chinese and Australian tourists’ attitudes to nature, animals and environmental issues: Implications for the design of nature-based tourism experiences. Tour. Manag. 2014, 44, 101–107. [Google Scholar] [CrossRef] [Green Version]
- Sofield, T.; Li, F.M.S. China: Ecotourism and cultural tourism, harmony or dissonance. Crit. Issues Ecotour. Underst. Complex Tour. Phenom. 2007, 368–385. [Google Scholar]
- Cheung, L.T. The effect of geopark visitors’ travel motivations on their willingness to pay for accredited geo-guided tours. Geoheritage 2016, 8, 201–209. [Google Scholar] [CrossRef]
- Cheung, L.T.; Fok, L. The motivations and environmental attitudes of nature-based visitors to protected areas in Hong Kong. Int. J. Sustain. Dev. World Ecol. 2014, 21, 28–38. [Google Scholar] [CrossRef] [Green Version]
- Cheung, L.T.; Lo, A.Y.; Fok, L. Recreational specialization and ecologically responsible behaviour of Chinese birdwatchers in Hong Kong. J. Sustain. Tour. 2017, 25, 817–831. [Google Scholar] [CrossRef]
- Chow, A.S.; Cheng, I.N.; Cheung, L.T. Self-determined travel motivations and ecologically responsible attitudes of nature-based visitors to the Ramsar wetland in South China. Ann. Leis. Res. 2017. [Google Scholar] [CrossRef]
- Fung, C.K.; Jim, C. Segmentation by motivation of Hong Kong Global Geopark visitors in relation to sustainable nature-based tourism. Int. J. Sustain. Dev. World Ecol. 2015, 22, 76–88. [Google Scholar]
- Liu, K.S.; Gou, G.R.; Cheung, L.T. Understanding participants’ motivation and willingness to pay for joining ecotourism training courses in Hong Kong. Asian Geogr. 2016, 33, 23–34. [Google Scholar] [CrossRef]
- Mehmetoglu, M.; Normann, Ø. The link between travel motives and activities in nature-based tourism. Tour. Rev. 2013, 68, 3–13. [Google Scholar] [CrossRef]
- Beh, A.; Bruyere, B.L. Segmentation by visitor motivation in three Kenyan national reserves. Tour. Manag. 2007, 28, 1464–1471. [Google Scholar] [CrossRef]
- Crompton, J.L. An assessment of the image of Mexico as a vacation destination and the influence of geographical location upon that image. J. Travel Res. 1979, 17, 18–23. [Google Scholar] [CrossRef]
- Saayman, M.; Saayman, A. Why travel motivation and socio-demographics matter in managing a national park. Koedoe 2009, 51. [Google Scholar] [CrossRef]
- Holden, A.; Sparrowhawk, J. Understanding the motivations of ecotourists: The case of trekkers in Annapurna, Nepal. Int. J. Tour. Res. 2002, 4, 435–446. [Google Scholar] [CrossRef]
- Luo, Y.; Deng, J. The New Environmental Paradigm and nature-based tourism motivation. J. Travel Res. 2008, 46, 392–402. [Google Scholar] [CrossRef]
- Jang, S.S.; Feng, R. Temporal destination revisit intention: The effects of novelty seeking and satisfaction. Tour. Manag. 2007, 28, 580–590. [Google Scholar] [CrossRef]
- Chen, G.; Bao, J.; Huang, S.S. Segmenting Chinese backpackers by travel motivations. Int. J. Tour. Res. 2014, 16, 355–367. [Google Scholar] [CrossRef]
- Jensen, J.M. The relationships between socio-demographic variables, travel motivations and subsequent choice of vacation. In Proceedings of the 2nd International Conference on Economics, Business and Management, Singapore, 26–28 Feburary 2012; pp. 37–44. [Google Scholar]
- Lee, S.; Lee, S.; Lee, G. Ecotourists’ motivation and revisit intention: A case study of restored ecological parks in South Korea. Asia Pac. J. Tour. Res. 2014, 19, 1327–1344. [Google Scholar] [CrossRef]
- Bieger, T.; Laesser, C. Market segmentation by motivation: The case of Switzerland. J. Travel Res. 2002, 41, 68–76. [Google Scholar] [CrossRef]
- Beard, J.G.; Ragheb, M.G. Measuring leisure satisfaction. J. Leis. Res. 1980, 12, 20. [Google Scholar] [CrossRef]
- Buckley, R. Ecotourism: Principles and Practices; CABI: Wallingford, UK, 2009. [Google Scholar]
- Oliver, R.L. A cognitive model of the antecedents and consequences of satisfaction decisions. J. Mark. Res. 1980, 460–469. [Google Scholar] [CrossRef]
- Meng, F.; Tepanon, Y.; Uysal, M. Measuring tourist satisfaction by attribute and motivation: The case of a nature-based resort. J. Vacat. Mark. 2008, 14, 41–56. [Google Scholar] [CrossRef]
- Lee, C.F. Tourist satisfaction with forest recreation experience: A segment-based approach. Anatolia 2015, 26, 535–548. [Google Scholar] [CrossRef]
- Huang, Y.; Luo, S.; Ding, P.; Scott, N. Impressions of Liusanjie: A study of motivation, theatrical performance evaluation, and satisfaction. Curr. Issues Tour. 2014, 17, 280–296. [Google Scholar] [CrossRef]
- Liang, J.H.; Liang, R.D.; Wang, H.Y. The impact of tourist image and travel motivation on satisfaction in PengHu Geological Park. Sport Recreat. Res. 2010, 4, 116–138. [Google Scholar]
- Lee, T.H. An ecotourism behavioural model of national forest recreation areas in Taiwan. Int. For. Rev. 2007, 9, 771–785. [Google Scholar] [CrossRef]
- Barros, C.P.; Machado, L.P. The length of stay in tourism. Ann. Tour. Res. 2010, 37, 692–706. [Google Scholar] [CrossRef]
- State Forestry Administration of the People’s Republic of China. Development and Management of Forest Park in China 2016; State Forestry Administration of the People’s Republic of China: Beijing, China, 2017.
- Dinghushan Nature Reserve Management Authority. Social Environment. Available online: http://www.dhs.scib.cas.cn/gkjj/qqgk_shhj/ (accessed on 11 January 2018).
- Eagles, P.F. The travel motivations of Canadian ecotourists. J. Travel Res. 1992, 31, 3–7. [Google Scholar] [CrossRef]
- Podsakoff, P.M.; MacKenzie, S.B.; Podsakoff, N.P. Sources of method bias in social science research and recommendations on how to control it. Annu. Rev. Psychol. 2012, 63, 539–569. [Google Scholar] [CrossRef] [PubMed]
- Cronbach, L.J. Coefficient alpha and the internal structure of tests. Psychometrika 1951, 16, 297–334. [Google Scholar] [CrossRef] [Green Version]
- Tavakol, M.; Dennick, R. Making sense of Cronbach’s alpha. Int. J. Med. Educ. 2011, 2, 53. [Google Scholar] [CrossRef] [PubMed]
- Bland, J.M.; Altman, D.G. Statistics notes: Cronbach’s alpha. BMJ 1997, 314, 572. [Google Scholar] [CrossRef] [PubMed]
- Nunnally, J.C.; Bernstein, I.H. Psychometric Theory; McGraw-hill: New York, NJ, USA, 1967; Volume 226. [Google Scholar]
- Nunnally, J.C.; Bernstein, I.H. Psychometric Theory; McGraw-Hill Series in Psychology; McGraw-Hill: New York, NY, USA, 1994; Volume 3. [Google Scholar]
- Kaiser, H.F. The application of electronic computers to factor analysis. Educ. Psychol. Meas. 1960, 20, 141–151. [Google Scholar] [CrossRef]
- Ferguson, E.; Cox, T. Exploratory factor analysis: A users’ guide. Int. J. Select. Assess. 1993, 1, 84–94. [Google Scholar] [CrossRef]
- Podsakoff, P.M.; MacKenzie, S.B.; Lee, J.Y.; Podsakoff, N.P. Common method biases in behavioral research: A critical review of the literature and recommended remedies. J. Appl. Psychol. 2003, 88, 879. [Google Scholar] [CrossRef] [PubMed]
- Hair, J.F.; Black, W.C.; Babin, B.J.; Anderson, R.E.; Tatham, R.L. Análise Multivariada de Dados; Bookman Editora: Porto Alegre, Brazil, 2009. [Google Scholar]
- Hwang, K.K. Face and favor: The Chinese power game. Am. J. Sociol. 1987, 92, 944–974. [Google Scholar] [CrossRef]
- Li, J.J.; Su, C. How face influences consumption. Int. J. Mark. Res. 2007, 49, 237–256. [Google Scholar]
- Zipjet. The 2017 Global Least & Most Stressful Cities Ranking. Available online: https://www.zipjet.co.uk/2017-stressful-cities-ranking (accessed on 21 February 2018).
- Jim, C.; Shan, X. Socioeconomic effect on perception of urban green spaces in Guangzhou, China. Cities 2013, 31, 123–131. [Google Scholar] [CrossRef]
- Maller, C.; Townsend, M.; St Leger, L.; Henderson-Wilson, C.; Pryor, A.; Prosser, L.; Moore, M. Healthy parks, healthy people: The health benefits of contact with nature in a park context. George Wright Forum 2009, 26, 51–83. [Google Scholar]
- Ng, S.; Zhang, Y.; Ng, K.; Wong, H.; Lee, J. Living environment and quality of life in Hong Kong. Asian Geogr. 2018, 35, 35–51. [Google Scholar] [CrossRef]
- Yi, L. Ecotourism in Western Sichuan, China. Mt. Res. Dev. 2002, 22, 113–115. [Google Scholar]
- Aminrad, Z.; Zakaria, S.; Hadi, A.S. Influence of age and level of education on environmental awareness and attitude: Case study on Iranian students in Malaysian Universities. Soc. Sci. 2011, 6, 15–19. [Google Scholar] [CrossRef]
- Shen, J.; Saijo, T. Reexamining the relations between socio-demographic characteristics and individual environmental concern: Evidence from Shanghai data. J. Environ. Psychol. 2008, 28, 42–50. [Google Scholar] [CrossRef]
- Cheung, L.T.; Jim, C. Ecotourism service preference and management in Hong Kong. Int. J. Sustain. Dev. World Ecol. 2013, 20, 182–194. [Google Scholar] [CrossRef]
- Chien, M. An empirical study on the effect of attractiveness of ecotourism destination on experiential value and revisit intention. Appl. Ecol. Environ. Res. 2016, 15, 43–53. [Google Scholar] [CrossRef]
- Li, M.; Cai, L.A. The effects of personal values on travel motivation and behavioral intention. J. Travel Res. 2012, 51, 473–487. [Google Scholar] [CrossRef]
- Agrusa, J.; Kim, S.S.; Wang, K.C. Mainland Chinese tourists to Hawaii: Their characteristics and preferences. J. Travel Tour. Mark. 2011, 28, 261–278. [Google Scholar] [CrossRef]
- Deng, J.; Walker, G.J.; Swinnerton, G. A comparison of environmental values and attitudes between Chinese in Canada and Anglo-Canadians. Environ. Behav. 2006, 38, 22–47. [Google Scholar] [CrossRef]
- Kim, C.; Lee, S. Understanding the cultural differences in tourist motivation between Anglo-American and Japanese tourists. J. Travel Tour. Mark. 2000, 9, 153–170. [Google Scholar] [CrossRef]
- Pearce, P.L.; Wu, M.Y.; Osmond, A. Puzzles in understanding Chinese tourist behaviour: Towards a triple-C gaze. Tour. Recreat. Res. 2013, 38, 145–157. [Google Scholar] [CrossRef]
- Yau, O.H.; Chan, T.S.; Lau, K.F. Influence of Chinese cultural values on consumer behavior: A proposed model of gift-purchasing behavior in Hong Kong. J. Int. Consum. Mark. 1999, 11, 97–116. [Google Scholar] [CrossRef]
- Pan, S.; Ryan, C. Mountain areas and visitor usage–motivations and determinants of satisfaction: The case of Pirongia Forest Park, New Zealand. J. Sustain. Tour. 2007, 15, 288–308. [Google Scholar] [CrossRef]
- Ryan, C. Researching Tourist Satisfaction: Issues, Concepts, Problems; Routledge: Abingdon-on-Thames, UK, 1995. [Google Scholar]
- Weaver, D.B. The Encyclopedia of Ecotourism; CABI: Wallingford, UK, 2001. [Google Scholar]
- Weaver, D.B. Ecotourism as mass tourism: Contradiction or reality? Cornell Hotel Restaur. Adm. Q. 2001, 42, 104–112. [Google Scholar] [CrossRef]
- IUCN. Category V: Protected Landscape/Seascape. Available online: https://www.iucn.org/theme/protected-areas/about/protected-areas-categories/category-v-protected-landscapeseascape (accessed on 15 January 2018).
- Kan, J.M.; Zhi, W.; Qing, Z.G.; Ming, T.S.; Li, Z.H. Categorization standard of nature protected area in China based on the standard of IUCN. J. Ecol. Rural Environ. 2004, 20, 1–6. [Google Scholar]

| Number | % | Number | % | ||
|---|---|---|---|---|---|
| Gender | Visitation rate of national park in China (times per year) | ||||
| Male | 187 | 46.5 | 1 | 76 | 18.9 |
| Female | 215 | 54.5 | 2–5 | 256 | 63.7 |
| 6–9 | 36 | 9.0 | |||
| Age | 10 or above | 34 | 8.5 | ||
| 18–24 | 122 | 30.3 | |||
| 25–34 | 111 | 27.6 | Number of visit to Nanling forest park/Dinghushan nature reserve | ||
| 35–44 | 95 | 23.6 | 1 | 255 | 63.4 |
| 45–54 | 58 | 14.4 | 2 | 59 | 14.7 |
| 55–65 | 15 | 3.7 | 3 | 34 | 8.5 |
| >65 | 1 | 0.2 | 4 or above | 54 | 13.4 |
| Occupation | Group size (no. of person) | ||||
| Student | 79 | 19.7 | 1 | 8 | 2.00 |
| Unemployed | 17 | 4.2 | 2–5 | 183 | 45.5 |
| Employed | 290 | 72.1 | 6–9 | 91 | 22.6 |
| Retired | 16 | 4.0 | 10 or above | 120 | 29.9 |
| Education | Duration of visit (days) | ||||
| Primary school or below | 5 | 1.2 | 0–1 | 258 | 64.2 |
| Junior Secondary School | 41 | 10.2 | 2 | 102 | 25.4 |
| Senior Secondary School | 92 | 22.9 | 3–5 | 25 | 6.2 |
| Undergraduate | 249 | 61.9 | 6 or above | 17 | 4.2 |
| Postgraduate | 15 | 3.7 | |||
| Monthly Income (RMB) * | Place of residence | ||||
| <1000 | 92 | 23.1 | Guangdong | 387 | 96.5 |
| 1001–2500 | 51 | 12.8 | Shanghai | 3 | 0.5 |
| 2501–4000 | 83 | 20.8 | Jiangsu | 1 | 0.2 |
| 4001–5500 | 61 | 15.3 | Hunan | 6 | 1.4 |
| 5501–7000 | 44 | 11.0 | Fujian | 1 | 0.2 |
| >7000 | 68 | 17.0 | Hong Kong | 4 | 1.0 |
| Total | 402 | 100 | |||
| Rotated (Varimax) Components Factor Loading | ||||||
|---|---|---|---|---|---|---|
| Factors and Items | Mean | Standard Deviation | Cronbach’s Alpha | 1 | 2 | 3 |
| Factor 1. Relaxation and nature exploration (M1) | 4.359 | 0.802 | ||||
| A7. I would like to have fun in this park. | 4.35 | 0.804 | 0.482 | |||
| A8. I would like to see as much as possible in the time available. | 4.43 | 0.886 | 0.572 | |||
| A9. I would like to release the pressure from my work or daily life. | 4.36 | 0.837 | 0.558 | |||
| A13. I would like to get close to nature. | 4.54 | 0.734 | 0.796 | |||
| A14. I would like to refresh my mental state. | 4.41 | 0.832 | 0.681 | |||
| A15. I would like to participate in recreational activities (e.g., photography, hiking) at the park. | 4.09 | 1.005 | 0.584 | |||
| A22. I love the natural scenery of this park. | 4.33 | 0.717 | 0.611 | |||
| Factor 2. Novelty seeking (M2) | 3.976 | 0.774 | ||||
| A2. I would like to learn new things (e.g., geographical and biological knowledge). | 4.00 | 1.015 | 0.509 | |||
| A3. I must be occupied with activities in my spare time. | 4.27 | 0.838 | 0.456 | |||
| A4. I would like to be free to act the way I feel in this park. | 4.17 | 0.950 | 0.468 | |||
| A5. I would like to find thrills and excitement in this park. | 3.57 | 1.081 | 0.755 | |||
| A6. I would like to meet people with similar interests and hobbies. | 3.87 | 1.088 | 0.747 | |||
| Factor 3. Social influence and physical refreshment (M3) | 3.82 | 0.660 | ||||
| A10. My friends and family tell me to visit this park. | 3.56 | 1.261 | 0.811 | |||
| A11. I would like to refresh my physical state. | 3.97 | 1.066 | 0.649 | |||
| A12. I would like to talk about the trip after I return home. | 3.93 | 1.027 | 0.648 | |||
| Eigenvalues | 3.338 | 2.451 | 1.939 | |||
| Percentage of variance | 22.251 | 16.341 | 12.924 | |||
| Cumulative percentage | 38.592 | 51.516 | ||||
| Rotated (Varimax) Components Factor Loading | |||||
|---|---|---|---|---|---|
| Factors and Items | Mean | Standard Deviation | Cronbach’s Alpha | 1 | 2 |
| Factor 1. Management and education (S1) | 3.665 | 0.712 | |||
| D3. Convenience of public transport | 3.63 | 1.087 | 0.499 | ||
| D4. Tourism management of the park | 3.63 | 1.061 | 0.656 | ||
| D5. Sufficient security facilities (e. g. parapet, warning signs) | 3.90 | 2.717 | 0.528 | ||
| D6. Sufficient tourism facilities (e. g. tables and benches, car park, toilets, signposts) | 3.70 | 1.046 | 0.781 | ||
| D7. Sufficient educational information about biological species | 3.44 | 1.089 | 0.781 | ||
| D8. Integrated conservation strategy | 3.69 | 1.030 | 0.795 | ||
| Factor 2. Natural resources and environment (S2) | 4.245 | 0.751 | |||
| D1. Diverse species of flora and fauna | 4.14 | 0.866 | 0.872 | ||
| D2. Beautiful scenery and landscape | 4.35 | 0.804 | 0.839 | ||
| Eigenvalues | 2.855 | 2.049 | |||
| Percentage of variance | 35.691 | 25.617 | |||
| Cumulative percentage | 61.308 | ||||
| M1. Relaxation and Nature Exploration | M2. Novelty Seeking | M3. Social Influence & Physical Refreshment | |||||||
|---|---|---|---|---|---|---|---|---|---|
| Standardized Coefficient | Standard Error | Significance | Standardized Coefficient | Standard Error | Significance | Standardized Coefficient | Standard Error | Significance | |
| (Constant) | 0.359 | 0.070 | 0.359 | 0.547 | 0.351 | 0.549 | |||
| E1. Visitation rate of national parks | 0.147 | 0.069 | 0.007 | 0.151 | 0.069 | 0.006 | –0.034 | 0.068 | 0.613 |
| E2. Visitation rate of Nanling Forest Park/Dinghushan nature reserve | 0.028 | 0.049 | 0.603 | –0.101 | 0.049 | 0.061 | –0.006 | 0.048 | 0.900 |
| E3. Group size | –0.046 | 0.057 | 0.365 | 0.092 | 0.057 | 0.075 | 0.158 | 0.056 | 0.005 |
| E4. Duration of visit | –0.054 | 0.069 | 0.324 | 0.003 | 0.069 | 0.954 | 0.098 | 0.068 | 0.149 |
| F5. Age | 0.163 | 0.051 | 0.007 | 0.024 | 0.051 | 0.689 | 0.025 | 0.050 | 0.622 |
| F6. Education level | 0.012 | 0.071 | 0.827 | –0.044 | 0.071 | 0.423 | –0.279 | 0.069 | 0.000 |
| F8. Monthly income | 0.05 | 0.032 | 0.381 | –0.088 | 0.032 | 0.121 | 0.067 | 0.032 | 0.035 |
| R2 | 0.049 | 0.041 | 0.091 | ||||||
| Adj. R2 | 0.032 | 0.024 | 0.075 | ||||||
| F Statistic | 2.849 | 2.411 | 5.578 | ||||||
| Standard error | 0.985 | 0.987 | 0.965 | ||||||
| S1. Management and Education | S2. Natural Resources and Environment | |||||
|---|---|---|---|---|---|---|
| Standardized Coefficient | Standard Error | Significance | Standardized Coefficient | Standard Error | Significance | |
| (Constant) | 0.359 | 0.004 | 0.358 | 0.127 | ||
| E1. Visitation rate of national parks | –0.99 | 0.069 | 0.07 | 0.069 | 0.069 | 0.201 |
| E2. Visitation rate of Nanling Forest Park/Dinghushan nature reserve | 0.13 | 0.049 | 0.816 | 0.094 | 0.049 | 0.079 |
| E3. Group size | –0.03 | 0.057 | 0.561 | 0.154 | 0.057 | 0.003 |
| E4. Duration of visit | –0.004 | 0.069 | 0.937 | 0.032 | 0.069 | 0.559 |
| F5. Age | 0.021 | 0.051 | 0.731 | 0.033 | 0.051 | 0.576 |
| F6. Education level | –0.168 | 0.071 | 0.002 | –0.08 | 0.071 | 0.14 |
| F8. Monthly income | 0.022 | 0.032 | 0.703 | –0.011 | 0.032 | 0.841 |
| S1. Management and Education | S2. Natural Resources and Environment | |||||
|---|---|---|---|---|---|---|
| Standardized Coefficient | Standard Error | Significance | Standardized Coefficient | Standard Error | Significance | |
| (Constant) | 0.048 | 0.996 | 0.047 | 0.965 | ||
| M1. Relaxation and nature exploration | 0.197 | 0.048 | 0 | 0.312 | 0.047 | 0 |
| M2. Novelty seeking | 0.101 | 0.048 | 0.038 | 0.127 | 0.047 | 0.007 |
| M3. Social influence and physical refreshment | 0.141 | 0.048 | 0.004 | 0.144 | 0.047 | 0.002 |
| R2 | 0.069 | 0.134 | ||||
| Adj. R2 | 0.062 | 0.128 | ||||
| F statistic | 9.765 | 20.536 | ||||
| Standard error | 0.97 | 0.934 | ||||
| Dependent variable: Satisfaction | ||||||
© 2018 by the authors. Licensee MDPI, Basel, Switzerland. This article is an open access article distributed under the terms and conditions of the Creative Commons Attribution (CC BY) license (http://creativecommons.org/licenses/by/4.0/).
Share and Cite
Ma, A.T.H.; Chow, A.S.Y.; Cheung, L.T.O.; Lee, K.M.Y.; Liu, S. Impacts of Tourists’ Sociodemographic Characteristics on the Travel Motivation and Satisfaction: The Case of Protected Areas in South China. Sustainability 2018, 10, 3388. https://doi.org/10.3390/su10103388
Ma ATH, Chow ASY, Cheung LTO, Lee KMY, Liu S. Impacts of Tourists’ Sociodemographic Characteristics on the Travel Motivation and Satisfaction: The Case of Protected Areas in South China. Sustainability. 2018; 10(10):3388. https://doi.org/10.3390/su10103388
Chicago/Turabian StyleMa, Anson T. H., Alice S. Y. Chow, Lewis T. O. Cheung, Karen M. Y. Lee, and Shuwen Liu. 2018. "Impacts of Tourists’ Sociodemographic Characteristics on the Travel Motivation and Satisfaction: The Case of Protected Areas in South China" Sustainability 10, no. 10: 3388. https://doi.org/10.3390/su10103388