Abstract
Many academic introductions suffer from inconsistencies and a lack of comprehensive structure, often failing to effectively outline the core elements of the research. This not only impacts the clarity and readability of the article but also hinders the communication of its significance and objectives to the intended audience. This study aims to automate the CaRS (Creating a Research Space) model using machine learning and natural language processing techniques. We conducted a series of experiments using a custom-developed corpus of 50 biology research article introductions, annotated with rhetorical moves and steps. The dataset was used to evaluate the performance of four classification algorithms: Prototypical Network (PN), Support Vector Machines (SVM), Naïve Bayes (NB), and Random Forest (RF); in combination with six embedding models: Word2Vec, GloVe, BERT, GPT-2, Llama-3.2-3B, and TEv3-small. Multiple experiments were carried out to assess performance at both the move and step levels using 5-fold cross-validation. Evaluation metrics included accuracy and weighted F1-score, with comprehensive results provided. Results show that the SVM classifier, when paired with Llama-3.2-3B embeddings, consistently achieved the highest performance across multiple tasks when trained on preprocessed dataset, with 79% accuracy and weighted F1-score on rhetorical moves and strong results on M2 steps (75% accuracy and weighted F1-score). While other combinations showed promise, particularly NB and RF with newer embeddings, none matched the consistency of the SVM–Llama pairing. Compared to existing benchmarks, our model achieves similar or better performance; however, direct comparison is limited due to differences in datasets and experimental setups. Despite the unavailability of the benchmark dataset, our findings indicate that SVM is an effective choice for rhetorical classification, even in few-shot learning scenarios.
1. Introduction
Academic writing requires familiarity with frameworks to effectively structure content, with a strong focus on the introduction to establish the research context and identify the gap. The CaRS (Creating a Research Space) model [1,2] is widely adopted for this purpose, guiding the writers to justify the niche of their study by identifying the research gap(s) being addressed. This usually involves rhetorical work to establish novelty and significance. However, presenting a clear research gap can be challenging, particularly for non-native English speakers, who often face added cognitive demands in balancing language structure with evidence organisation [3,4].
The CaRS model outlines three rhetorical moves (i.e., sentences or longer chunks) that contribute to a logical and persuasive research introduction) that serve a specific purpose in a piece of writing. These moves include: (1) Establishing a territory, which introduces the general topic and emphasise its significance; (2) Establishing a Niche, identifying a gap or problem in existing research; and (3) Occupying the Niche, outlining the purpose and relevance of current research in addressing the identified gap. The indicative sentence(s) within each move can be decomposed into finer steps that may be considered ‘optional’, ‘obligatory’ and/or ‘expected’ (see Table 1). These rhetorical moves and steps offer authors a roadmap to organise the context, purpose, objectives, review of the literature, and the broader significance of their research logically and persuasively. Furthermore, there are frameworks for structuring individual components within a presentation such as PIE (Point, Illustration, and Explanation) and PEEL (Point, Evidence, Explanation, and Link) used to structure paragraphs.
Inconsistent presentation of these elements can significantly impede reader comprehension, often arising from assumptions about the relationship between language and culture, a complex area still under exploration [5]. A well-structured article should explicitly define the knowledge gaps it addresses, clarifying its contribution to existing research. Disciplinary variations in writing structure also contribute to inconsistencies, as each academic subdiscipline functions within its own discourse community, with distinct structural conventions. Despite these variations, a fundamental rhetorical structure underlies all language groups and disciplines. This common structure is evident in the writing patterns of native English speakers, second language learners, and foreign language learners, emphasising the universal applicability of the CaRS model in different academic contexts to define knowledge gaps and their contributions to the field [6]. Thus, researchers are increasingly looking for ways to implement educational systems with knowledge of the CaRS framework.
The effectiveness of the CaRS model has been widely endorsed in research, with multiple studies [7,8,9] affirming its utility in structuring research article introductions and helping authors effectively position their work within the academic landscape. However, inconsistent adherence to this structure remains a challenge, as some publications fail to address or occupy the identified research gap, further underscoring the need for structured frameworks like CaRS to promote clarity and coherence in academic writing.
Additionally, Cotos and Pendar [10] employed a support vector machine (SVM) [11] to classify sentences from introduction sections into both communicative moves and rhetorical steps (also called CaRS steps), using semi-automated methods presented by Suryani et al. [12] and Anthony [13]. Further studies [14] have manually compared CaRS with IMRaD (Introduction, Methods, Results, and Discussion) [15], a different writing structure often required in scientific and research papers. Most of these studies are domain-specific and in an early stage, with limited publicly available annotated data. Despite advances in NLP for tasks such as text classification, information extraction, and sentiment analysis, there has been little public discussion about the use of NLP and machine learning (ML) to automate the evaluation of research article introductions for structural compliance with academic writing frameworks [16].
Aim and Objectives
The goal of this research is to automate the support mechanisms for academic writing by developing models capable of assisting novice writers through targeted rhetorical discourse analysis, to augment writing skills education. The task involves supervised learning on a small imbalanced dataset. The following objectives were deemed necessary to demonstrate the study’s aim:
- Objective 1: to address the lack of existing openly available datasets for the task. This involves developing a curated dataset annotated with CaRS moves and steps.
- Objective 2: to automate the annotation of CaRS moves and steps in a given introduction. This involved rigorous experiments using existing NLP techniques and different ML algorithms to develop and validate suitable models.
We note that the benchmark study [10] that performed a similar task achieved accuracy of 72.6% and 72.9% using SVM, 10-fold cross-validation with a combined unigram and trigram feature on move and step classifications. However, the experimental dataset is not publicly available, so we developed a small dataset of 50 articles published in the biology domain [17]. Given the limited size of available annotated data, we framed the task (in this study) as a few-shot learning problem involving four algorithms (Prototypical Networks (PN) [18], SVM, Naïve Bayes (NB) [19], and Random Forest (RF) [20]). We hypothesised that models combining rich semantic embeddings with classifiers capable of handling sparse or imbalanced data would perform better in detecting CaRS moves and steps in a given introduction. We explored the performance of six embedding models, including Word2vec [21], Global Vectors (GloVe) [22], Bidirectional Encoder Representations from Transformers (BERT) [23], Generative Pre-trained Transformer 2 (GPT-2) [24], Large Language Model Meta AI 3.2-3B from Transformers (Llama-3.2-3B) [25], and OpenAI’s text-embedding-3-small (TEv3-small) (accessed on 1 May 2025). The evaluation was based on 5-fold cross-validation to gauge performance with metrics such as accuracy, precision, recall, and weighted F1-score. By addressing the research objectives, this study makes the following contributions:
- We curated and publicly released a new dataset (titled CaRS-50 Dataset) annotated with CaRS moves and steps, addressing a critical gap in open resources for rhetorical analysis. This dataset not only underpins our experiments, but also serves as a valuable resource for the broader research community working on academic writing support and rhetorical structure identification.
- We provide a hypothesis-driven evaluation of few-shot learning methods for classifying CaRS moves and steps, using a systematically selected set of models and embedding strategies. The findings offer insight into model suitability under limited data conditions and establish a reproducible baseline for future research in automated rhetorical analysis.
- We demonstrate the effectiveness of combining state-of-the-art embedding models with classical few-shot classifiers for moves and steps identification, even in small annotated corpora. Specifically, we show that SVM combined with Llama embeddings achieves superior performance, highlighting the importance of choosing embedding-classifier pairs suited to the task structure and data constraints.
The rest of the paper is structured as follows: Section 2 provides details on related work and the necessary background for the techniques and tools used in our experiment. The experimental data and the methodology approach, including details about the setup of the experiment and the evaluation measures, are presented in Section 3. Section 4 presents our findings. The analysis of results, including issues that are likely to threaten the validity of the results, is discussed in Section 5. Section 6 summarises the study and points out future work.
2. Background and Related Work
The CaRS model is built on centuries of scholarly inquiry, offering a structured framework to understand and craft academic writing in disciplinary contexts [1]. This model initially outlines four strategic moves that include ‘Establishing the field’, ‘Summarising previous research’, ‘Creating a research space by indicating a gap’, and ‘Introducing the present research’. This was later condensed and refined into three moves, i.e., ‘Establishing a territory’, ‘Establishing a niche’, and ‘Occupying the niche’ based on experiments conducted on the introduction section of forty-eight scientific articles across the natural and social sciences field [1].
Previous studies have compared various methods to detect the compliance of scientific articles using models such as CaRS and IMRaD [12,13,26] across computer science-related disciplines. This has been observed in other disciplines, notably Samraj [9] who conducted a manual comparison of the introductions of 12 research articles using CaRS, to show its applicability across disciplines of wildlife behaviour and conservation biology. Nwogu [14], also conducted a manual analysis of health sciences-related articles using CaRS and IMRaD, respectively. Although thorough, this manual analysis is time-consuming and limited in sampling, but automated tools in this research area are still developing in effectiveness.
Automating compliance detection in research articles is gaining traction, with studies employing ML and rule-based approaches showing promising results. Previous work by Anthony and Lashkia [3], introduced Mover, a supervised ML tool aimed at aiding non-native English speakers in analysing and writing technical paper abstracts in the information technology field at the discourse level. Using a modified bag of clusters model with NB classifier, the system identified structural moves in 100 abstracts of research articles published in the IEEE [27] index of Transactions on Parallel and Distributed Systems. It achieved an average first-order accuracy of over 5-fold cross-validation, with a potential improvement to when users were offered a choice between the two main decisions of the system and additional features, such as flow optimisation and retraining applied to the model. The dataset split was (80:20) ratio with (554:138) examples allocated for (training:testing). Unfortunately, the data are not publicly available. However, Mover was reported to have reduced the analysis time for students from over an hour to 15 min, allowing them to identify overlooked structural features and providing balanced feedback compared to their self-assessments. However, its efficacy is constrained by the limited scope of training data and the focus on a single discipline. The authors emphasised the need for expansion to diverse text types to benefit teachers and discourse analysts.
Similarly, Knight et al. [28] introduced AcaWriter, a browser-based application that uses NLP to identify moves in academic writing. Based on the concept-matching framework [29], it matches metadiscourse cues with constituent concepts like [PREVIOUS], [PUBLICATION], and [IDEA] using syntactic parsing, dependency extraction, and pattern-matching rules. It combines three open-source components: AcaWriter (the user interface), Text Analytics Pipeline (TAP), and Athanor which employs Stanford CoreNLP to generate dependency trees, part-of-speech tags, and named entity tags, then applies rules to label moves. TAP provides a unified API for additional text analysis, such as n-grams and text cleaning. The tool was deployed in three academic areas with varying numbers of students to gauge the user experience: law (90 students), accounting (403 students) and doctoral students (). The results indicate that students who receive feedback from AcaWriter are more likely to improve their draft texts and effectively incorporate rhetorical moves into their writing. Unfortunately, the study does not specify the dataset used during development or provide details about the training and testing evaluation processes.
Cotos and Pendar [10] investigated the potential of the Research Writing Tutor (RWT), an automated writing evaluation system, to classify discourse elements within the introduction sections of research articles. Using a supervised cascade of SVM classifiers with 10-fold cross-validation for model evaluation, the authors categorised sentences into moves and steps following the CaRS model [1]. The RWT was developed using a multi-disciplinary corpus of 1020 research articles, drawn from reputable online journals spanning 51 disciplines. The corpus, comprising 1,322,089 words, was manually annotated for rhetorical structures by three expert coders. The reliability between the notators was calculated based on 30 texts (18 selected randomly and 12 chosen intentionally) to represent various rhetorical challenges, producing values of the intraclass correlation coefficients indicative of high agreement for moves and steps . The corpus was partitioned into a subset of 650:370 (training:testing) texts. The system achieved a move classification accuracy of 72.6% and a step classification accuracy of 72.9%.
In a related study, Sun [30] investigated the potential of a web-based Scholarly Writing Template (SWT) to help non-native English speakers improve their academic writing within technical fields. The SWT featured two main components: an information template, designed to structure moves, and a language template, which provided corpus-based examples for sentence construction. However, this study involved 20 Taiwanese graduate students (18 males, 2 females; 95% doctoral, 5% master’s), who specialise in fields such as communication engineering, electronics engineering, photonics, electrical and control engineering, and computer science. Notably, 75% of the participants had experience drafting papers or dissertations, and 50% had published in international journals.
The integration of SWT into an academic writing course yielded positive results, with participants evaluating its usefulness in the development of writing skills at a mean of 4.03 (SD = 0.49) on a five-point Likert scale. The information template provided a clear framework for structuring key research sections, while the language template supported discipline-specific sentence patterns. Less proficient users relied heavily on the language template, while advanced users used it to refine style and grammar. In general, the participants reported improved writing processes, with variations based on proficiency and prior experience. Unfortunately, the dataset was not publicly shared, limiting reusability and highlighting the broader issue of data scarcity in this field.
In a recent study, Kim and Lu [31] explored the effectiveness of OpenAI’s GPT-3.5 Turbo model for automated CaRS move and step annotation. Experiments were performed on 100 articles from Applied Linguistics, split into 80:10:10 (training:testing:validation) ratio. This corpus, sourced from high-impact journals published between 2012 and 2016 was cleaned and manually annotated for moves and steps by a team of seven researchers, following the refined version of the CaRS model [1]. Multiple experiments and evaluations were performed iteratively using the OpenAI Playground platform which provides Application Programming Interface (API) access through a graphical user interface for ease of use. The experimental steps involved (i) prompt only, (ii) refined prompt only (after (i)), (iii) fine-tuning with 3, 40, and 80 annotated articles. The results show an improvement in the accuracy from 28.5% (moves) and 11.3% (steps) using prompt only to 92.3% (moves) and 80.2% (steps) after fine-tuning with 80 annotated articles.
Despite promising outcomes, the reviewed studies highlight several limitations that restrict their comparability with our work. For example, Mover focuses on the abstract section (rather than the introduction), omitting key stages like ‘Review previous research’ and ‘Indicate a gap’, which diminishes its use for the core purpose of CaRS. That said, we note that abstracts are also a popular object of study, parallel to introductions in applied linguistics. AcaWriter also offers valuable tools to detect moves but does not fully address all CaRS steps, limiting its ability to comprehensively analyse academic texts.
Contextual limitations also emerge across other tools. RWT surpasses earlier systems like Mover in identifying rhetorical structures, but struggles to capture context-dependent relationships due to its treatment of sentences as independent units. This challenge is compounded by the difficulties in detecting ambiguous or sparsely represented rhetorical steps. Notably, RWT, SWT, and the GPT-based study by Kim and Lu [31] all suffer from a lack of publicly available datasets, which restricts reusability and further underscores the pervasive issue of data scarcity in this research area. The GPT-based study, while promising, raises concerns about multi-label evaluation metrics and potential biases introduced by persistent memory during experiments. Together, these limitations highlight gaps in current approaches to rhetorical analysis, particularly in terms of dataset accessibility, coverage of rhetorical structures, and context sensitivity. Thus, our study involved the creation of a new, albeit modest, corpus centred on the introduction section of articles, aligning with the original purpose of the CaRS model. Although the corpus consists of only 50 articles in a single domain (Biology), its focus on introductions and the transparency of the dataset represents a valuable step in fostering further research in this area.
3. Materials and Methods
This section outlines the experimental materials, including details of the experimental dataset and its properties; the techniques used to prepare the dataset for experiments; the ML algorithms and embedding models used; and the evaluation metrics to measure performance.
3.1. Raw Data and Annotation Process
The dataset for this experiment comprises 50 manually annotated ‘introductions’ section of open access articles in the biology domain obtained from BioRxiv (www.biorxiv.org/, accessed on 1 January 2024). The articles were randomly selected from five categories: ‘Animal Behavior and Cognition’, ‘Biochemistry’, ‘Biophysics’, ‘Ecology’, and ‘Physiology’, with ten articles obtained for each category Lam and Nnamoko [17]. Each sentence in these introductions was annotated according to the rhetorical moves and steps defined in the CaRS model. To support clarity and accessibility, Table 1 provides a comprehensive overview of the CaRS framework. The model divides a typical research article introduction into three major rhetorical moves, each serving a distinct communicative purpose. Within each move are more granular rhetorical steps that reflect specific discourse functions.

Table 1.
Experimental dataset characteristics indicating code annotation for CaRS moves and steps by [1].
Table 1.
Experimental dataset characteristics indicating code annotation for CaRS moves and steps by [1].
| Move/Steps | Description | Code | Example | |
|---|---|---|---|---|
| Move 1 | Step 1 | Claim centrality | 1a | The relationship between circadian rhythms and gene expression has attracted considerable interest |
| Step 2 | Make topic generalisations | 1b | Photosynthetic processes are well-documented across most plant species | |
| Step 3 | Review previous research | 1c | Recent studies by Smith et al. (2021) have explored chloroplast biogenesis under stress | |
| Move 2 | Step 1 | Counter-claiming | 2a | However, the link between light exposure and root development remains disputed |
| Step 2 | Indicate a gap | 2b | Few studies have examined this process in non-flowering plants | |
| Step 3 | Question-raising | 2c | It remains unclear whether these mechanisms are conserved across species | |
| Step 4 | Continue a tradition | 2d | Following earlier investigations by Lee et al., we examine… | |
| Move 3 | Step 1a | Outline purposes | 3a | This study aims to investigate the genetic basis of adaptation in Arctic species |
| Step 1b | Announce present research | 3b | We conducted a comparative genomic analysis of… | |
| Step 2 | Announce main findings | 3c | Our results reveal a strong correlation between gene X and phenotype Y | |
| Step 3 | Indicate article structure | 3d | The paper is organised as follows: Section 2 outlines the methodology… | |
These moves and steps form the annotation scheme applied to the corpus, enabling automated rhetorical classification. Table 1 provides the shorthand codes used (e.g., 1a, 2b, 3c) and the corresponding step descriptions, serving both as a training reference and as interpretative guidance for readers less familiar with rhetorical genre theory.
Two of the co-authors (CL and NN) were involved in the annotation task. CL, a senior lecturer in English for Academic Purposes (EAP), with extensive experience in teaching academic writing and rhetorical structure, actually carried out the annotation. However, to ensure high-quality and consistent labelling aligned with the CaRS rhetorical framework [1,2], we initially carried out an inter-rater agreement analysis on a sample of the overall sentences in the dataset. This involved CL and a second annotator (NN) who is a lecturer in computer science, purposefully selected to bring an outsider perspective and to mitigate potential bias arising from prior linguistic knowledge. Specifically, 38 sentences representing approximately 3% of the full dataset were selected from different article introductions to cover a range of rhetorical moves and steps. These sentences were not presented in isolation; instead, they were highlighted within their full-text contexts to allow for discourse-sensitive judgement. Before annotation, NN engaged in a close reading of the original CaRS framework [1,2] to gain a detailed understanding of the moves and steps. Disagreements were resolved through discussion and consensus to clarify annotation boundaries and refine shared understanding. Table 2 lists the rhetorical steps represented in the sampled subset.
Table 2.
Inter-annotator agreement statistics on approximately 3% sample by included steps based on 2 annotators.
Inter-rater reliability was assessed using two widely adopted metrics: Cohen’s kappa () and Krippendorff’s alpha (). Cohen’s measures the agreement between two annotators while correcting for agreement expected by chance. It is computed as shown in Equation (1):
where is the observed agreement and is the expected agreement by chance. A -value above 0.75 is generally considered excellent, while values between 0.60 and 0.75 indicate good agreement.
Krippendorff’s alpha (), shown in Equation (2), is a more general agreement coefficient that supports multiple raters, varying data types, and accounts for missing data and label imbalance.
where is the observed disagreement and is the expected disagreement. Like , values above 0.80 are generally interpreted as strong agreement.
Based on the 38 annotated samples shown in Table 2, the observed agreement was high at . After adjusting for chance agreement, the inter-rater reliability was moderate, with and , indicating a reasonable level of agreement between the annotators. Notably, most of the mismatches were attributable to the annotator without formal linguistic training (NN), often involving subtle rhetorical distinctions that required expert interpretation. This pattern suggests that the disagreements were not due to fundamental inconsistencies but rather to variation in the knowledge of the discipline. Together, these results support the overall trustworthiness of the dataset, despite certain limitations that may have influenced the moderate agreement observed, including the relatively small sample size and the random selection of samples for the inter-rater study (see Section 5 for a detailed discussion and planned future improvements to address these issues). The remainder of the dataset was then annotated by CL.
The annotated dataset was stored in xlm format where each article is denoted with document-identifier tags (e.g., fulltextID, title, doi, source, category) as well as labels indicating the presence of rhetorical moves as defined in CaRS [1]. Specifically, each text segment is annotated with a code corresponding to the step they represent within a rhetorical move. A sample xml file illustrating the structure of the dataset is presented in Figure 1.
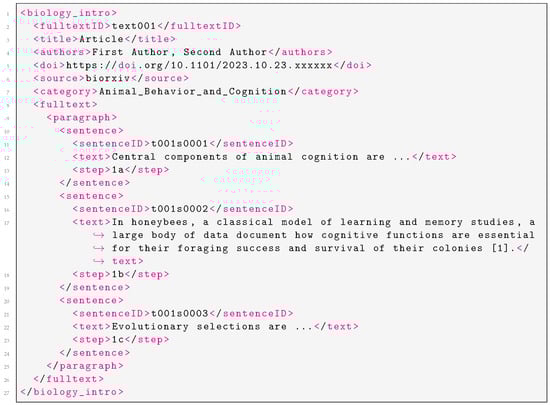
Figure 1.
Sample XML file showing curated article with CaRS annotations.
The xml file sample begins with the <biology_intro> element, which contains metadata such as the article’s <title>, <authors>, <doi>, <source>, and <category>. The content of the article is then structured under the <fulltext> element, which is divided into <paragraph> elements. Each <paragraph> contains multiple <sentence> elements, where each sentence is uniquely identified by a <sentenceID> and includes the actual text under the <text> element. Each sentence is also linked to a specific CaRs step/move, indicated by the <step> element.
3.2. Dataset Preprocessing
A range of preprocessing stages were applied to the raw dataset illustrated in Figure 1. Specifically, we used the Natural Language Toolkit (NLTK) [32] to perform initial cleanup (e.g., punctuation removal), tokenisation, stop-word removal, and word inflection. These are common preprocessing stages that are typically applied to clean textual data before vectorisation (see Section 3.4.1) and an example is presented in Table 3 to illustrate their effects on t001s0002 data sample shown in line 17 within Figure 1.
Table 3.
Sample of a preprocessed text sample from the raw dataset.
3.2.1. Punctuation Correction
The raw text contains punctuation and other irregular texts that do not add value to the classification tasks described in Section 3.4. These include punctuation such as commas, full stops, and irregular text such as ‘[1]’. Such representations were corrected in this preprocessing step to avoid experimental bias and skewness. We used the RegexpTokenizer class with the pattern r’\w+’ to match only word characters (letters, digits, and underscores), effectively removing punctuation like commas and full stops.
3.2.2. Tokenisation
Tokenisation is a technique used to remove meaningless symbols and split text into tokens, i.e., a set of characters that have a meaning by themselves [33]. A simple tokeniser splits a string by white space, but a more efficient tokeniser can use other techniques to separate elements, e.g., punctuation and abbreviations [32]. This was achieved using the word_tokenize() class which effectively breaks down the text into a sequence of words based on whitespace and the word.isalnum() list comprehension was further employed to filter out any remaining tokens that are not alphanumeric.
3.2.3. Stop-Word Removal
Natural language often contains common terms like prepositions, known as stop-words, which are used to construct sentences. If stop-words constitute a large portion of a textual dataset, they can unnecessarily increase the dimensionality of the data [34]. In our experiments, these stop-words can reduce the efficiency of text representation with word embeddings like Word2Vec [21] and GloVe [22] by causing information loss during centroid vector generation (i.e., averaging word vectors). To address this, we filtered out common English stop-words using the stopwords.words(’english’) class, as illustrated by the removal of terms like ‘a’ in Table 3.
3.2.4. Word Inflection
Word inflection involves altering the form of a word according to factors such as tense, number, gender, and case. Stemming and lemmatisation are techniques used to address inflection by reducing words to their root or base forms. For the word ‘studies’, used in its ‘Noun (plural)’ form within Table 3, stemming might produce the stem studi (which is not a standard English word, but represents the root form), as it removes the suffix ‘es’ to return a base form. Meanwhile, lemmatisation considers the word’s context and grammar, potentially yielding the lemma ‘study’ (singular noun). We used NLTK implementation of the Porter stemming algorithm [35] for stemming, and this was accessed through the PorterStemmer class. For lemmatisation, NLTK offers the WordNet lemmatiser, which uses WordNet, a lexical database of English. The lemmatisation process was performed using the WordNetLemmatizer class.
3.3. Experimental Dataset
The dataset (after preprocessing) includes a total of 1297 steps, with 869 steps in move 1, 140 steps in move 2, and 288 steps in move 3. This is visually represented in Figure 2 where all the steps in the dataset are shown in Figure 2a and the distribution of steps within the rhetorical moves are shown in Figure 2b–d. The overall statistics of the raw and preprocessed versions of the dataset is shown in Table 4.
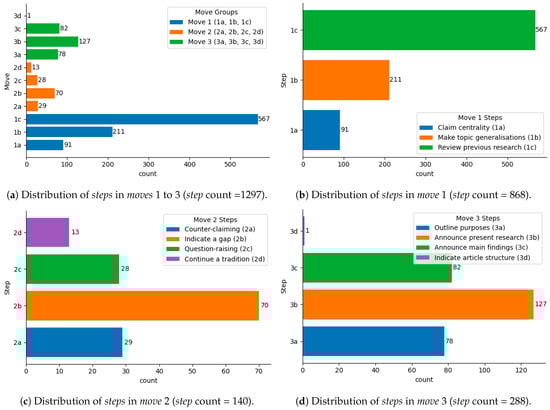
Figure 2.
Detailed distribution of moves and related steps within the entire dataset.
Table 4.
Overall sentence and word count statistics of raw vs. preprocessed dataset.
3.4. Experimental Design
This section presents the methodology used to automate the identification of CaRS moves and steps, with the aim of testing the hypothesis that specific combinations of embedding representations and classification algorithms are more effective at capturing rhetorical intent in low-data scenarios. Four classifiers (in Section 3.4.2) were trained using embeddings generated from each of the six embedding models (in Section 3.4.1), resulting in multiple classifier–embedding configurations. For each configuration, experiments were conducted to identify the three CaRS moves (move 1, move 2, and move 3) and the associated steps within each move. This systematic pairing and evaluation enabled a comprehensive assessment of how different representation–classification strategies perform in the rhetorical structure-prediction task. It is important to note that the initial experiments were conducted using the preprocessed version of the dataset described in Section 3.1. However, due to the differing characteristics of the embedding models (i.e., some being static word embeddings and others contextual and capable of handling stopwords) we also ran an ablation experiment using the raw (non-preprocessed) dataset. The design follows a stepwise approach described in Algorithm 1.
| Algorithm 1: Experimental Design Pipeline |
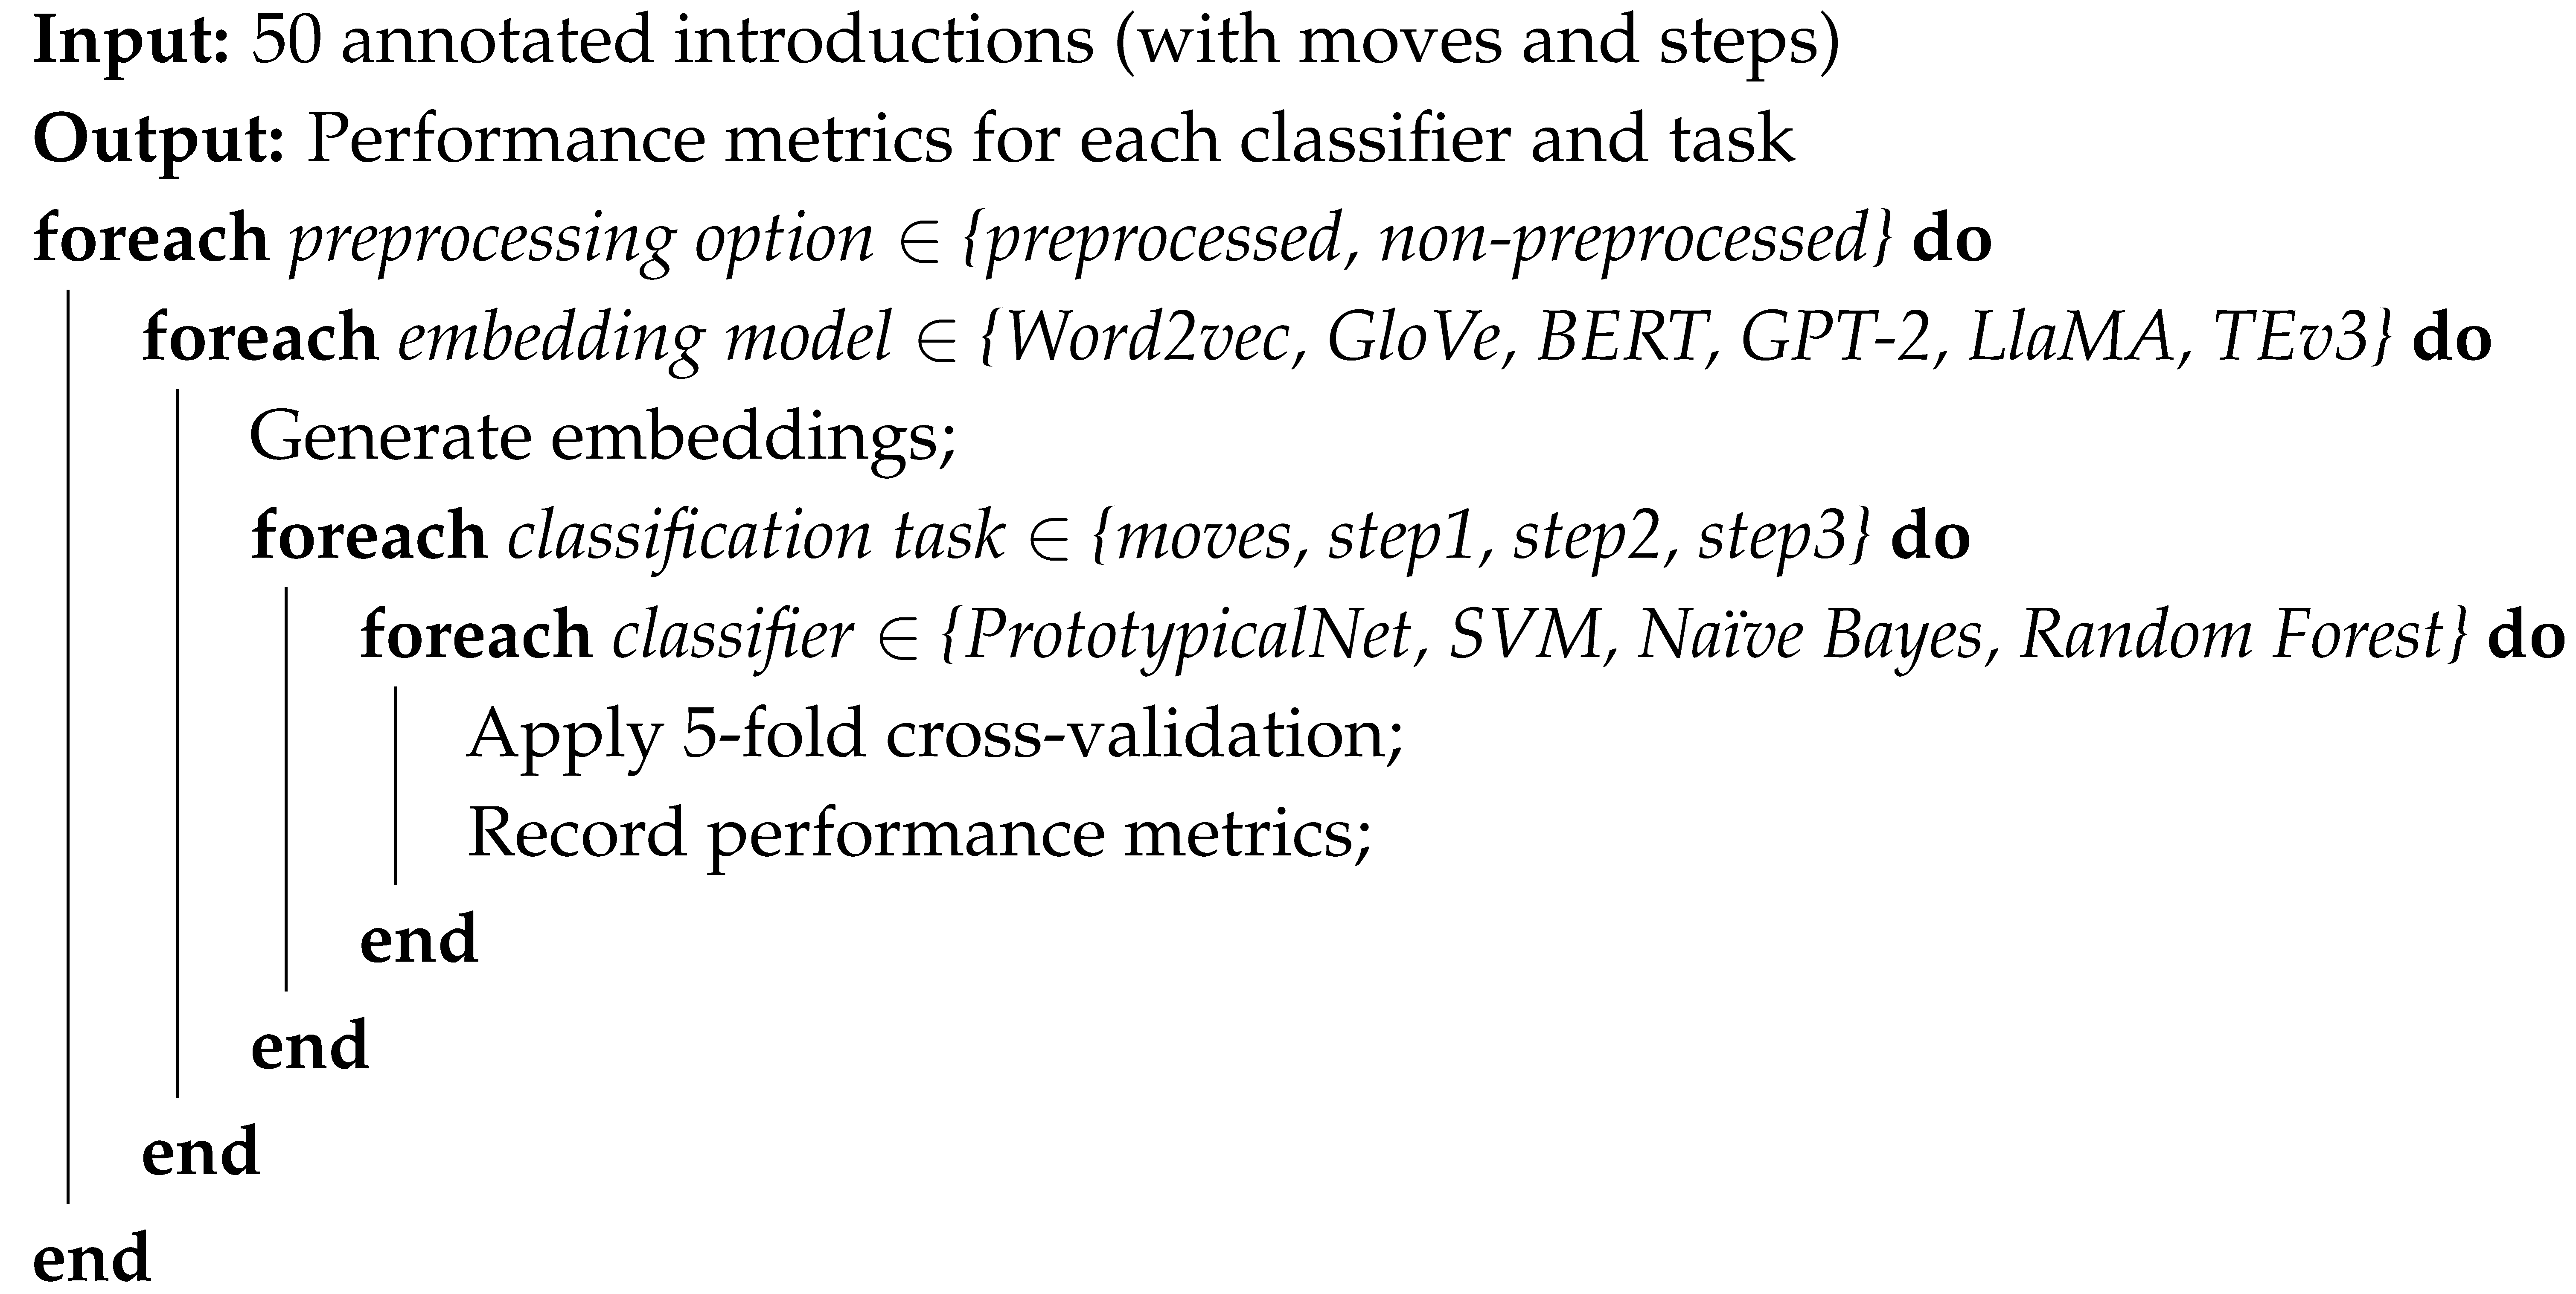 |
As shown in Algorithm 1, experiments were conducted iteratively for CaRS moves and the steps within moves, each including the associated label. Line 1 of the algorithm shows both preprocessed and non-processed dataset options representing the ‘initial’ and ‘ablation’ experiments respectively. To facilitate training on the datasets, sentence vectorisation was applied using six embedding models (i.e., Word2vec, GloVe, BERT, GPT2, Llama-3.2-3B and TEv3-small). Further details of the six embedding models and vectorisation process are presented in Section 3.4.1. Training and validation was conducted with each dataset option with k-fold cross validation (k = 5) using PN, SVM, NB and RF algorithms. This process is done independently for the resulting embeddings generated in line 3 of Algorithm 1. A block diagram showing details of the experiment pipeline is shown in Figure 3.
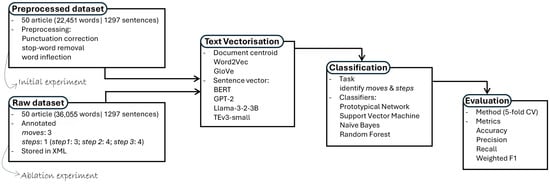
Figure 3.
Block diagram of the experimental design pipeline.
3.4.1. Text Embedding and Vectorisation
As indicated in Algorithm 1, text vectorisation is an important step before training ML algorithms, and this requires the use of several embedding models to transform textual data (words, phrases, and/or sentences) into machine-readable format (vectors). Various embedding models exist for transforming textual data into vectors, so we explored models from the two main categories, i.e., word and contextual approaches. For word-based models, we considered Word2Vec [21] and GloVe [22]. For contextual models, we used BERT [23], GPT2 [24], Llama-3.2-3B [25], and TEv3-small. These models have received much empirical evaluation and have been shown to be efficient in learning high-quality distributed vector representations.
It is important to note that Word2Vec and GloVe only account for single words. Specifically, Word2Vec and GloVe generate static embeddings, providing a single representation for each word regardless of context. Word2Vec employs shallow neural networks to predict surrounding words based on a target word, while GloVe uses matrix factorisation to capture global word relationships from a large corpus.
Since Word2Vec and GloVe return a k-dimensional vector for a given word (rather than sentence) and the experimental dataset (i.e., CaRS moves and steps) consist of sentences, we computed sentence vectors from the constituent words using the ‘document centroid vector’ [36] approach which simply takes the average of all the word vectors in a given document. Thus, for each step , we pass the sequence of words through embedding models to transform each word into a fixed-length numerical vector mathematically represented as Equation (3):
where is the fixed-length embedding vector associated with word sequence .
Subsequently, the sentence vector was obtained by applying the document centroid vector method [36] that computes the sample mean of as shown in Equation (4):
where is the mean of the word vectors within a sentence, and n represents the total number of words in the response.
We explored different vector lengths (i.e., dimensions) of the 6 embedding models. For Word2vec and GloVe, we used Gensim 4.3.2 [37] implementation in Python 3.12 and experimented with 50, 100, 200 and 300 vector dimensions. We observed that our method was stable when the dimension was set to a value between 200 and 300 but the best performance was obtained when the dimension was set to 300. This is consistent with the recommendations of the founding study of both word2vec [21] and Glove [22]. Thus, the dimensionality of the vectors used for both the Word2vec and GloVe models is 300.
In contrast to Word2vec and GloVe, the contextual embeddings (GPT2, BERT, Llama-3.2-3B and OpenAI’s TEv3-small) produce sentence representation. These were used to vectorise the CaRS moves and steps. For BERT, GPT2, and Llama-3.2-3B, we used the base model of the Hugging face Transformer library [38] to arrive at the optimal vector dimensions of 768 (BERT and GPT2), and 4098 (Llama-3.2-3B). The TEv3-small model has a vector dimension of 512. The characteristics of each embedding, as well as the specific parameters used for the experiments are outlined in the top half of Table 5.
Table 5.
Descriptive characteristics and parameters for the classifiers and embeddings.
3.4.2. Classifier Choices
A key goal of this study was to explore the effectiveness of few-shot learning approaches for rhetorical move and step classification by evaluating a diverse set of classifiers, each representing a distinct class of ML paradigms. The classifiers were selected not only for their suitability in low-resource scenarios but also to capture variability in the underlying learning mechanisms, enabling a comprehensive assessment of the model behaviours.
Support Vector Machine (SVM): SVM was included as a strong and widely used baseline, particularly effective in high-dimensional, small-sample-size settings. Its ability to find optimal separating hyperplanes with maximal margins makes it well suited for tasks like rhetorical classification, where subtle boundary distinctions may exist between classes. The optimisation problem is mathematically represented as Equation (5):
where: denotes the feature vector of the i-th training sample, is the corresponding class label, is the weight vector that defines the decision hyperplane, and b is the bias term.
The inclusion of SVM is also motivated by its prior success in similar tasks; notably, the benchmark study by Cotos and Pendar [10] reported classification accuracies of 72.6% and 72.9% for move and step labels, respectively, using an SVM with 10-fold cross-validation and combined unigram-trigram features. This positions SVM as a valuable point of comparison for evaluating modern embedding-based approaches.
Naïve Bayes (NB): NB was chosen to represent probabilistic learning approaches. It assumes conditional independence of the features given the class [19] as shown in Equation (6):
where: is the predicted class label, is the set of possible classes, is the prior probability of class c, is the j-th feature of the input, is the likelihood of feature given class c.
Despite its simplifying assumption of feature independence, NB is known for its efficiency, particularly in text classification tasks [39,40]. Its probabilistic formulation allows it to handle uncertainty in sparse data scenarios, which aligns with the few-shot setting of this study. Including NB enables an assessment of how a lightweight, ML model performs relative to more complex alternatives like SVM, PN and RF.
Random Forest (RF): RF serves as an ensemble-based method that uses multiple decision trees with bagging to enhance generalisation. It makes predictions by aggregating the outputs from multiple decision trees as shown in Equation (7):
where: is the predicted class label, is the input feature vector, is the prediction of the k-th decision tree, K is the total number of trees in the forest, returns the majority class among all predictions.
Its strength lies in handling non-linear relationships and capturing interactions between features without requiring extensive feature engineering, thus making it suitable for this study. The inclusion of RF provides a contrast to both the linear decision boundary of SVM and the probabilistic nature of NB, thus broadening the scope of methodological diversity evaluated in this study.
Prototypical Network (PN): Snell et al. [18] implementation of PN was selected as a representative of metric-based few-shot learning. This approach computes class prototypes in an embedding space and classifies samples based on distance to these prototypes, as shown in Equation (8).
where: is the predicted class, is the set of classes, is the embedding of the input instance , is the prototype for class c computed as the mean of support examples , is a distance function (e.g., Euclidean).
PN is particularly well-suited for low-resource tasks where generalisation from a small number of examples is critical. Its inclusion allowed us to assess the potential of embedding-driven, inductive reasoning for rhetorical structure classification. It is important to note that PN operates an episodic training mechanism where the model is trained through a series of few-shot classification tasks (episodes), each constructed using a small support set and a query set sampled from the training data. To reconcile this training approach in our experiments which was evaluated with k-fold cross validation (described in Section 3.5), we implemented a cross-fold episodic training setup in which each fold was used as a test (query) set exactly once. For each cross validation split, episodes were constructed using data from four of the five folds (i.e., 80% of the data), and the model was evaluated on the remaining fold. For example, in the moves classification task with three classes, we used a 3-way 5-shot setup, sampling 5 support examples and 10 query examples per class in each episode. This means that during testing, query sets were created from the held-out fold representing classes and examples not already seen during training. This procedure was repeated across all five folds, such that each data instance served as part of the test set in at least one fold. This setup ensures complete test coverage and preserves the fairness expected of standard k-fold cross validation, while respecting PN’s episodic nature.
The characteristics of each classifier as well as specific parameters used for experiments are outlined in the bottom half of Table 5.
3.5. Evaluation Method and Metrics
The evaluation of the performance of the model was conducted using k-fold cross-validation, with . This method is a robust approach to estimate the generalisability of the model. In k-fold cross-validation, the dataset is partitioned into k equally sized subsets or ‘folds’. The model is trained k times, each time using folds for training and the remaining fold for testing. This process ensures that every data point is used once for validation and times for training. The performance of each model is then computed using the predictions of each fold to derive standard evaluation metrics including accuracy, precision, recall, and weighted F1-score.
4. Results
This section presents the results of experiments that evaluate the performance of the four classification algorithms (PN, SVM, NB, and RF) across six different embedding models (Word2Vec, GloVe, BERT, GPT2, Llama-3.2-3B, and TEv3-small). Initial experiment results presented in Section 4.1 used the preprocessed dataset. To explore the characteristic differences between static and contextual embedding models, we also performed ablation experiments on the raw dataset and the results are presented in Section 4.2. For brevity, only the accuracy and weighted F1-scores are reported, but a comprehensive list of results, including additional evaluation metrics, is provided in Appendix A.
4.1. Initial Experiment Results
Table 6 separates the performance in rhetorical moves and individual steps (M1 steps, M2 steps, and M3 steps) into distinct sections. Several key observations emerge:
Table 6.
Performance of PN, SVM, NB, and RF with preprocessed dataset.
Move-Level Performance: Among all algorithm-embedding combinations, SVM combined with Llama-3.2-3B achieved the best performance, with both accuracy and weighted F1-score reaching 0.79, indicating its superior capability in capturing the contextual structure of rhetorical moves. This combination significantly outperformed others, including competitive pairings such as SVM with GPT2 (0.74 F1-score) and NB with TEv3-small (0.72 F1-score). In contrast, the PN algorithm consistently yielded the lowest scores across embeddings, reinforcing its relative inadequacy for this classification task.
Step-Level Performance: Performance across the rhetorical steps was more variable, with no single model dominating all three step categories (M1 steps, M2 steps, M3 steps):
M1 steps: SVM with Word2Vec achieved the highest accuracy (0.69), closely followed by BERT and Llama-3.2-3B with various classifiers. Performance across embeddings was relatively close, suggesting that step M1 benefits from simpler embedding models when paired with robust classifiers like SVM.
M2 steps: This move proved most challenging overall, yet SVM combined with Llama-3.2-3B again delivered the best result, achieving both accuracy and weighted F1-score of 0.75. NB with TEv3-small also performed competitively (0.68 accuracy, 0.62 F1-score), suggesting that these embeddings may be particularly effective in capturing the semantic subtleties of M2.
M3 steps: Performance dropped significantly for all models, but NB with TEv3-small achieved the highest weighted F1-score (0.63) and accuracy (0.64), indicating a relatively strong ability to model the complex and diverse nature of this step, although absolute performance remained modest.
Overall, embedding models and algorithms showed stronger performance on rhetorical moves than on individual steps, possibly due to the broader and more consistent patterns characterising moves. Among all configurations, the combination of SVM and Llama-3.2-3B stood out as the most effective, consistently delivering top results across multiple tasks, especially for the rhetorical moves and M2 steps. This is visually evident in Figure 4 which compares the classifier performance using the Llama-3.2-3B embedding. SVM consistently outperforms other classifiers across all datasets, with the highest median values and lowest variance in both accuracy and weighted F1-scores. Notably, in the moves and M2 steps datasets, the SVM achieves peak weighted F1-scores of 0.79 and 0.75, respectively—well above the scores of other classifiers. This strong and stable performance indicates that the SVM-Llama combination is not only effective but also more robust across varied tasks, making it the most reliable choice in this setup. This supports our hypothesis that models combining rich semantic embeddings with classifiers capable of handling sparse or imbalanced data would perform better in detecting CaRS moves and steps in a given introduction.
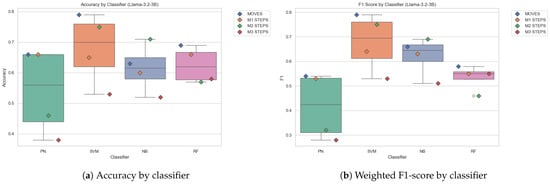
Figure 4.
Boxplot showing accuracy and weighted F1-score comparison of the classifiers with Llama-3.2-3B.
While SVM maintained its lead overall, NB and RF occasionally closed the gap in specific scenarios, particularly when paired with newer embedding models like TEv3-small, as shown in Figure 5. This is especially evident in the M1 and M2 steps datasets, where NB achieved accuracy and weighted F1-scores comparable to, and at times even exceeding, those of SVM for select embeddings. RF also showed good performance across multiple datasets, often outperforming SVM on traditional embeddings like GloVe and BERT. These trends suggest that while SVM-Llama remains a strong contender, its superiority is not absolute; the competitive performance of NB and RF, especially in conjunction with modern or task-specific embeddings, shows the importance of evaluating classifier-embedding pairings in context rather than assuming one-size-fits-all superiority.
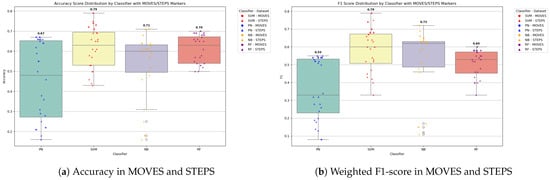
Figure 5.
Boxplot showing distribution of accuracy and weighted F1-scores across all classifiers, with SVM-specific data points highlighted in red.
However, it is worth noting that four of the six embedding models used are contextual in nature, and the preprocessing applied to the textual data may suppress important contextual cues that these models rely on. To investigate this potential limitation, we conducted an ablation experiment to assess the impact of preprocessing on contextual embeddings, the findings of which are discussed in Section 4.2.
4.2. Ablation Experiment Results
Table 7 presents the results of an ablation experiment conducted without applying preprocessing to the dataset. The table mirrors the structure of the earlier analysis, categorising performance into rhetorical moves and the three step types (M1 steps, M2 steps, and M3 steps). Several important trends emerge:
Table 7.
Performance of PN, SVM, NB, and RF with raw dataset.
Move-Level Performance: The best overall performance was also achieved by the SVM-Llama-3.2-3B combination, with an impressive 0.84 F1-score and 0.85 accuracy, surpassing all other configurations. Other contextual embeddings also showed notable gains when used without preprocessing. For example, BERT achieved an F1-score of 82% and TEv3-small reached 80% with SVM. These results highlight the potential suppression of context caused by preprocessing and underscore the strength of contextual embeddings when operating on unaltered text. Non-contextual embeddings (e.g., Word2Vec, GloVe) showed either modest improvements (e.g., GloVe with RF: 0.71 F1) or remained static, reaffirming the benefits of context preservation for transformer-based models.
Step-Level Performance: Similar to the previous analysis, step-level classification remained more challenging, but contextual embeddings benefited more clearly from the removal of preprocessing.
M1 steps: BERT again emerged as the top performer across all classifiers, with the SVM-BERT combination yielding an F1-score of 0.71, closely followed by RF-BERT at 0.68. Other contextual embeddings such as Llama-3.2-3B and TEv3-small also performed well (e.g., 0.69 and 0.67 F1 with SVM and NB respectively). This suggests that for M1 steps, richer contextual information, preserved in the raw text, improves classification, even more so than in the preprocessed scenario.
M2 steps: The most notable gains from removing preprocessing occurred here. TEv3-small combined with NB achieved the best performance with an F1-score of 0.77 and accuracy of 0.79, significantly higher than in the preprocessed setting. Other contextual models also improved modestly (e.g., BERT-NB at 0.64 F1, GPT2-SVM at 0.63 F1). This confirms that preprocessing likely discarded nuances critical for understanding this rhetorically complex step.
M3 steps: Performance improved for many contextual embeddings, although absolute scores remained lower than for other dataset labels. TEv3-small achieved the highest F1-score (0.63) with RF, followed closely by Llama-3.2-3B (0.64 F1 with RF). Compared to the preprocessed results, most contextual embeddings show improved stability and precision here, albeit still facing challenges in modelling the high variability of M3 steps.
4.3. Comparison with Existing Study
A comparative summary of our results and those reported by Cotos and Pendar [10] is presented in Table 8. While the two studies differ substantially in terms of dataset size, annotation granularity, feature representations, and evaluation methodology, the comparison offers useful contextual grounding. Cotos employed a SVM classifier with unigram and trigram features, reporting average precision, recall, and F1-score values of 70.3%, 61.2%, and 65.4% for moves, and 68.6%, 54.9%, and 61.0% for steps, respectively, based on 10-fold cross-validation on a large dataset comprising over 1000 introductions across 51 disciplines.
Table 8.
Comparison with related study.
In our study, SVM again proved to be a top performing model when paired with contextual embeddings from LlaMA-3.2-3B. Using the preprocessed version of the dataset, this combination achieved 79.0% across all metrics (accuracy, precision, recall, and F1-score) for moves, and 64.7% accuracy, 64.0% precision, 64.3% recall, and 64.0% F1-score for steps, based on 5-fold cross-validation on our smaller, domain-specific dataset (i.e., CaRS-50).
Importantly, when the same model was evaluated without applying preprocessing, performance on moves improved substantially, reaching 85.0% accuracy, 84.0% precision, 85.0% recall, and 84.0% F1-score. This suggests that preserving contextual cues in the raw text can enhance the effectiveness of contextual embeddings. For steps, however, the unprocessed setup yielded 60.0% accuracy, 54.6% precision, 60.0% recall, and 57.0% F1-score which are slightly lower than the preprocessed configuration.
While these results are not directly comparable to those reported by Cotos and Pendar [10] (given differences in dataset size, label granularity, feature representation, and evaluation strategy), they nonetheless confirm that SVM consistently maintains strong performance across varied setups. These findings underscore its effectivenes and adaptability, particularly when paired with semantically rich embeddings in low-resource classification tasks. Moreover, the ablation study highlights how data preparation choices (i.e., raw or preprocesed) can influence the effectiveness of contextual models and should therefore be considered carefully. For example, improvement in performance on the moves-level classification when using raw (unprocessed) text. Specifically, the SVM-LlaMA configuration improved from accuracy and F1-score of 0.79 to 85% accuracy and 84% F1-score on the moves data subset. This suggests that removing preprocessing preserved contextual signals that are beneficial to transformer-based embeddings like LlaMA, which leverage surrounding tokens to build meaningful representations.
However, a contrasting trend emerged in the steps-level subsets. As shown in Table 8, average performance declined across all metrics for M2 steps when raw (unprocessed) data was used (accuracy decreased from 64.7% to 60.0%, precision from 64.0% to 54.6%, recall from 64.3% to 60.0%, and F1-score from 64.0% to 57.0%). More granular performance differences are visible in Table A6, where the SVM-LlaMA configuration on M2 steps showed a substantial drop: accuracy fell from 75% to 57%, precision from 76% to 43%, recall from 75% to 57%, and F1-score from 75% to 49%. In contrast, performance on M3 steps remained unchanged across all metrics, staying flat at 53%. Meanwhile, M1 steps benefited from the absence of preprocessing, showing improvements in accuracy (from 65% to 70%), precision (from 63% to 68%), recall (from 65% to 70%), and F1-score (from 64% to 69%). Despite these gains, the model exhibited greater difficulty in distinguishing step-level rhetorical units when trained on raw data.
This degradation appears to correlate with the density of stop words across these steps. As shown in Table 9, M2 steps exhibited a relatively high stopword ratio (30.58%), which is disproportionately high considering its smaller size (only 140 sentences and 4140 words). Similarly, M3 steps had a stopword ratio of 31.11% across 9019 words, slightly higher than the M1 steps ratio (26.62%). This may have led to excessive noise in shorter or more semantically subtle steps-level contexts, where stopwords, while contextually useful, could overshadow the limited signal-bearing terms when no preprocessing is applied.
Table 9.
Characteristics of the raw (unprocessed) dataset.
Although contextual models are designed to process natural language in its raw form, research suggests that the overrepresentation of stop words can introduce challenges in fine-grained or imbalanced classification tasks. Belinkov and Glass [41] highlights that noise, including irrelevant or non-informative tokens can distort learned representations in deep models, thereby affecting downstream performance. Complementing this, El-Khair [42] demonstrates that the inclusion of stopwords can negatively impact classification accuracy, particularly in settings with small or imbalanced datasets, where signal-bearing features are already limited. Thus, in our case, the raw dataset may have enhanced the model’s capacity for broader discourse structure (i.e., moves), where stopwords helped encode syntactic and rhetorical flow. But at the finer granularity of steps-level classification, especially M2 steps, which already suffer from class sparsity, these same stopwords may dilute discriminative features. This highlights a nuanced trade-off between preserving contextual integrity and controlling noise, which should inform future preprocessing decisions for hierarchical rhetorical structure modeling.
5. Discussion
The observed differences in the performance of Word2vec, GloVe, BERT, GPT2, Llama-3.2-3B and TEv3-small when combined with PN, SVM, NB and RF can be attributed to their underlying architectures, the way they process textual data, and the size and distribution of the dataset. Word2vec and GloVe are static word embeddings, where each word is assigned a single fixed vector regardless of its context. For this study, sentence vectors were computed as the mean of their constituent word vectors, a simplistic approach that may fail to capture nuanced relationships within sentences. Also, some of the words in the experimental data may not exist in the vocabulary which may affect the resultant sentence vector as proven in existing studies [43]. These limitation likely contributed to their relatively weak performance on tasks requiring fine-grained contextual understanding, such as the identification of rhetorical steps. Moreover, the varying size of training data for different steps further compounded this issue, as smaller datasets (e.g., M2 step 4 with only 13 sentences) would exacerbate the inability of static embeddings to generalise effectively especially if words are missing from the vocabulary. In such cases, static embedding like fastText [44] is a useful alternative because it uses subword information (character n-grams) to represent words. This feature allows fastText to generate embeddings for words that are not in its dictionary (i.e., out-of-vocabulary words) and this has proven successful in existing studies [45].
In contrast, BERT, GPT2, Llama-3.2-3B and TEv3-small are context-aware embeddings based on transformer architectures. BERT, a bidirectional encoder, processes the entire input sequence to capture rich contextual information, making it particularly effective for tasks involving complex relationships between words. Its strong performance on rhetorical moves across the algorithms reflects this capability, as moves often encompass broader and more general structures that BERT can identify using its contextual embedding mechanism. However, BERT’s advantage over static embeddings narrowed at the step level, where smaller datasets and more granular classification challenges reduced its effectiveness. For instance, BERT’s accuracy on M2 steps dropped to 0.25 when used with PN, highlighting the difficulty of handling fine-grained rhetorical structures with limited data. Nonetheless, when used with SVM, BERT achieved an F1-score of 0.70 for moves, indicating strong consistency and relevance in broader rhetorical categories.
GPT2, an autoregressive transformer-based language model optimised for text generation, demonstrated inconsistent performance. While it generally performed poorly on moves, it achieved relatively good results on M2 steps (accuracy of 0.50 and weighted F1-score of 0.34). This unexpected performance may stem from GPT2’s ability to capture sequential dependencies, which could be advantageous for certain step structures but less so for broader rhetorical moves. However, its weaker overall performance relative to BERT suggests that GPT2’s unidirectional architecture and optimisation for generation tasks limit its effectiveness in classification tasks. On the other hand, TEv3-small performed relatively well on moves and M1 steps. This may stem from the large amount of dataset available for both compared to M2 and M3 steps where it performed generally low across the algorithms. However, Llama-3.2-3B performed relatively well across all algorithms except when used with PN for M2 and M3 steps. In particular, Llama-3.2-3B with SVM achieved the highest overall accuracy (0.79) and F1-score (0.79) on preprocessed moves, demonstrating both precision and consistency.
An important consideration is the variability of the results, as shown by the standard deviations. For instance, Word2vec combined with PN yielded a high standard deviation on moves (accuracy: ; F1-score: ), indicating unstable performance across folds. This is also evident for BERT with PN on M2 steps (), showing susceptibility to overfitting or variance due to the low sample size. In contrast, models such as Llama with SVM on moves () and BERT with SVM () display low variance, indicating stable and reliable predictions across folds. These observations underscore the importance of not only considering mean performance but also assessing the model’s robustness through standard deviation.
This variability becomes more critical when comparing results between preprocessed and raw datasets. Notably, for M2 steps, SVM+Llama configuration experienced a substantial performance drop from (F1) in the preprocessed dataset to in the raw version, with a corresponding decline in accuracy from to . Despite the lower mean, the raw dataset’s lower standard deviation for F1 suggests more consistent (albeit lower) predictions. As noted in Section 4.3, this might imply that noise from unfiltered tokens (e.g., stopwords) dampened discriminability uniformly across folds rather than sporadically.
Similarly, on M3 steps, the SVM+Llama configuration performance remained flat across datasets at F1 (preprocessed) and F1 (raw), again with minimal standard deviation. This stability, despite changing preprocessing, might reflect either a plateau effect in model capacity for that class or inherent difficulty in distinguishing M3 categories, regardless of token filtering. Taken together, these patterns suggest that while standard deviation offers insights into robustness, consistent low variance in poor-performing categories (as with raw M2) strenghtens the argument about the influence of noisy tokens, such as stopwords, on decision boundaries. Hence, preprocessing remains a valuable intervention for enhancing discriminability in low-sample or semantically subtle classes.
Data size also played a significant role in the observed results. Moves, with larger datasets (e.g., M1 with 868 sentences), offered better opportunities for embeddings to learn patterns, resulting in stronger performance across all models. In contrast, steps like M2 step 4 (13 sentences) and M1 step 1 (91 sentences) provided insufficient data for reliable training, leading to diminished performance, particularly for static embeddings. The discrepancy between the performance of embeddings on moves and steps underscores the importance of dataset size and distribution in training embedding models. Notably, high variance in performance was especially evident in these smaller datasets. For instance, GPT2 with PN on M2 steps yielded an accuracy of , highlighting instability due to sample scarcity.
A related consideration on data size is the reliability of the manual annotation process used to construct the dataset. Specifically, we acknowledge the limitations inherent in the inter-rater evaluation, which was conducted on only 38 sentences out of a total of 1297 (≈3% of the dataset). While the inter-rater reliability results indicated moderate agreement, this may not fully reflect the true trustworthiness of the annotations. The CaRS framework is conceptually clear, particularly for annotators with relevant disciplinary knowledge, and the lower agreement scores can, in part, be attributed to our decision to purposefully include an annotator without such background in order to stress-test the clarity and robustness of the scheme. This led to constructive discussions around mismatched cases and ultimately strengthened the annotation protocol. We also note that the 3% sample proportion is not uncommon in comparable studies. For instance, Cotos and Pendar [10] conducted reliability checks on 30 (out of 1020) texts (18 randomly selected and 12 purposefully chosen) representing a similar portion (≈3%) of their dataset. In our case, however, the sample was selected entirely at random, and we used individual sentences rather than full article introductions. This may have resulted in under-representation or complete omission of rarer rhetorical steps—such as step 3d, which occurred only once in the dataset, further contributing to reduced agreement scores. Future work (described in Section 6) will expand the annotated corpus and repeat the inter-rater study using stratified sampling and annotators with comparable expertise to better assess and ensure annotation consistency.
Overall, the results suggest that Llama-3.2-3B’s contextual embedding mechanism makes it robust for the rhetorical classification task conducted in this study, particularly for broader constructs like moves. However, its performance is not immune to challenges posed by limited data at the step level. Static embeddings like Word2vec and GloVe, despite their simplicity, can perform reasonably well on moves due to the aggregation of word vectors, but their limitations become apparent in more nuanced tasks. GPT2 and TEv3-small’s performance highlights the potential benefits of sequential modelling, but their architecture and training objectives make them less suited to classification tasks than BERT. Among the algorithms, SVM consistently yielded the most balanced results with low variance across datasets, reinforcing its suitability for text classification tasks involving both contextual (observed in our experiments) and static embeddings (also observed in our experiments as well as Cotos and Pendar [10]).
Implications of the Study
This research has significant implications for both educational and research contexts. Automating the CaRS framework provides a structured means of analysing and generating well-formed research article introductions, particularly by identifying and classifying rhetorical moves and steps. The best-performing model in our study (SVM with LlaMA-3.2-3B embeddings) offers a promising balance of performance and scalability that can be applied in a variety of practical scenarios.
In education, this model could be embedded in academic writing support tools to provide formative feedback. For instance, it could be implemented as a writing assistant plugin within learning management systems (e.g., Moodle, Blackboard or Canvas) or as an extension in word processors (e.g., Microsoft Word or Overleaf). By identifying rhetorical gaps such as missing justification of significance or failure to outline research purpose, the tool can guide students in real time as they draft introductions. This promotes self-directed learning and a better understanding of academic discourse structures.
Educators could also use the tool for instructional purposes, using annotated examples to teach rhetorical conventions in scientific writing. Highlighting automatically detected moves and steps during workshops or tutorials can make abstract writing principles more tangible for learners, while also enabling scalable feedback in large cohorts.
For researchers, the model can serve as a quality assurance mechanism to verify whether their introductions follow established rhetorical patterns. Such tools may help accelerate the writing process without compromising structure and coherence. Moreover, automatic annotation of introductions can support corpus-driven studies or meta-analyses in rhetorical genre research by reducing the labour associated with manual coding.
6. Conclusions and Future Work
This study explored the automation of the CaRS model to analyse and enhance the rhetorical structures in research article introductions. By employing various embedding techniques and algorithms, the study examined the effectiveness of different embeddings in capturing both rhetorical moves and finer-grained steps. The results highlight the strengths of contextual embeddings like Llama-3.2-3B in identifying broader rhetorical moves, while revealing challenges in handling more granular steps, particularly when data are sparse. This underscores the potential of automated rhetorical analysis to improve academic writing by providing structure, enhancing clarity, and guiding authors in crafting impactful introductions.
The research demonstrates that the integration of ML and NLP to automate rhetorical frameworks can play a transformative role in academic writing, education, and research. While practical deployment introduces important considerations around usability and generalisability, the current study focuses primarily on evaluating technical feasibility and model performance. The following analysis highlights how different embeddings and algorithms perform across rhetorical levels, offering insights into what combinations are most effective under data-scarce conditions.
The findings of this study demonstrate that model performance varies significantly depending on the combination of embeddings, algorithms, and data granularity. Contextual models such as Llama-3.2-3B and BERT showed strong performance on moves, achieving up to 79% accuracy and 79% F1-score (Llama with SVM), while static embeddings like Word2vec and GloVe were comparatively weaker, especially under PN, where variance was high (e.g., Word2vec accuracy on moves: ). However, this trend did not consistently hold at the step level, where dataset imbalance and label sparsity undermined classification accuracy.
Particularly, the classification of rhetorical steps in M2 and M3 was adversely affected by limited training data. For instance, PN with BERT for M2 steps achieved an accuracy of only , indicating instability. In contrast, the same step dataset combined with Llama-3.2-3B and SVM achieved a much stronger accuracy. This stark contrast suggests that transformer-based embeddings benefit from more expressive contextual representations, but only if supported by sufficient data and appropriate classifiers.
Furthermore, SVM’s consistent performance with low variance across tasks confirms its robustness in low-resource conditions, aligning with results from Cotos and Pendar [10], who reported average precision, recall, and F1-score values of 70.3%, 61.2%, and 65.4% for moves, and 68.6%, 54.9%, and 61.0% for steps, respectively. Our experiments exceeded these benchmarks in most cases (e.g., Llama-3.2-3B + SVM: 79% for moves, 75% for M2 steps), despite using different feature representations and smaller training sets. This highlights the promise of modern embeddings in achieving competitive performance under more constrained and realistic educational scenarios.
Limitations and Future Work
While the findings offer valuable insights, the study also highlights several limitations that must be addressed in future research. A key challenge is the limited dataset, particularly at the step level, where some steps had very few sentences (e.g., M2 step 4 and M3 step 4 with only 13 and 1 sentences respectively). This data paucity restricts the generalisability of the findings and hinders the ability of the models to effectively capture the nuances of CaRS steps. As such, caution should be exercised when generalising the findings to other academic texts or disciplines.
One potential strategy to mitigate this limitation is data augmentation through synthetic data generation to boost the training data samples and tackle the class imbalance. However, traditional techniques such as Synthetic Minority Oversampling TEchnique (SMOTE) algorithm [46] are unsuitable for textual data due to the complexity and semantic sensitivity of natural language. Generating synthetic text using large language models (LLMs) is a useful alternative to increase dataset size, but it introduces concerns around the originality and authenticity of rhetorical structures. Since the rhetorical purpose and tone are context-dependent, synthetic text might not accurately reflect genuine academic writing. Thus, while data augmentation is theoretically possible, its practical implementation must be approached with caution as well.
Looking ahead, we plan to address the data limitations by first extending the corpus to ensure more balanced representation of all moves and steps, especially those that are currently underrepresented. Second, we will conduct an enhanced inter-rater reliability study that accounts for the insights gained from the initial round. The improved design will incorporate stratified sampling (on full text rather than individual sentences) to ensure all rhetorical categories are adequately covered and will involve annotators with comparable disciplinary knowledge, enabling a more accurate estimation of annotation consistency under optimal conditions.
We also acknowledge that the reliance on manual annotation to train the models is labour-intensive and time-consuming, making it difficult to scale the approach to larger datasets or different domains. Thus, future studies will prioritise automating the annotation process to expand the dataset while maintaining quality. One avenue we intend to explore is few-shot learning within a semi-supervised framework, where existing annotated data is used to train models capable of labelling additional texts with minimal supervision. Specifically, we aim to leverage the SVM-Llama combination, which yielded the strongest performance, to retrain on an expanded dataset with improved representation of the moves and steps. The resulting model will then be applied to classify new, unseen texts, using a high-confidence threshold (e.g., ≥90% prediction confidence) as an indicator of reliable labeling. This semi-supervised strategy allows confident predictions to be treated as pseudo-labels, thus growing the annotated dataset iteratively. To safeguard annotation quality, a small subset of the automatically labelled data will be manually reviewed to validate model reliability and guide further refinement.
To improve accuracy of predictions, transfer learning represents a promising avenue. By fine-tuning domain-specific models such as BERT, GPT2, Llama-3.2-3B and TEv3-small we can better tailor these models to handle the nuanced context of CaRS steps and improve accuracy. Combining transfer learning with active learning strategies could further enhance annotation efficiency and model performance. Additionally, expanding the study to include datasets from multiple disciplines would improve the model’s versatility and applicability across academic fields. Furthermore, optimising the algorithms by incorporating deeper architectures or advanced features could improve its capacity to capture complex rhetorical structures across both moves and steps.
Author Contributions
Methodology, validation N.N.; software, formal analysis, investigation O.O.; conceptualisation, data curation C.L. and N.N.; visualisation, writing—original draft preparation O.O. and N.N.; writing—review and editing C.L., C.A. and J.B.; resources, supervision, project administration N.N. and I.K. All authors have read and agreed to the published version of the manuscript.
Funding
This research received no external funding.
Institutional Review Board Statement
Ethical review and approval were waived for this study because the curated data was from open access articles published under a CC-BY license, which allows for unrestricted use, distribution, and reproduction in any medium, provided the original work is properly cited, and all protocols for responsible data handling and usage have been followed.
Data Availability Statement
The dataset supporting the findings of this study is openly available in Mendeley Data repository at doi:10.17632/kwr9s5c4nk.1, entitled CaRS-50 Dataset (accessed on 1 January 2025).
Acknowledgments
We would like to thank the Department of Computer Science at Edge Hill University for providing the resources and dedicated time that made this research possible. This work was conducted with the support of the Student Research Club, whose collaborative environment played a key role in the development and completion of this project.
Conflicts of Interest
The authors declare no conflicts of interest.
Appendix A
The appendix shows all the evaluation metrics for the four algorithms with the six embedding models when trained on CaRS moves and constituent steps. The top half of each table shows results when trained with the preprocessed version of the dataset while the bottom half represents performance on raw (unprocessed) datset.
Table A1.
Model performance with Word2vec embedding.
Table A1.
Model performance with Word2vec embedding.
| Dataset | PN | SVM | NB | RF | |||||||||||||
|---|---|---|---|---|---|---|---|---|---|---|---|---|---|---|---|---|---|
| Acc | Pre | Rec | F1 | Acc | Pre | Rec | F1 | Acc | Pre | Rec | F1 | Acc | Pre | Rec | F1 | ||
| + Prep | MOVES | 0.55 | 0.54 | 0.55 | 0.54 | 0.72 | 0.73 | 0.72 | 0.67 | 0.59 | 0.69 | 0.59 | 0.62 | 0.68 | 0.63 | 0.68 | 0.57 |
| M1 STEPS | 0.59 | 0.46 | 0.59 | 0.50 | 0.69 | 0.67 | 0.69 | 0.63 | 0.60 | 0.67 | 0.60 | 0.63 | 0.65 | 0.58 | 0.65 | 0.54 | |
| M2 STEPS | 0.18 | 0.54 | 0.18 | 0.19 | 0.57 | 0.49 | 0.57 | 0.47 | 0.57 | 0.55 | 0.57 | 0.55 | 0.61 | 0.64 | 0.61 | 0.55 | |
| M3 STEPS | 0.16 | 0.12 | 0.16 | 0.13 | 0.50 | 0.51 | 0.50 | 0.45 | 0.48 | 0.47 | 0.48 | 0.48 | 0.52 | 0.48 | 0.52 | 0.43 | |
| − Prep | MOVES | 0.54 | 0.53 | 0.54 | 0.54 | 0.78 | 0.82 | 0.78 | 0.73 | 0.62 | 0.71 | 0.62 | 0.64 | 0.70 | 0.69 | 0.70 | 0.60 |
| M1 STEPS | 0.57 | 0.48 | 0.57 | 0.52 | 0.66 | 0.62 | 0.66 | 0.54 | 0.61 | 0.64 | 0.61 | 0.62 | 0.67 | 0.68 | 0.67 | 0.56 | |
| M2 STEPS | 0.18 | 0.10 | 0.18 | 0.10 | 0.50 | 0.25 | 0.50 | 0.33 | 0.54 | 0.46 | 0.54 | 0.48 | 0.57 | 0.57 | 0.57 | 0.47 | |
| M3 STEPS | 0.19 | 0.10 | 0.19 | 0.12 | 0.54 | 0.61 | 0.54 | 0.49 | 0.50 | 0.49 | 0.50 | 0.49 | 0.52 | 0.55 | 0.52 | 0.46 | |
Table A2.
Model performance with GloVe embedding.
Table A2.
Model performance with GloVe embedding.
| Dataset | PN | SVM | NB | RF | |||||||||||||
|---|---|---|---|---|---|---|---|---|---|---|---|---|---|---|---|---|---|
| Acc | Pre | Rec | F1 | Acc | Pre | Rec | F1 | Acc | Pre | Rec | F1 | Acc | Pre | Rec | F1 | ||
| + Prep | MOVES | 0.64 | 0.44 | 0.64 | 0.52 | 0.69 | 0.67 | 0.69 | 0.68 | 0.18 | 0.59 | 0.18 | 0.15 | 0.70 | 0.79 | 0.70 | 0.60 |
| M1 STEPS | 0.66 | 0.67 | 0.66 | 0.54 | 0.60 | 0.59 | 0.60 | 0.59 | 0.16 | 0.66 | 0.16 | 0.11 | 0.66 | 0.55 | 0.66 | 0.53 | |
| M2 STEPS | 0.28 | 0.35 | 0.28 | 0.28 | 0.46 | 0.35 | 0.46 | 0.40 | 0.25 | 0.09 | 0.25 | 0.12 | 0.50 | 0.25 | 0.50 | 0.33 | |
| M3 STEPS | 0.31 | 0.33 | 0.31 | 0.32 | 0.53 | 0.51 | 0.53 | 0.52 | 0.31 | 0.54 | 0.31 | 0.17 | 0.50 | 0.38 | 0.50 | 0.40 | |
| − Prep | MOVES | 0.67 | 0.45 | 0.67 | 0.54 | 0.75 | 0.73 | 0.75 | 0.73 | 0.25 | 0.53 | 0.25 | 0.15 | 0.76 | 0.83 | 0.76 | 0.71 |
| M1 STEPS | 0.66 | 0.43 | 0.66 | 0.52 | 0.64 | 0.61 | 0.64 | 0.62 | 0.15 | 0.69 | 0.15 | 0.11 | 0.66 | 0.67 | 0.66 | 0.52 | |
| M2 STEPS | 0.18 | 0.19 | 0.18 | 0.18 | 0.46 | 0.43 | 0.46 | 0.43 | 0.46 | 0.26 | 0.46 | 0.33 | 0.50 | 0.25 | 0.50 | 0.33 | |
| M3 STEPS | 0.33 | 0.34 | 0.33 | 0.31 | 0.48 | 0.49 | 0.48 | 0.48 | 0.34 | 0.54 | 0.34 | 0.23 | 0.50 | 0.45 | 0.50 | 0.39 | |
Table A3.
Model performance with BERT embedding.
Table A3.
Model performance with BERT embedding.
| Dataset | PN | SVM | NB | RF | |||||||||||||
|---|---|---|---|---|---|---|---|---|---|---|---|---|---|---|---|---|---|
| Acc | Pre | Rec | F1 | Acc | Pre | Rec | F1 | Acc | Pre | Rec | F1 | Acc | Pre | Rec | F1 | ||
| + Prep | MOVES | 0.67 | 0.45 | 0.67 | 0.54 | 0.71 | 0.69 | 0.71 | 0.70 | 0.63 | 0.69 | 0.63 | 0.65 | 0.69 | 0.65 | 0.69 | 0.58 |
| M1 STEPS | 0.66 | 0.72 | 0.66 | 0.55 | 0.66 | 0.66 | 0.66 | 0.66 | 0.61 | 0.68 | 0.61 | 0.63 | 0.67 | 0.65 | 0.67 | 0.58 | |
| M2 STEPS | 0.25 | 0.10 | 0.25 | 0.14 | 0.61 | 0.62 | 0.61 | 0.60 | 0.64 | 0.65 | 0.64 | 0.63 | 0.54 | 0.35 | 0.54 | 0.41 | |
| M3 STEPS | 0.36 | 0.21 | 0.36 | 0.26 | 0.44 | 0.44 | 0.44 | 0.43 | 0.46 | 0.47 | 0.46 | 0.46 | 0.57 | 0.60 | 0.57 | 0.52 | |
| − Prep | MOVES | 0.67 | 0.45 | 0.67 | 0.54 | 0.82 | 0.82 | 0.82 | 0.82 | 0.70 | 0.77 | 0.70 | 0.72 | 0.76 | 0.70 | 0.76 | 0.70 |
| M1 STEPS | 0.68 | 0.63 | 0.68 | 0.59 | 0.71 | 0.71 | 0.71 | 0.71 | 0.70 | 0.75 | 0.70 | 0.72 | 0.73 | 0.72 | 0.73 | 0.68 | |
| M2 STEPS | 0.11 | 0.05 | 0.11 | 0.06 | 0.61 | 0.54 | 0.61 | 0.57 | 0.64 | 0.64 | 0.64 | 0.64 | 0.61 | 0.62 | 0.61 | 0.54 | |
| M3 STEPS | 0.25 | 0.14 | 0.25 | 0.18 | 0.48 | 0.51 | 0.48 | 0.49 | 0.52 | 0.53 | 0.52 | 0.52 | 0.60 | 0.64 | 0.60 | 0.58 | |
Table A4.
Model performance with GPT-2 embedding.
Table A4.
Model performance with GPT-2 embedding.
| Dataset | PN | SVM | NB | RF | |||||||||||||
|---|---|---|---|---|---|---|---|---|---|---|---|---|---|---|---|---|---|
| Acc | Pre | Rec | F1 | Acc | Pre | Rec | F1 | Acc | Pre | Rec | F1 | Acc | Pre | Rec | F1 | ||
| + Prep | MOVES | 0.22 | 0.05 | 0.22 | 0.08 | 0.74 | 0.73 | 0.74 | 0.74 | 0.61 | 0.72 | 0.61 | 0.63 | 0.68 | 0.74 | 0.68 | 0.58 |
| M1 STEPS | 0.65 | 0.43 | 0.65 | 0.52 | 0.65 | 0.64 | 0.65 | 0.64 | 0.57 | 0.62 | 0.57 | 0.59 | 0.65 | 0.55 | 0.65 | 0.53 | |
| M2 STEPS | 0.50 | 0.26 | 0.50 | 0.34 | 0.61 | 0.60 | 0.61 | 0.60 | 0.61 | 0.60 | 0.61 | 0.58 | 0.53 | 0.47 | 0.53 | 0.40 | |
| M3 STEPS | 0.29 | 0.21 | 0.29 | 0.24 | 0.43 | 0.43 | 0.43 | 0.42 | 0.50 | 0.49 | 0.50 | 0.49 | 0.54 | 0.54 | 0.54 | 0.46 | |
| − Prep | MOVES | 0.22 | 0.04 | 0.22 | 0.08 | 0.80 | 0.78 | 0.80 | 0.78 | 0.62 | 0.69 | 0.62 | 0.64 | 0.72 | 0.70 | 0.72 | 0.64 |
| M1 STEPS | 0.66 | 0.43 | 0.66 | 0.52 | 0.64 | 0.61 | 0.64 | 0.62 | 0.61 | 0.68 | 0.61 | 0.63 | 0.67 | 0.58 | 0.67 | 0.57 | |
| M2 STEPS | 0.50 | 0.25 | 0.50 | 0.33 | 0.64 | 0.63 | 0.64 | 0.63 | 0.61 | 0.59 | 0.61 | 0.59 | 0.54 | 0.47 | 0.54 | 0.40 | |
| M3 STEPS | 0.45 | 0.20 | 0.45 | 0.28 | 0.57 | 0.61 | 0.57 | 0.58 | 0.55 | 0.56 | 0.55 | 0.55 | 0.53 | 0.54 | 0.53 | 0.48 | |
Table A5.
Model performance with Llama-3.2-3B embedding.
Table A5.
Model performance with Llama-3.2-3B embedding.
| Dataset | PN | SVM | NB | RF | |||||||||||||
|---|---|---|---|---|---|---|---|---|---|---|---|---|---|---|---|---|---|
| Acc | Pre | Rec | F1 | Acc | Pre | Rec | F1 | Acc | Pre | Rec | F1 | Acc | Pre | Rec | F1 | ||
| + Prep | MOVES | 0.66 | 0.45 | 0.66 | 0.54 | 0.79 | 0.79 | 0.79 | 0.79 | 0.63 | 0.72 | 0.63 | 0.66 | 0.69 | 0.62 | 0.69 | 0.58 |
| M1 STEPS | 0.66 | 0.67 | 0.66 | 0.53 | 0.65 | 0.63 | 0.65 | 0.64 | 0.60 | 0.67 | 0.60 | 0.63 | 0.66 | 0.56 | 0.66 | 0.55 | |
| M2 STEPS | 0.46 | 0.24 | 0.46 | 0.32 | 0.75 | 0.76 | 0.75 | 0.75 | 0.71 | 0.73 | 0.71 | 0.69 | 0.57 | 0.59 | 0.57 | 0.46 | |
| M3 STEPS | 0.38 | 0.25 | 0.38 | 0.28 | 0.53 | 0.53 | 0.53 | 0.53 | 0.52 | 0.51 | 0.52 | 0.51 | 0.58 | 0.64 | 0.58 | 0.55 | |
| − Prep | MOVES | 0.66 | 0.45 | 0.66 | 0.54 | 0.85 | 0.84 | 0.85 | 0.84 | 0.70 | 0.78 | 0.70 | 0.73 | 0.76 | 0.81 | 0.76 | 0.71 |
| M1 STEPS | 0.65 | 0.43 | 0.65 | 0.52 | 0.70 | 0.68 | 0.70 | 0.69 | 0.67 | 0.71 | 0.67 | 0.68 | 0.71 | 0.73 | 0.71 | 0.64 | |
| M2 STEPS | 0.50 | 0.25 | 0.50 | 0.33 | 0.57 | 0.43 | 0.57 | 0.49 | 0.61 | 0.53 | 0.61 | 0.56 | 0.57 | 0.46 | 0.57 | 0.50 | |
| M3 STEPS | 0.40 | 0.35 | 0.40 | 0.34 | 0.53 | 0.53 | 0.53 | 0.53 | 0.61 | 0.65 | 0.61 | 0.61 | 0.65 | 0.69 | 0.65 | 0.64 | |
Table A6.
Model performance with TEv3-small embedding.
Table A6.
Model performance with TEv3-small embedding.
| Dataset | PN | SVM | NB | RF | |||||||||||||
|---|---|---|---|---|---|---|---|---|---|---|---|---|---|---|---|---|---|
| Acc | Pre | Rec | F1 | Acc | Pre | Rec | F1 | Acc | Pre | Rec | F1 | Acc | Pre | Rec | F1 | ||
| + Prep | MOVES | 0.67 | 0.45 | 0.67 | 0.54 | 0.73 | 0.76 | 0.73 | 0.68 | 0.71 | 0.74 | 0.71 | 0.72 | 0.69 | 0.68 | 0.69 | 0.58 |
| M1 STEPS | 0.62 | 0.55 | 0.62 | 0.55 | 0.66 | 0.53 | 0.66 | 0.54 | 0.64 | 0.65 | 0.64 | 0.65 | 0.65 | 0.43 | 0.65 | 0.52 | |
| M2 STEPS | 0.21 | 0.17 | 0.21 | 0.18 | 0.50 | 0.25 | 0.50 | 0.33 | 0.68 | 0.66 | 0.68 | 0.62 | 0.53 | 0.38 | 0.53 | 0.40 | |
| M3 STEPS | 0.21 | 0.19 | 0.21 | 0.20 | 0.58 | 0.59 | 0.58 | 0.52 | 0.64 | 0.63 | 0.64 | 0.63 | 0.55 | 0.57 | 0.55 | 0.48 | |
| − Prep | MOVES | 0.67 | 0.45 | 0.67 | 0.54 | 0.83 | 0.86 | 0.83 | 0.80 | 0.78 | 0.81 | 0.78 | 0.79 | 0.72 | 0.67 | 0.72 | 0.64 |
| M1 STEPS | 0.51 | 0.54 | 0.51 | 0.52 | 0.68 | 0.65 | 0.68 | 0.58 | 0.66 | 0.70 | 0.66 | 0.67 | 0.67 | 0.53 | 0.67 | 0.55 | |
| M2 STEPS | 0.21 | 0.19 | 0.21 | 0.19 | 0.54 | 0.47 | 0.54 | 0.40 | 0.78 | 0.82 | 0.79 | 0.77 | 0.61 | 0.59 | 0.61 | 0.55 | |
| M3 STEPS | 0.21 | 0.17 | 0.21 | 0.19 | 0.63 | 0.66 | 0.63 | 0.62 | 0.58 | 0.59 | 0.58 | 0.57 | 0.66 | 0.72 | 0.66 | 0.63 | |
References
- Swales, J.M. Genre Analysis; Cambridge University Press: Cambridge, UK, 1990. [Google Scholar]
- Swales, J.M. Research Genres: Explorations and Applications; Cambridge University Press: Cambridge, UK, 2004. [Google Scholar]
- Anthony, L.; Lashkia, G.V. Mover: A machine learning tool to assist in the reading and writing of technical papers. IEEE Trans. Prof. Commun. 2003, 46, 185–193. [Google Scholar] [CrossRef]
- Gayed, J.M.; Carlon, M.K.J.; Oriola, A.M.; Cross, J.S. Exploring an AI-based writing Assistant’s impact on English language learners. Comput. Educ. Artif. Intell. 2022, 3, 100055. [Google Scholar] [CrossRef]
- Taylor, G.; Tingguang, C. Linguistic, cultural, and subcultural issues in contrastive discourse analysis: Anglo-American and Chinese scientific texts. Appl. Linguist. 1991, 12, 319–336. [Google Scholar] [CrossRef]
- Al-Qahtani, A.A. A Contrastive Rhetoric Study of Arabic and English Research Article* Introductions; Oklahoma State University: Stillwater, OK, USA, 2006. [Google Scholar]
- Fredrickson, K.M.; Swales, J. Competition and discourse community: Introductions from Nysvenska studier. In Text and Talk in Professional Contexts; ASLA: Dalarna, Sweden, 1994; pp. 9–22. [Google Scholar]
- Crookes, G. Towards a Validated Analysis of Scientific Text Structure. 1984. Available online: https://scholarspace.manoa.hawaii.edu/bitstreams/5a9f0eee-dc49-443f-a13b-4adeb3bcefca/download (accessed on 1 March 2025).
- Samraj, B. Introductions in research articles: Variations across disciplines. Engl. Specif. Purp. 2002, 21, 1–17. [Google Scholar] [CrossRef]
- Cotos, E.; Pendar, N. Discourse classification into rhetorical functions for AWE feedback. Calico J. 2016, 33, 92–116. [Google Scholar] [CrossRef]
- Hearst, M.; Dumais, S.; Osuna, E.; Platt, J.; Scholkopf, B. Support vector machines. IEEE Intell. Syst. Their Appl. 1998, 13, 18–28. [Google Scholar] [CrossRef]
- Suryani, I.; Kamaruddin, H.; Hashima, N.; Yaacob, A.; Rashid, S.; Desa, H. Rhetorical structures in academic research writing by non-native writers. Int. J. High. Educ. 2013, 3, 19–38. [Google Scholar] [CrossRef]
- Anthony, L. Writing research article introductions in software engineering: How accurate is a standard model? IEEE Trans. Prof. Commun. 1999, 42, 38–46. [Google Scholar] [CrossRef]
- Nwogu, K.N. The medical research paper: Structure and functions. Engl. Specif. Purp. 1997, 16, 119–138. [Google Scholar] [CrossRef]
- Day, R.A. The origins of the scientific paper: The IMRAD format. Am. Med. Writ. Assoc. 1989, 4, 16–18. [Google Scholar]
- Bui, D.D.A.; Del Fiol, G.; Jonnalagadda, S. PDF text classification to leverage information extraction from publication reports. J. Biomed. Inform. 2016, 61, 141–148. [Google Scholar] [CrossRef] [PubMed]
- Lam, C.; Nnamoko, N. Quantitative metrics to the CARS model in academic discourse in biology introductions. In Proceedings of the 5th Workshop on Computational Approaches to Discourse (CODI 2024), St. Julian’s, Malta, 21–22 March 2024; pp. 71–77. [Google Scholar]
- Snell, J.; Swersky, K.; Zemel, R. Prototypical networks for few-shot learning. In Advances in Neural Information Processing Systems; Curran Associates, Inc.: Red Hook, NY, USA, 2017; Volume 30. [Google Scholar]
- Rish, I. An empirical study of the naive Bayes classifier. In Proceedings of the IJCAI 2001 Workshop on Empirical Methods in Artificial Intelligence, Seattle, WA, USA, 4–10 August 2001; Volume 3, pp. 41–46. [Google Scholar]
- Breiman, L. Random forests. Mach. Learn. 2001, 45, 5–32. [Google Scholar] [CrossRef]
- Mikolov, T.; Sutskever, I.; Chen, K.; Corrado, G.S.; Dean, J. Distributed Representations of Words and Phrases and their Compositionality. In Advances in Neural Information Processing Systems; Burges, C., Bottou, L., Welling, M., Ghahramani, Z., Weinberger, K., Eds.; Curran Associates, Inc.: Red Hook, NY, USA, 2013; Volume 26. [Google Scholar]
- Pennington, J.; Socher, R.; Manning, C. Glove: Global Vectors for Word Representation. In Proceedings of the 2014 Conference on Empirical Methods in Natural Language Processing (EMNLP), Doha, Qatar, 25–29 October 2014; pp. 1532–1543. [Google Scholar] [CrossRef]
- Devlin, J.; Chang, M.W.; Lee, K.; Toutanova, K. BERT: Pre-training of Deep Bidirectional Transformers for Language Understanding. In Proceedings of the 2019 Conference of the North, Minneapolis, MN, USA, 3–5 June 2019; pp. 4171–4186. [Google Scholar] [CrossRef]
- Radford, A.; Wu, J.; Child, R.; Luan, D.; Amodei, D.; Sutskever, I. Language Models are Unsupervised Multitask Learners. OpenAI Blog 2019, 1, 9. [Google Scholar]
- Grattafiori, A.; Dubey, A.; Jauhri, A.; Pandey, A.; Kadian, A.; Al-Dahle, A.; Letman, A.; Mathur, A.; Schelten, A.; Vaughan, A.; et al. The llama 3 herd of models. arXiv 2024, arXiv:2407.21783. [Google Scholar]
- Posteguillo, S. A genre-based approach to the teaching of reading and writing abstracts in computer science. In English in Specific Settings; Nau Llibres: València, Spain, 1996; pp. 47–57. [Google Scholar]
- IEEE. 1998 Index IEEE Transactions on Parallel And Distributed Systems—Author Index. IEEE Trans. Parallel Distrib. Syst. 1998, 9, 1269–1273. [Google Scholar] [CrossRef]
- Knight, S.; Shibani, A.; Abel, S.; Gibson, A.; Ryan, P. AcaWriter: A Learning Analytics Tool for Formative Feedback on Academic Writing. J. Writ. Res. 2020, 12, 141–186. [Google Scholar] [CrossRef]
- Sándor, Á. A framework for detecting contextual concepts in texts. In ELECTRA Workshop on Methodologies and Evaluation of Lexical Cohesion Techniques in Real-World Applications (Beyond Bag of Words); Citeseer: Princeton, NJ, USA, 2005; pp. 80–89. [Google Scholar]
- Sun, Y.C. Learner perceptions of a concordancing tool for academic writing. Comput. Assist. Lang. Learn. 2007, 20, 323–343. [Google Scholar] [CrossRef]
- Kim, M.; Lu, X. Exploring the potential of using ChatGPT for rhetorical move-step analysis: The impact of prompt refinement, few-shot learning, and fine-tuning. J. Engl. Acad. Purp. 2024, 71, 101422. [Google Scholar] [CrossRef]
- Loper, E.; Bird, S. NLTK. In Proceedings of the ACL-02 Workshop on Effective Tools and Methodologies for Teaching Natural Language Processing and Computational Linguistics, Philadelphia, PA, USA, 7 July 2002; Volume 1, pp. 63–70. [Google Scholar] [CrossRef]
- Jackson, P.; Moulinier, I. Natural Language Processing for Online Applications: Text Retrieval, Extraction & Categorization, 2nd ed.; John Benjamins Publishing Company: Amsterdam, The Netherlands, 2002. [Google Scholar]
- Makrehchi, M.; Kamel, M.S. Automatic Extraction of Domain-Specific Stopwords from Labeled Documents. In Advances in Information Retrieval; Macdonald, C., Ounis, I., Plachouras, V., Ruthven, I., White, R.W., Eds.; Springer: Berlin/Heidelberg, Germany, 2008; pp. 222–233. [Google Scholar] [CrossRef]
- Porter, M. An algorithm for suffix stripping. Program 1980, 14, 130–137. [Google Scholar] [CrossRef]
- Rossiello, G.; Basile, P.; Semeraro, G. Centroid-based Text Summarization through Compositionality of Word Embeddings. In Proceedings of the MultiLing 2017 Workshop on Summarization and Summary Evaluation Across Source Types and Genres, Valencia, Spain, 3 April 2017; pp. 12–21. [Google Scholar] [CrossRef]
- Řehůřek, R.; Sojka, P. Software Framework for Topic Modelling with Large Corpora. In Proceedings of the LREC 2010 Workshop on New Challenges for NLP Frameworks, Valletta, Malta, 22 May 2010; pp. 45–50. [Google Scholar]
- Wolf, T.; Debut, L.; Sanh, V.; Chaumond, J.; Delangue, C.; Moi, A.; Cistac, P.; Rault, T.; Louf, R.; Funtowicz, M.; et al. Transformers: State-of-the-Art Natural Language Processing. In Proceedings of the 2020 Conference on Empirical Methods in Natural Language Processing: System Demonstrations, Online, 16–20 November 2020; pp. 38–45. [Google Scholar]
- McCallum, A.; Nigam, K. A comparison of event models for Naive Bayes text classification. In Proceedings of the AAAI-98 Workshop on Learning for Text Categorization, Madison, WI, USA, 26–27 July 1998; Citeseer: Princeton, NJ, USA, 1998; Volume 752, pp. 41–48. [Google Scholar]
- Onikoyi, B.; Nnamoko, N.; Korkontzelos, I. Gender prediction with descriptive textual data using a Machine Learning approach. Nat. Lang. Process. J. 2023, 4, 100018. [Google Scholar] [CrossRef]
- Belinkov, Y.; Glass, J. Analysis methods in neural language processing: A survey. arXiv 2018, arXiv:cs.CL/1812.08951. [Google Scholar] [CrossRef]
- El-Khair, I.A. Effects of stop words elimination for Arabic Information Retrieval: A comparative study. arXiv 2017, arXiv:cs.CL/1702.01925. [Google Scholar]
- Nnamoko, N.; Karaminis, T.; Procter, J.; Barrowclough, J.; Korkontzelos, I. Automatic language ability assessment method based on natural language processing. Nat. Lang. Process. J. 2024, 8, 100094. [Google Scholar] [CrossRef]
- Menzies, T.; Marcus, A. Automated severity assessment of software defect reports. In Proceedings of the IEEE International Conference on Software Maintenance, ICSM, Beijing, China, 28 September–4 October 2008; pp. 346–355. [Google Scholar] [CrossRef]
- Nnamoko, N.; Cabrera-Diego, L.A.; Campbell, D.; Korkontzelos, Y. Bug Severity Prediction Using a Hierarchical One-vs.-Remainder Approach. In Natural Language Processing and Information Systems: Proceedings of the 24th International Conference on Applications of Natural Language to Information Systems, NLDB 2019, Salford, UK, 26–28 June 2019; Métais, E., Meziane, F., Sunil, V., Sugumaran, V., Saraee, M., Eds.; Springer: Berlin/Heidelberg, Germany, 2019; pp. 247–260. [Google Scholar] [CrossRef]
- Chawla, N.V.; Bowyer, K.W.; Hall, L.O.; Kegelmeyer, W.P. SMOTE: Synthetic Minority Over-sampling Technique. J. Artif. Intell. Res. 2002, 16, 321–357. [Google Scholar] [CrossRef]
Disclaimer/Publisher’s Note: The statements, opinions and data contained in all publications are solely those of the individual author(s) and contributor(s) and not of MDPI and/or the editor(s). MDPI and/or the editor(s) disclaim responsibility for any injury to people or property resulting from any ideas, methods, instructions or products referred to in the content. |
© 2025 by the authors. Licensee MDPI, Basel, Switzerland. This article is an open access article distributed under the terms and conditions of the Creative Commons Attribution (CC BY) license (https://creativecommons.org/licenses/by/4.0/).