1. Introduction
Many of the intriguing features of blood originate from its cellular nature. These cells are immersed in blood plasma, an incompressible fluid. Of these cells, red blood cells (RBCs) are the most numerous, having a biconcave disc shape with a diameter of 7.82
m and a thickness of approximately 2
m, making up about 45% of the blood volume. Platelets (PLTs) are the second most numerous cell type with approximately one platelet for every ten RBCs [
1]. They are significantly smaller (≈2.5
m diameter) and less deformable in their unactivated form. Due to a majority in cell count and volume ratio, the transport mechanics of the whole blood are mainly dictated by RBCs. The cytoplasmic fluid that resides inside the RBC has a higher viscosity than that of the surrounding blood plasma [
2] mainly due to hemoglobin. This contrast is known to affect the type of motion that a red blood cell exhibits [
3], as well as affecting other transport properties such as the lift velocity [
4] or the diffusion [
5] of RBCs. Furthermore, there are several diseases which are known to influence the structure of a RBC, altering its viscosity and deformability, such as malaria [
6] or sickle cell disease [
7].
Some of the interesting phenomena arising from this cellular nature include shear-thinning [
8], the appearance of a cell-free layer in which no red blood cell resides [
9,
10], the Fåhræus effect [
11] and the Fåhræus-Lindqvist effect [
12]. Although much research has been done to investigate the rheological properties of blood for an overview, see Sousa et al. [
13]), many of the underlying mechanics are still not understood well enough to provide a complete mathematical analysis [
14,
15,
16]. Obtaining a better understanding of the transport behaviour is, however, essential as it can help to further improve medical devices and treatments of diseases. In-silico cellular models of blood are invaluable to gain this understanding since many properties that blood exhibits are difficult to measure through experiments.
Many numerical investigations have been carried out in the literature lately that target cellular blood flows (e.g., [
17,
18,
19,
20,
21,
22,
23,
24,
25]). A detailed overview of the methods can be found in the work of Freund [
26]. These express the mechanical behaviour of RBCs and PLTs based on constitutive models, such as the energy model of Skalak [
27], the spectrin-link model in [
28], or its coarse-grained version [
29], or the improved spectrin-link model of Zavodszky et al. [
25], which is applied in the current work as well. One important advantage of the latter model is its increased numerical stability under high shear rate flows.
The RBC cytoplasm is a dense mixture of protein complexes [
30] which contributes to its increased viscosity. The effects of cytoplasmic viscosity on the transport characteristics of blood has not yet been fully explored. Kruger et al. implemented viscosity contrast in their lattice Boltzmann method (LBM) based model by tuning the relaxation time of the flow field [
31,
32] but a detailed investigation was not made to quantify the effects of this addition. Fedosov et al. carried out membrane fluctuation simulations [
33] in their dissipativ particle dynamics (DPD) based model with a viscosity contrast of 5, however, they did not include this contrast in any other of their cases. More expansive investigation on the effects of added viscosity contrast was done for two-dimensional models of vesicles [
34] and red blood cells [
35] where the authors found that it does indeed affect the deformability and motion of cells but the two-dimensional nature of the models prevented quantitative comparison of the obtained results.
The current work focused on the effects of the viscosity contrast between the interior fluid of a red blood cell and the exterior suspending fluid. We extended an existing model developed for three-dimensional blood flows based on the open-source framework HemoCell [
25]. Simulations were performed on single RBCs to investigate the effects of cytoplasmic viscosity on cell-cell collisions, on cell deformation in Couette flow, and on cell migration in pressure driven channels. Furthermore, the change in apparent viscosity and haematocrit profile of blood flows in straight circular channel flow was also investigated. Computational performance is an important factor in such cellular simulations [
36,
37], therefore an efficient fully parallel algorithm is presented to solve the tracking of the inner points of RBCs.
2. Materials and Methods
In our simulations, the blood plasma is represented as a continuous incompressible Newtonian fluid that is computed using LBM with a D3Q19 grid and the Bhatnagar-Gross-Krook (BGK) collision operator which provides second order accuracy in the bulk of the flow. The red blood cells are represented as discrete element method (DEM) membranes which are coupled to the fluid using a validated in-house immersed boundary method (IBM) [
25,
38]. This IBM implementation builds on the original formalism by Peskin et al. [
39]. The mechanical responses of the immersed cells in this work are based on the model description that is explained and validated in [
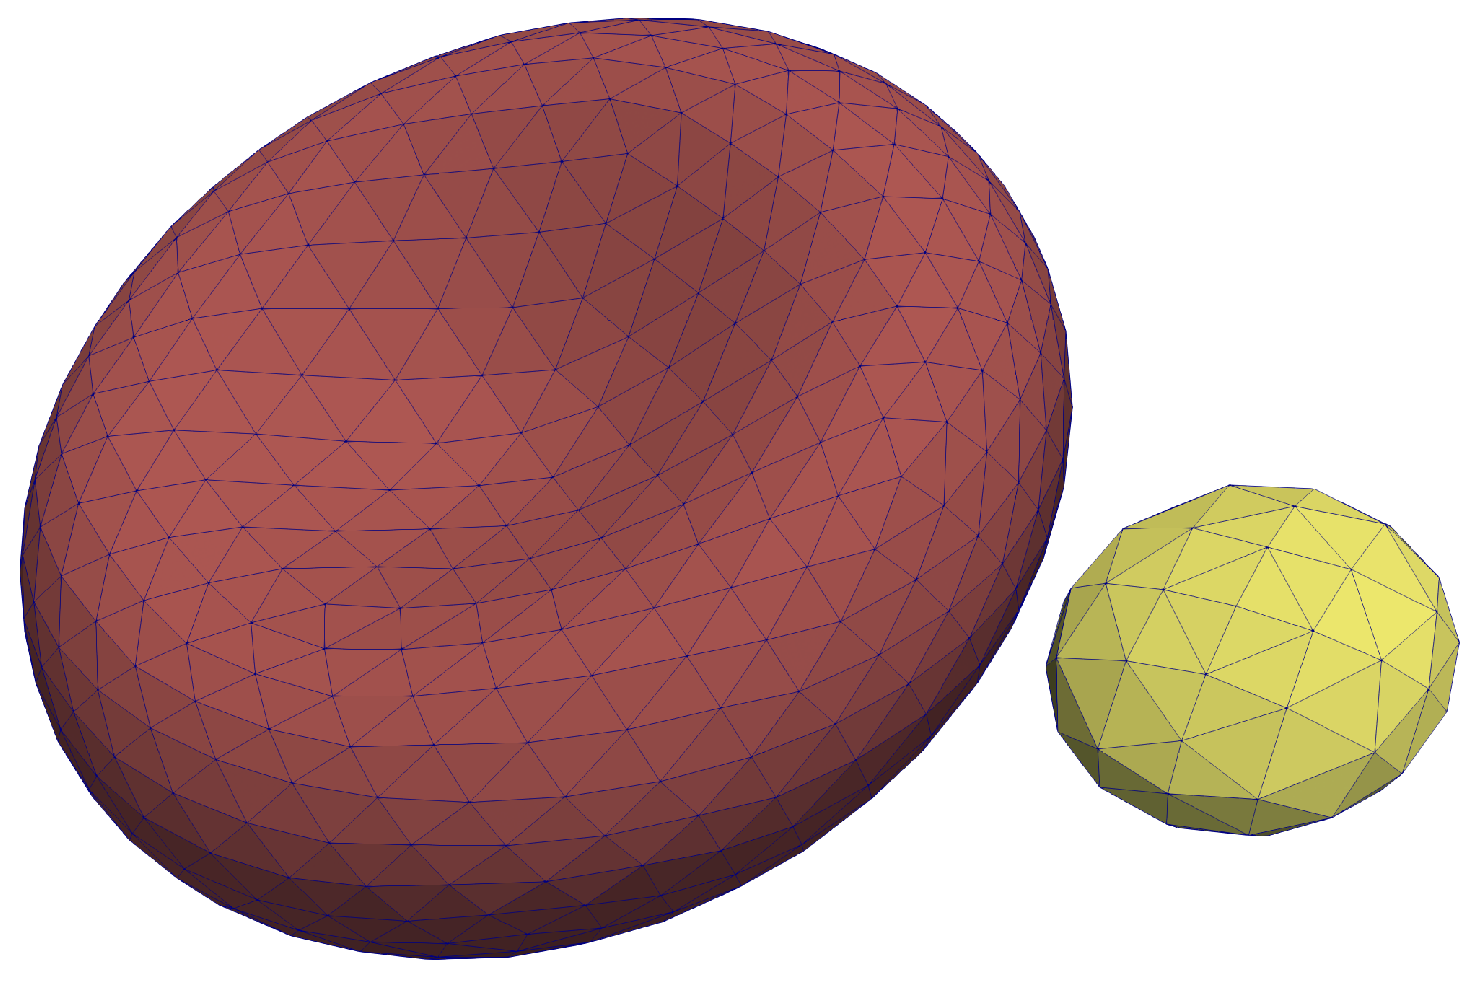
25]. The RBC mesh consists of
vertices and
triangles, whereas a platelet mesh consists of with
vertices and
triangles. These meshes are depicted in
Figure 1.
To simulate a viscosity contrast between the cytoplasmic solution of the RBC and the blood plasma, such an approach is chosen that is similar to the method described in [
34]. We define the ratio between the internal and external viscosities to be
, with
the kinematic viscosity of the internal fluid and
the kinematic viscosity of the external suspending fluid.
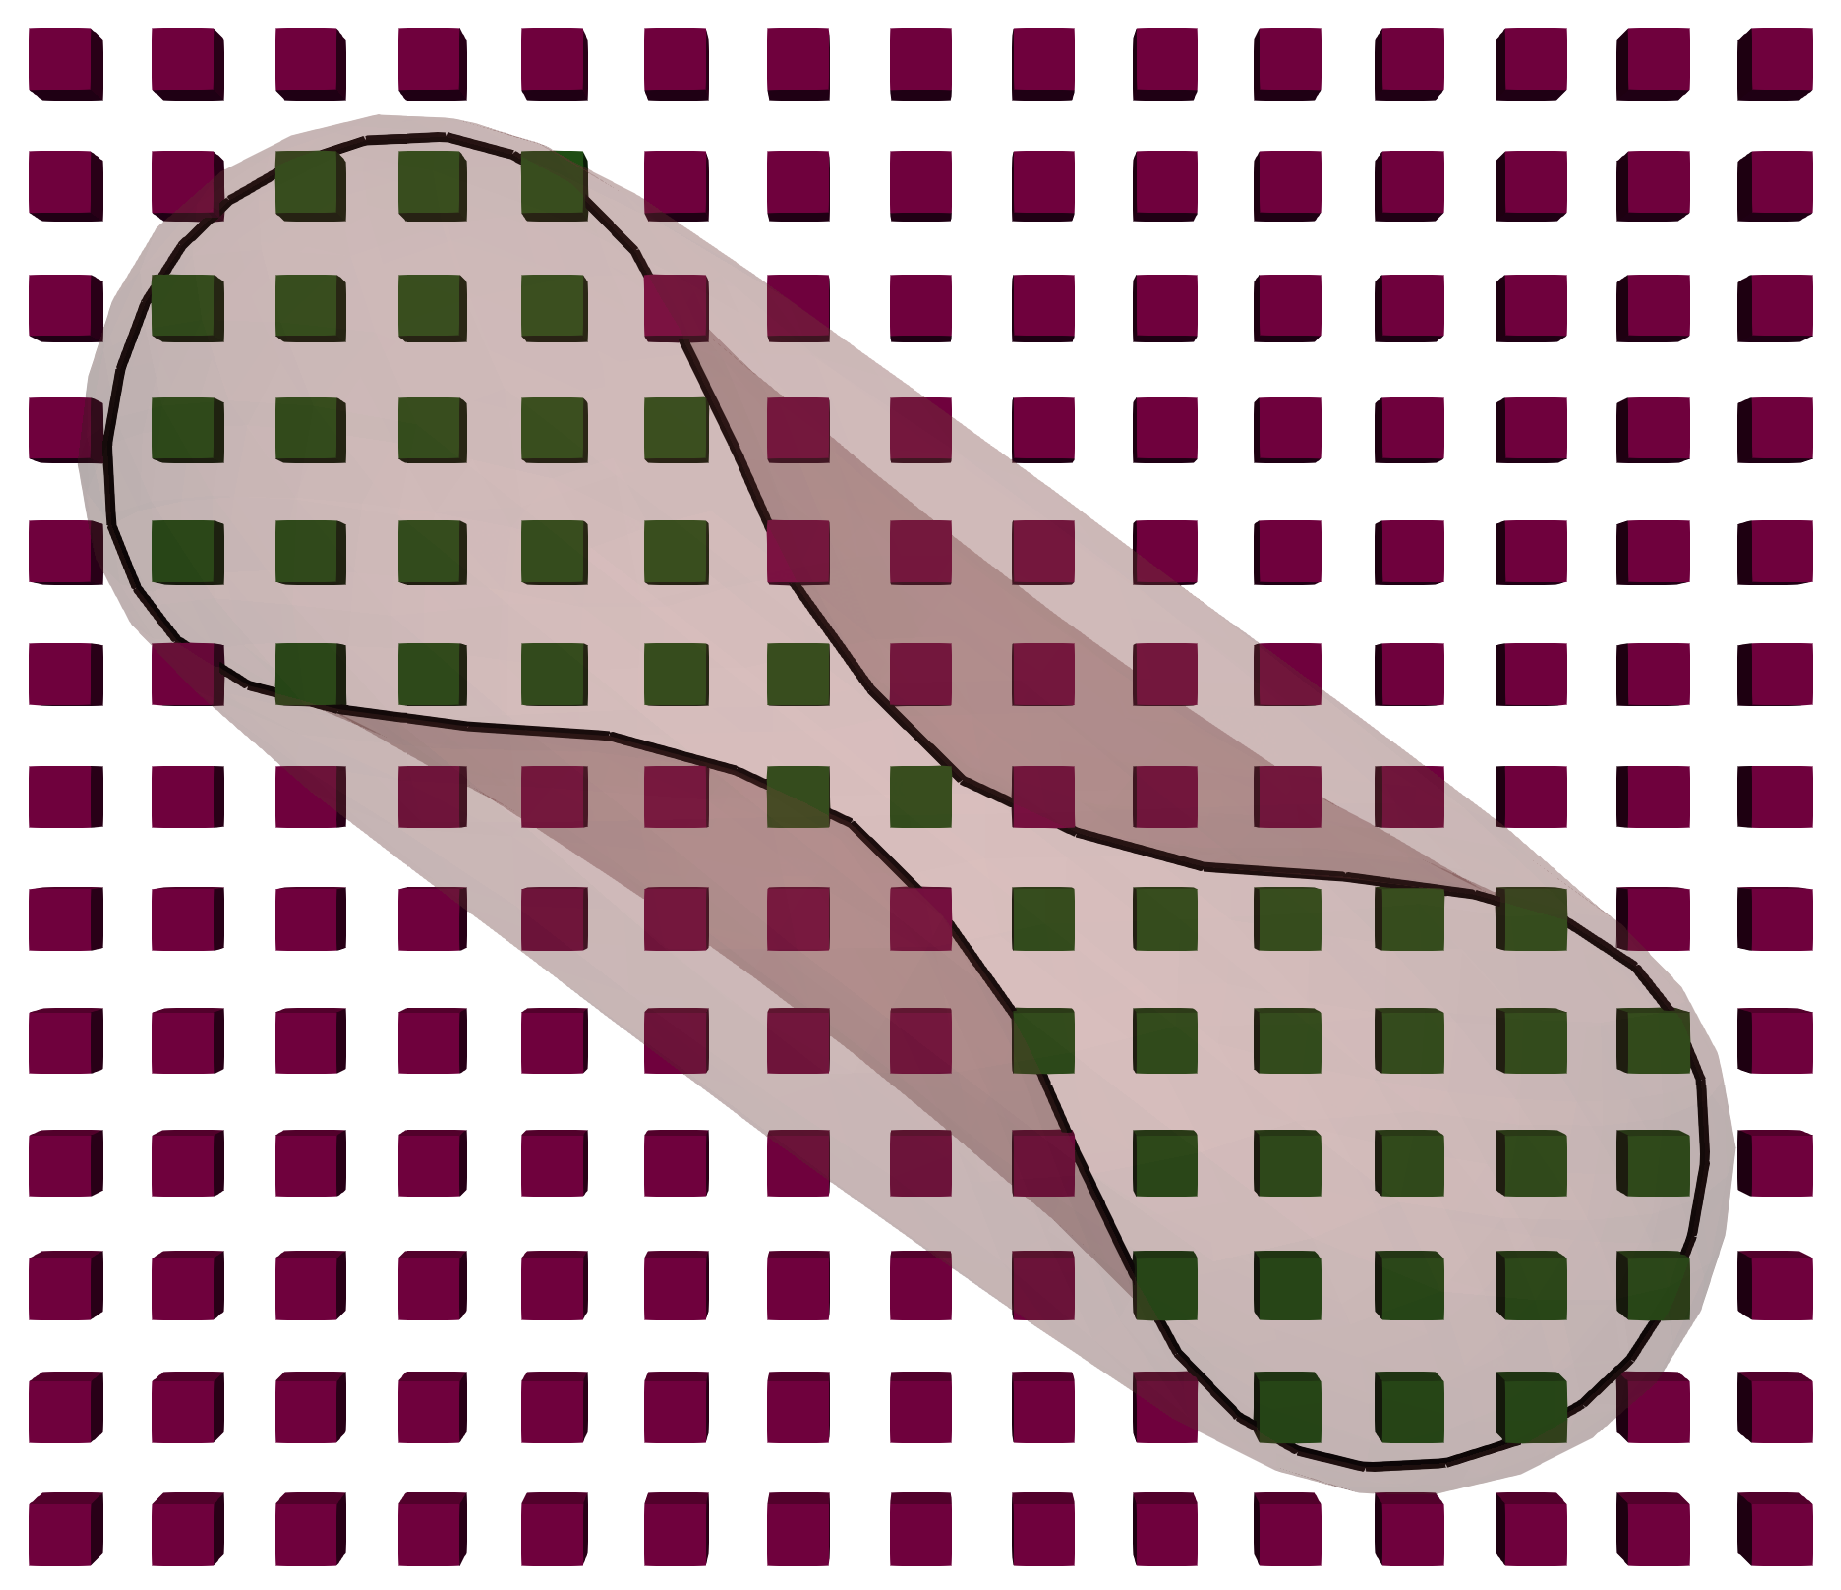
To introduce this viscosity contrast to the fluid, one needs to keep track of the fluid nodes residing inside the membranes on the RBCs. These membranes are represented as closed surface polygonal meshes which enclose lattice nodes of the fluid grid. For these grid nodes, the relaxation parameter, , can be altered to express the increase of local viscosity.
If a fluid node is located inside the RBC, the relaxation parameter of that node is adjusted based on the viscosity ratio between the internal and external fluid so that:
where
is the relaxation time for an internal lattice node,
is the relaxation time for the external lattice nodes, and
is the viscosity ratio between the external and internal fluids. Experimental work predicts the inner viscosity to be in the range of 3–10 ×
Pas [
2,
40]. In this work, we chose
for all the performed simulations with a viscosity contrast.
Determining whether a lattice point is inside an RBC is done using the
even-odd rule [
41]. This rule builds on simple ray-casting where we determine if a point
is inside or outside a polygon by testing how many times a ray, starting from the point
to any other point outside the domain, intersects with the polygon. If the number of intersections is an even number, the point is outside of the polygon, whilst a point is inside the polygon if the number of intersections is odd. Testing whether an intersection takes place between a ray and a polygon is done by performing the Möller-Trumbore algorithm [
42]. It is applied to each of the triangles which make up the RBC membrane.
The chosen parameters of the simulations result in the RBC mesh consisting of 1280 triangles, enclosing approximately 720 lattice nodes. To reduce the amount of computations that have to be performed, the ray is always cast towards a fixed direction and the positions of the triangle vertices are structured using an octree data structure [
43]. This drastically reduces the amount of ray-triangle intersections that have to be calculated for each lattice node.
The algorithm above does not have to be performed at every iteration. The typical time step of our simulations is in the order of
s, during which the membrane always moves much less than the size of a lattice node. Furthermore, the fluid nodes close to a given membrane point are already known due to the application of the immersed boundary method. The normal vectors of the surface at each of the vertices that makes up a cell are also known since the constitutive model makes use of the local curvature. Based on these, one can quickly identify changes in internal lattice nodes close to the cell membrane. The ray-casting algorithm described above is still used periodically to ensure the correctness of the grid. The whole algorithm uses the same distributed data-structures that were already in place and it is applied in parallel by the employed data processors to enable performant HPC execution.
Figure 2 shows a slice of the fluid field and an RBC to depict the positions of the internal fluid nodes.
A similar approach for adding the interior viscosity to a LBM based blood flow model was done in [
32], although they implemented a parallelised Hoshen-Kopelman algorithm [
44] for finding the lattice nodes that are enclosed by the RBC instead of executing a ray-casting method on an octree data structure. We believe that a parallel implementation of the algorithm in this work is more straightforward in combination with the Palabos framework [
45] that is used by HemoCell. The performance differences between our proposed method and an implementation of the Hoshen-Kopelman algorithm are expected to be negligible as the more demanding ray-casting step is only applied periodically. For a typical simulation, the addition of simulating a cytoplasmic viscosity contrast increases the runtime with 25% at most.
3. Results
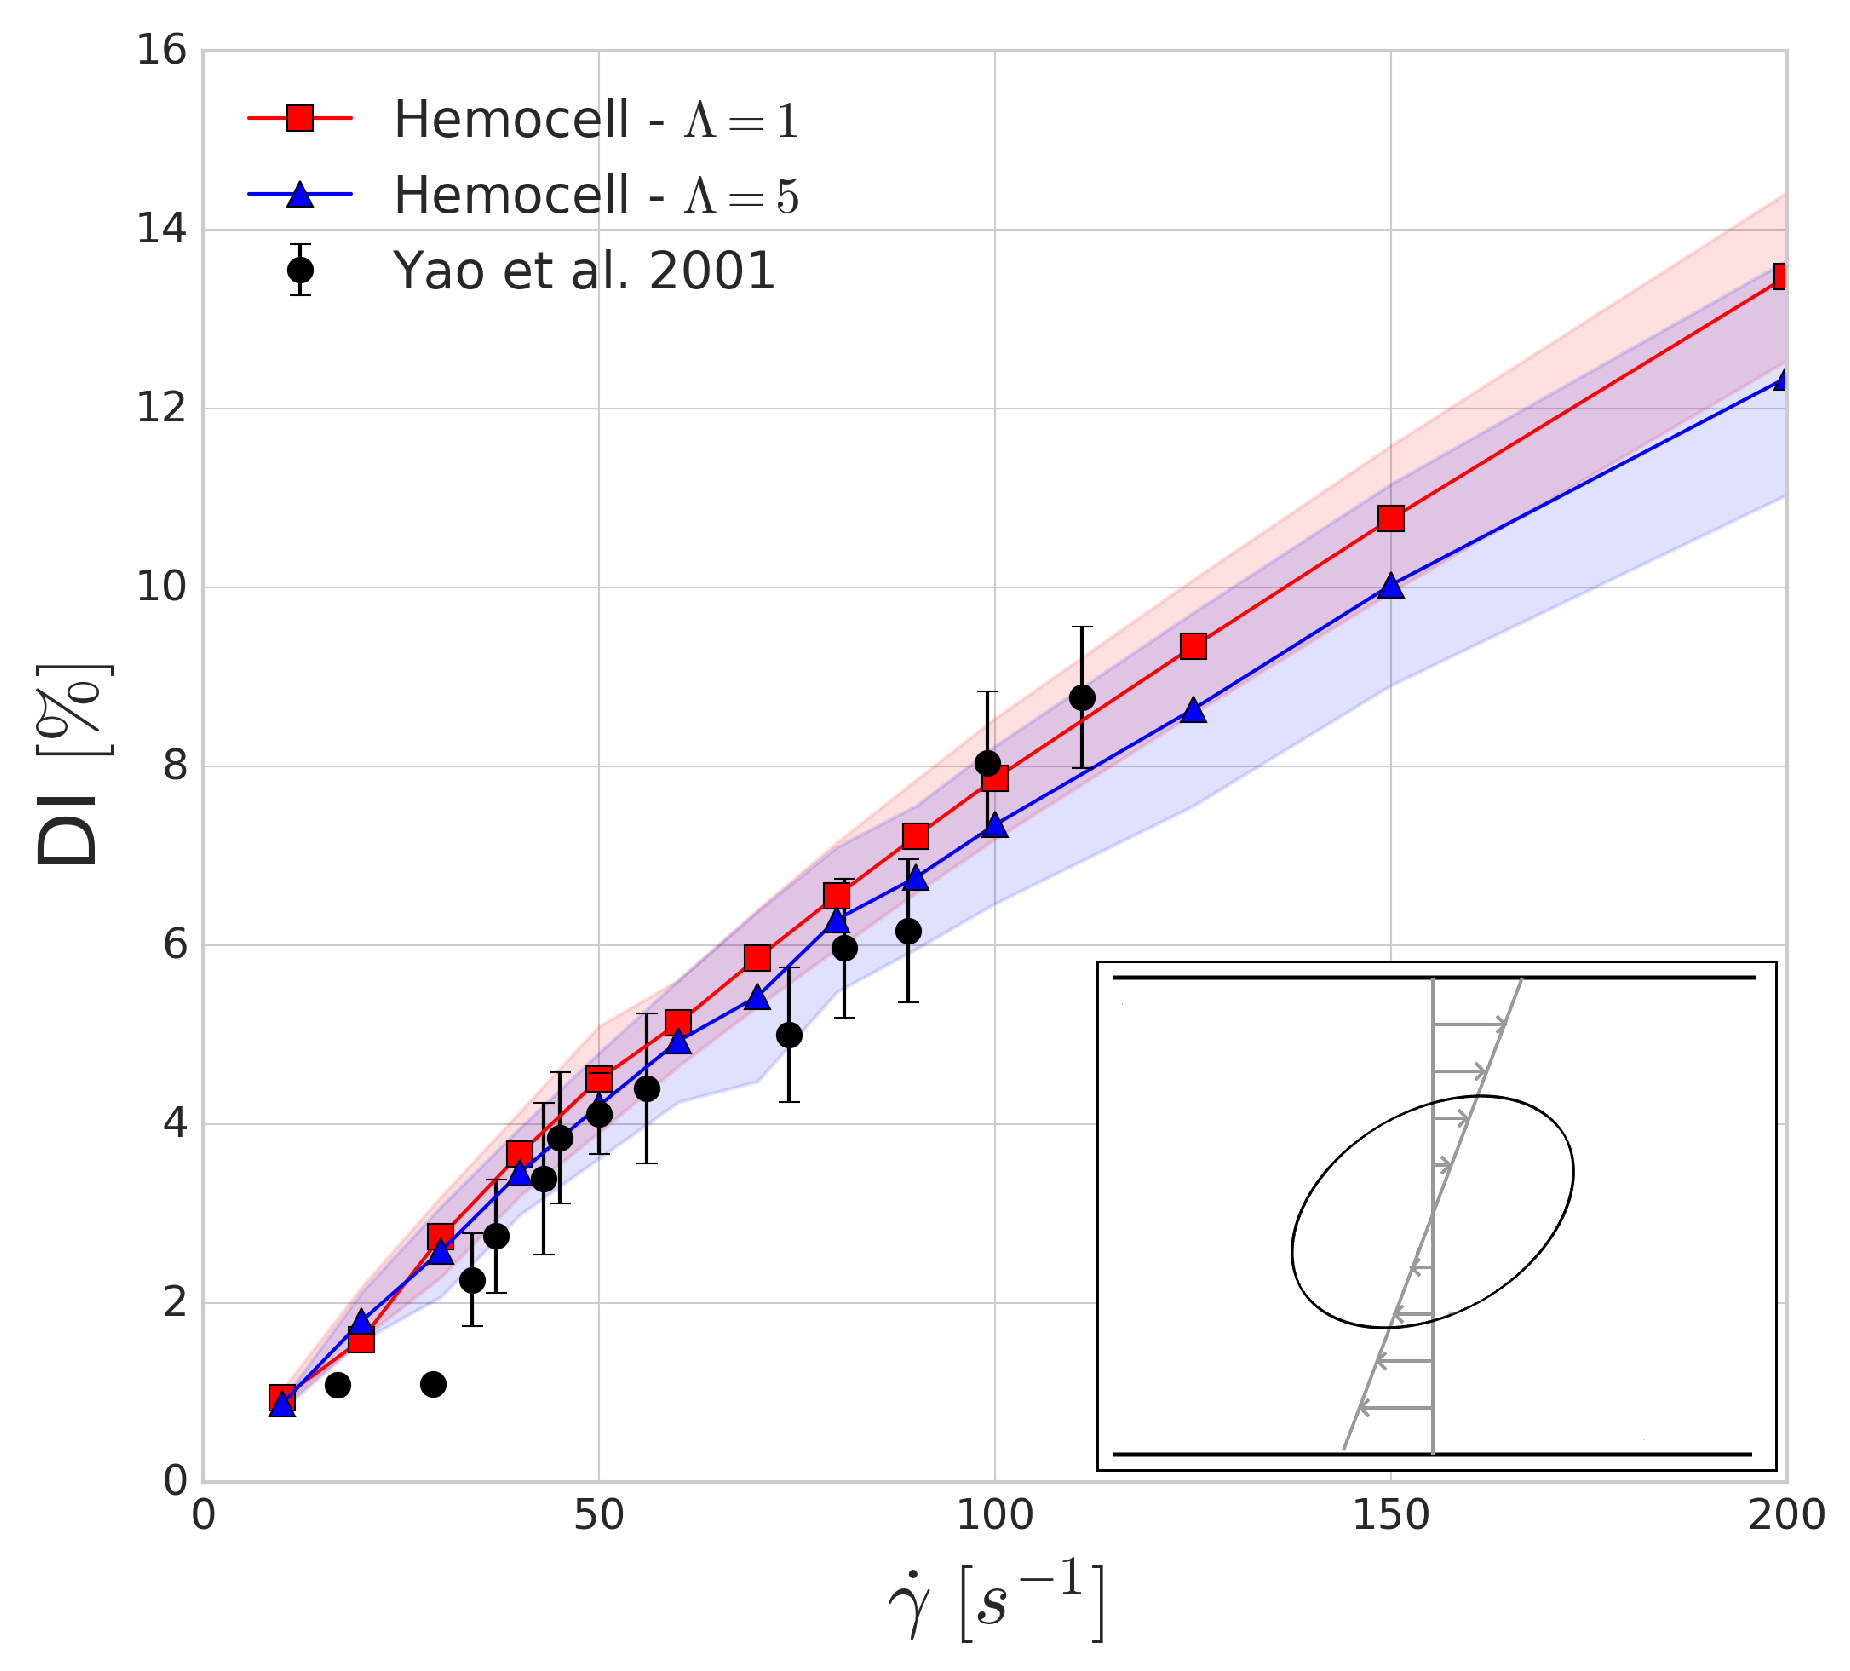
3.1. Wheeler Test
The Wheeler shear experiment performed by Yao et al. in [
46] consists of positioning an RBC in Couette shear flow such that the axis of symmetry lies in the shear plane and is perpendicular to the flow velocity. We numerically replicate this experiment with shear rate values between 10 and 200 s
and compare the obtained results to the experiment. The deformation index is given by
where
is the largest diameter of the deformed red blood cell and
is the largest diameter (7.82
m) of the undeformed red blood cell.
The shaded regions in
Figure 3 show the variations in the numerical results which arise from the mesh representation of red blood cell not being completely symmetrical when sliced along the two larger axes, leading to small oscillations of these axes due to the immersed boundary method as tank-threading motion of the RBC occurs. The deformation index that is found for both simulations seems to agree with the experimental results. In line with our expectations, the viscosity contrast affects the predictions of the deformation index more as the shear rates are increasing.
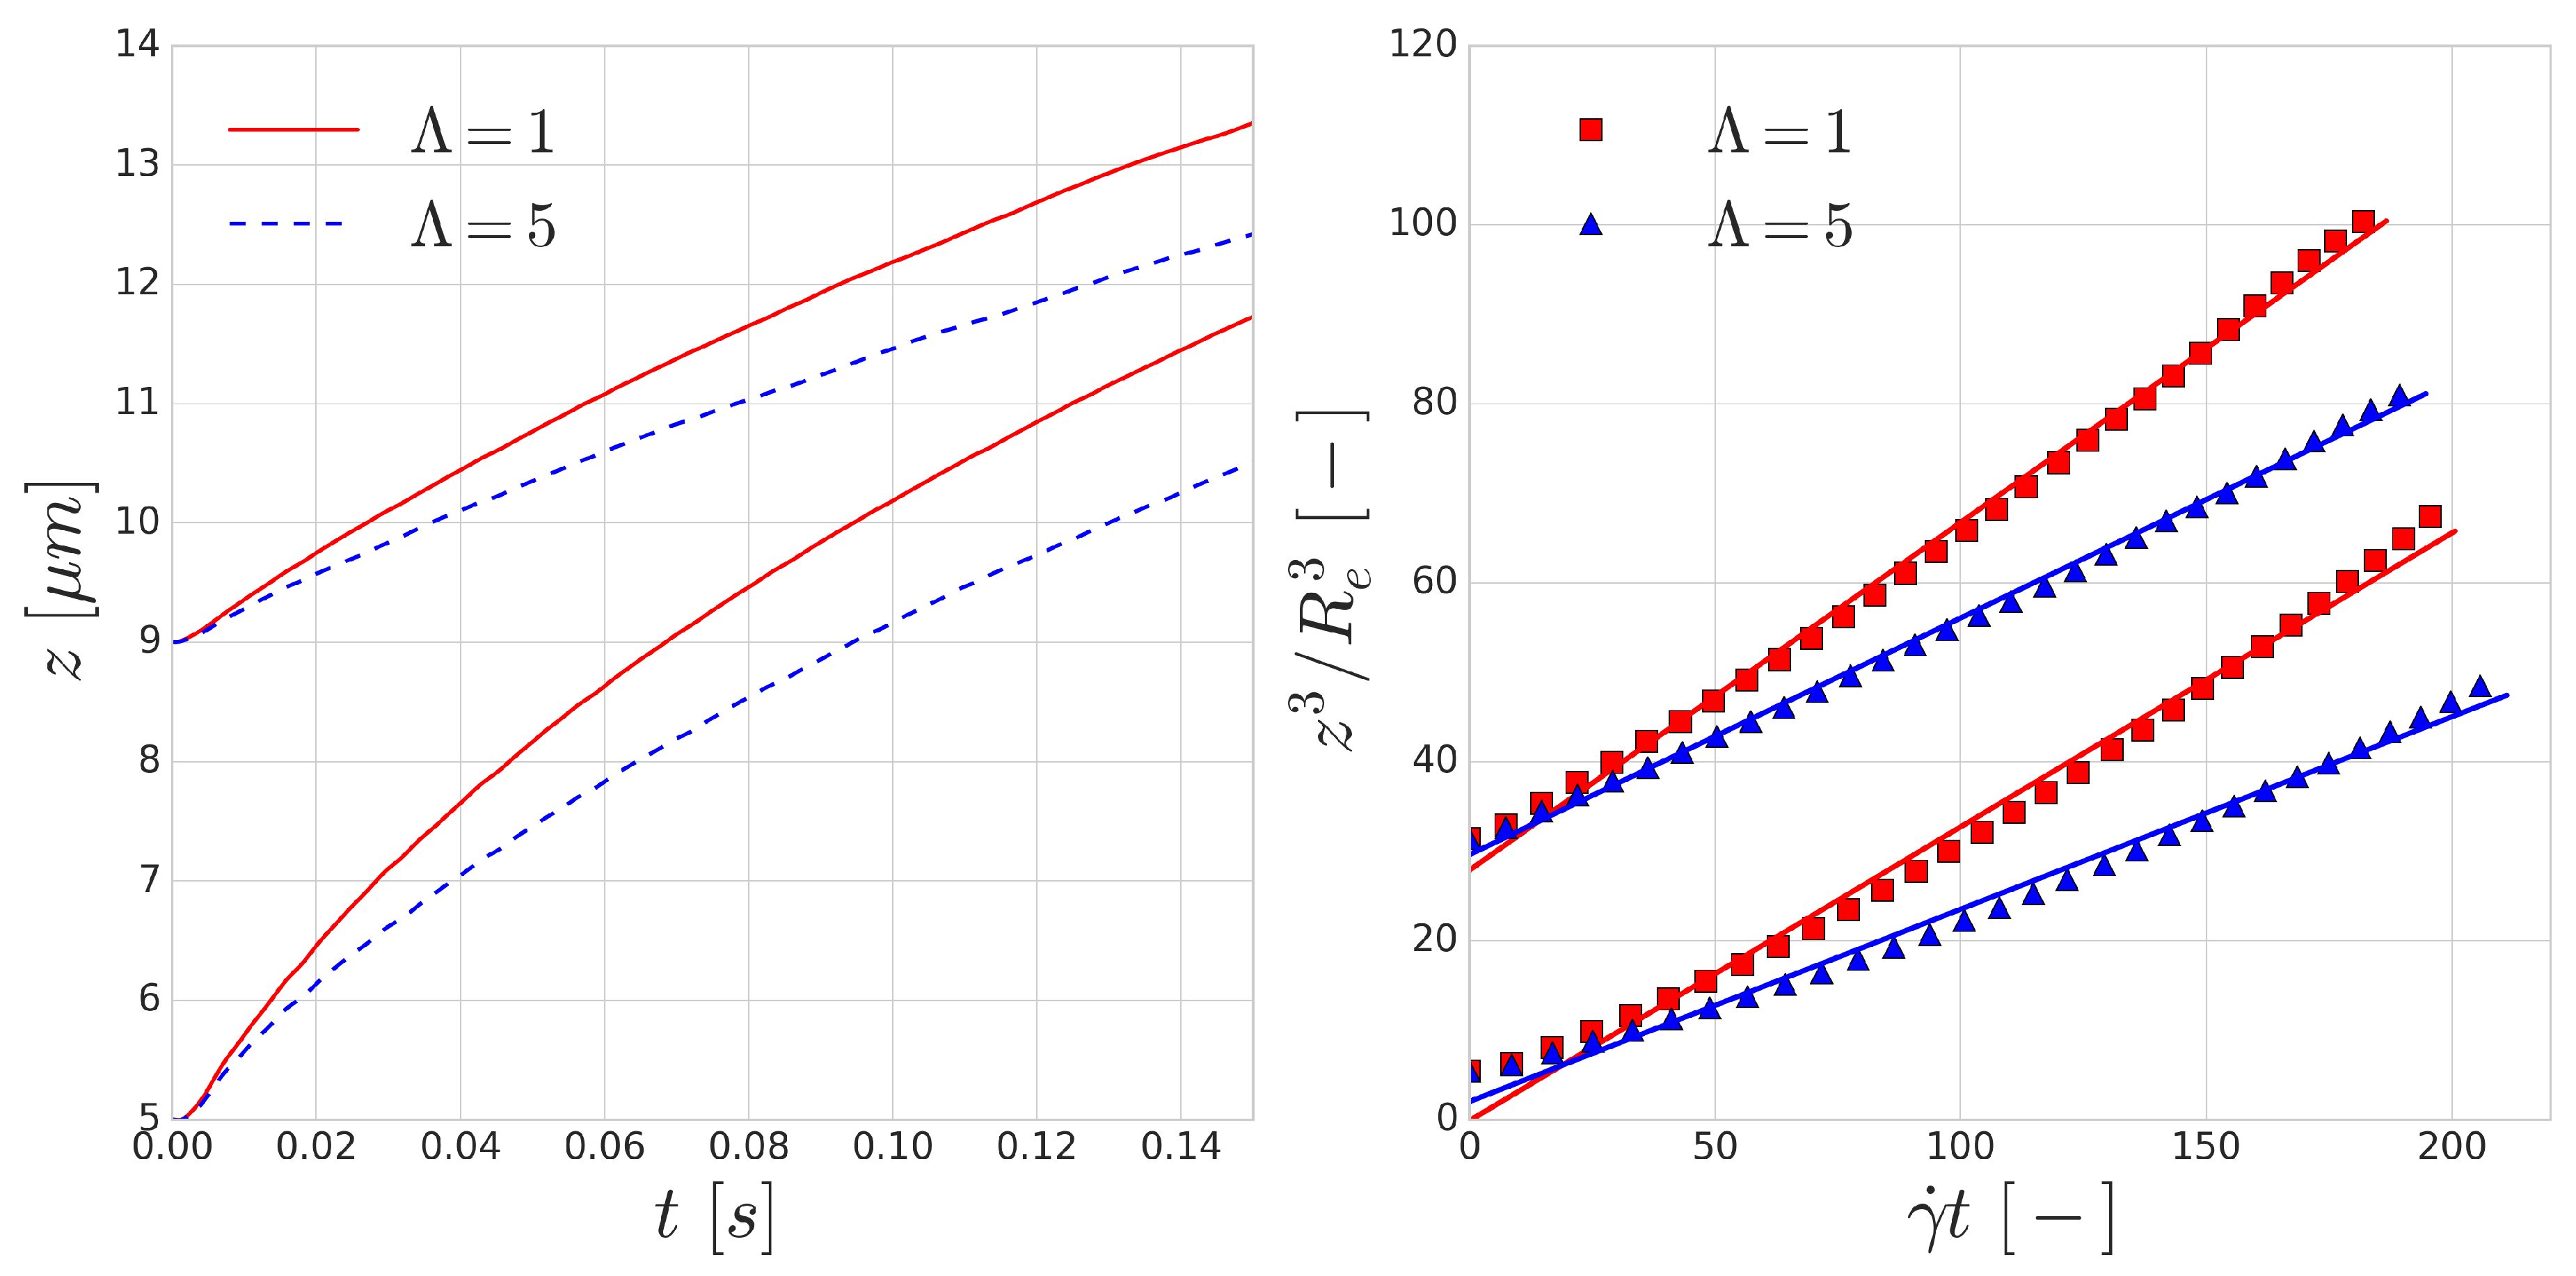
3.2. Cross-Stream Migration in Straight Circular Channel Flow
In low Reynolds number flows, the migration of spherical particles transversally to the flow direction is not possible due to the linearity and time-reversal symmetry of Stokes’s equations [
47]. Deformable particles such as RBCs in flow might, however, break the symmetry and experience such a transverse migration [
48]. The migration velocity away from the wall for non-spherical tank-treading vesicles was theoretically predicted by Olla in [
49] to obey:
where
z is the distance from the wall,
U is the dimensionless drift velocity which is dependent on the vesicle shape and the viscosity contrast with the external fluid, and
is the reduced radius of the particle (that is,
equals the RBC volume). From this, the scaling of the vesicle distance from the wall can be integrated as given by Grandchamp et al. [
48]:
We investigated the transverse migration of a RBC in Poiseuille flow, similar to the work of Coupier et al. [
50], in a periodic channel with a diameter of 70
m and a Reynolds number of
. In this channel flow, a single RBC is placed with a distance
from the channel wall. The simulation is then performed for two
starting distances from the wall, with and without the internal viscosity contrast. As the velocity profile in this case is almost fully parabolic, the shear rate is given by [
51]:
where
is the dynamic viscosity and
R is the radius of the channel.
The trajectories of the RBCs are shown in the left image of
Figure 4. According to Equation (
4), the dimensionless lift velocity
U can be found as the slope of the line fitted to the data points in the right image of
Figure 4.
Table 1 shows the results of the fitting procedure.
The fits using Equation (
4) all have
and the resulting dimensionless lift velocities (
U) are in the same order as the values reported by the experiments [
48,
49]. The resulting lift is lower on the RBCs with the increased viscosity contrast of
, which can be explained by the longer deformation time-scale of these cells. Since all RBCs are immersed in the flow in their equilibrium shape, local deformation time-scales play a significant role in the magnitude of the appearing lift force. The curves corresponding to
overestimate the lift velocity, however, the
cases are close to the value reported by the experiments for RBC sized vesicles (
m).
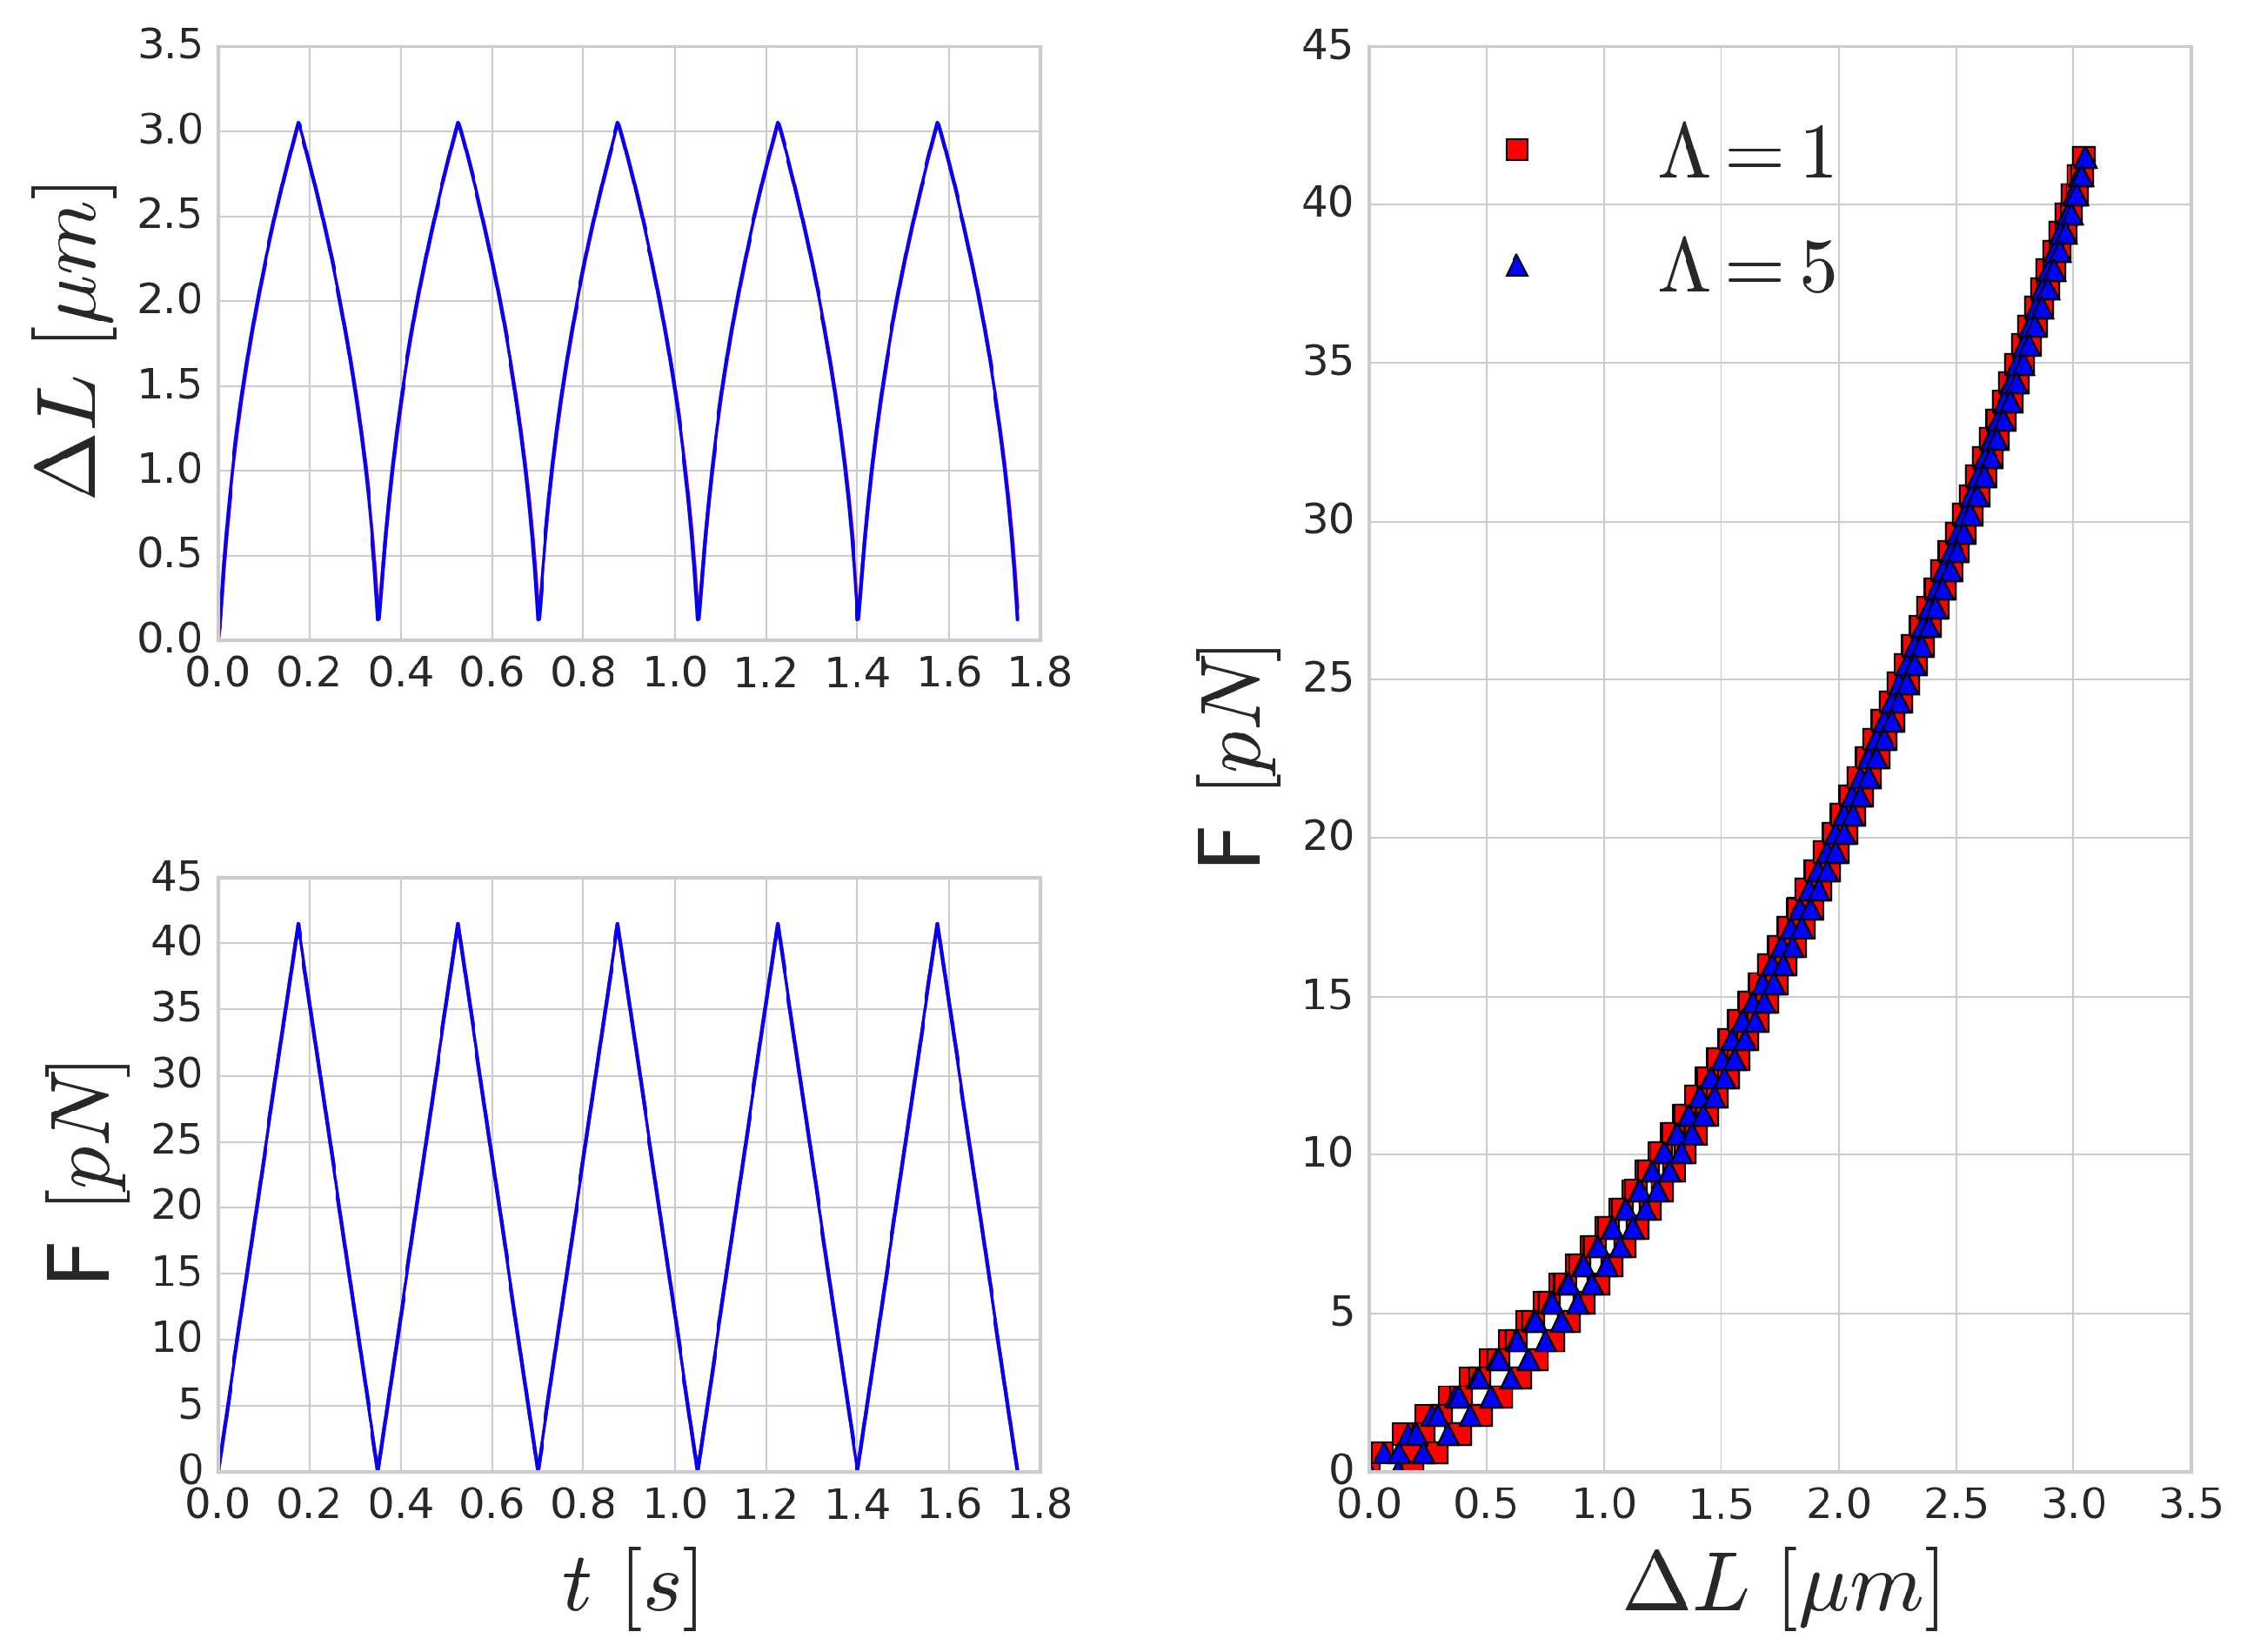
3.3. Periodic Cell Stretching
A possible way to measure the characteristic time-scale of deformation for a RBC is by investigating the mechanical response of the RBC to a periodically varying force. A similar investigation was carried out by Yoon et al. [
52] in optical-tweezers experiments. They attached silica beads to the opposing ends of the long axis of the RBC. One of these beads is kept stationary, whilst the other bead is moved with a constant velocity farther and then back. In our setup, we applied a periodic sawtooth-like force function over time (see
Figure 5). We matched the magnitude of the force to the values reported in [
52]. To imitate the attachment surface of the silica beads, the forcing was applied on five per cent of the membrane area on opposing ends of the RBC.
Figure 5 shows the mechanical response of an RBC to the periodic stretching. There is a good qualitative agreement in the behaviour, however, the quantitative characteristic time-scale of the results are significantly different from those reported by Yoon et al. [
52] since they prescribed the movement and inferred the forces from the deformation of the beads. In our case, the magnitude of the stretching force is prescribed and we measure the deformation versus time. A similar hysteresis loop is present, as can be seen in the right side of
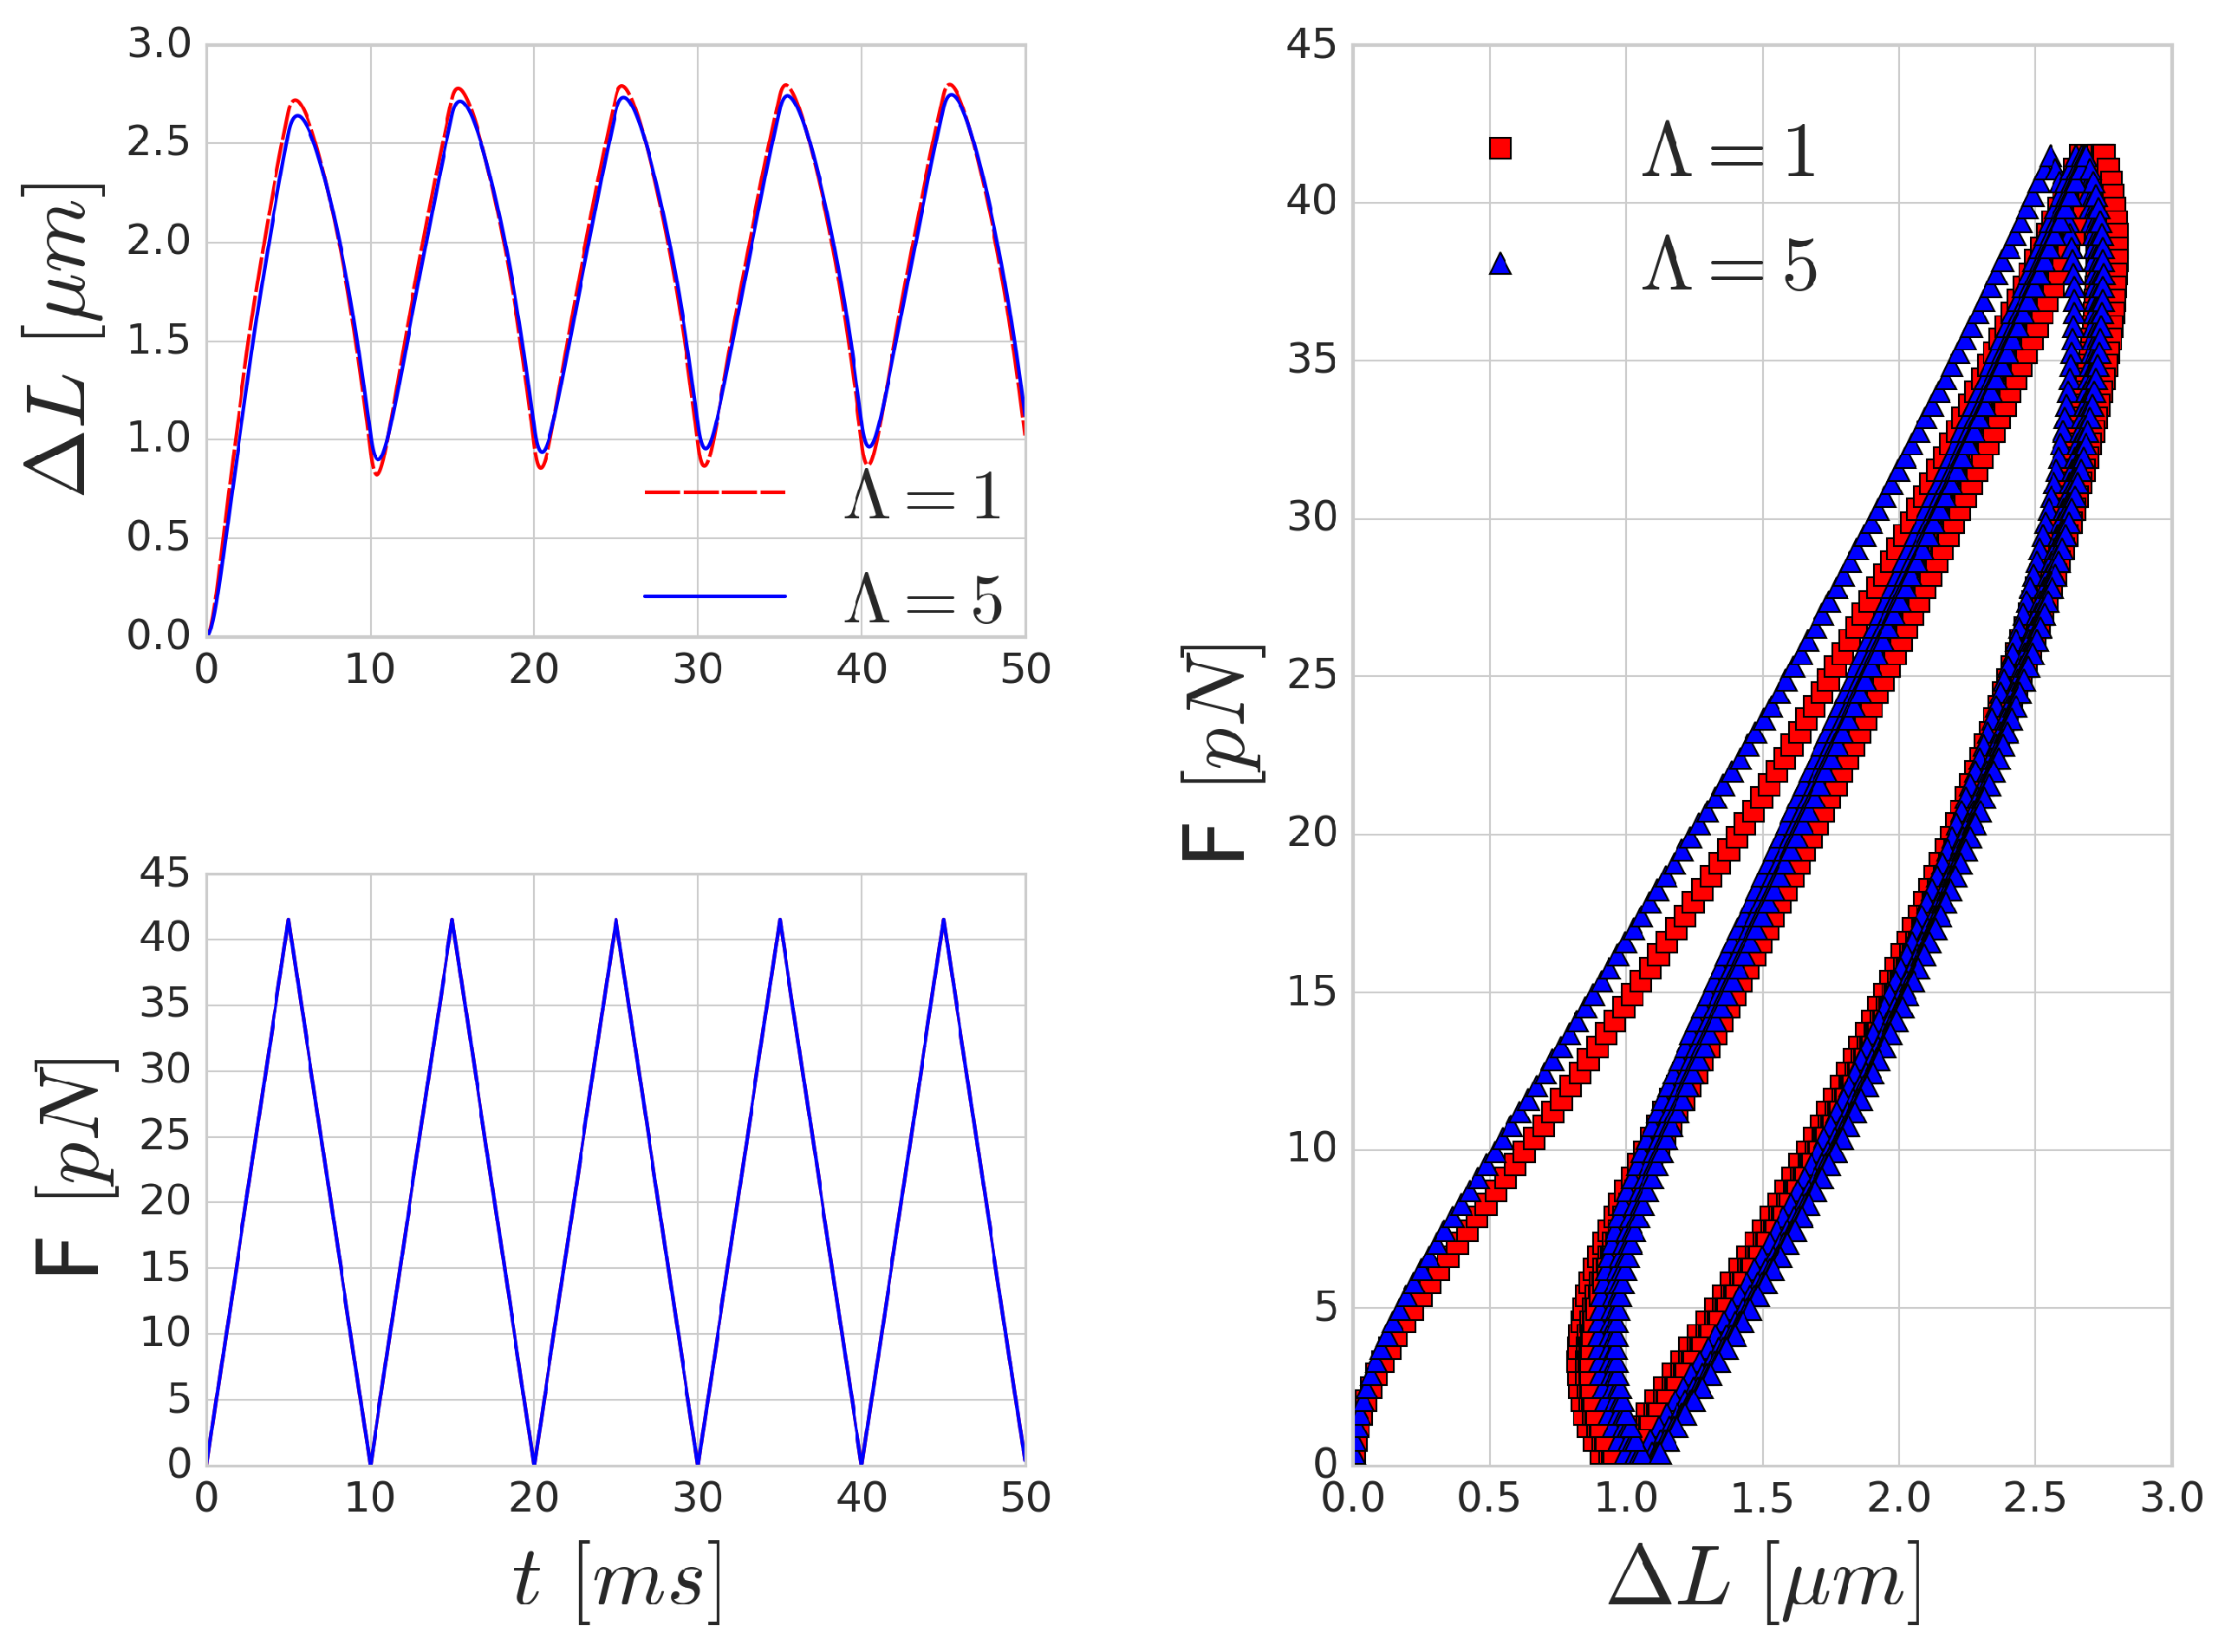
Figure 5, though the shape and the magnitude of the elongation (as expected) do not reproduce the experimental results. With the increase of the frequency of the forcing, the viscous effects are increasing as well and the hysteresis loop is widening, as depicted in
Figure 6.
Mechanical effects that can contribute to such a loop might originate from inertial fluid effects or the viscoelastic behaviour of the cell. For high frequency forcing, the pure inertial effects of the fluid might play a role, however, the stretchings in
Figure 5 were done with low velocity (on the time-scale of 0.35 s), which resulted in viscosity dominated Stokes flow around the cell membrane. This is also supported by the observation that the increased inner viscosity had little effect and produced almost the same curve in
Figure 5 as the case with
. Therefore, the viscous effects on deformations on the time-scale of several hundreds of milliseconds are governed by the membrane viscosity rather than the internal cytoplasmic viscosity. In
Figure 6, the period of the stretching cycle is closer to the typical time-scales arising during cell-cell collisions and the two curves (
and 5) are starting to deviate. This effect strengthens as the frequency of the forcing period increases.
3.4. Platelet-RBC Collisions
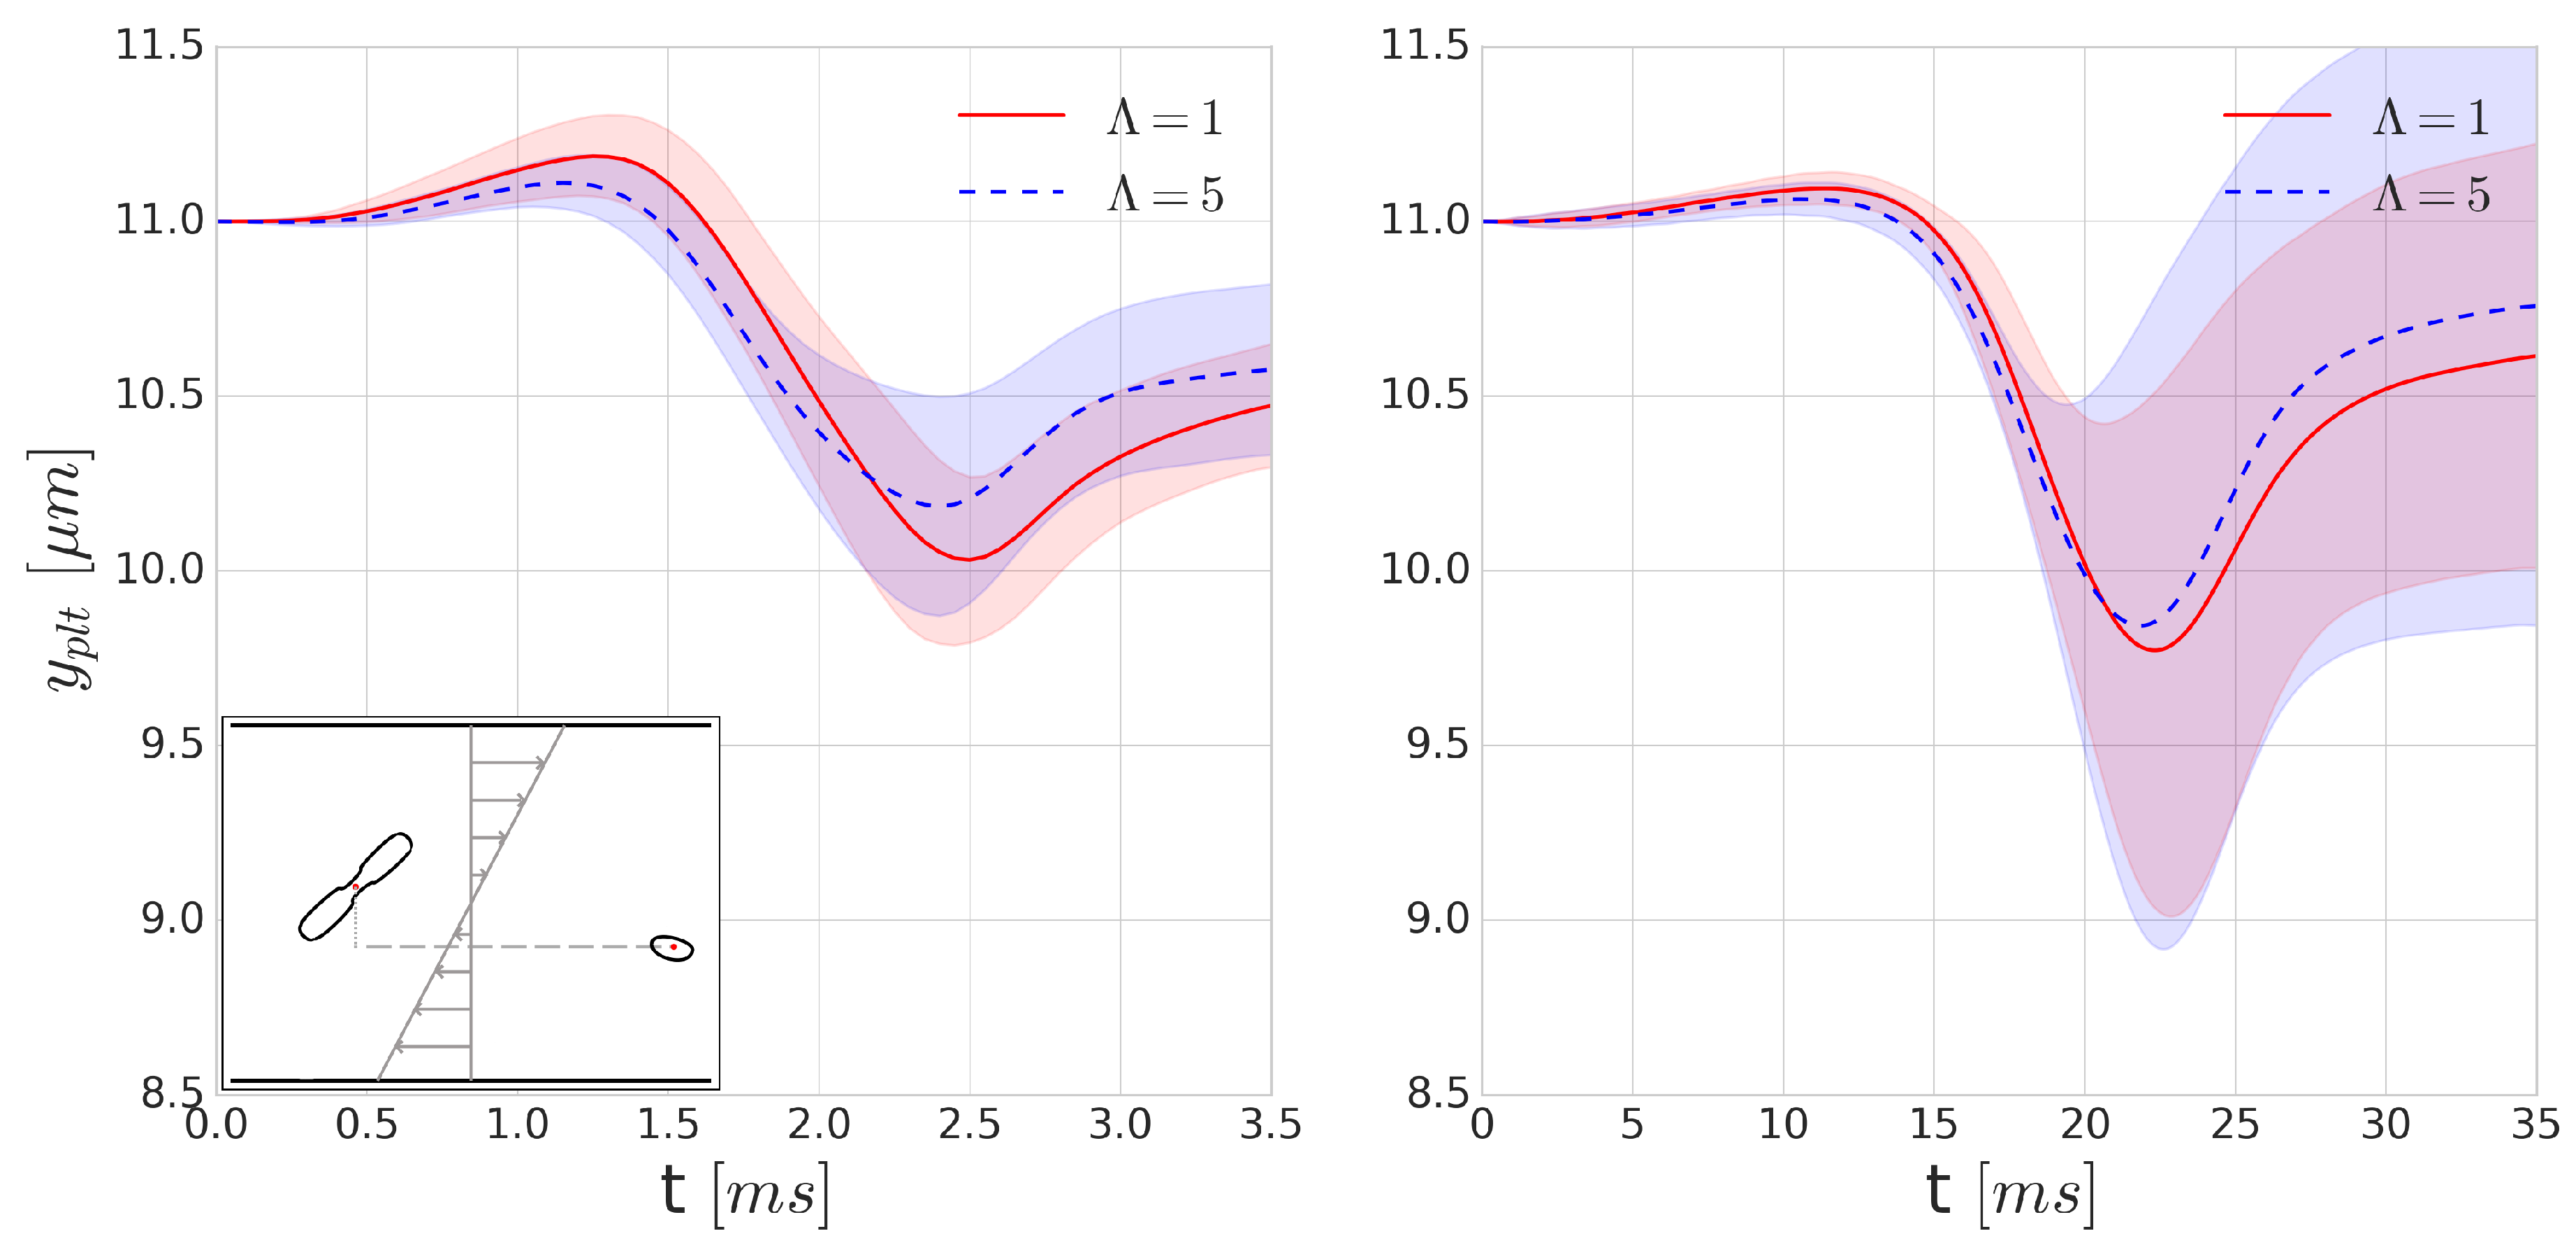
In physiological blood flows, due to the non-zero shear rate, cells collide with each other, resulting in displacements. In particular, these repeated collisions create a shear dependent diffusivity and influence the distribution of the cells. This effect spans from affecting the haematocrit distribution to creating phenomena such as platelet margination. In the latter, the collision between a platelet and an RBC creates displacement in the platelet trajectory.
Since collisions typically happen on a ms time-scale, they might be significantly influenced by the increase of inner cytoplasmic viscosity. To investigate the effects of such viscosity contrast on platelet trajectories during a collision, we positioned a RBC and platelet 16 m apart in Couette flow where the distance between the centre points of the particles perpendicular to the shear plane (denoted y direction) is m. Each of the simulations is performed with and without the cytoplasmic viscosity contrast for the internal fluid of the RBC at shear rates of 400 s and 4000 s. As the orientation angle of the RBC and platelet can vary in blood flow, we performed each simulation 16 times, varying the starting orientation of the platelet and the RBC with respect to each other in each simulation to sample the possible orientations, after which the results of these simulations were averaged.
Figure 7 shows the average displacement of the cell centre of a platelet in the
y-direction after a single collision. Due to the asymmetry of the cells and the deformability of the RBC, this flow is not reversible. According to our expectations, we can see a higher displacement in the platelet trajectories for the
cases. This is due to the short (few milliseconds) time-scale of the collisions where the viscous effects can significantly modify the deformability. The symmetry breaking is higher in the case of higher deformability, which corresponds to the cases with no viscosity contrast. This also implies that the application of cytoplasmic viscosity contrast might influence (i.e., decrease) the shear-induced diffusivity and the intensity of the margination of platelets.
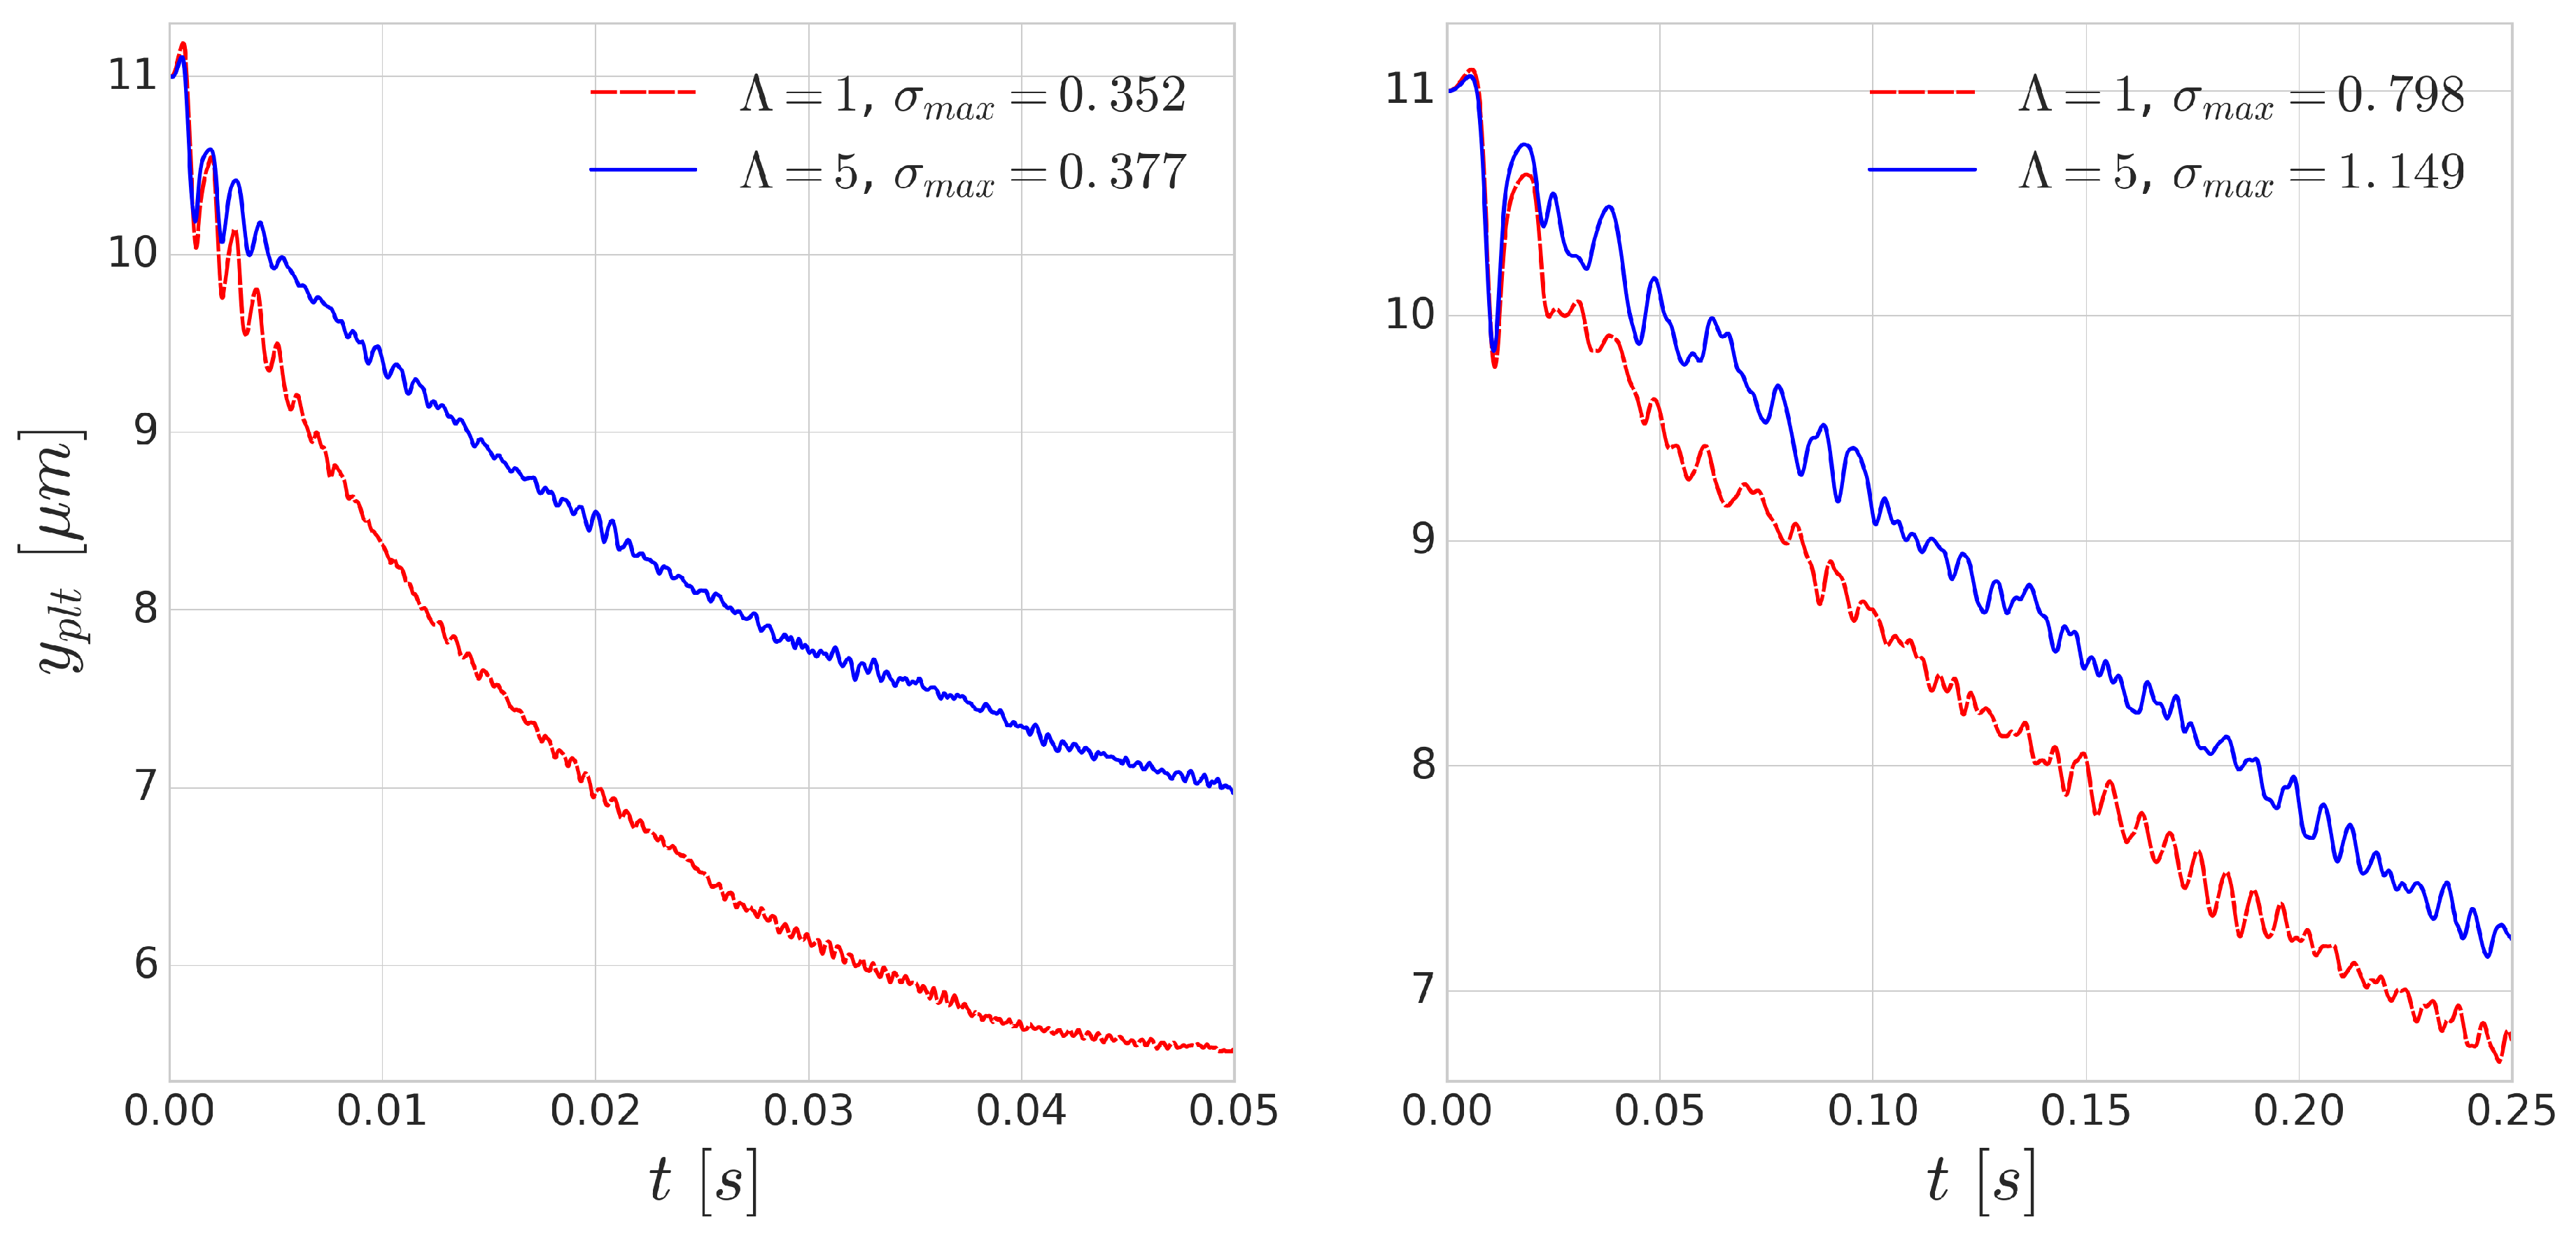
Using periodic boundary conditions, we also simulate continuous subsequent collisions. The results of these repeated collisions are shown in
Figure 8. The effect of added viscosity contrast accumulates over the repeated collisions and produces significantly smaller displacements. This effect is more notable for the simulations of higher shear rate
s
where the deformations are faster as the collisions happen on a shorter time scale. This indicates that taking inner viscosity into account is important for high shear-rate cases.
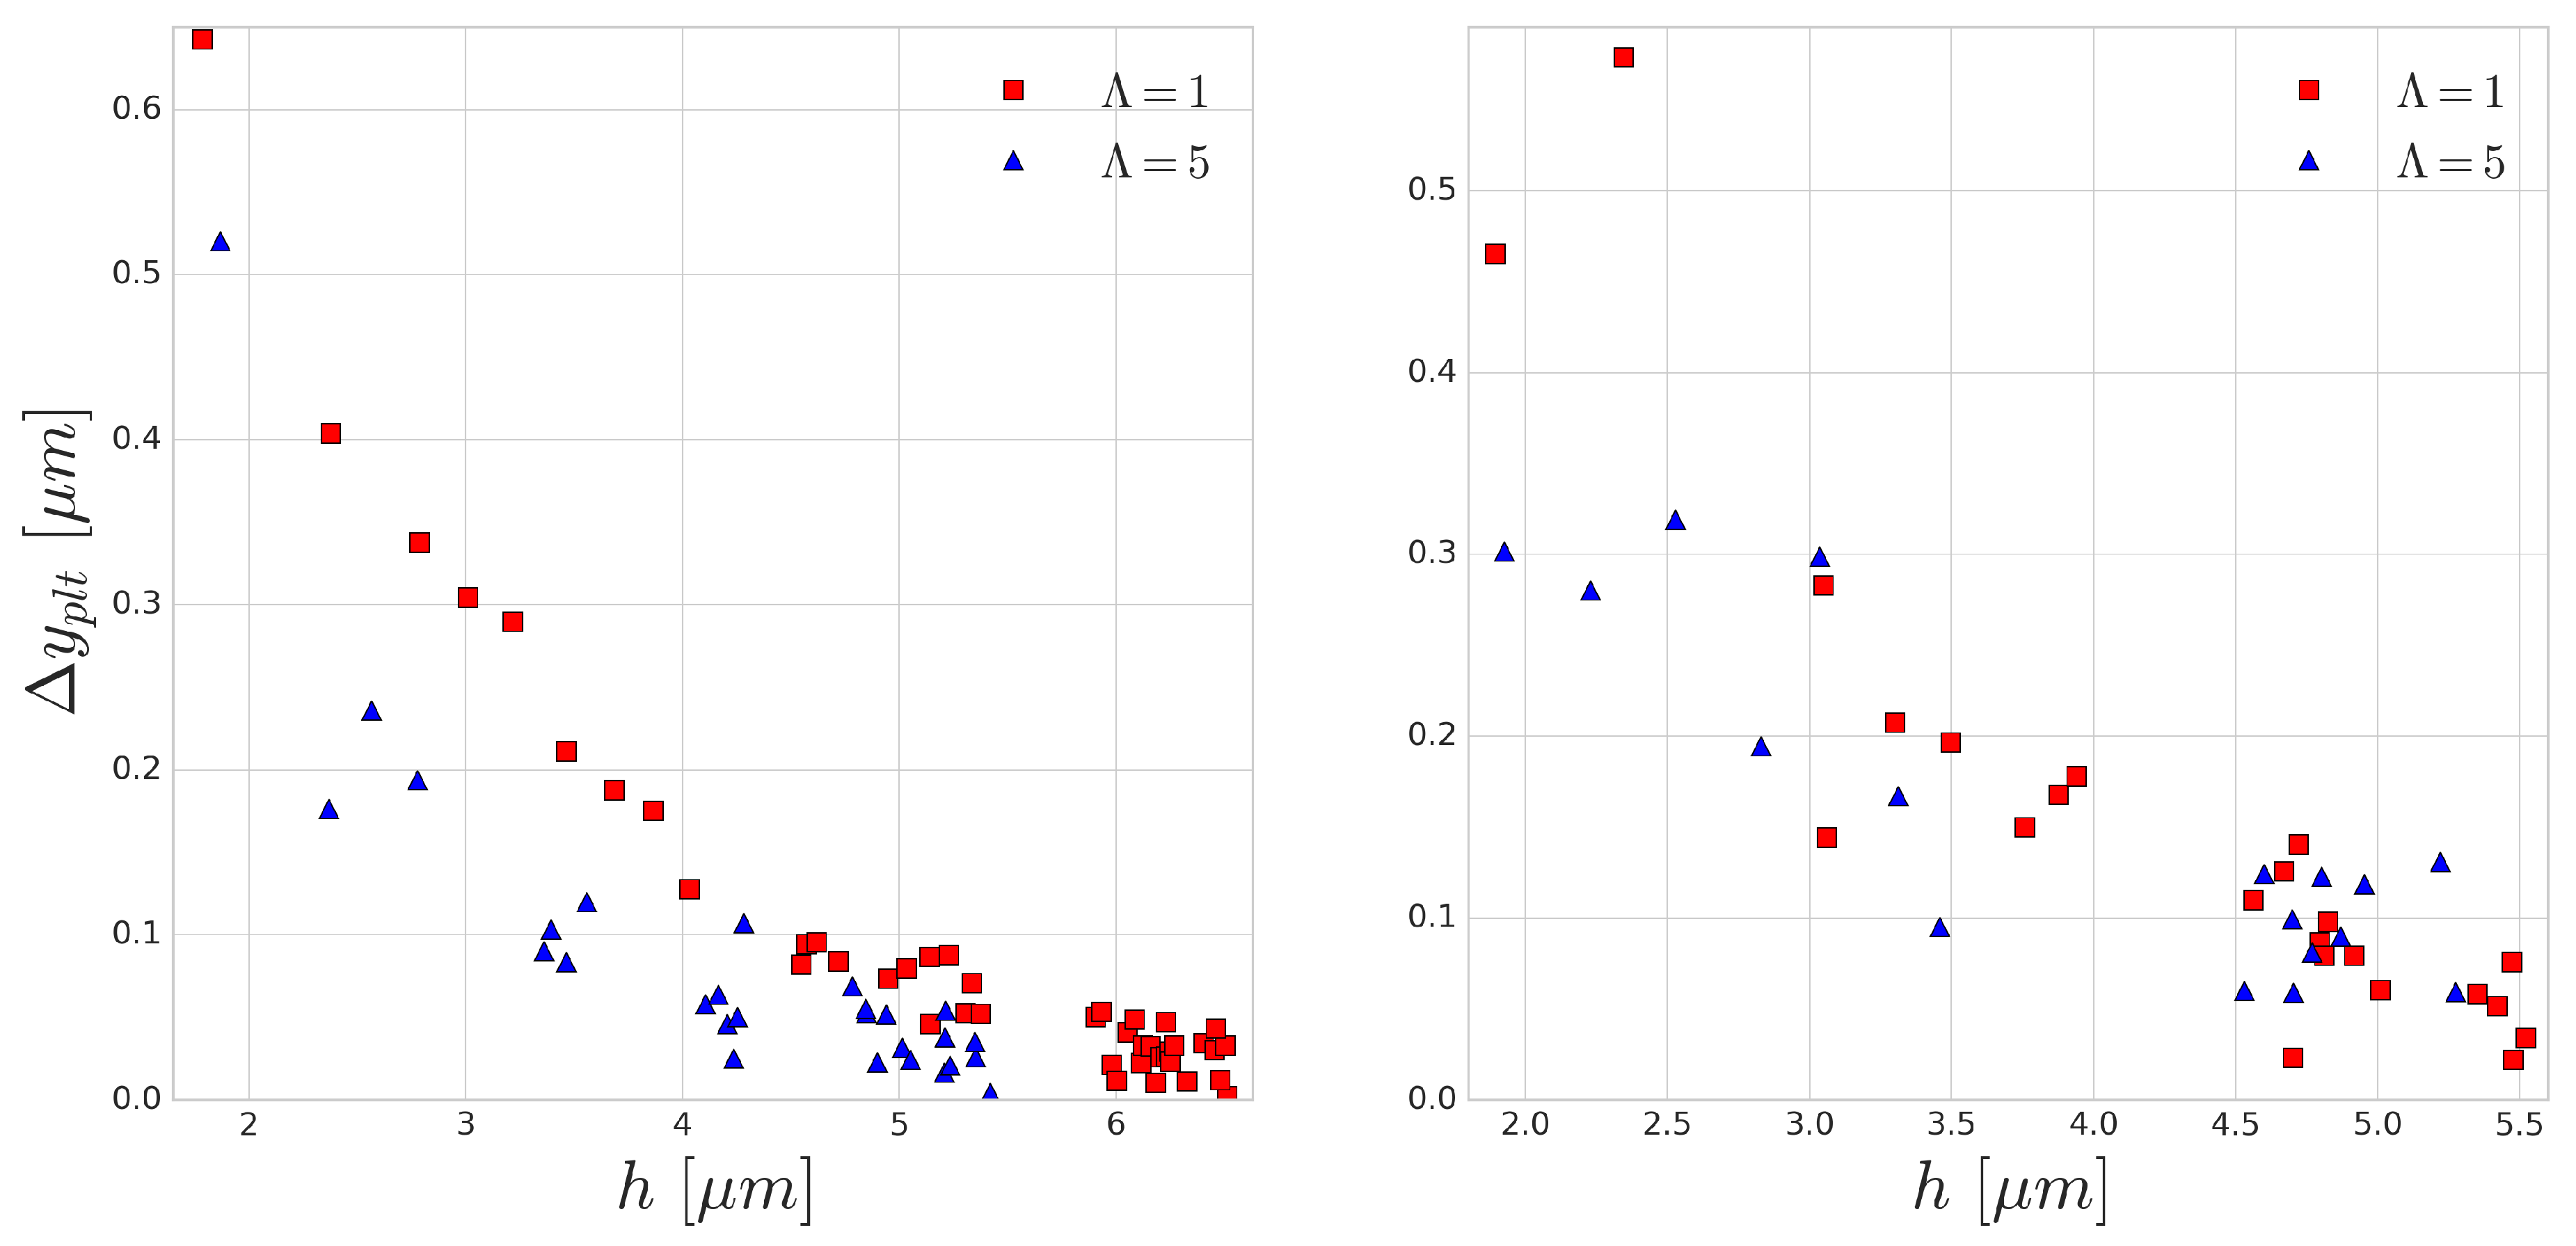
As the distance between the cells grow after each subsequent collision event, in this periodic setup, the effect of the collision distance
h can be depicted. The platelet displacements after every collision are shown in
Figure 9. In accordance with the previous results, the larger difference corresponds to the smaller incoming collision distance which also translates to larger RBC deformation during the collision. A similar curve was reported in the experimental work of Gires et al. [
53], however, contrary to our results, they found no significant difference due to the viscosity contrast. The most probable reason for this is the much lower shear rates (1–40 s
) in their experiments. In our simulations, the
s
case (right side of
Figure 9) already displays much less difference than the higher
s
case (left side of
Figure 9). This again emphasises the importance of time-scales in cell-cell collisions and suggests that cytoplasmic viscosity is more important in high shear rate flows where the cell interaction times are shorter and the occurring deformations are faster.
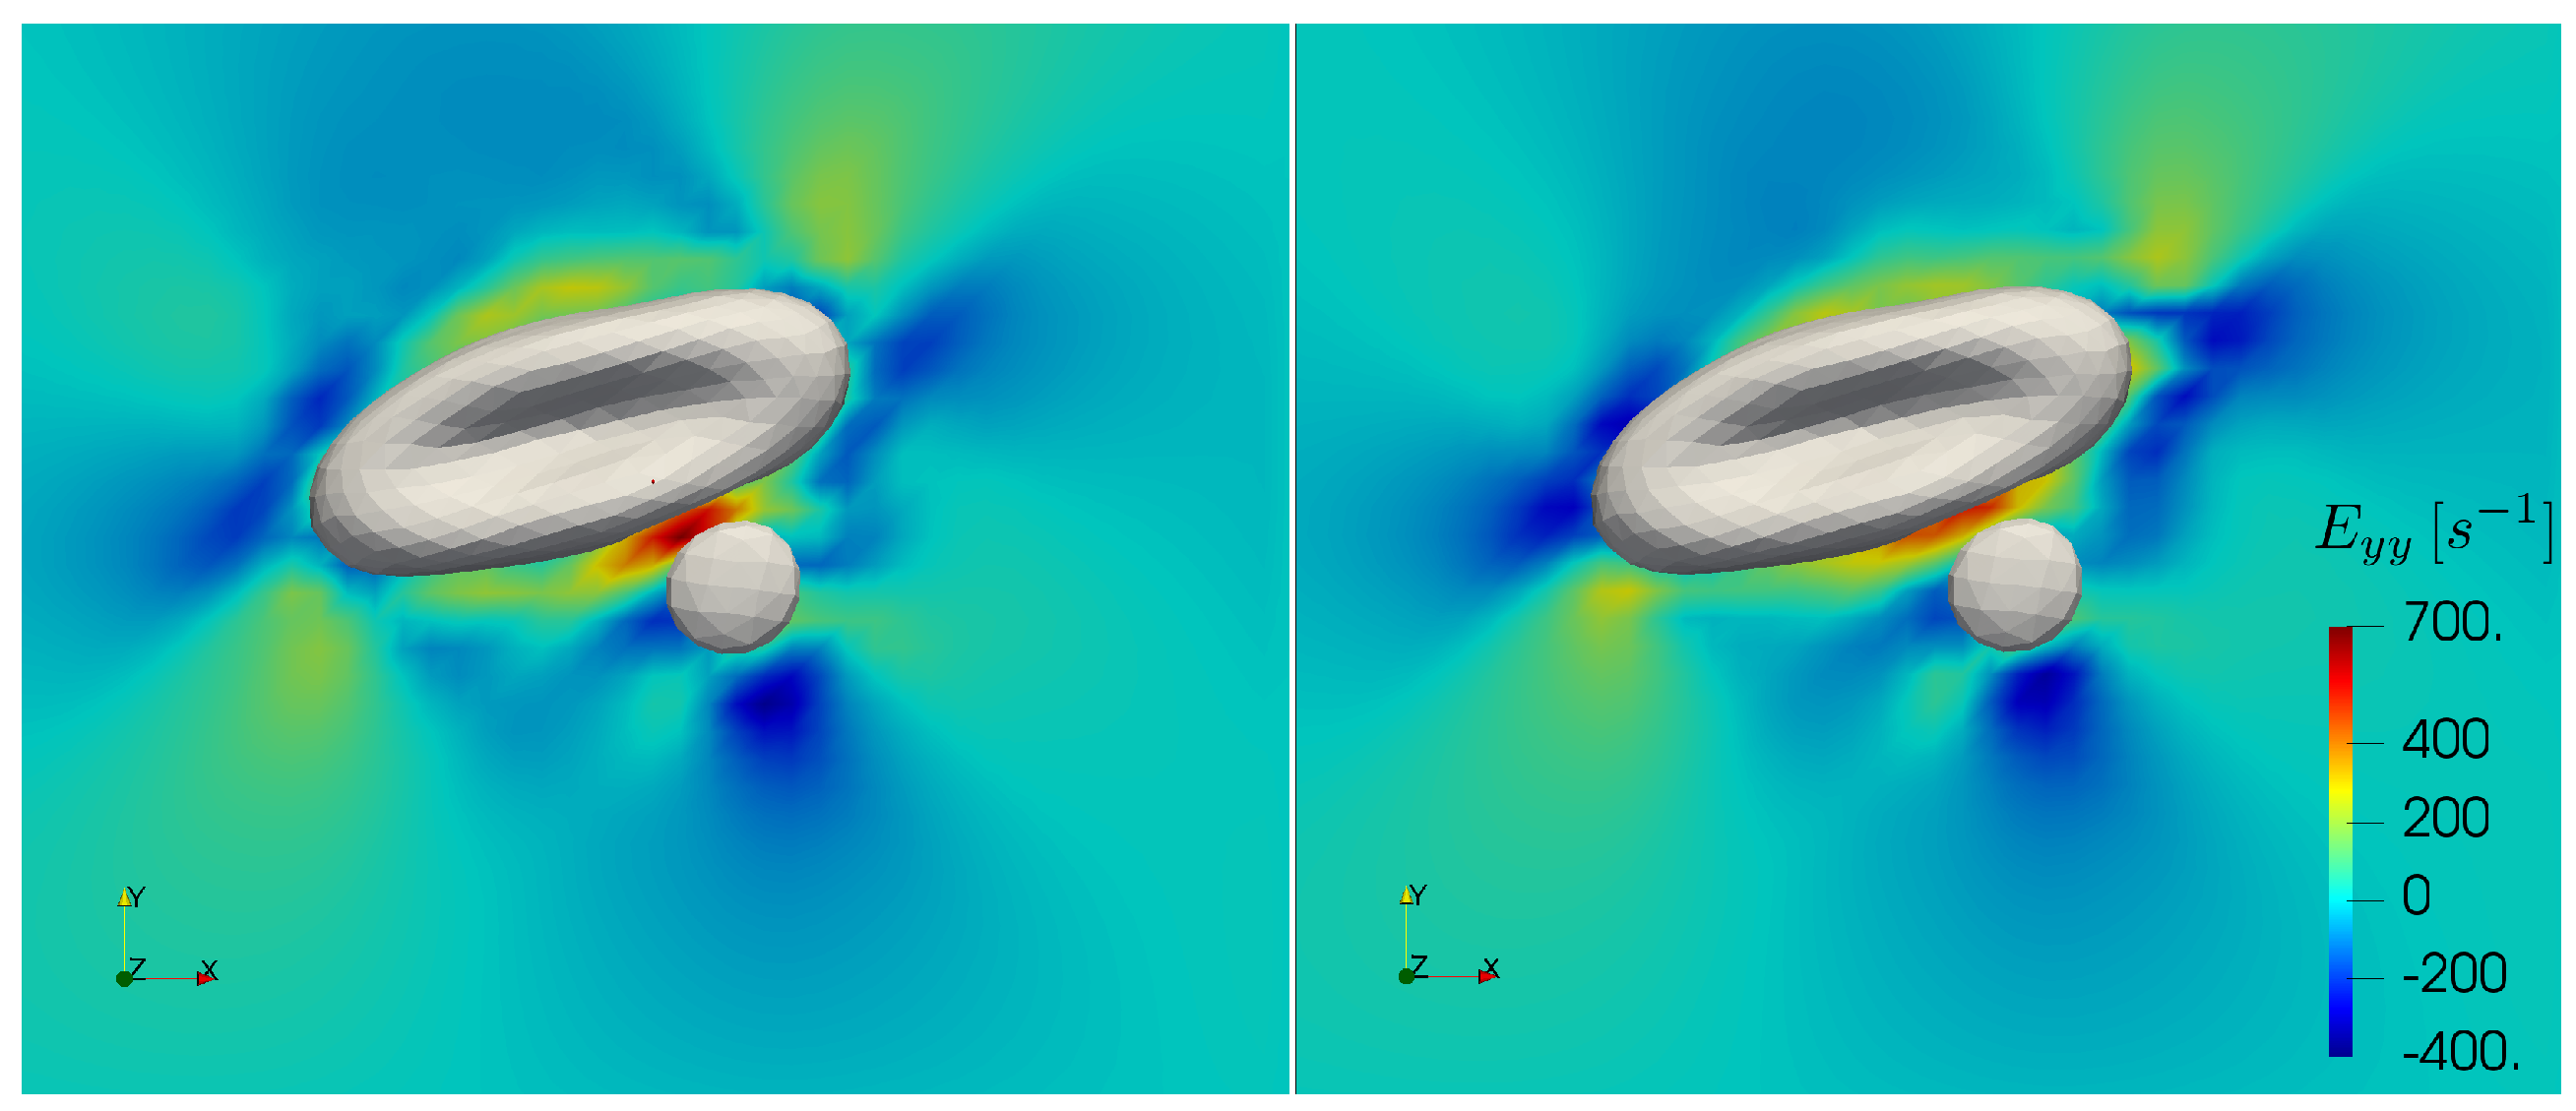
Furthermore, recent experiments [
54] suggest that blood plasma can display viscoelastic behaviour under strong elongational deformation. The elastic forces arising under such conditions might have effect on the motion of the cells during collision events [
55]. Varchanis et al. predicted that strain hardening in human blood plasma starts at about 550 s
elongational rate and leads to several orders of magnitude jump in elongational viscosity [
56]. The largest elongational rates in this work appear at the high shear cell-cell collisions simulations. In
Figure 10, we depict the largest elongational component of the rate of strain tensor during a collision with and without increased cytoplasmic viscosity at the bulk shear rate of 1000 s
. In the case of added viscosity contrast, the elongational rate can surpass the threshold in the gap between the cells. This concerns the high shear rate cell-cell collision computations. While in the current work blood plasma is treated as a Newtonian fluid, these cases may require future investigations on the specific effects of strain hardening. Note that the computations in the further sections do not present elongational rates above the threshold.
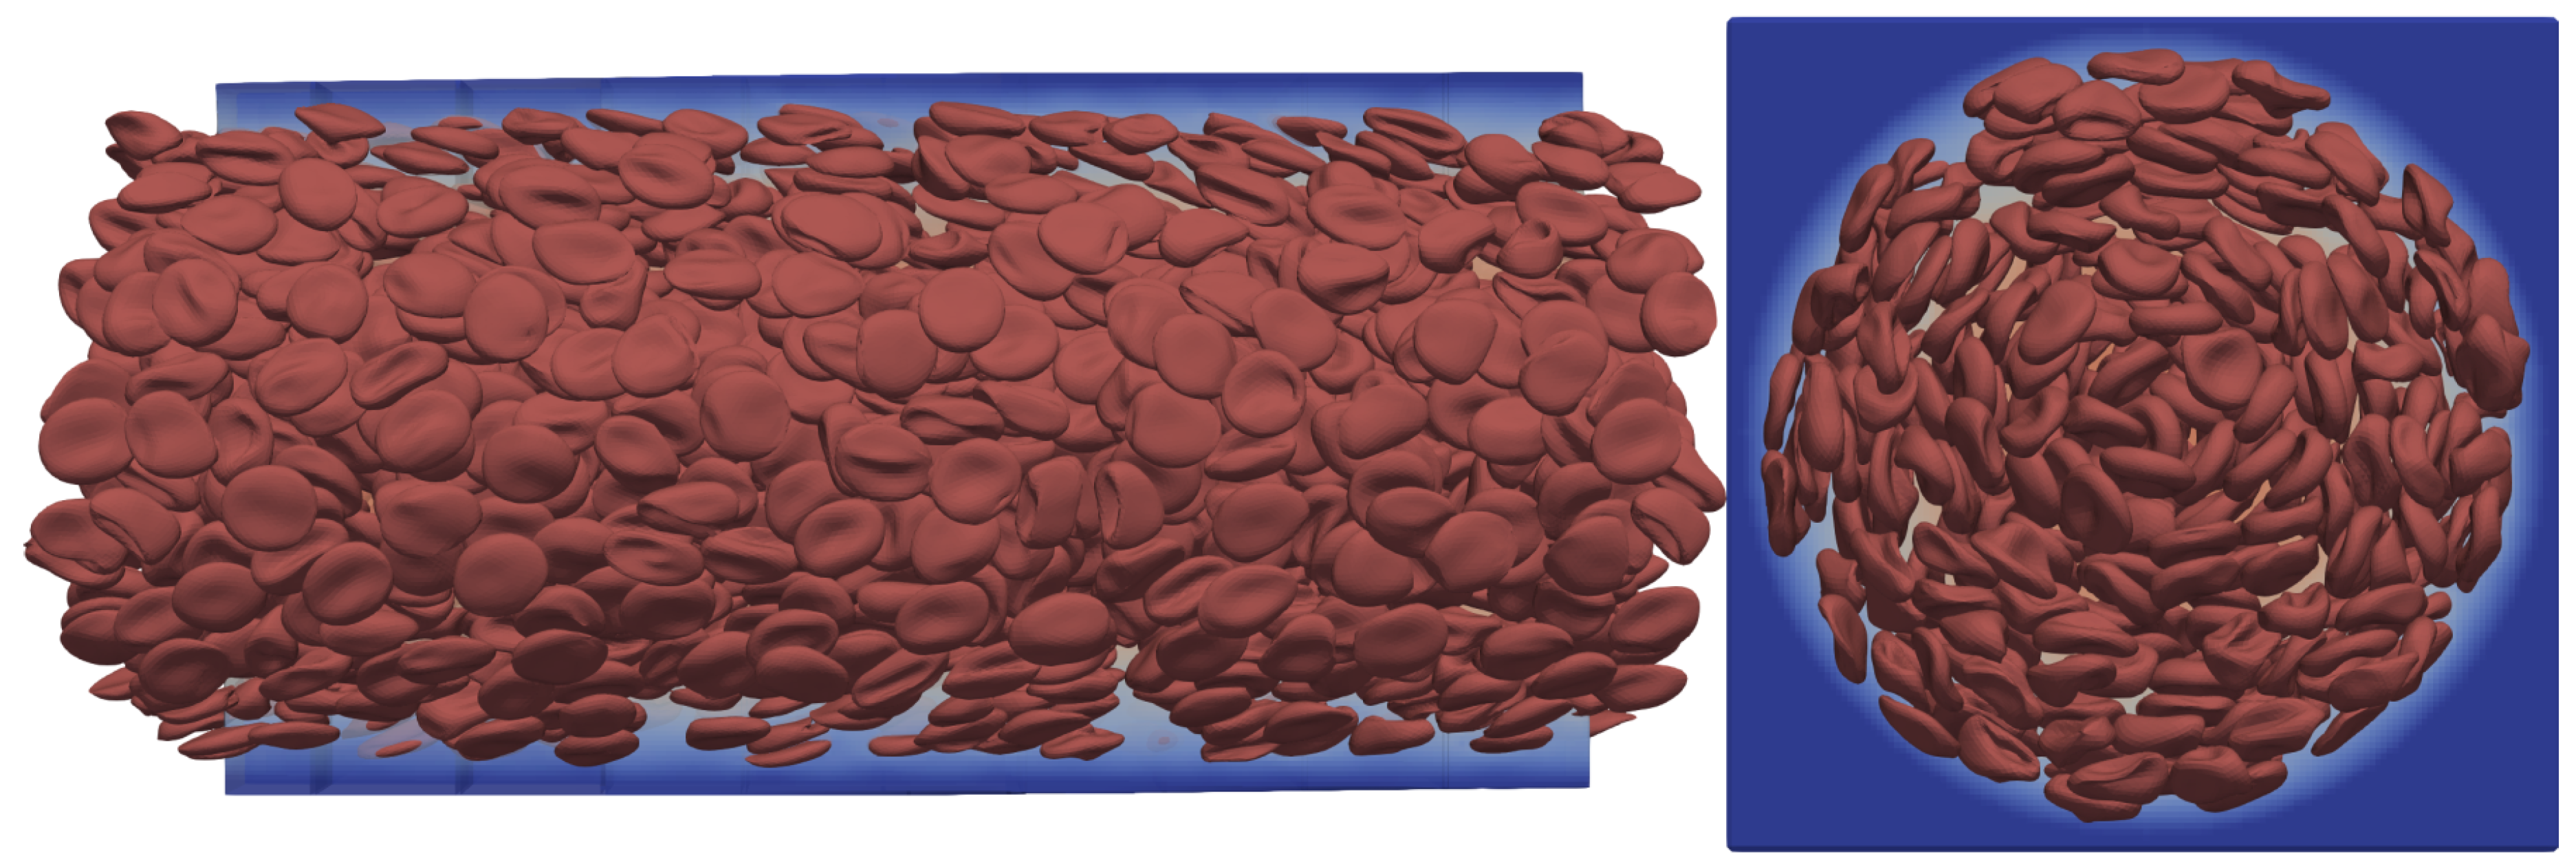
3.5. Many-Cell Experiments
Many-cell cases are employed to simulate the collective transport dynamics of blood in vessel-like structures. The verification of the added viscosity contrast to the HemoCell framework consists of simulations with a large number of RBCs in a straight circular channel flow where the channel has a diameter of 70
m and a length of 140
m. The openings of the channel are periodic and the flow is driven by body force. For an overview of the simulation setup see
Figure 11.
Generating the homogeneous random initial positions of RBCs is done using a short kinetic simulation of enclosing ellipsoids which is described in [
25]. With this method, we generated three different initial configurations of RBCs. These configurations differ in haematocrit, with
,
and
. The only present cells are the RBCs as they dictate the bulk mechanical behaviour of blood flows and the simulations are performed with and without the internal viscosity contrast and for
and
.
The first fundamental transport property that is investigated is the relative apparent viscosity of the vessel section. Pries et al. [
12] collected the available experimental data and derived an empirical formula for the relative apparent viscosity of blood with respect to the pipe diameter for different haematocrit values. We measured the relative apparent viscosity,
, by finding the ratio between the observed average fluid velocity and the theoretical average velocity of Poiseuille flow based on the driving body force:
where
is the theoretical average velocity of the channel flow of pure plasma and no cells and
is the average velocity of the channel flows with RBCs using the same driving body force.
The top left and bottom images in
Figure 12 show that the differences in
that are introduced by the viscosity contrast are larger when the average flow velocity is increased. This is caused by the higher shear rates which are present in these flows. They have similar effects on the bulk flow to what we observed for single cell collisions. Due to the short time scales of collisions, the increase in cytoplasmic viscosity is decreasing the deformability of the cells which results in a higher apparent viscosity. As before, this suggests a higher importance of modelling the viscosity contrast for higher shear rate flows.
As the Reynolds number is increasing, the shear rate is increasing accordingly in these simulations, which is decreasing the relative apparent viscosity of blood as it is a shear-thinning fluid. It has been captured in numerous experiments (e.g., [
57,
58]) and several empirical models have been proposed to describe this behaviour on the continuum level (such as the Carreau-Yasuda and Casson models [
59]). The top right image in
Figure 12 shows a qualitatively good agreement with the experimental results. Please note that the saturation of the relative apparent viscosity for higher Reynolds numbers is not reached in these simulations due to the numerical limitations that arise as the Reynolds number passes a certain threshold. This threshold is Re > 2.5 if
and Re > 4.8 if
, also indicating an increase in numerical stability if cytoplasmic viscosity contrast is used as the higher inner viscosity can dissipate numerical errors more effectively.
Similar to the previous findings, the difference between predictions for the relative apparent viscosity when using or for the viscosity contrast increases as the Reynolds numbers increases, indicating yet again that the viscosity contrast plays a more important role as the typical shear rates of a flow increase.
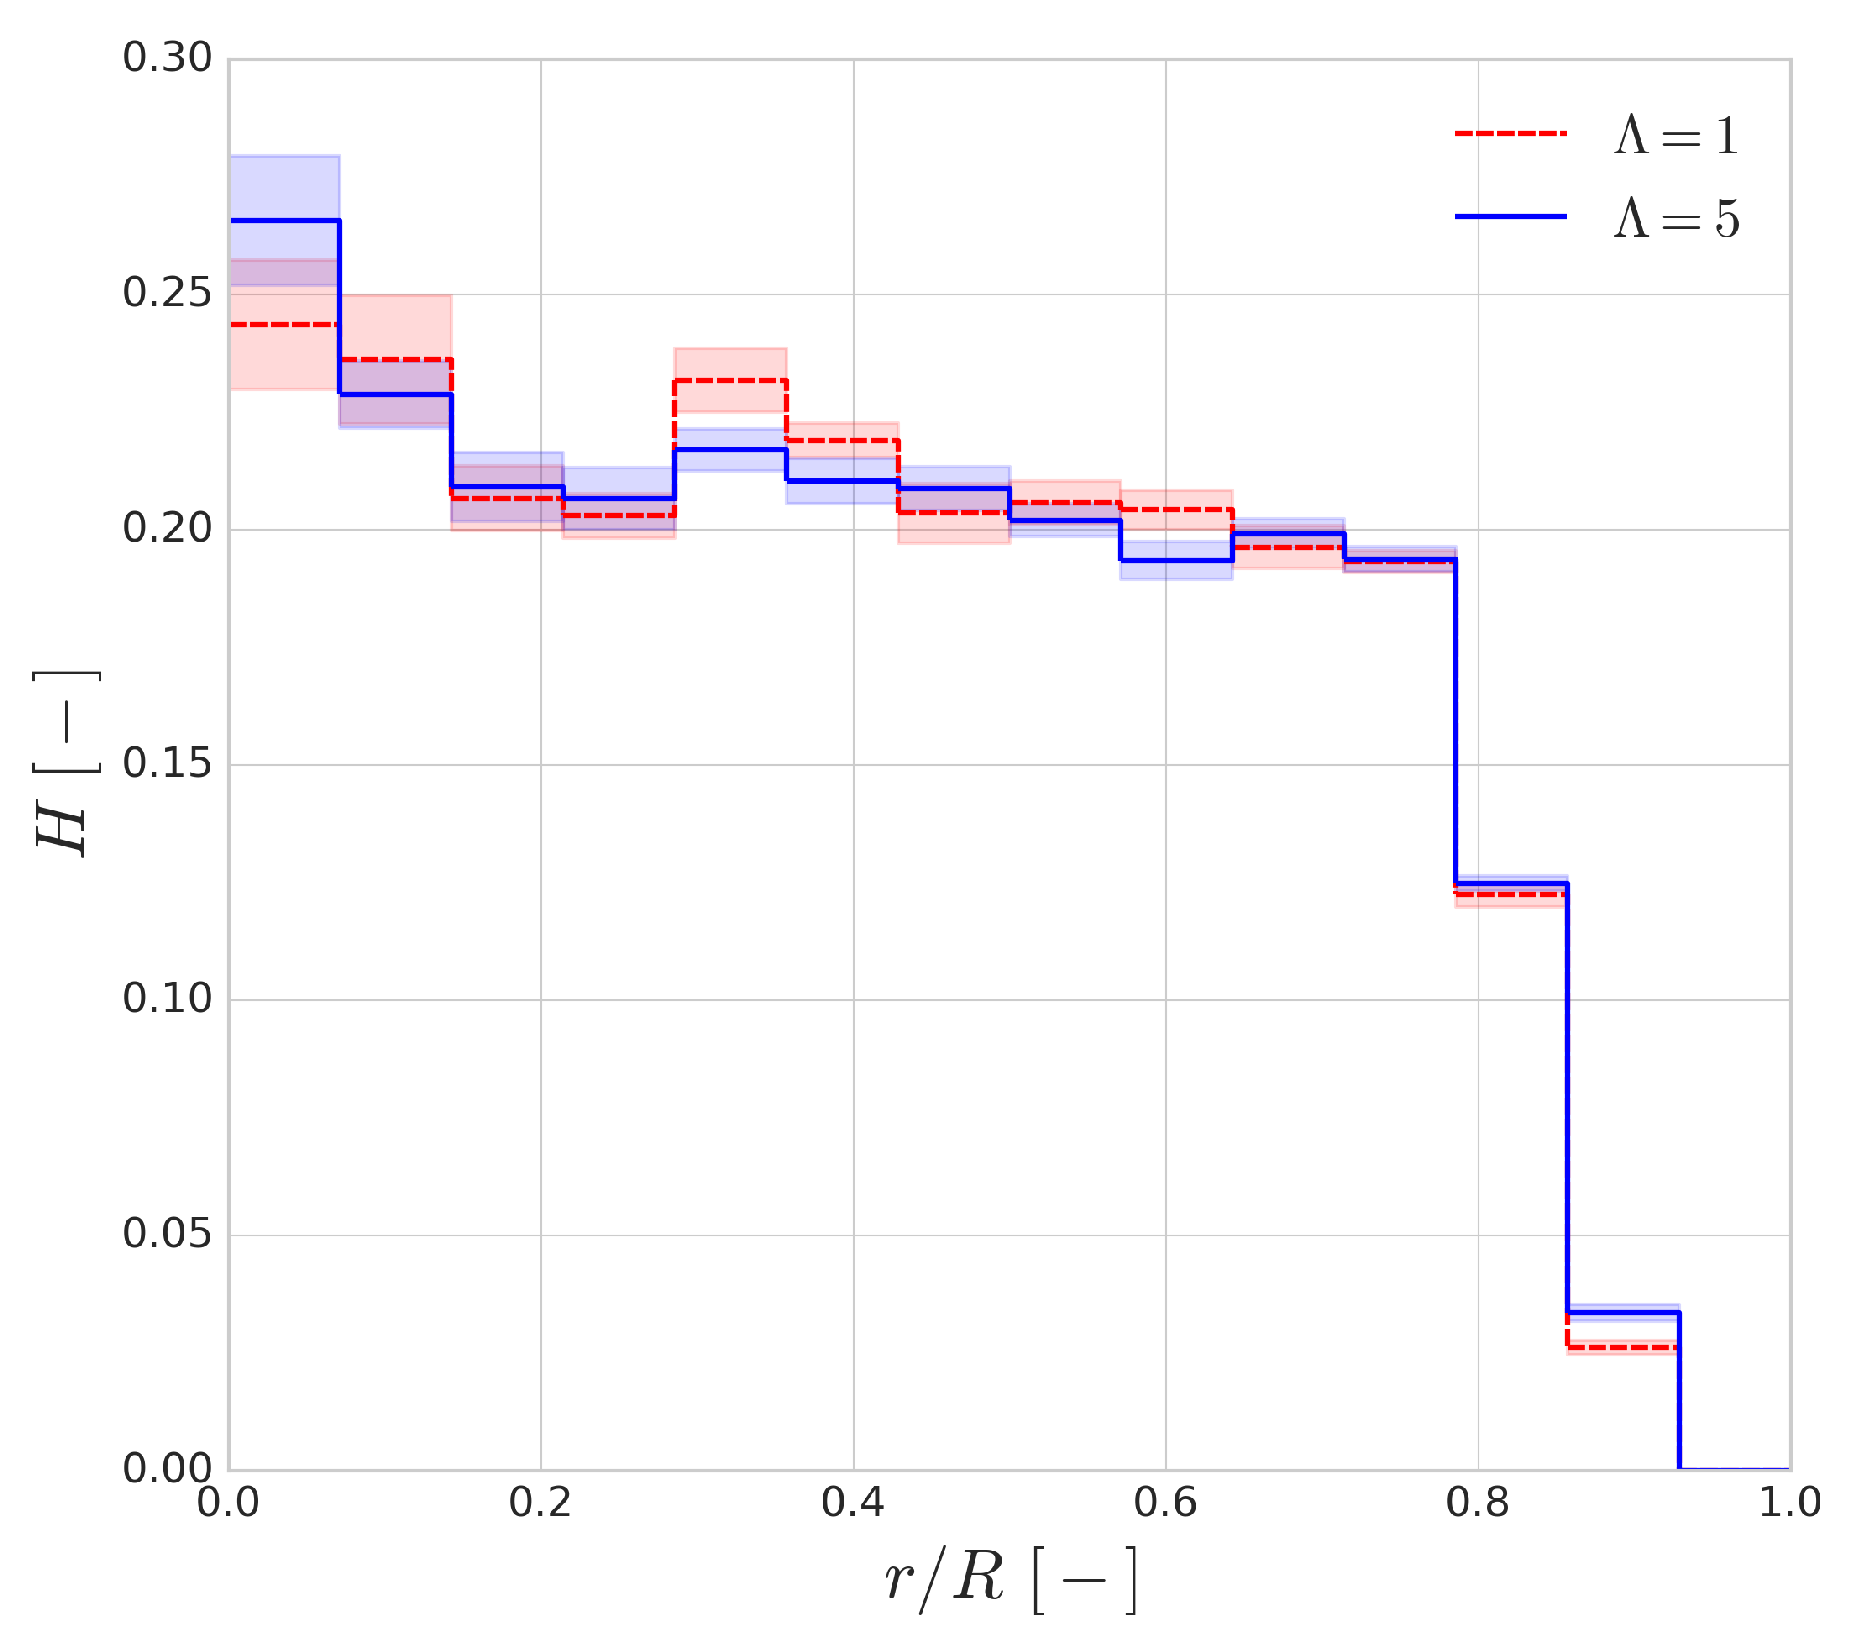
The haematocrit distribution and its fluctuation over time was also investigated in these simulations. In blood flows, it is known that the deformable nature of the RBC results in a migration towards the centre of the flow, which plays a role in the creation of the cell-free layer [
48] and the shaping of the haematocrit profile.
Figure 13 shows the haematocrit distribution across the radius of the channel for a discharge haematocrit of
. The general shape of the distribution is similar to the range of employed haematocrit values. The shaded regions indicate the fluctuation of the profile and they are the standard deviations of the profile based on a 30 ms window time-averaging. It can be seen that the cytoplasmic viscosity contrast has an almost negligible effect on the shape of the distribution, and, interestingly, the size of the cell-free layer seems to be mostly unaffected as well.
Figure 14 shows the effect of increased cytoplasmic viscosity on the width of the CFL, as well as on its development over time. The dashed black lines indicate values from the validation of HemoCell library [
25] for the corresponding haematocrit values. The differences are negligible in most cases, although a small deviation can be observed for low haematocrit (i.e.,
case). The lower cytoplasmic viscosity of
translates into more deformable cells which yields more intensive migration away from the walls (see
Figure 4). Given more available space for the RBCs (i.e., lower haematocrit), it might result in a narrower haematocrit distribution and larger CFL. On the other hand, for higher haematocrit, the higher cell diffusivity might suppress this effect as it resist the compression of the distribution width resulting in similar CFL for both cases.
4. Discussion
The addition of a viscosity contrast between the internal fluid of RBCs and the surrounding blood plasma leads to a change in the characteristic time scales of RBC deformation. This can be seen in the single-cell simulations where the reduced cytoplasmic viscosity decreases the deformability of a RBC in high shear rates and decreases the lift force induced by the channel wall. It can also be seen in the collision simulations that the reduced deformability influences the displacement of platelets after a collision, making the collision event more similar to hard sphere collisions in Stokes flow. A secondary effect, as shown in the Wheeler test, is the change in the elongated tank-treading shape of the RBCs, which also changes their width in the shear direction and therefore their collision cross-section. This also contributes to the changes in displacements during collisions. The periodic stretching experiments seem to indicate, however, that cytoplasmic viscosity effects are mostly influential for events happening at sufficiently short time scales.
The performed many-cell simulations confirm this behaviour as well, showing a clear dependence of relative apparent viscosity between the and on the Reynolds number. The haematocrit distributions of RBCs in a channel flow, however, show no noticeable changes due to the addition of a viscosity contrast.
There are still interesting questions to be posed that will be addressed in later works, such as the effects of this viscosity contrast on the margination of platelets and trafficking of other cell types such as white blood cells. During the choice of the numerical methods, the emphasis was put on finding a numerical solution that has high parallel efficiency for HPC applications. The current implementation does not change the scaling of HemoCell as it builds on the same distributed structures and introduces a small performance penalty of at most in the total run-time. Therefore, it is well-suited for applications of large cellular domains.


