Article

Exploring Habitat Quality Dynamics in an Equatorial Andean Basin Under Scenarios of Land Use Change

1
Carrera de Ingeniería Ambiental, Facultad de Ciencias Químicas, Universidad de Cuenca, Campus Balzay, Cuenca 010207, Ecuador
2
Grupo de Evaluación de Riesgos Ambientales en Sistemas de Producción y Servicios (RISKEN), Departamento de Química Aplicada y Sistemas de Producción, Universidad de Cuenca, Campus Balzay, Cuenca 010207, Ecuador
3
Facultad de Ciencias Económicas y Administrativas, Universidad de Cuenca, Campus Central, Cuenca 010203, Ecuador
4
Facultad de Jurisprudencia y Ciencias Políticas y Sociales, Universidad de Cuenca, Campus Central, Cuenca 010203, Ecuador
*
Author to whom correspondence should be addressed.
Earth 2025, 6(1), 10; https://doi.org/10.3390/earth6010010
Submission received: 23 January 2025 / Revised: 7 February 2025 / Accepted: 10 February 2025 / Published: 12 February 2025

Abstract

:
Globally, ecosystem services face significant degradation due to land use and land cover change (LULC) driven by human development. Despite numerous habitat quality assessments, comprehensive studies in high-mountain equatorial region basins remain scarce. This research addresses assessing habitat quality in Ecuador’s sub-basins of the Aguilán and Tabacay Rivers, with projections extending to 2050. This study considered anthropogenic threats and examined two land use change scenarios. The “Integrated Valuation of Ecosystem Services and Tradeoffs” (InVEST) model was used for the evaluation. A habitat quality index (HQI) was developed and categorized into five classes. The results showed that in 2018, over 50% of the study area had medium, high, and very high habitat quality levels, partly due to implementing policies, such as Reciprocal Water Agreements, developed by local initiatives. However, future projections suggest a declining trend, particularly in urban and cropland areas, highlighting the need to reinforce proactive policies. The findings of this study contribute to addressing existing gaps in habitat quality research in high-mountain regions, providing key scientific evidence to support conservation strategies, land use planning, and watershed management.

1. Introduction

Natural ecosystems are crucial for the well being and survival of humanity, sustaining life on Earth. These ecosystems provide essential benefits, known as ecosystem services (ES), which include direct and indirect contributions to human well being. These services support the livelihoods of thousands of individuals worldwide, providing sustenance, like food, wood, seeds, water purification, soil conservation, air quality, flood mitigation, and soil protection, among others [1,2]. Furthermore, ES can be categorized as provisioning, cultural, regulatory, and support services [3]. Understanding the significance of these ES is paramount for conserving natural resources. Nevertheless, human activities increasingly impact ecosystems, leading to significant challenges in recent years.
Although there are many studies on ecosystem services and habitat quality, their application in the Andean regions of Ecuador was given little attention. These regions are susceptible to anthropogenic pressure and climate change [4], which requires a better understanding of their dynamics and their relationship to land use.
Increasing anthropogenic activities, such as expanding urban areas, mining, and excessive grazing, among others, exert pressure on the ecosystem. These activities cause land use and land cover change, leading to biodiversity loss and declining their ability to provide ecosystem services [5,6,7]. These impacts are further intensified by phenomena such as climate change. Land use categories of high ecological importance, such as forests, grasslands, and water bodies, suffer from the deterioration of their ecological functions [8,9,10]. In this context, a fundamental indicator for ecosystem processes and evaluating their biodiversity is habitat quality (HQ) [11,12,13].
HQ is defined as the capacity of an ecosystem to supply elements required for the survival and reproduction of individuals [14,15,16]. However, human activities, particularly alterations in land use and land cover (LULC), significantly modify the natural environment, thereby, the HQ [17,18]. In particular, the expansion of urban areas and the conversion of forests to croplands increases the degradation of the quality of biological habitat [19,20]. In addition to disrupting ecological connectivity, these activities lead to increased fragmentation and reduced quality of these spaces, often resulting in their outright extinction [21,22]. As a result, the assessment of habitats plays a pivotal role in advancing ecological conservation efforts.
Various ecological models have been developed to assess habitat quality and support conservation efforts. These include (i) Artificial Intelligence for Ecosystem Services (ARIES), (ii) Social Values for Ecosystem Services (SoIVES), (iii) Multiscale Integrated Models of Ecosystem Services (MIMES), and (iv) Integrated Valuation of Services and Ecosystem Tradeoffs (InVEST) [23,24]. ARIES is used to evaluate services and value them spatially but is not practical in measuring changes over time [25,26]. On the other hand, SolVES is intended to map and analyze information collected in social surveys [27,28]. MIMES facilitates the spatial assessment of ecosystem services at multiple scales and contexts [29]. Nevertheless, InVEST stands out as a widely adopted tool for evaluating habitat quality worldwide, thanks to its user-friendly interface, visual representation capabilities, and strong, well-established theoretical foundation [30,31].
As mentioned, InVEST is globally recognized for its advantages, including precise measurements, reduced application costs, and minimal input data requirements [32,33]. The InVEST Habitat Quality model establishes a nuanced relationship between the suitability of various land covers and the threats they face. It utilizes land use data to assess habitat quality, considering factors such as distance, importance, and sensitivity of habitats to ecological threats, like croplands, roads, construction zones, and other land uses significantly impacted by human activities [34,35]. The scientific endorsement of InVEST’s application in HQ assessment has far-reaching implications, shaping essential land use management strategies and biodiversity preservation [11,32]. This feature is particularly relevant in regions with high biodiversity, such as the Andean region, where habitat quality is crucial for maintaining ecological balance [36,37]. In recent years, this tool has been approached from multiple perspectives, ranging from its application in urban landscapes to its analysis at the watershed level [38,39,40] to improve the quality of the habitat and, in this way, contribute to the conservation of biodiversity. It has also been used in future assessments according to climate projections and development patterns, providing valuable references for subsequent decisions in the ecological management of natural areas [41].
Natural areas, particularly in the Andean region, are distinguished for their remarkable biodiversity. The habitat quality for plant and animal species is crucial [42,43]. In Colombia, there is a highlighted emphasis on conserving forests in areas of high bird diversity in the Andes as part of comprehensive restoration planning at the regional level [44]. These areas also support fundamental ecological processes, including seed dispersal, food availability, and population regulation through predation [43,45]. Recent studies on Ecuadorian Andean rivers point out the sensitivity of macroinvertebrates to changes in habitats and land use [46]. In terrestrial ecosystems, species such as mammals show greater diversity and abundance in intact forests, illustrating the impact of anthropogenic pressure in these spaces [47,48]. Consequently, preserving the rich biodiversity and valuable ecosystem services that characterize this unique region is imperative.
In this research, the habitat quality module of the InVEST software was used to evaluate the condition of the sub-basins of the Aguilán and Tabacay Rivers, located in southern Ecuador. This analysis was conducted, considering threats of anthropogenic origin, within the framework of two change scenarios spanning the years 2030, 2040, and 2050, which will not only allow the identification of areas at risk of deterioration but also contribute to the preservation of the most critical ecosystems. Therefore, the results of this study have direct applications for researchers, environmental planners, and decision-makers of public order.
Knowing future land use patterns and habitat quality is essential to understanding their dynamics and generating management policies and strategies to preserve the ecological environment. For this reason, this study also represents an innovative contribution to science and environmental management by integrating future projections and spatial models to safeguard biological diversity in the Ecuadorian Andes.

2. Materials and Methods
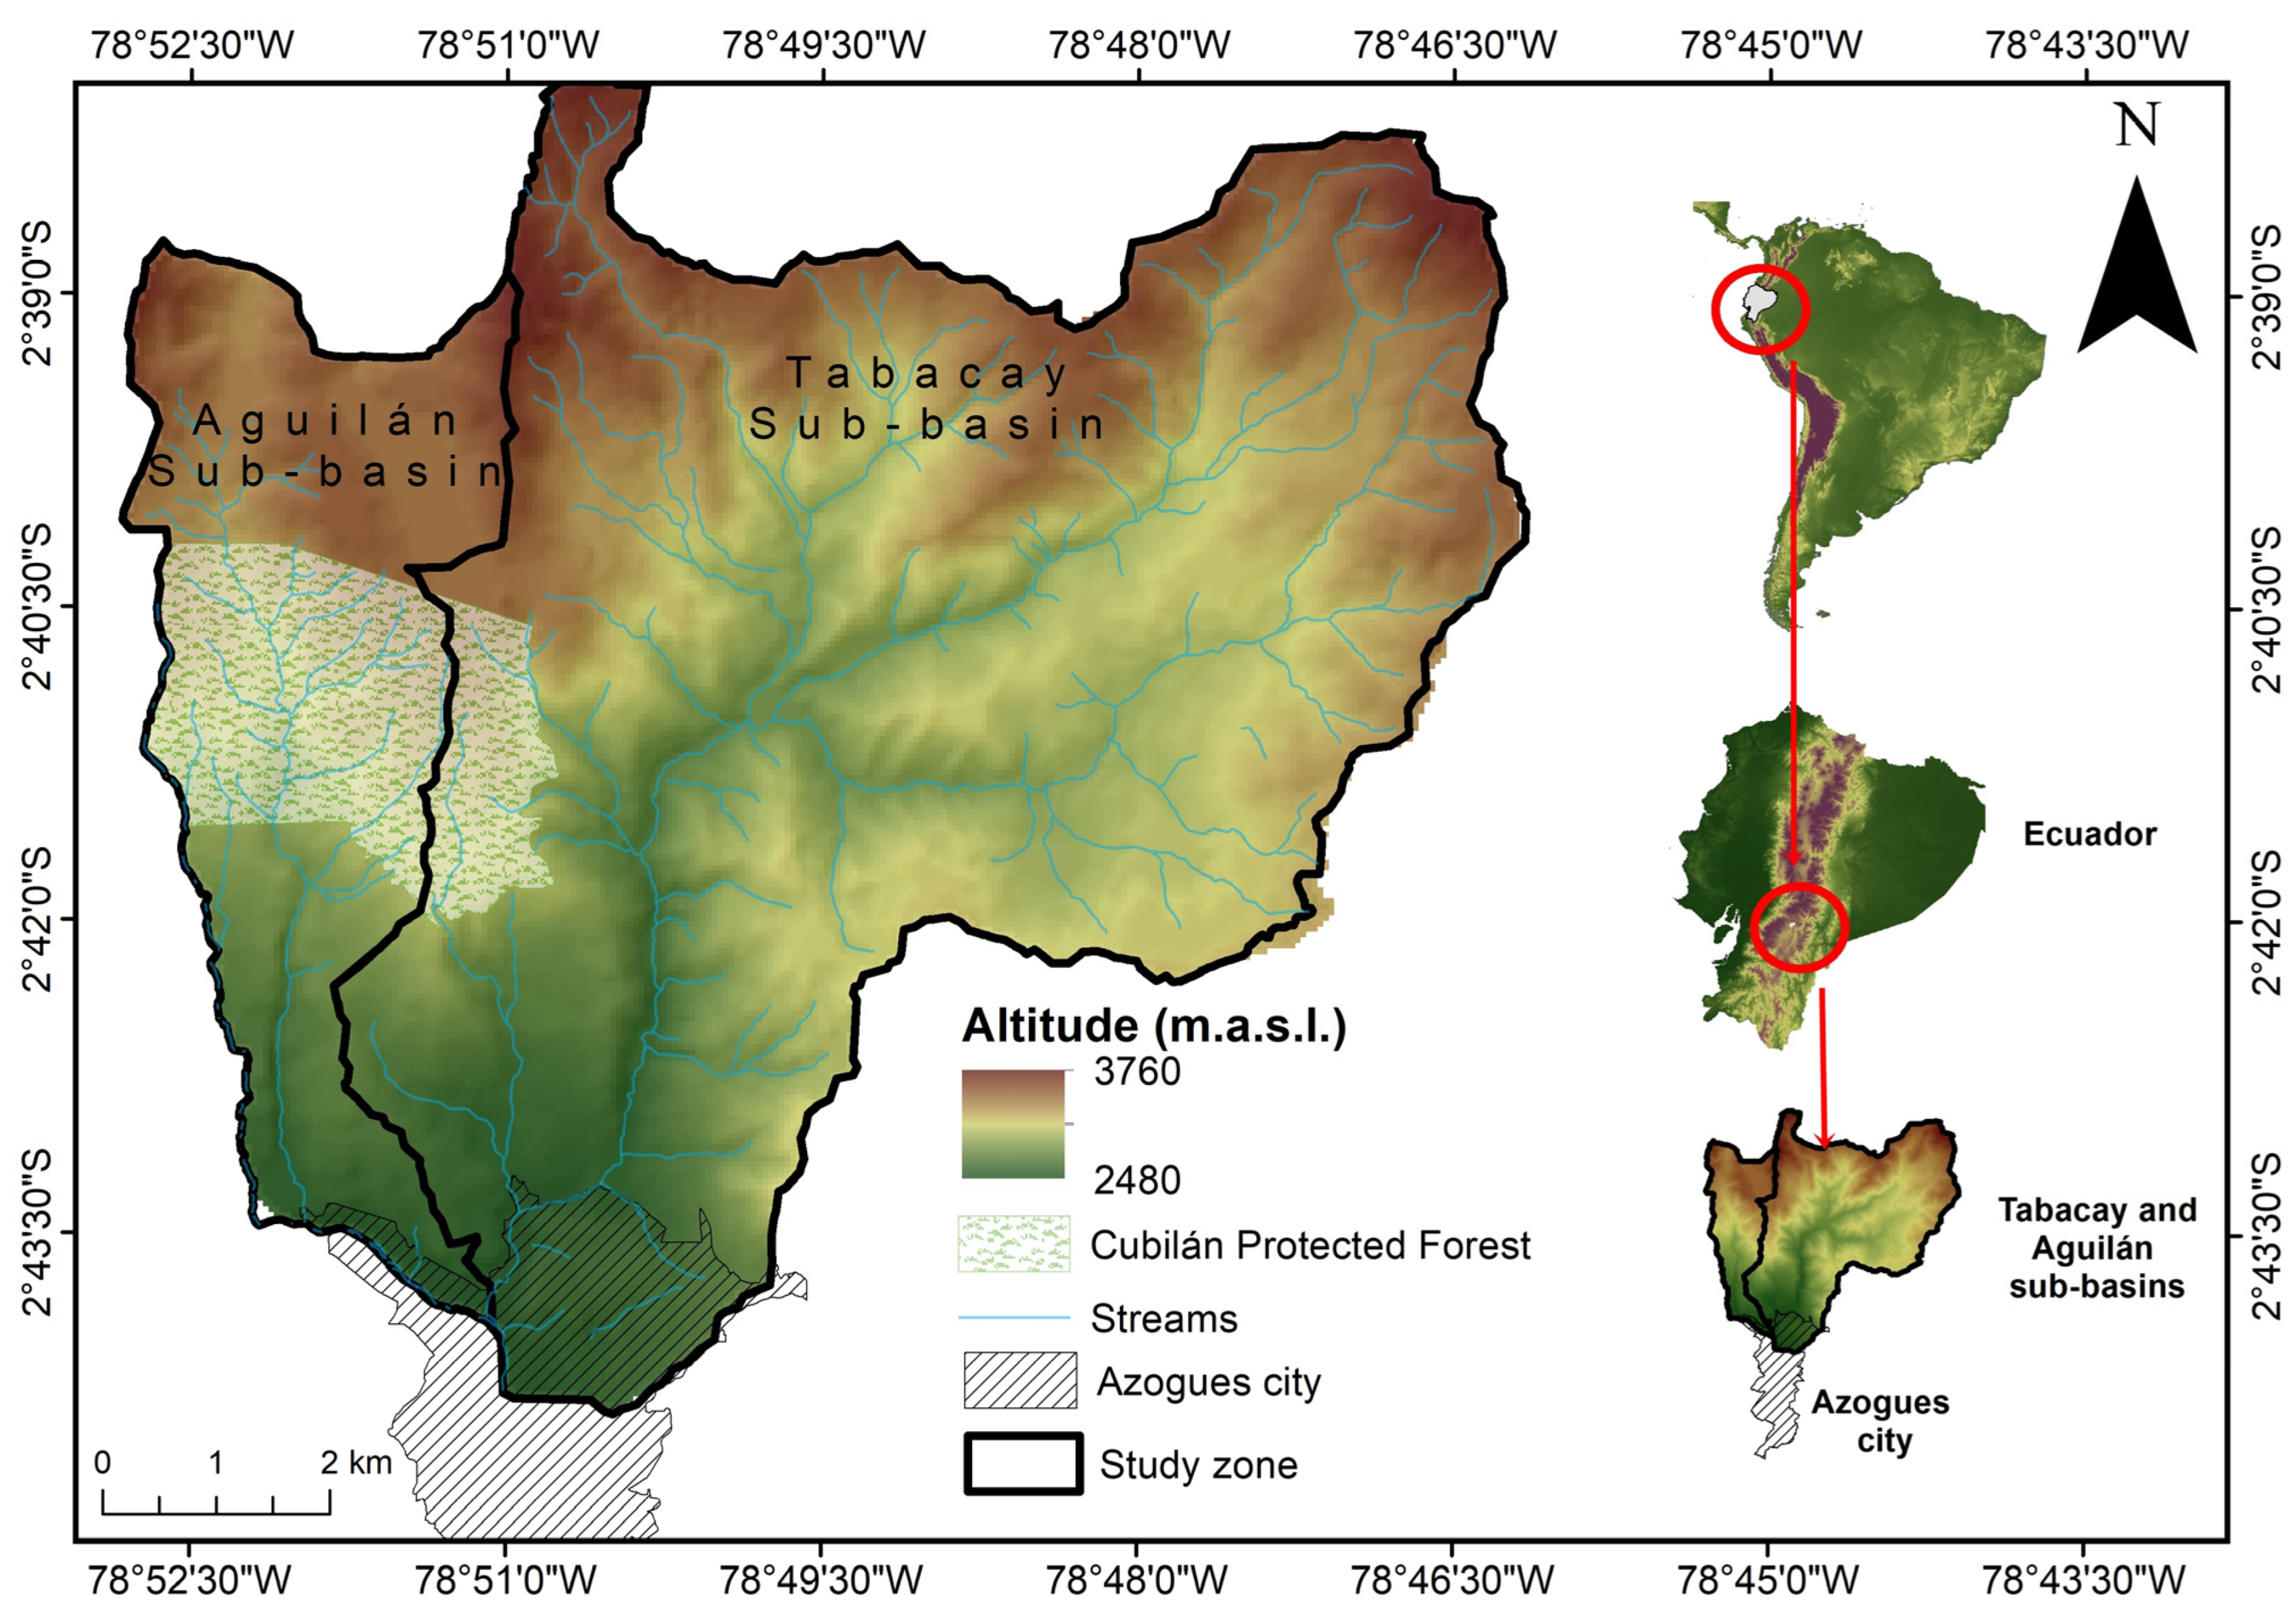
2.1. Study Zone

The Aguilán and Tabacay River sub-basins, part of the Paute River basin, cover an area of 8642.96 ha and are located in the rural regions of Aurelio Bayas and Guapán Parishes, within the Azogues Canton, situated in the Province of Cañar, southern Ecuador (Figure 1). These sub-basins lie within an altitudinal range of 2480 to 3760 m.a.s.l. The region experiences an average annual precipitation that decreases from 1115 mm in the upper region (Llaucay) to 876 mm in the lower area (Guapán). Additionally, temperatures remain relatively low, ranging between 9 and 11 °C [49]. Several streams contribute to the hydrology of these sub-basins, including the Llaucay, Nudpud, Condoryacu, Rosario, Mapayacu, Rubíes, Corazón Hurco, and Bermejos streams, which play a crucial role in the region’s water dynamics.
In the sub-basins of the Aguilán and Tabacay Rivers, to the northwest lies the Cubilán Protected Forest, covering an area of 1078.51 ha. It hosts various animal and plant species, predominantly native plants, and has several natural resources, such as water [50]. These indigenous floras are crucial to the region in maintaining the ecosystem’s delicate balance. Notable plant species include Oreopanax argentatus, Bidens andicola, Monticalia vacciniodes, Franseria artemisoides, Jungia cf. Rugosa, Vallea stipularis L.f., Myrica pubescens Humb & Bonpl. Ex/Willd, Macleania rupestris (Kunth.) A.C.Sm., Hesperomeles ferruginea Benth, Calamagrostis intermedia (J.Presl.) Steud, Puya clavaherculis, and Polylepis, which are are traditionally utilized for firewood, wood, forage, and medicinal purposes [51]. The area also hosts various fauna at different altitudinal levels, including Odocoileus virginianus, Sylvilagus andinus, Puma concolor, Lycalopex culpaeus, Tyto alba, Patagioenas fasciata, Lesbia nuna, Falco peregrinus, Turdus fuscater, Zenaida auriculata, Aglaeactis cupripennis, Eriocnemis luciani, Ampelion rubrocristatus, and Mazama rufina, among others [51].
The plant and animal species inhabiting the Tabacay and Aguilán River sub-basins could face significant future threats if their habitat quality deteriorates. This issue could be caused by various human activities, such as deforestation, urbanization, agriculture, pollution of water and air, and the introduction of invasive species.

2.2. InVEST Model for Habitat Quality Modelling

Various methodologies exist for evaluating HQ. Among them, the InVEST tool was chosen for this study due to its holistic framework and ability to generate detailed insights into habitat health and diversity. This model enables us to assess the impact of land cover dynamics on these sub-basins, helping to identify critical areas for preservation and promote sustainable management strategies.
Developed by the Natural Capital Project, the InVEST model evaluates and maps ecosystem services, reports on ecosystem management, and analyzes the potential consequences of different management approaches and climate changes. It operates through a grid-based approach and consists of modules classified into three categories: support services, final services, and tools to facilitate ecosystem services analysis. The model’s simplicity and low data requirements make it suitable for a wide range of applications, including use for non-specialists [35].
The habitat quality module was selected for the study because it can assess the relationship between land use/land cover and biodiversity. This module analyzes spatial maps and identifies the threats associated with different land uses [52]. In addition, it enables the investigation of changes in habitats over time. For instance, [53] applied the model to compare HQ in various regions of Xinjiang and the projected future trends between 2018 and 2035, which shows the benefits of the model when predicting changes in the long-term biodiversity under various country-use scenarios. Studies on the quality of the habitats were mainly carried out on small and medium scales [40,54,55,56], which is relevant for this specified study because the analysis focuses on a small sub-basin. In addition, the absence of previous assessments in this area justifies the InVEST model’s application, as it provides a suitable approach for estimating spatiotemporal habitat dynamics and generating key information for conservation and management efforts.
The habitat quality module processes raster-based LULC data, classifying each grid cell into different categories. These classifications range from general types, such as “forests”, to particular subtypes, such as grassland types. A key feature of this module is its flexibility, allowing users to define which LULC categories qualify as habitat. The model supports binary and continuous evaluation approaches. In the binary approach, specific LULC categories are designated as habitats (e.g., unmanaged areas), while others are excluded (e.g., managed or degraded regions). In contrast, the continuous approach assigns a habitat quality score ranging from 0 to 1 based on species compositions or groups of interest, enabling a more nuanced evaluation of habitat quality.
Beyond LULC data, the module requires information about threats, including fragmentation and anthropogenic degradation. These threats are represented as raster data, in which each cell indicates the presence of the threat (1 = present, 0 = absent). This threat classification provides a metric to assess human-induced adverse effects on habitat quality. The module can also incorporate other factors, such as road networks or croplands, offering a comprehensive understanding of how human activities interact with ecosystem biodiversity.
Within this module, all mapped threats must have the same scale. For example, as indicated [35], if a threat is measured in density per grid cell, all sources of degradation must be calculated at the same scale, or if a threat is represented as presence or absence on a map (1 and 0, respectively). Then, all threats must be mapped to the same scale.
The impact of threats within the habitat is affected by four factors, which are detailed below.
The relative impact of each threat represents the concept that specific threats exert more significant detrimental effects than others. This distinction is quantified through a rating system that evaluates and compares their respective levels of impact. For example, dams can be regarded as three times more harmful to aquatic ecosystems than deforestation, or the expansion of roads and highways can have twice the negative impact on habitat quality compared to moderate urbanization.
The impact of threats on habitat decreases as distance from the source of degradation increases; cells closest to threats experience more significant consequences. The rate of this decline in space can follow a linear or exponential function, and the impact of the threat on a grid cell is calculated according to Equations (1) and (2).
i r x y = 1 d x y d r   m a x   i f   l i n e a r
i r x y = e x p 2.99 d r   m a x d x y   i f   e x p o n e n t i a l
where dxy is the linear distance between cells x and y, while dr is the maximum effective distance that threat r can reach in the area.
The third factor assesses habitat threats, considering legal, institutional, social, and physical protection in grid cells. The model evaluates formal protection, altitude-based inaccessibility, and openness to disturbances. Higher protection reduces threat impact, indicated by β x ∈ [0, 1] for accessibility. Decreasing accessibility linearly diminishes threat impact. While legal/institutional/social/physical protections generally reduce the effects of extractive activity, they may not fully shield against pollution or habitat fragmentation. If the mitigations for threats are not implemented or effective, the input should be ignored or set to β x = 1 for all grid cells. Specific habitat suitability ratings require species group-specific threat mitigation weights.
  • Finally, the model uses the sensitivity of the habitat type to threats to calculate the degradation in a cell (Sjr that varies between 0 and 1). Values close to 1 indicate greater sensitivity. This specific sensitivity for the species group is based on ecological principles for conservation.
The total threat level in a given grid cell that has an LULC or habitat type j is given by Equation (3) as follows:
D x j = r = 1 R y = 1 Y r w r r = 1 R w r r y i r x y β x S j r
where “y” refers to the grid cells of the raster map of “r”, while “Yr” indicates the cells of the raster map of “r”. Additionally, the threat weights must be normalized so that the sum of all threat weights equals 1.
A half-saturation function is used to obtain the habitat quality value for a particular cell, which requires the determination of the half-saturation value. As a grid’s degradation rating increases, habitat quality tends to decrease. The habitat quality in plot x, located in LULCj, can be represented by Qxj (Equation (4)) as follows:
Q x j = H j 1 D x j z D x j z + k z
where Qxj denotes the habitat quality of type j at point x, Hj is the habitat suitability of land use j, Dxj denotes the total threat level of grid x at habitat type j, z is the parameter by flaw, and k is the semisaturation constant (with a default value of 0.5).
The InVEST model supported a series of fundamental factors to determine the quality of the habitat. These factors were the evaluation of the impact of the threat in each land use category, the determination of the maximum distance of influence of said threat, and the assessment of the habitat’s sensitivity to this specific threat. The numerical values for these factors were derived from a comprehensive review of the scientific literature, which included previous studies by [12,39,40,57]. In addition, the availability of empirical information and the knowledge provided by local experts through in-depth interviews were considered.

2.3. Input Data for the Model

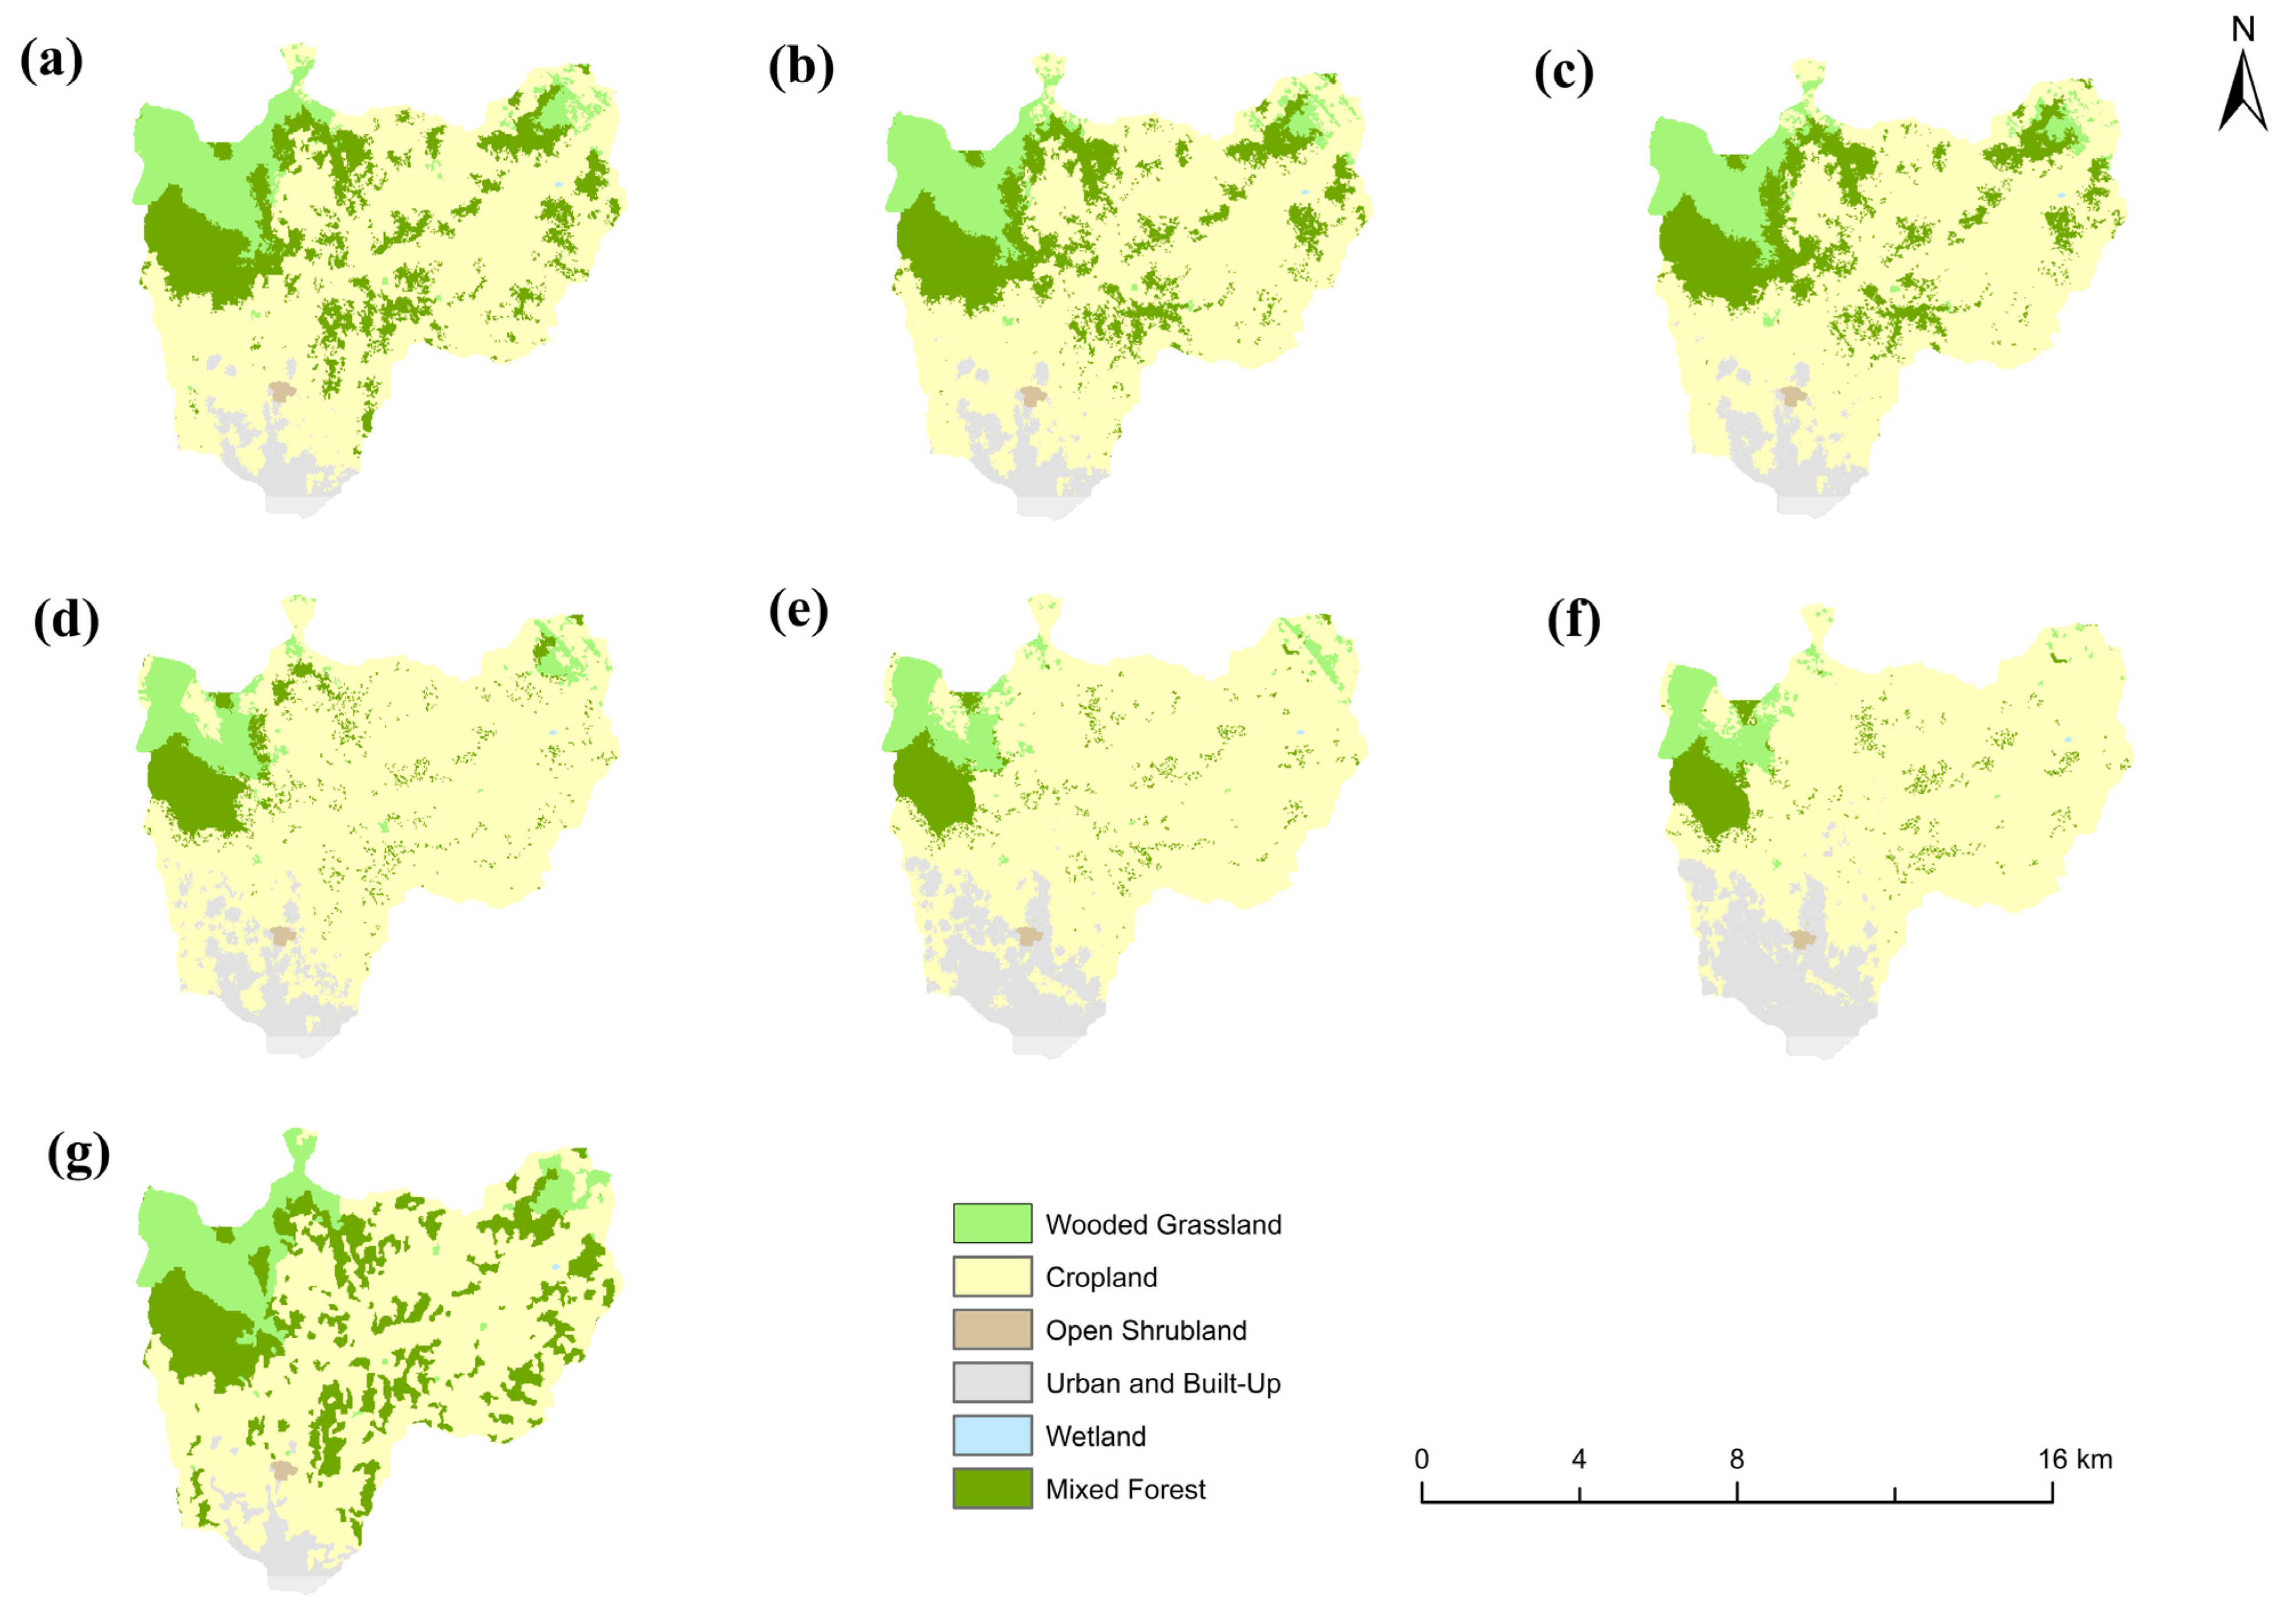
2.3.1. Land Use and Land Cover (LULC)

Land use and land cover data provided by the Ministry of the Environment, Water and Ecological Transition of Ecuador (MAATE) for 2018 were used for this study. The classification methodology used is detailed in [58]. In addition, projections of land use changes were made for two scenarios: one based on current trends and another pessimistic for 2030, 2040, and 2050 (Figure 2). These projections were incorporated into the InVEST model. The trend scenario considers population growth of 1.56%, along with the trends observed in changes in land use between 2014 and 2018. On the other hand, the pessimistic scenario assumes a population growth of 5.83%, the discontinuation of the Protective Forest Cubilán, and the transformation of existing trails in the study area into gravel roads.
These land use changes reflect significant dynamics in the area, whose recent trends allow for the projection of future scenarios with important implications for forest cover, urban areas, and water bodies. Between 2014 and 2018, the examination area recorded significant changes in land use. The forest cover took back 4.4%, while the urban areas rose 7% and cropland 2.3%. In contrast, the water bodies suffered a reduction of 9.4% in 2016 and 15.6% in 2018. Forecasts for the pessimistic scenario show that the urban surface will almost double by 2030 compared to 2018 and triple it three times by 2050. In addition, forests will experience the most significant loss, with a reduction of 62.6% in 2030 and 73.4% in 2050 [49].
Land use projections were made using Dinamica EGO version 7.1.1, software for land use change modeling based on cellular automata algorithms that uses weighted evidence of various biophysical and socio-economic variables as drivers of change. For a more elaborate description of the methodology, please refer to [49,59].

2.3.2. Thread and Sensitivity Factors

Cultivated land and urban areas were identified as the main threats to the habitat in the study area. This determination was obtained through careful analysis of the previously collected data and consideration of the scientific literature [49], as well as the qualitative contributions of the experts consulted.
The determination of numerical values for these factors was based on a thorough analysis of the scientific literature, drawing on findings from previous studies [12,39,40,57]. Furthermore, empirical data availability and expert knowledge obtained through detailed interviews with local specialists were also considered. These threat factors were selected due to their significant impact on habitat quality. In Table 1 and Table 2, you can see the assignment of weights and distances of the threats present in the study area, as well as the sensitivity of the different land uses to the various threat factors.

2.3.3. Habitat Quality Analysis

The evaluation of habitat quality will be conducted for the 2018 base scenario and the pessimistic and trend scenarios corresponding to the years 2030, 2040, and 2050. This analysis will consider the influence of factors detailed in Table 1 and assess the sensitivity of different land uses to threats, as described in Table 2. The habitat quality index (HQI) results will be divided into five classes, [0, 0.09), [0.09, 0.6), [0.6, 0.8), [0.8, 0.89), and [0.89, 1], using the natural breakpoint method in ArcGIS V10.8 [60,61], representing very low, low, medium, high, and very high, respectively. These results will be presented in maps that categorize the index into these classes for a more precise visualization and understanding of the spatial distribution of habitat quality.

3. Results and Discussion

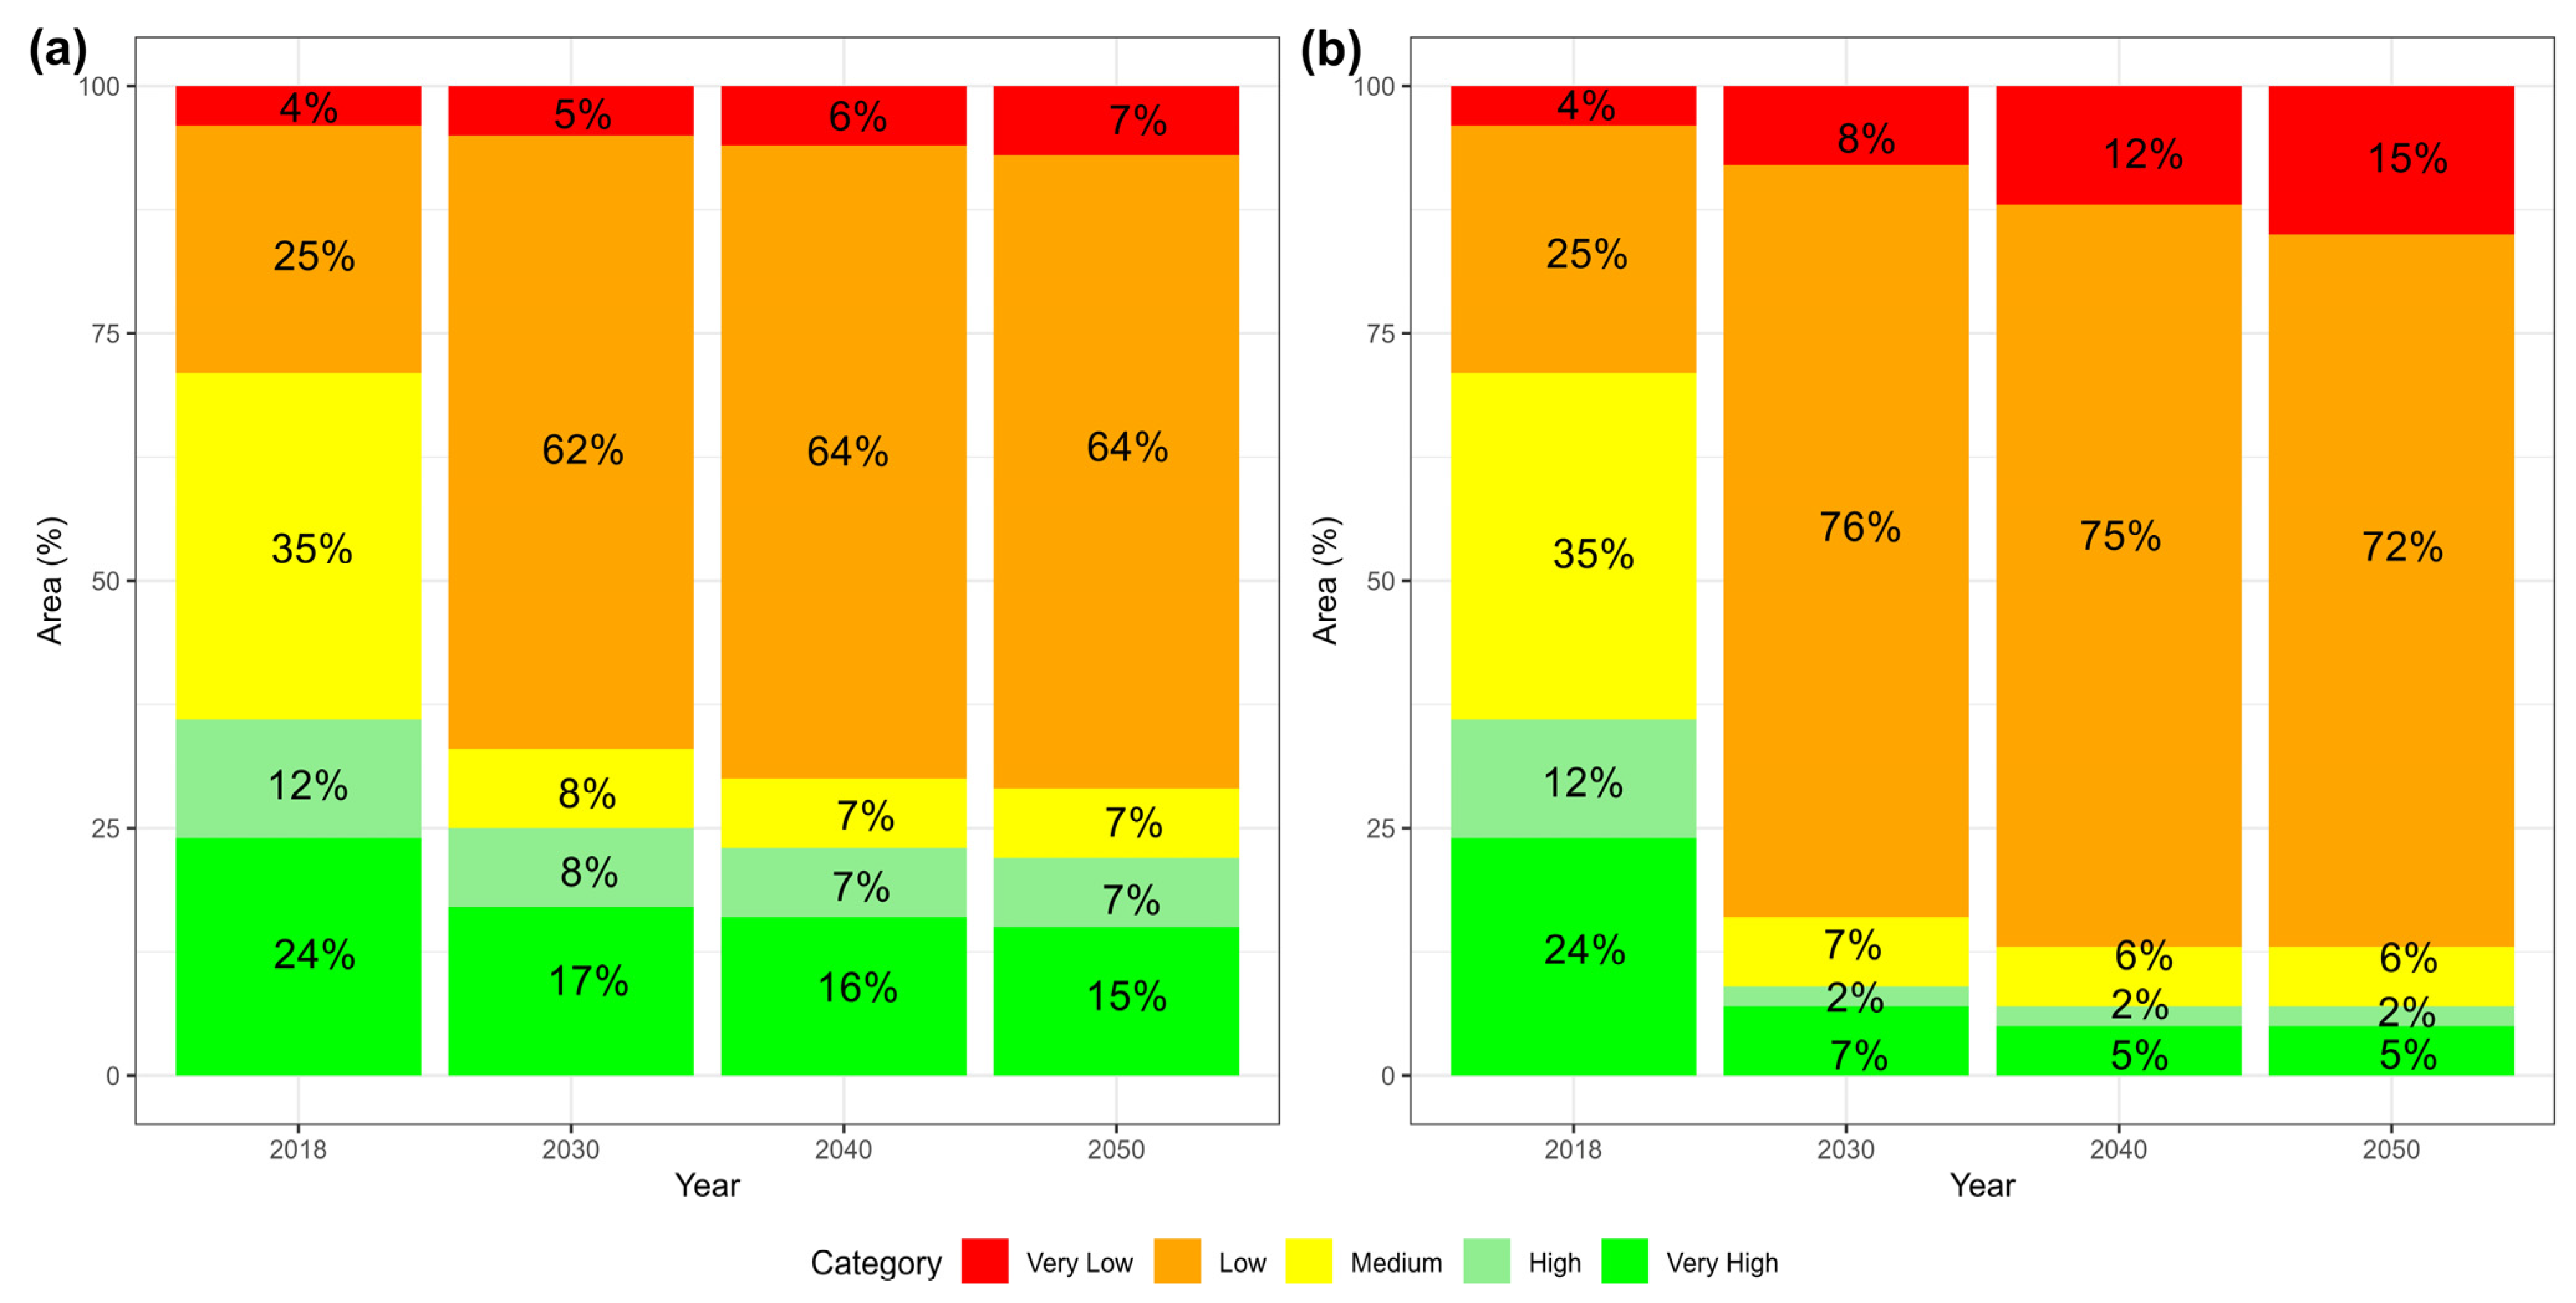
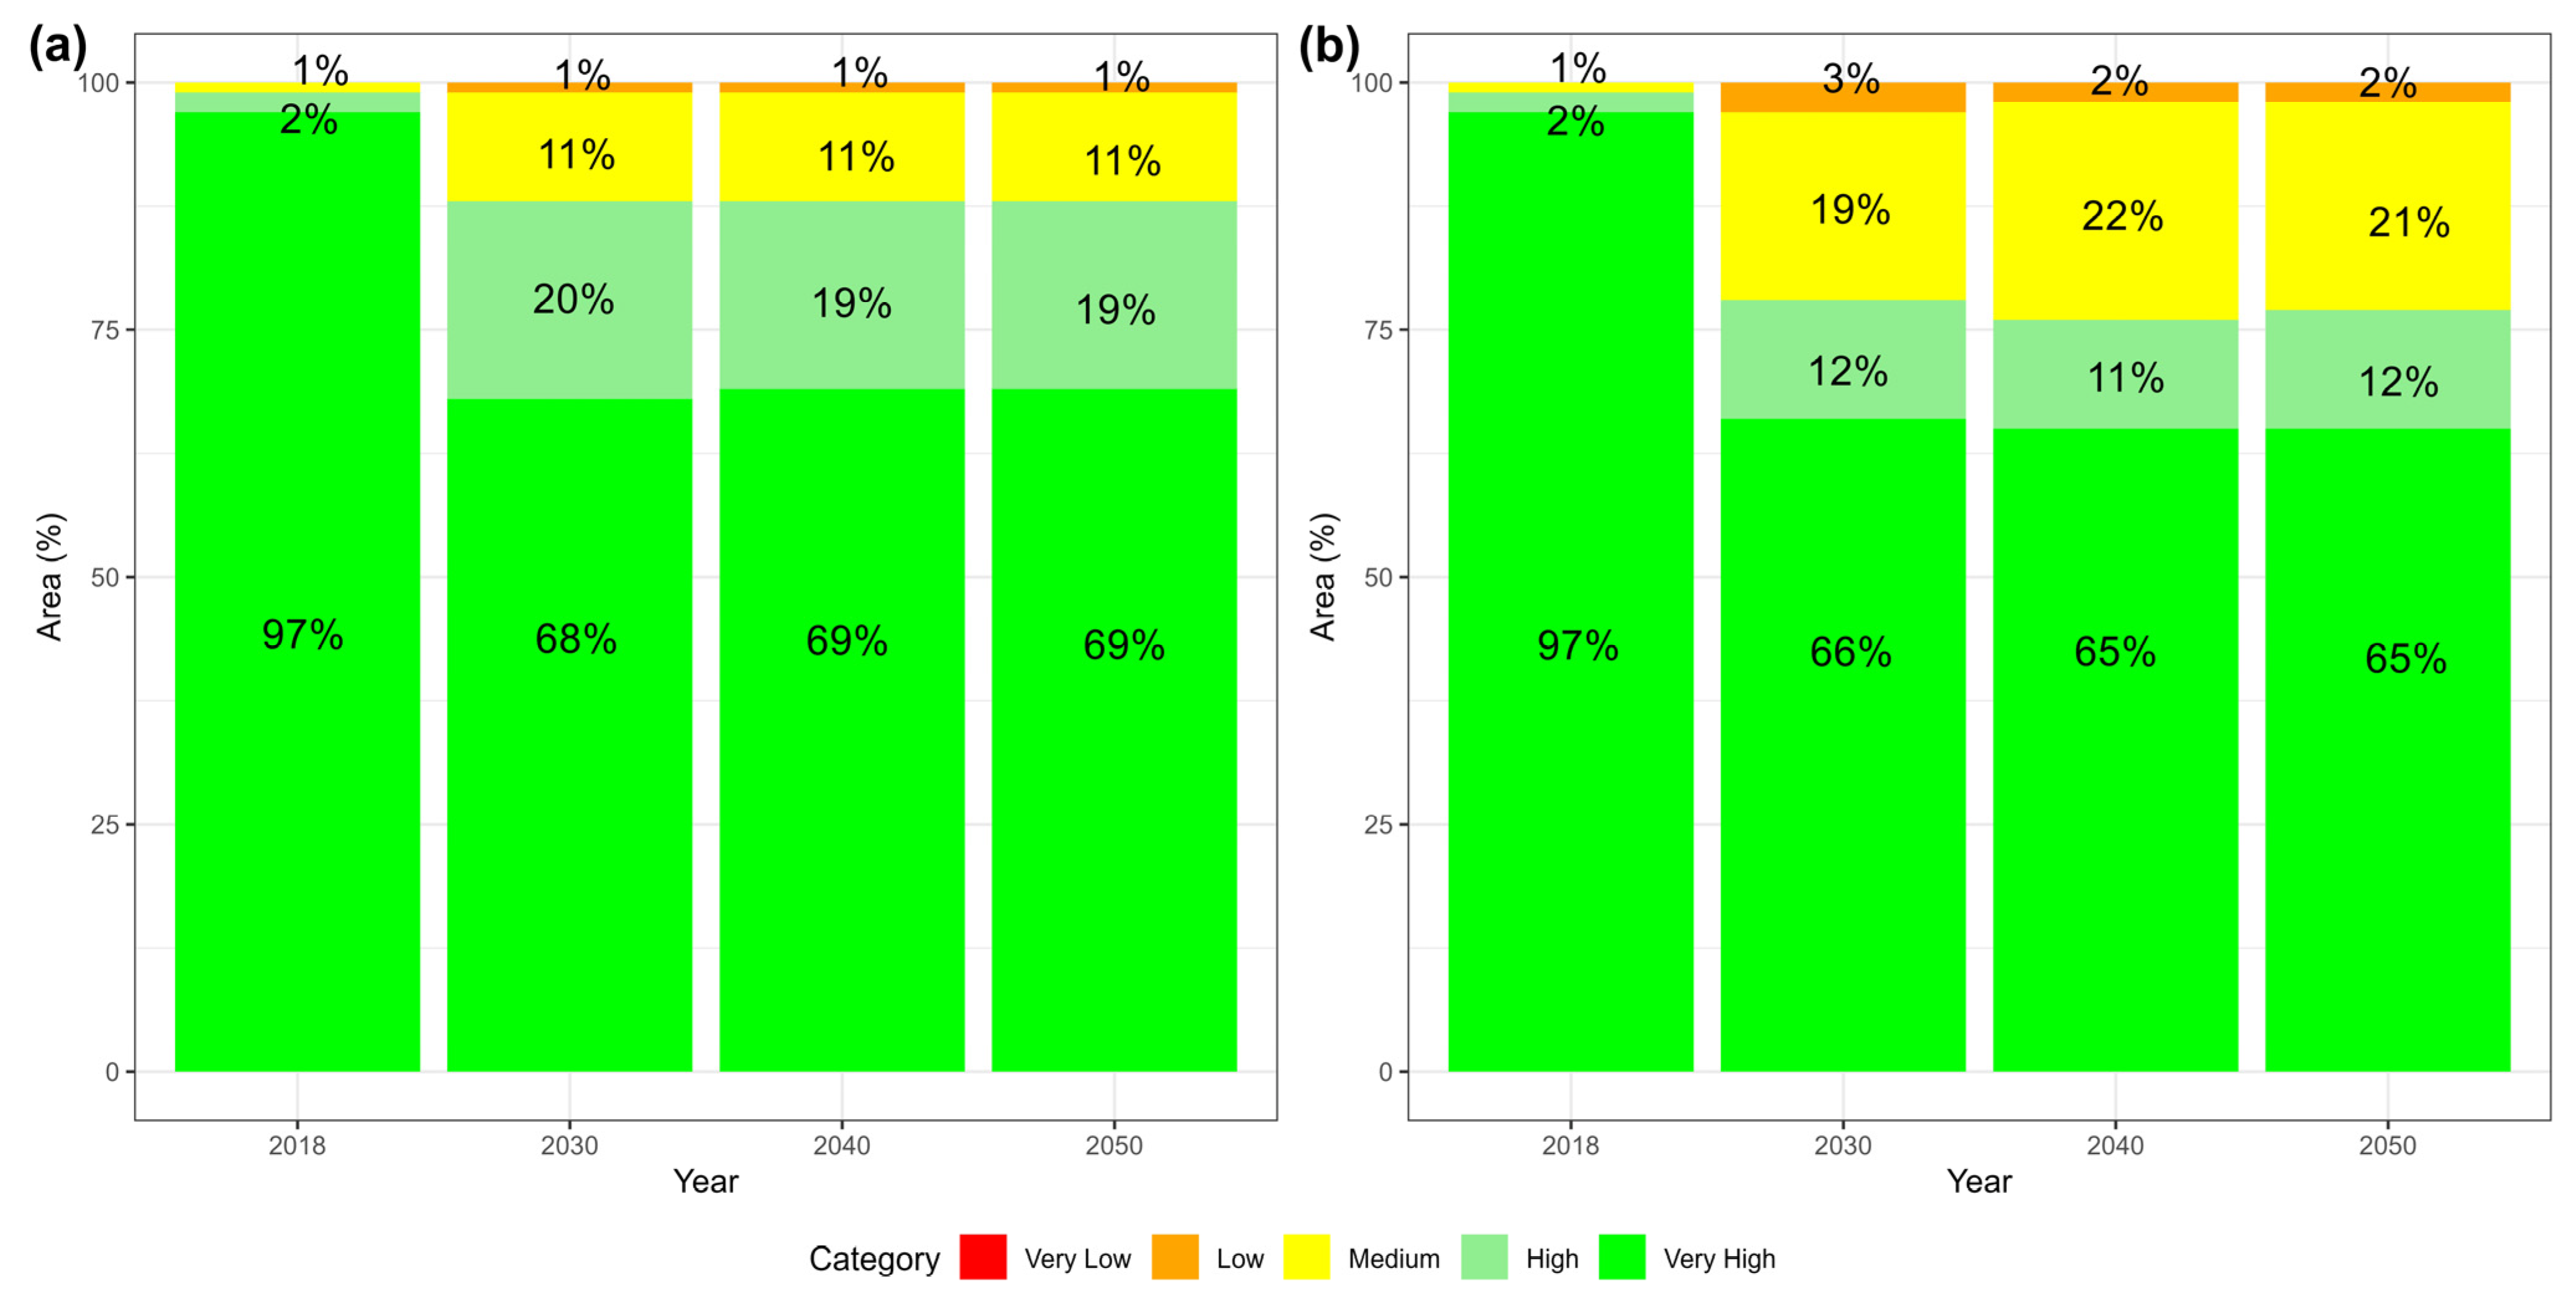
3.1. Spatial–Temporal Evolution of the HQI

The assessment of habitat quality in the sub-basins of the Tabacay and Aguilán Rivers involved an examination of land use change scenarios (trend and pessimistic) for future periods (2030, 2040, and 2050), comparing them with a baseline scenario (2018). The spatial distribution of the HQI during the baseline period (2018—Figure 3g) reveals that over 50% of the analyzed territorial area exhibits HQI levels classified as medium, high, and very high. The obtained results highlight the positive impact of protection policies implemented in the study area by the Municipal Public Service Company for Drinking Water, Sewerage, and Environmental Sanitation of the city of Azogues (EMAPAL EP), utilizing the conservation mechanism known as Reciprocal Agreements for Water (ARAs by their acronym in Spanish) [62,63].
Nevertheless, future changes in land cover and land use are anticipated to adversely impact the study area, resulting in a reduction in high HQI levels. In the trend change scenario (Figure 3a,c), a decrease in the HQI values is observed. This decrease, however, becomes more pronounced in the pessimistic scenario (Figure 3d,f). Prior studies have highlighted that modifications in land use and land cover (LULC) due to agricultural activities in this region have led to vegetation fragmentation, causing a decline in its quality, along with repercussions on other components, such as soil and water [49,64].
The HQI in the study area exhibits high and very high values (0.8–1) across all future scenarios evaluated, with particular emphasis on the northwest region corresponding to the Cubilán Protective Forest. As highlighted in the literature [65], this area is characterized by páramo soils. It plays a crucial role in providing ecosystem services.
In contrast, unfavorable levels (low values of the HQI) are concentrated in the lower part of the sub-basins, coinciding with the urban expansion area of Azogues. The pessimistic and trend scenarios project decreased forest and grassland coverage and increased land designated for croplands and urban activities due to future population growth. In these areas, a reduction in the HQI is anticipated as population density increases [66]. These changes signify a significant transformation in the quality of natural habitats in future projections, replaced by land uses dominated and intensified by anthropogenic activity over the years. These results align with studies conducted globally, such as [67] in Italy, [68] in Dongying Cities, [69] in the Yangtze River Delta region, and [52] in the Altai region of China. In these regions, population growth and urbanization, while positively impacting the economy, negatively affected habitat quality.

3.2. The HQI According to the Different Land Uses

In assessing habitat quality within the study area, a comprehensive analysis was conducted to evaluate the distribution of different levels of the HQI (Figure 4). During the baseline period (2018), the breakdown of habitat quality distribution was as follows: 4% at the very low level, 25% at the low level, 35% at the medium level, 12% at the high level, and 24% at the very high level. These findings suggest that the sub-basins’ environmental and habitat conditions were favorable that year because more than half of the area has medium or higher categories.
However, a significant trend is observed in future projections for 2030, 2040, and 2050 under both trend and pessimistic scenarios (Figure 4). There is a notable decrease in HQI levels classified as very high, high, and medium, while the proportion of areas categorized as low and very low exhibits a considerable increase (Figure 4b). It is essential to highlight that the percentages of increase in the low and very low levels are markedly more pronounced than the percentages of decrease in the medium, high, and very high levels. Anthropogenic activities leading to changes in land use and cover patterns contribute to these drastic shifts, profoundly affecting biodiversity and habitat quality [70]. This discrepancy signifies a substantial change in habitat quality towards less favorable conditions throughout the study period.
Studies in regions with high economic development, such as the Guangdong–Hong Kong–Macao Greater Bay Area [71], show that vegetation loss, land use change, and human activities affect habitat quality. In the InVEST model, vegetation cover, impermeable surface, and economic development increase habitat fragmentation. These results highlight the need for policies that balance environmental protection and socio-economic development.
As land use intensification escalates, additional environmental threats emerge, contributing to the degradation of habitat quality in the surrounding areas. Forested areas at higher altitudes showcase commendable levels of the HQI, while lands designated for agriculture or unused regions are characterized by poor habitat quality [9,52].
The upper zones of the Tabacay and Aguilán River sub-basins, positioned at an altitude exceeding 3000 m above sea level, exhibit the highest HQI values, primarily attributed to the diverse land covers such as forests, grasslands, and crop areas. Recognized by EMAPAL EP as a region of crucial water significance, these areas serve as the origin of water sources for Azogues’ water supply. Conversely, in the intermediate and low regions of the area, urban and cropland use predominate. Human activities exert a more intense impact in these zones, reducing the natural areas and declining habitat quality.
In a broader context, forested areas emerge as the primary contributors to a high HQI in the sub-basins, as depicted in Figure 5. This land use type is consistently associated with a very high HQI percentage (exceeding 50%) in all considered scenarios, accompanied to a lesser extent by high and medium levels. As land use changes intensify, a reduction in the high HQ level and an increase in the medium level become apparent. Furthermore, a notable decrease in the HQI is observed between the base period and 2030. This behavior is consistent with historical data for the study area, where it is reported that forest areas have decreased by 4.4% from 2014 to 2018; in contrast, urban and cultivated regions have recorded an increase of 7% and 2.3%, respectively [49]. However, compared to subsequent years, the percentage variations are less pronounced in the trend scenario (Figure 5a) than in the pessimistic scenario (Figure 5b).
When scrutinizing the HQI of grasslands, as depicted in Figure 6, it becomes evident that during the base period (2018), over 90% of the corresponding surface under this land cover exhibits an HQI classified as high, with less than 10% falling into the medium category. It is crucial to emphasize that the anticipated changes in future scenarios depict substantial reductions compared to the baseline.
In the trend scenario (Figure 6a), areas with a high HQI decrease to less than 40%, whereas in the pessimistic scenario (Figure 6b), high HQI levels cover only 1% of the area. These values are replaced by average habitat quality, influenced by anticipated changes in land use (such as crops and urban areas), which are expected to develop in the future, leading to a decline in ecological services. Similar declines are evident in the study conducted by [30].
Additionally, these areas could undergo significant improvements if converted into forested regions, as suggested in the study by [23]. However, it is essential to consider other factors, such as regional suitability (whether the region possesses the appropriate characteristics to support a specific habitat) and ecological adaptability, rather than solely focusing on increasing surface area to ensure an enhancement in habitat quality.
Regarding croplands (Figure 7), during the base period (2018), it is observed that 60% of the areas have a medium HQ index, while around 40% exhibit a low index. This land use type undergoes significant human interventions, impacting its natural conditions. As observed in future scenarios, cropland expansion decreases habitat quality [72] and contributes to substantial environmental damage [73]. In the InVEST model, this land cover is considered a threat due to the ongoing intensity of expanding activities.
Consequently, future projections indicate a notable increase in the low HQ index. While this decline in HQ aligns with existing literature [52,72], it is noteworthy that in other study areas, the opposite trend occurs, as indicated by the study conducted by [68], where cropland expansion results in an increase in habitat quality. This improvement in HQ may be attributed to policies aimed at safeguarding both the quantity and quality of arable land [74]. Therefore, replicating such policies in the study area in the future or considering modifications to the existing ordinance [62], which encompasses Reciprocal Water Agreements (ARAs) [63], could be valuable for extending protection to arable areas and enhancing their quality.
A study in similar basins to the study area [40] reported average values in croplands and indicated that the projected scenarios follow similar past trends. These results reduce approximately 20% in areas with high HQI values, while regions with low HQI increase by 11%.
Finally, concerning urban areas (Figure 8), the period spanning from 2018 to 2050 reveals prevailing values of the habitat quality index (HQ) categorized as low and very low in the urban land use coverage. The lower area of the study basin is predominantly occupied by urban and construction zones, addressing population growth needs. This occupation contributes to a decline in habitat quality due to the absence of natural spaces or the fragmentation of the few remaining habitats in the lower sub-basins. Similar findings align with results documented in the literature across different parts of the world [24,52,67,68,69,75,76]. Urban sprawl can significantly reduce areas with key natural habitat functions, including water bodies, wetlands, and forests, leading to a deterioration in habitat quality [77]. The escalating urbanization correlates with reduced habitat quality, reflecting established relationships between urban growth and habitat degradation [69,76]. Additionally, this surge in low habitat quality is linked to a decrease in biodiversity, as evidenced by the study conducted by [57] in the mountainous region of western China. The decline is attributed to intense human activities, such as cultivation and urban development.

3.3. Policy Implications

Assessing habitat quality in the Tabacay and Aguilán River sub-basins underscores political implications for the future, particularly in the face of two scenarios predicting changes in land cover and use. The findings advocate for reinforcing protective policies, such as Reciprocal Agreements for Water (ARAs), as outlined in the existing ordinance [62] by EMAPAL EP. Considering the anticipated adverse impacts in future scenarios, more stringent policies are urgently needed to curb urban and cropland expansion, particularly in identified critical zones, notably the Cubilán Protective Forest. Moreover, essential considerations include amending the existing ordinance, extending protection to arable areas while prioritizing habitat quality, and averting degradation in urban and cropland, similar to China’s development approach [74]. Policies should proactively address expected population densification, balanced development, and preserve existing ecosystems in the study area. Implementing these measures is crucial to counteract projected trends of declining habitat quality, ensure long-term sustainability, and safeguard vital ecosystem services in the region.

3.4. Limitations, Uncertainty, and Outlook

Despite the inherent limitations associated with the InVEST model’s HQ module, arising from the simplification of specific eco-geomorphological processes [35], the results obtained in the application of the model to the mountainous sub-basins of Tabacay and Aguilán Rivers are deemed valuable and reliable. This study marks a pioneering effort, utilizing the tool in a distinctive context, particularly the Andean region and páramo areas. Given the scarcity of similar analyses in the region, this study’s significance as a trailblazer is underscored, opening new avenues for future research in the Andean area employing this analytical tool for habitat quality evaluation. While result interpretation necessitates caution due to the model’s simplified nature, thorough comparisons with the global scientific literature enhance the credibility of the findings. This validation approach substantially contributes to affirming the applicability of the InVEST model in habitat management and land use planning in analogous mountain environments, offering a robust foundation for future research and management decisions.

4. Conclusions

This study offers a comprehensive assessment of the habitat quality in the Tabacay and Aguilán River sub-basins using the InVEST model to analyze the current conditions and future scenarios. Understanding how these changes develop over time is critical to managing these Andean ecosystems effectively. It also highlights the usefulness of advanced tools for evaluating environmental quality. The results show that changes in land use, such as urban expansion and intensification of agriculture, could harm habitat quality in future scenarios to 2050. During this period, a progressive decline in areas with high habitat quality has been observed, particularly in low-lying sub-catchment regions where urban growth and expansion of crops have fragmented natural ecosystems, leading to a reduction in connectivity, loss of biodiversity, and alteration of key ecosystem services.
The degree of habitat reduction showed a significant difference between the two future scenarios. While the trend scenario shows a gradual decline in habitat quality, the pessimistic scenario projects more serious losses, especially in cropland and urban areas. The most critical effects are expected in the lower sub-basins, where urban expansion and agricultural intensification increase fragmentation and a loss of ecological function. On the other hand, high-quality areas, such as the Cubilán Protective Forest, have greater resilience and maintain high HQI values in both scenarios. These results highlight the crucial role of conservation areas and sustainable land management practices (e.g., ARAs) in mitigating the negative impacts of land use changes and preserving key ecosystem services.
The results show the need for proactive political interventions. Strengthening existing conservation mechanisms, such as ARAs, and introducing stricter land use regulations could help mitigate the loss of habitats, especially in agricultural and urban expansion areas. Following the examples of successful international cases, habitat protection could be aligned with practices for adapting to land use and climate change. These actions to protect forest areas could promote other activities, such as reforestation, agroecological practices, and the application of nature-based solutions to restore degraded habitats, improve landscape connectivity, and enhance the capacity of local communities to adapt to environmental change, reconciling ecological conservation with sustainable development.
Despite the simplified nature of the InVEST model, this study establishes a fundamental analysis of habitat dynamics in an Andean context. Climate-change-driven variability in temperature and rainfall patterns exacerbate habitat quality loss, so incorporating climate change assessments into future work could lead to a more holistic understanding of the ecosystems’ long-term vulnerability and drive more appropriate conservation strategies.
Finally, future studies should refine these projections further by involving additional ecological and socio-economic variables to ensure more robust decision making regarding land use planning and habitat preservation in the region.

Author Contributions

Conceptualization, L.G., D.X.Z. and A.A. (Alex Avilés); methodology, L.G. and D.X.Z.; software, L.G. and D.X.Z.; investigation, L.G. and D.X.Z.; resources, L.G., D.X.Z., A.A. (Ana Astudillo), X.P. and T.V.; data curation, L.G. and D.X.Z.; writing—original draft preparation, L.G. and D.X.Z.; writing—review and editing, L.G., D.X.Z., A.A. (Ana Astudillo), A.A. (Alex Avilés), X.P. and T.V.; supervision, D.X.Z. and A.A. (Alex Avilés). All authors have read and agreed to the published version of the manuscript.

Funding

This research received no external funding.

Data Availability Statement

The datasets underpinning the outcomes of this investigation can be obtained through a judicious request directed to the corresponding author.

Acknowledgments

The authors thank the Dirección de Vinculación and Vicerrectorado de Investigación de la Universidad de Cuenca and the EMAPAL EP for the support provided to the project “Seguridad Hídrica de la subcuenca del río Tabacay en tiempos de cambios globales”.

Conflicts of Interest

The authors declare no conflicts of interest.

References

  1. Sandhu, H.; Zhang, W.; Meinzen-Dick, R.; ElDidi, H.; Perveen, S.; Sharma, J.; Kaur, J.; Priyadarshini, P. Valuing ecosystem services provided by land commons in India: Implications for research and policy. Environ. Res. Lett. 2023, 18, 013001. [Google Scholar] [CrossRef]
  2. Šmid Hribar, M.; Hori, K.; Urbanc, M.; Saito, O.; Zorn, M. Evolution and new potentials of landscape commons: Insights from Japan and Slovenia. Ecosyst. Serv. 2023, 59, 101499. [Google Scholar] [CrossRef]
  3. Millennium Ecosystem Assessment. Ecosystems and Human Well-Being: Synthesis; Island Press: Washington, DC, USA, 2005. [Google Scholar]
  4. Garcia, V.; Márquez, C.; Rodríguez, M.; Orozco, J.; Aguilar, C.; Ríos, A. Páramo Ecosystems in Ecuador’s Southern Region: Conservation State and Restoration. Agronomy 2020, 10, 1922. [Google Scholar] [CrossRef]
  5. Buonocore, E.; Grande, U.; Franzese, P.P.; Russo, G.F. Trends and evolution in the concept of marine ecosystem services: An overview. Water 2021, 13, 2060. [Google Scholar] [CrossRef]
  6. Zhang, Z.; Li, T.; Li, L.; Li, S.; Rong, Y.; Bao, R.; Fu, X.; Tang, M.; Wu, G. Integrating ecosystem service importance and ecological sensitivity to identify priority areas for ecological conservation and restoration in Miyun Reservoir Basin. Int. J. Sustain. Dev. World Ecol. 2023, 30, 925–937. [Google Scholar] [CrossRef]
  7. Ma, L.; Zhu, Z.; Li, S.; Li, J. Analysis of spatial and temporal changes in human interference in important ecological function areas in China: The Gansu section of Qilian Mountain National Park as an example. Environ. Monit. Assess. 2023, 195, 1029. [Google Scholar] [CrossRef]
  8. Duan, X.; Chen, Y.; Wang, L.; Zheng, G.; Liang, T. The impact of land use and land cover changes on the landscape pattern and ecosystem service value in Sanjiangyuan region of the Qinghai-Tibet Plateau. J. Environ. Manag. 2023, 325, 116539. [Google Scholar] [CrossRef]
  9. Li, S.; Congmou, Z.; Li, Y.; Dong, B.; Tan, K.; Deng, X. Agricultural space function transitions in rapidly urbanizing areas and their impacts on habitat quality: An urban–Rural gradient study. Environ. Impact Assess. Rev. 2023, 99, 107019. [Google Scholar] [CrossRef]
  10. Liu, Y.; Yuan, X.; Li, J.; Qian, K.; Yan, W.; Yang, X.; Ma, X. Trade-offs and synergistic relationships of ecosystem services under land use change in Xinjiang from 1990 to 2020: A Bayesian network analysis. Sci. Total Environ. 2023, 858, 160015. [Google Scholar] [CrossRef]
  11. Admasu, S.; Yeshitela, K.; Argaw, M. Assessing habitat quality using the InVEST model in the Dire and Legedadi watersheds, central highland of Ethiopia: Implication for watershed management. Sustain. Environ. 2023, 9, 2242137. [Google Scholar] [CrossRef]
  12. Li, Y.; Liu, W.; Feng, Q.; Zhu, M.; Yang, L.; Zhang, J.; Yin, X. The role of land use change in affecting ecosystem services and the ecological security pattern of the Hexi Regions, Northwest China. Sci. Total Environ. 2023, 855, 158940. [Google Scholar] [CrossRef] [PubMed]
  13. Xie, X.; Zhu, Q. Research on the Impact of Urban Expansion on Habitat Quality in Chengdu. Sustainability 2023, 15, 6271. [Google Scholar] [CrossRef]
  14. Alaniz, A.J.; Carvajal, M.A.; Fierro, A.; Vergara-Rodríguez, V.; Toledo, G.; Ansaldo, D.; Moreira-Arce, D.; Rojas-Osorio, A.; Vergara, P.M. Remote-sensing estimates of forest structure and dynamics as indicators of habitat quality for Magellanic woodpeckers. Ecol. Indic. 2021, 126, 107634. [Google Scholar] [CrossRef]
  15. Zhu, C.; Zhang, X.; Zhou, M.; He, S.; Gan, M.; Yang, L.; Wang, K. Impacts of urbanization and landscape pattern on habitat quality using OLS and GWR models in Hangzhou, China. Ecol. Indic. 2020, 117, 106654. [Google Scholar] [CrossRef]
  16. Wu, P.; Dai, P.; Wang, M.; Feng, S.; Olhnuud, A.; Xu, H.; Li, X.; Liu, Y. Improving Habitat Quality at the Local and Landscape Scales Increases Wild Bee Assemblages and Associated Pollination Services in Apple Orchards in China. Front. Ecol. Evol. 2021, 9, 621469. [Google Scholar] [CrossRef]
  17. Ji, X.; Sun, Y.; Guo, W.; Zhao, C.; Li, K. Land use and habitat quality change in the Yellow River Basin: A perspective with different CMIP6-based scenarios and multiple scales. J. Environ. Manag. 2023, 345, 118729. [Google Scholar] [CrossRef]
  18. Mohammadyari, F.; Tavakoli, M.; Zarandian, A.; Abdollahi, S. Optimization land use based on multi-scenario simulation of ecosystem service for sustainable landscape planning in a mixed urban–Forest watershed. Ecol. Modell. 2023, 483, 110440. [Google Scholar] [CrossRef]
  19. Kovaleva, N. Ecology: Life in the “Unstable Biosphere”. In Reconsidering the Limits to Growth: A Report to the Russian Association of the Club of Rome; Springer: Berlin/Heidelberg, Germany, 2023; pp. 71–95. [Google Scholar]
  20. Mulinge, J. Effects of Environmental Change on Species Diversity. Int. J. Biol. 2023, 3, 43–53. [Google Scholar] [CrossRef]
  21. Jones, R.; Wilson, R.J.; Bourn, N.A.D.; Maclean, I.M.D. Patchy range retractions in response to climate change and implications for terrestrial species conservation. Landsc. Ecol. 2023, 38, 3003–3025. [Google Scholar] [CrossRef]
  22. Vasiliev, D.; Greenwood, S. The role of landscape connectivity in maintaining pollinator biodiversity needs reconsideration. Biodivers. Conserv. 2023, 32, 3765–3790. [Google Scholar] [CrossRef]
  23. Yang, Y. Evolution of habitat quality and association with land-use changes in mountainous areas: A case study of the Taihang Mountains in Hebei Province, China. Ecol. Indic. 2021, 129, 107967. [Google Scholar] [CrossRef]
  24. Xie, Z.X.; Zhang, B.; Shi, Y.T.; Zhang, X.Y.; Sun, Z.X. Changes and protections of urban habitat quality in Shanghai of China. Sci. Rep. 2023, 13, 10976. [Google Scholar] [CrossRef] [PubMed]
  25. Capriolo, A.; Boschetto, R.G.; Mascolo, R.A.; Balbi, S.; Villa, F. Biophysical and economic assessment of four ecosystem services for natural capital accounting in Italy. Ecosyst. Serv. 2020, 46, 101207. [Google Scholar] [CrossRef]
  26. Villa, F.; Ceroni, M.; Bagstad, K.; Johnson, G.; Krivov, S. ARIES (ARtificial Intelligence for Ecosystem Services): A New Tool for Ecosystem Services Assessment, Planning, and Valuation. In Proceedings of the 11th Annual BIOECON Conference on Economic Instruments to Enhance the Conservation and Sustainable Use of Biodiversity, Venice, Italy, 21–22 September 2009; pp. 1–10. Available online: http://scholar.google.com/scholar?hl=en&btnG=Search&q=intitle:ARIES+(+ARtificial+Intelligence+for+Ecosystem+Services+):+a+new+tool+for+ecosystem+services+assessment+,+planning+,+and+valuation+.#0 (accessed on 21 October 2024).
  27. Pei, X.; Yang, L.; Ji, W.; Cheng, X.; Lu, X. Global validation and comparison of MODIS DT and POLDER-3 GRASP aerosol products over ocean. Atmos. Res. 2023, 281, 106480. [Google Scholar] [CrossRef]
  28. Sherrouse, B.C.; Semmens, D.J.; Ancona, Z.H. Social Values for Ecosystem Services (SolVES): Open-source spatial modeling of cultural services. Environ. Model. Softw. 2022, 148, 105259. [Google Scholar] [CrossRef]
  29. Boumans, R.; Roman, J.; Altman, I.; Kaufman, L. The multiscale integrated model of ecosystem services (MIMES): Simulating the interactions of coupled human and natural systems. Ecosyst. Serv. 2015, 12, 30–41. [Google Scholar] [CrossRef]
  30. Wang, J.; Wu, Y.; Gou, A. Habitat quality evolution characteristics and multi-scenario prediction in Shenzhen based on PLUS and InVEST models. Front. Environ. Sci. 2023, 11, 1146347. [Google Scholar] [CrossRef]
  31. Zhao, J.; Shao, Z.; Xia, C.; Fang, K.; Chen, R.; Zhou, J. Ecosystem services assessment based on land use simulation: A case study in the Heihe River Basin, China. Ecol. Indic. 2022, 143, 109402. [Google Scholar] [CrossRef]
  32. Guo, K.; Niu, X.; Wang, B.; Xu, T.; Ma, X. Dynamic Changes in Habitat Quality and the Driving Mechanism in the Luoxiao Mountains Area from 1995 to 2020. Ecosyst. Health Sustain. 2023, 9, 0039. [Google Scholar] [CrossRef]
  33. Zhao, L.; Su, M.; Wang, X.; Li, X.; Chang, X.; Zhang, P. Spatial–Temporal Evolution and Prediction of Habitat Quality in Beijing–Tianjin–Hebei Region Based on Land Use Change. Land 2023, 12, 667. [Google Scholar] [CrossRef]
  34. Terrado, M.; Sabater, S.; Chaplin-Kramer, B.; Mandle, L.; Ziv, G.; Acuña, V. Model development for the assessment of terrestrial and aquatic habitat quality in conservation planning. Sci. Total Environ. 2016, 540, 63–70. [Google Scholar] [CrossRef] [PubMed]
  35. Sharp, R.; Tallis, H.T.; Ricketts, T.; Guerry, A.D.; Wood, S.A.; Chaplin Ennaanay, D.; Wolny, S.; Olwero, N.; Kramer, R.; Nelson, E.; et al. InVEST 3.2.0 User’s Guide; Stanford University: Stanford, CA, USA; University of Minnesota: Minneapolis, MN, USA; The Nature Conservancy: Arlington, VA, USA; World Wildlife Fund: New York, NY, USA, 2018. [Google Scholar]
  36. Arizapana-almonacid, M.A.; Pariona-antonio, V.H.; Cesar, J.; Mendoza, A.; Gómez, E.G.; Ramoni-perazzi, P.; Aurelio, M.; Pariona-antonio, V.H.; Cesar, J.; Mendoza, A.; et al. Land cover changes and comparison of current landscape metrics in a region of the Central Andes affected by population migration. Ann. GIS 2024, 30, 105–120. [Google Scholar] [CrossRef]
  37. Pérez-escobar, O.A.; Zizka, A.; Bermúdez, M.A.; Meseguer, A.S.; Condamine, F.L.; Hoorn, C.; Hooghiemstra, H.; Pu, Y.; Bogarín, D.; Boschman, L.M.; et al. The Andes through time: Evolution and distribution of Andean flora. Trends Plant Sci. 2022, 27, 364–378. [Google Scholar] [CrossRef] [PubMed]
  38. Upadhaya, S.; Dwivedi, P. Conversion of forestlands to blueberries: Assessing implications for habitat quality in Alabaha river watershed in Southeastern Georgia, United States. Land Use Policy 2019, 89, 104229. [Google Scholar] [CrossRef]
  39. Wei, Q.; Abudureheman, M.; Halike, A.; Yao, K.; Yao, L.; Tang, H.; Tuheti, B. Temporal and spatial variation analysis of habitat quality on the PLUS-InVEST model for Ebinur Lake Basin, China. Ecol. Indic. 2022, 145, 109632. [Google Scholar] [CrossRef]
  40. Yohannes, H.; Soromessa, T.; Argaw, M.; Dewan, A. Spatio-temporal changes in habitat quality and linkage with landscape characteristics in the Beressa watershed, Blue Nile basin of Ethiopian highlands. J. Environ. Manag. 2021, 281, 111885. [Google Scholar] [CrossRef]
  41. Wu, J.; Luo, J.; Zhang, H.; Qin, S.; Yu, M. Projections of land use change and habitat quality assessment by coupling climate change and development patterns. Sci. Total Environ. 2022, 847, 157491. [Google Scholar] [CrossRef]
  42. González, A.M.; Bayly, N.J.; Wilson, S.; Hobson, K.A. Shade coffee or native forest? Indicators of winter habitat quality for a long-distance migratory bird in the Colombian Andes. Ecol. Indic. 2021, 131, 108115. [Google Scholar] [CrossRef]
  43. Montaño-Centellas, F.A.; Muñoz, J.; Mangini, G.G.; Ausprey, I.J.; Newell, F.L.; Jones, H.H.; Fanjul, M.E.; Tinoco, B.A.; Colorado, G.J.Z.; Cahill, J.R.A.; et al. Network structure of avian mixed-species flocks decays with elevation and latitude across the Andes. Philos. Trans. R. Soc. B Biol. Sci. 2023, 378, 2022.0099. [Google Scholar] [CrossRef]
  44. Gonzalez, A.M.; Espejo, N.; Armenteras, D.; Hobson, K.A.; Kardynal, K.J.; Mitchell, G.W.; Mahony, N.; Bishop, C.A.; Negret, P.J.; Wilson, S. Habitat protection and restoration: Win–win opportunities for migratory birds in the Northern Andes. Perspect. Ecol. Conserv. 2023, 21, 33–40. [Google Scholar] [CrossRef]
  45. Plazas, S.B.; Diaz, P.R.S. Dispersion of seeds at night and day in sub-Andean forests, Cueva Los Guacharos Park, Colombia. Rev. Biol. Trop. 2023, 71, 1–10. [Google Scholar] [CrossRef]
  46. Castillejo, P.; Ortiz, S.; Jijón, G.; Lobo, E.A.; Heinrich, C.; Ballesteros, I.; Rios-Touma, B. Response of macroinvertebrate and epilithic diatom communities to pollution gradients in Ecuadorian Andean rivers. Hydrobiologia 2024, 851, 431–446. [Google Scholar] [CrossRef]
  47. Haro-Carrión, X.; Johnston, J.; Bedoya-Durán, M.J. Landscape structure and seasonality: Effects on wildlife species richness and occupancy in a fragmented dry forest in coastal Ecuador. Remote Sens. 2021, 13, 3762. [Google Scholar] [CrossRef]
  48. Ojala-barbour, R.; Brito, J.; Teska, W.R. A comparison of small mammal communities in two High-Andean Polylepis woodlands in Ecuador Community of small mammals Polylepis Andean forest Comparación de la comunidad de mamíferos pequeños en dos bosques alto andino de Polylepis, prístino y disturbado. ACI 2019, 11, 208–221. [Google Scholar]
  49. Zhiña, D.X.; Avilés, A.; González, L.; Astudillo, A.; Astudillo, J.; Matovelle, C. Effects of Climate Change and Changes in Land Use and Cover on Water Yield in an Equatorial Andean Basin. Hydrology 2024, 11, 157. [Google Scholar] [CrossRef]
  50. EMAPAL EP. Proteger el Ambiente y Fuentes de Agua del Cubilán, un Compromiso de la EMAPAL-EP. 2019. Available online: https://www.emapal.gob.ec/2021/10/20/proteger-el-ambiente-y-fuentes-de-agua-del-cubilan-un-compromiso-de-la-emapal-ep/ (accessed on 10 January 2025).
  51. EMAPAL EP. Delimitación de Área de Protección Hídrica en las Microcuencas de los Ríos Aguilán y Tabacay; EMAPAL EP: Azogues, Ecuador, 2020. [Google Scholar]
  52. Wang, B.; Cheng, W. Effects of Land Use/Cover on Regional Habitat Quality under Different Geomorphic Types Based on InVEST Model. Remote Sens. 2022, 14, 1279. [Google Scholar] [CrossRef]
  53. Liu, F.-T.; Xu, E.-Q. Comparison of spatial-temporal evolution of habitat quality between Xinjiang Corps and Non-corps Region based on land use. J. Appl. Ecol. 2020, 31, 2341–2351. [Google Scholar] [CrossRef]
  54. Berta Aneseyee, A.; Noszczyk, T.; Soromessa, T.; Elias, E. The InVEST Habitat Quality Model Associated with Land Use/Cover Changes: A Qualitative Case Study of the Winike Watershed in the Omo-Gibe Basin, Southwest Ethiopia. Remote Sens. 2020, 12, 1103. [Google Scholar] [CrossRef]
  55. Li, X.; Liu, Z.; Li, S.; Li, Y. Multi-Scenario Simulation Analysis of Land Use Impacts on Habitat Quality in Tianjin Based on the PLUS Model Coupled with the InVEST Model. Sustainability 2022, 14, 6923. [Google Scholar] [CrossRef]
  56. Xiao, P.; Zhou, Y.; Li, M.; Xu, J. Spatiotemporal patterns of habitat quality and its topographic gradient effects of Hubei Province based on the InVEST model. Environ. Dev. Sustain. 2023, 25, 6419–6448. [Google Scholar] [CrossRef]
  57. Gong, J.; Xie, Y.; Cao, E.; Huang, Q.; Li, H. Integration of InVEST-habitat quality model with landscape pattern indexes to assess mountain plant biodiversity change: A case study of Bailongjiang watershed in Gansu Province. J. Geogr. Sci. 2019, 29, 1193–1210. [Google Scholar] [CrossRef]
  58. MAE-MAGAP. Protocolo Metodológico Para la Elaboración del Mapa de Cobertura y Uso de la Tierra del Ecuador Continental 2013–2014, Escala 1:100000; MAE-MAGAP: Quito, Ecuador, 2015. [Google Scholar]
  59. Espinoza-Mendoza, V. Dinámica EGO: Una Herramienta Gratuita Para Modelar y Brindar Soporte en el Análisis de CCUS. Bol. Col. Geógr. Perú 2016, 3, 148–164. Available online: https://cgp.org.pe/publicaciones/boletin3/B3-08.pdf (accessed on 5 July 2024).
  60. Li, T.; Bao, R.; Li, L.; Tang, M.; Deng, H. Temporal and Spatial Changes of Habitat Quality and Their Potential Driving Factors in Southwest China. Land 2023, 12, 346. [Google Scholar] [CrossRef]
  61. Li, M.; Zhou, Y.; Xiao, P.; Tian, Y.; Huang, H.; Xiao, L. Evolution of habitat quality and its topographic gradient effect in northwest hubei province from 2000 to 2020 based on the invest model. Land 2021, 10, 857. [Google Scholar] [CrossRef]
  62. GAD del Cantón Azogues. Ordenanza para la Conservación, Restauración y Recuperación de las Fuentes de Agua, Zonas de Recarga Hídrica, Ecosistemas Frágiles y Otras Áreas Prioritarias para la Protección de la Biodiversidad, los Servicios Ambientales y el Patrimonio Natural del can; GAD del Cantón Azogues: Azogues, Ecuador, 2014; p. 27. [Google Scholar]
  63. Mora Bernal, A.; Ávila-Larrea, J.; Bonilla, P. Los Acuerdos Recíprocos por Agua como herramienta para la participación ciudadana y el desarrollo local. Ius Com. 2022, 5, 99–114. [Google Scholar]
  64. Martinez, A.; Matovelle-Bustos, C.M.; Astudillo, L. Geographic Information Systems in the protection of water resources in the micro-basin of Tabacay River, Ecuador. Kill. Técnica 2019, 3, 1–10. [Google Scholar] [CrossRef]
  65. Pinos-Morocho, D.; Morales-Matute, O.; Durán-López, M.E. Suelos de páramo: Análisis de percepciones de los servicios ecosistémicos y valoración económica del contenido de carbono en la sierra sureste del Ecuador. Rev. Cienc. Ambient. 2021, 55, 157–179. [Google Scholar] [CrossRef]
  66. Newbold, T.; Hudson, L.N.; Hill, S.L.L.; Contu, S.; Lysenko, I.; Senior, R.A.; Börger, L.; Bennett, D.J.; Choimes, A.; Collen, B.; et al. Global effects of land use on local terrestrial biodiversity. Nature 2015, 520, 45–50. [Google Scholar] [CrossRef]
  67. Sallustio, L.; De Toni, A.; Strollo, A.; Di Febbraro, M.; Gissi, E.; Casella, L.; Geneletti, D.; Munafò, M.; Vizzarri, M.; Marchetti, M. Assessing habitat quality in relation to the spatial distribution of protected areas in Italy. J. Environ. Manag. 2017, 201, 129–137. [Google Scholar] [CrossRef]
  68. Ding, Q.; Chen, Y.; Bu, L.; Ye, Y. Multi-scenario analysis of habitat quality in the yellow river delta by coupling flus with invest model. Int. J. Environ. Res. Public Health 2021, 18, 2389. [Google Scholar] [CrossRef]
  69. Zhu, J.; Ding, N.; Li, D.; Sun, W.; Xie, Y.; Wang, X. Spatiotemporal analysis of the nonlinear negative relationship between urbanization and habitat quality in metropolitan areas. Sustainability 2020, 12, 669. [Google Scholar] [CrossRef]
  70. Tang, F.; Fu, M.; Wang, L.; Zhang, P. Land-use change in Changli County, China: Predicting its spatio-temporal evolution in habitat quality. Ecol. Indic. 2020, 117, 106719. [Google Scholar] [CrossRef]
  71. Wu, L.; Sun, C.; Fan, F. Estimating the characteristic spatiotemporal variation in habitat quality using the invest model—A case study from guangdong–hong kong–macao greater bay area. Remote Sens. 2021, 13, 1008. [Google Scholar] [CrossRef]
  72. Dai, L.; Li, S.; Lewis, B.J.; Wu, J.; Yu, D.; Zhou, W.; Zhou, L.; Wu, S. The influence of land use change on the spatial–temporal variability of habitat quality between 1990 and 2010 in Northeast China. J. For. Res. 2019, 30, 2227–2236. [Google Scholar] [CrossRef]
  73. Foley, J.A.; DeFries, R.; Asner, G.P.; Barford, C.; Bonan, G.; Carpenter, S.R.; Chapin, F.S.; Coe, M.T.; Daily, G.C.; Gibbs, H.K.; et al. Global consequences of land use. Science 2005, 309, 570–574. [Google Scholar] [CrossRef]
  74. Wu, Y.; Shan, L.; Guo, Z.; Peng, Y. Cultivated land protection policies in China facing 2030: Dynamic balance system versus basic farmland zoning. Habitat Int. 2017, 69, 126–138. [Google Scholar] [CrossRef]
  75. Zhang, S.; Jin, C.; Pan, X.; Wei, L.; Shao, H. Coastal land use change and evaluation of ecosystem services value enhancement under the background of Yangtze River protection: Taking Jiangyin coastal areas as an example. Front. Environ. Sci. 2023, 11, 1088816. [Google Scholar] [CrossRef]
  76. Guo, R.; Lyu, S.; Feng, J. The Effects of Urban Landscape Pattern Evolution on Habitat Quality Based on InVEST Model. Int. Rev. Spat. Plan. Sustain. Dev. 2023, 11, 5–25. [Google Scholar] [CrossRef]
  77. Wang, H.; Tang, L.; Qiu, Q.; Chen, H. Assessing the impacts of urban expansion on habitat quality by combining the concepts of land use, landscape, and habitat in two Urban agglomerations in China. Sustainability 2020, 12, 4346. [Google Scholar] [CrossRef]
Figure 1. Geographical placement of the Aguilán and Tabacay River sub-basins.
Earth 06 00010 g001
Figure 2. Distribution of land use types in the study area for various scenarios: (a) 2030, (b) 2040, (c) 2050 (trend scenarios); (d) 2030, (e) 2040, (f) 2050 (pessimistic scenarios); and (g) 2018 (base scenario).
Earth 06 00010 g002
Figure 3. Distribution patterns of the HQI across different periods and scenarios, including the trend scenario, (a) 2030, (b) 2040, (c) 2050, the pessimistic scenario, (d) 2030, (e) 2040, (f) 2050, and (g) the baseline period of 2018.
Earth 06 00010 g003
Figure 4. Distribution of the HQI for each LULC: (a) trend scenario and (b) pessimistic scenario.
Earth 06 00010 g004
Figure 5. Distribution of the HQI coverage for the mixed forest: (a) trend scenario and (b) pessimistic scenario.
Earth 06 00010 g005
Figure 6. Distribution of the HQI coverage for grassland coverage: (a) trend scenario and (b) pessimistic scenario.
Earth 06 00010 g006
Figure 7. Distribution of the HQI coverage for cropland coverage: (a) trend scenario and (b) pessimistic scenario.
Earth 06 00010 g007
Figure 8. Distribution of the HQI coverage for the urban coverage: (a) trend scenario and (b) pessimistic scenario.
Earth 06 00010 g008
Table 1. Assignment of weight and maximum distance of the influence of threat factors.
ThreatsMaximum Distance
(km)
WeightSpatial Decay
Type
Cultivated land2.00.7linear
Urban land1.01.0exponential
Table 2. Sensitivity of different land types to hazard factors.
Land UseHabitat
Suitability
Threats
Cultivated
Land
Urban
Land
Wooded grassland0.80.40.7
Cropland0.60.20.5
Open shrubland0.10.10
Urban and built up000
Wetland0.90.50.8
Mixed forest1.00.70.6
Disclaimer/Publisher’s Note: The statements, opinions and data contained in all publications are solely those of the individual author(s) and contributor(s) and not of MDPI and/or the editor(s). MDPI and/or the editor(s) disclaim responsibility for any injury to people or property resulting from any ideas, methods, instructions or products referred to in the content.

