Article

An Improved Method for Measuring the Distribution of Water Droplets in Crude Oil Based on the Optical Microscopy Technique

1
State Key Laboratory of Bioreactor Engineering, School of Chemistry and Molecular Engineering, East China University of Science and Technology, Shanghai 200237, China
2
MOE Engineering Research Center of Microbial Enhanced Oil Recovery, East China University of Science and Technology, 130 Meilong Road, Shanghai 200237, China
3
Guangdong Provincial Key Laboratory of Materials and Technologies for Energy Conversion, Guangdong Technion-Israel Institute of Technology, 241 Daxue Road, Shantou 515063, China
4
Environmental Science and Engineering Group, Guangdong Technion-Israel Institute of Technology, 241 Daxue Road, Shantou 515063, China
*
Author to whom correspondence should be addressed.
Laboratories 2025, 2(1), 1; https://doi.org/10.3390/laboratories2010001
Submission received: 4 December 2024 / Revised: 17 December 2024 / Accepted: 19 December 2024 / Published: 25 December 2024

Abstract

:
The distribution of water droplets in crude oil is one of the key issues involved in the processes of oil extraction and transportation, and these water droplets might also be habitats for microorganisms in oil reservoirs. However, it is still a challenge to observe and measure the distribution of water droplets in crude oil quickly and directly. In this work, an improved method based on the optical microscopy technique is introduced, which is named the Plate Pressing (PP) method and can observe and determine the distribution of water droplets in crude oil directly. The reliability of this method was verified by comparing the results with those of a computed tomography (CT) scan, indicating that the PP method can measure the distribution of water droplets accurately. Meanwhile, the total number and size distribution of water droplets in three crude oil samples from different oilfields were obtained by the PP method, which consolidated the idea that the PP method is capable of determining the distribution of the water droplets in crude oil directly and is suitable for the statistical analysis of water droplets in multiple samples of crude oil.

1. Introduction

Although water and crude oil are often considered as two immiscible phases, crude oil generally contains water droplets due to the existence of natural interfacial active substances (mainly asphaltenes) in crude oil [1,2,3]. Water droplets may be generated during crude oil exploration and transportation [4,5], as the turbulence and agitation may introduce water droplets into the oil phase [6,7,8,9]. However, water droplets in crude oil are undesirable for the petroleum industry, as they can significantly increase the viscosity of crude oil, resulting in high pressure in the pipelines [10]. The presence of water droplets also causes the corrosion of crude oil transportation pipelines, highly increasing the costs related to crude oil transportation and processing units [11,12]. Although these water droplets adversely affect crude oil recovery and transportation [13], a high concentration of water droplets dispersed in crude oil can actually facilitate flocculation and coalescence, leading to positive effects on removal of water droplets [14]. Therefore, the water content and droplet size distribution have a significant effect on the rheological properties of crude oil [12,15].
Water droplets may also exist in the oil leg in subsurface oil reservoirs [16]. Meckenstock et al. proposed that water droplets in crude oil might be a habitat for microorganisms [17]. They found that the oil might ascend directly from the subsurface oil reservoir to the surface along with entrapped water droplets (1 to 3 μL). Moreover, a growing number of studies have detected microorganisms in the oil samples collected from subsurface oil reservoirs [17,18,19,20,21,22]. Hence, in addition to the oil–water transition zone (OWTZ), water droplets inside the crude oil could be another hotspot for microbial growth and oil biodegradation [18,21,22,23]. Knowledge regarding the distribution of water droplets in crude oil is also required for a further understanding of the environment of oil reservoirs [21,24].
Many techniques have been used to measure the distribution of water droplets in crude oil, generally based on electromagnetic scattering, ultrasonic waves, and image acquisition. For instance, near-infrared spectroscopy (NIR) requires calibration and multivariate data analysis techniques [25,26], and nuclear magnetic resonance (NMR) measures the droplet distribution by function fitting [27,28]. Although a CT scan can observe and measure the spatial distribution of droplets simultaneously, it is expensive and time-consuming, and the resolution of digital images is inversely proportional to the sample size [29,30]. These methods typically require laboratory facilities, sophisticated instruments, and trained manpower, and it is still difficult to combine the measurement and visualization of water droplet distribution in crude oil [31]. Some acoustic and optical measurement methods have been used for in situ industrial practice, including particle video microscopy (PVM) and focused beam reflectance measurement (FBRM), but it is difficult to distinguish individual droplets [31,32,33,34,35].
In this paper, we report an improved method to determine the distribution of water droplets in crude oil based on the optical microscopy technique. This method is named the plate pressing (PP) method, and it can observe and measure the number and size of water droplets in crude oil simultaneously. To prove the reliability of this method, we compared the results with those of a CT scan. Three crude oil samples from different oilfields in China were analyzed by the PP method, and the size and number distributions of water droplets in the crude oil samples were obtained.

2. Experimental Section

2.1. Materials

The materials used in this experiment were aluminum foil, glass plates, cell counting plates (177-112C, Watson, Tokyo, Japan), a water bath, syringes (10 μL, 100 μL, 200 μL, 1000 μL), microscope slides (Sail Brand, Shanghai, China), copper sheets (0.05 mm, 0.1 mm, 0.2 mm), 0.1 mm silicone sheets, a light source (VL120RGB, Ulanzi, China), a tripod (GA268TB2, Benro, China), a camera (ILCE-6400, Sony, Tokyo, Japan), a camera lens (SEL30M35, Sony, Japan), Imaging Edge Desktop software (v1.2.01.04031, Sony, Japan), ImageJ 1.53c software (National Institutes of Health, USA), and OriginPro 2024b software (v10.1.5.132, OriginLab, Northampton, MA, USA).
Six crude oil samples from three oilfields in China were analyzed by the PP method, including Daqing Oilfield, Changqing Oilfield, and Shengli Oilfield. The characteristics of the sampled oil reservoirs are listed in Table 1. Crude oil samples were all collected directly from the production valve of the pipeline at the well head. Sample P241 was used to determine the experimental parameters of the PP method, and samples P241, N8Q, and Pu172 were analyzed by CT scan to verify the reliability of the PP method.

2.2. Preliminary Experiment to Observe Water Droplets in Crude Oil

Three different methods were used to observe water droplets in the crude oil samples. As stated in previous research, water droplets can be observed and separated from oil by spreading the oil on aluminum foil at room temperature [17]. In addition, two other independently developed methods were also used to observe water droplets in the crude oil, which involved freezing and diluting the crude oil. The details of freezing crude oil are as follows: (1) four silicone gaskets with a thickness of 4 mm adhered to a glass plate, after which we transferred 30 mL crude oil to the plate and fixed the crude oil using another glass plate; (2) we tilted the oil sample plate for 2~3 h to dehydrate the crude oil by gravity; (3) the oil sample plate was frozen for 3~4 h, during which the water droplets in the crude oil were frozen into ice crystals; (4) we opened the plate and scraped off the surface oil, at which point the ice crystals (water droplets) in the crude oil were easy to observe. Additionally, the method of diluting crude oil is as follows: (1) crude oil was diluted with mineral oil to increase its fluidity and transparency—the volume ratio of crude oil and mineral oil was 4:1; (2) we transferred 9 μL oil samples to a cell counting plate, where the water droplets trapped in the crude oil were observed by microscope.

2.3. Plate Pressing (PP) Method

Crude oil with a high water content will expel lots of water after being pressed, according to our experience. The coalescence of water droplets may make the measurement of water droplet distribution inaccurate, so the dehydration of oil samples is necessary. Considering the process of oil exploration and the environment of underground oil reservoirs, crude oil should be heated at the temperature of oil reservoirs (about 46 °C). The specific steps of sample preparation include the following: Through nitrogen flushing, move crude oil into a 100 mL beaker and seal it, then place the beaker in a 46 °C water bath for 24 h. The oil sample should then be allowed to naturally cool to room temperature and solidify. The upper layer of the beaker is the dehydrated crude oil which can be used for further analysis, and the lower layer is the heated water, the volume of which can be measured by a pipette gun.
The procedure of plate pressing mainly includes three parts: sampling, pressing the oil sample, and taking photos. Firstly, 0.05 mL crude oil was extracted by syringes from 5 different positions within the surface layer, middle layer, and bottom layer of the oil phase. The sampling height of the middle layer was 0.4~0.6 times the liquid level height of the oil phase. In total, each crude oil sample was parallelly analyzed 15 times.
The second step was to press these oil samples. We placed two silicone shims with a fixed thickness on the edge of a microscope slide, and transferred the oil sample to the slide. We covered the oil with another microscope slide, then the slide was tilted and pressed down onto the crude oil slowly to avoid bubbles [36]. Hence, the oil sample plate was obtained for further analysis. Finally, the oil sample plate needed to be photographed as soon as possible. We laid out a scale ruler and the oil sample plates horizontally on a stable light source, then used a camera to take photos. All photos were processed with the ImageJ software to measure the distribution of water droplets in crude oil using the following process: open the picture, set the scale, change the image mode to grayscale (8-bit), set the threshold, select brushes, and analyze the particles. Notably, all the materials and parameters involved in the PP method, including sampling amount and location, should be set to reflect the distribution of water droplets accurately and can be adjusted according to specific needs.

3. Results and Discussion

3.1. Appearance of Water Droplets Trapped in Crude Oil

As shown in Figure 1, the presence of water droplets in crude oil sample P241 was verified using three different methods. In addition to the method mentioned in the literature (Figure 1a), we also developed two new methods to observe water droplets. Inside crude oil that has been frozen and broken apart, ice crystals (water droplets) can be observed (Figure 1b). Additionally, crude oil can be diluted with kerosene to make it lighter in color, so water droplets inside the crude oil are also revealed (Figure 1c).
The right section of Figure 1 shows the appearance of observed water droplets in crude oil. Water droplets were presented on the surface of crude oil by spreading the oil; ice crystals were observed after freezing the crude oil; and water droplets in the diluted crude oil were observed with a microscope. These results indicated that the crude oil samples generally contained a large amount of water droplets, but the distribution of droplets in crude oil cannot be directly measured through the above methods.

3.2. Water Droplet Distribution in the Crude Oil

Inspired by the method of freezing crude oil mentioned in Figure 1b, we developed the PP method to measure the distribution of water droplets in crude oil, which is simple to operate and suitable for multi-sample statistics. A schematic diagram of the PP method is shown in Figure 2, and the experimental details are described in the Experimental Section.

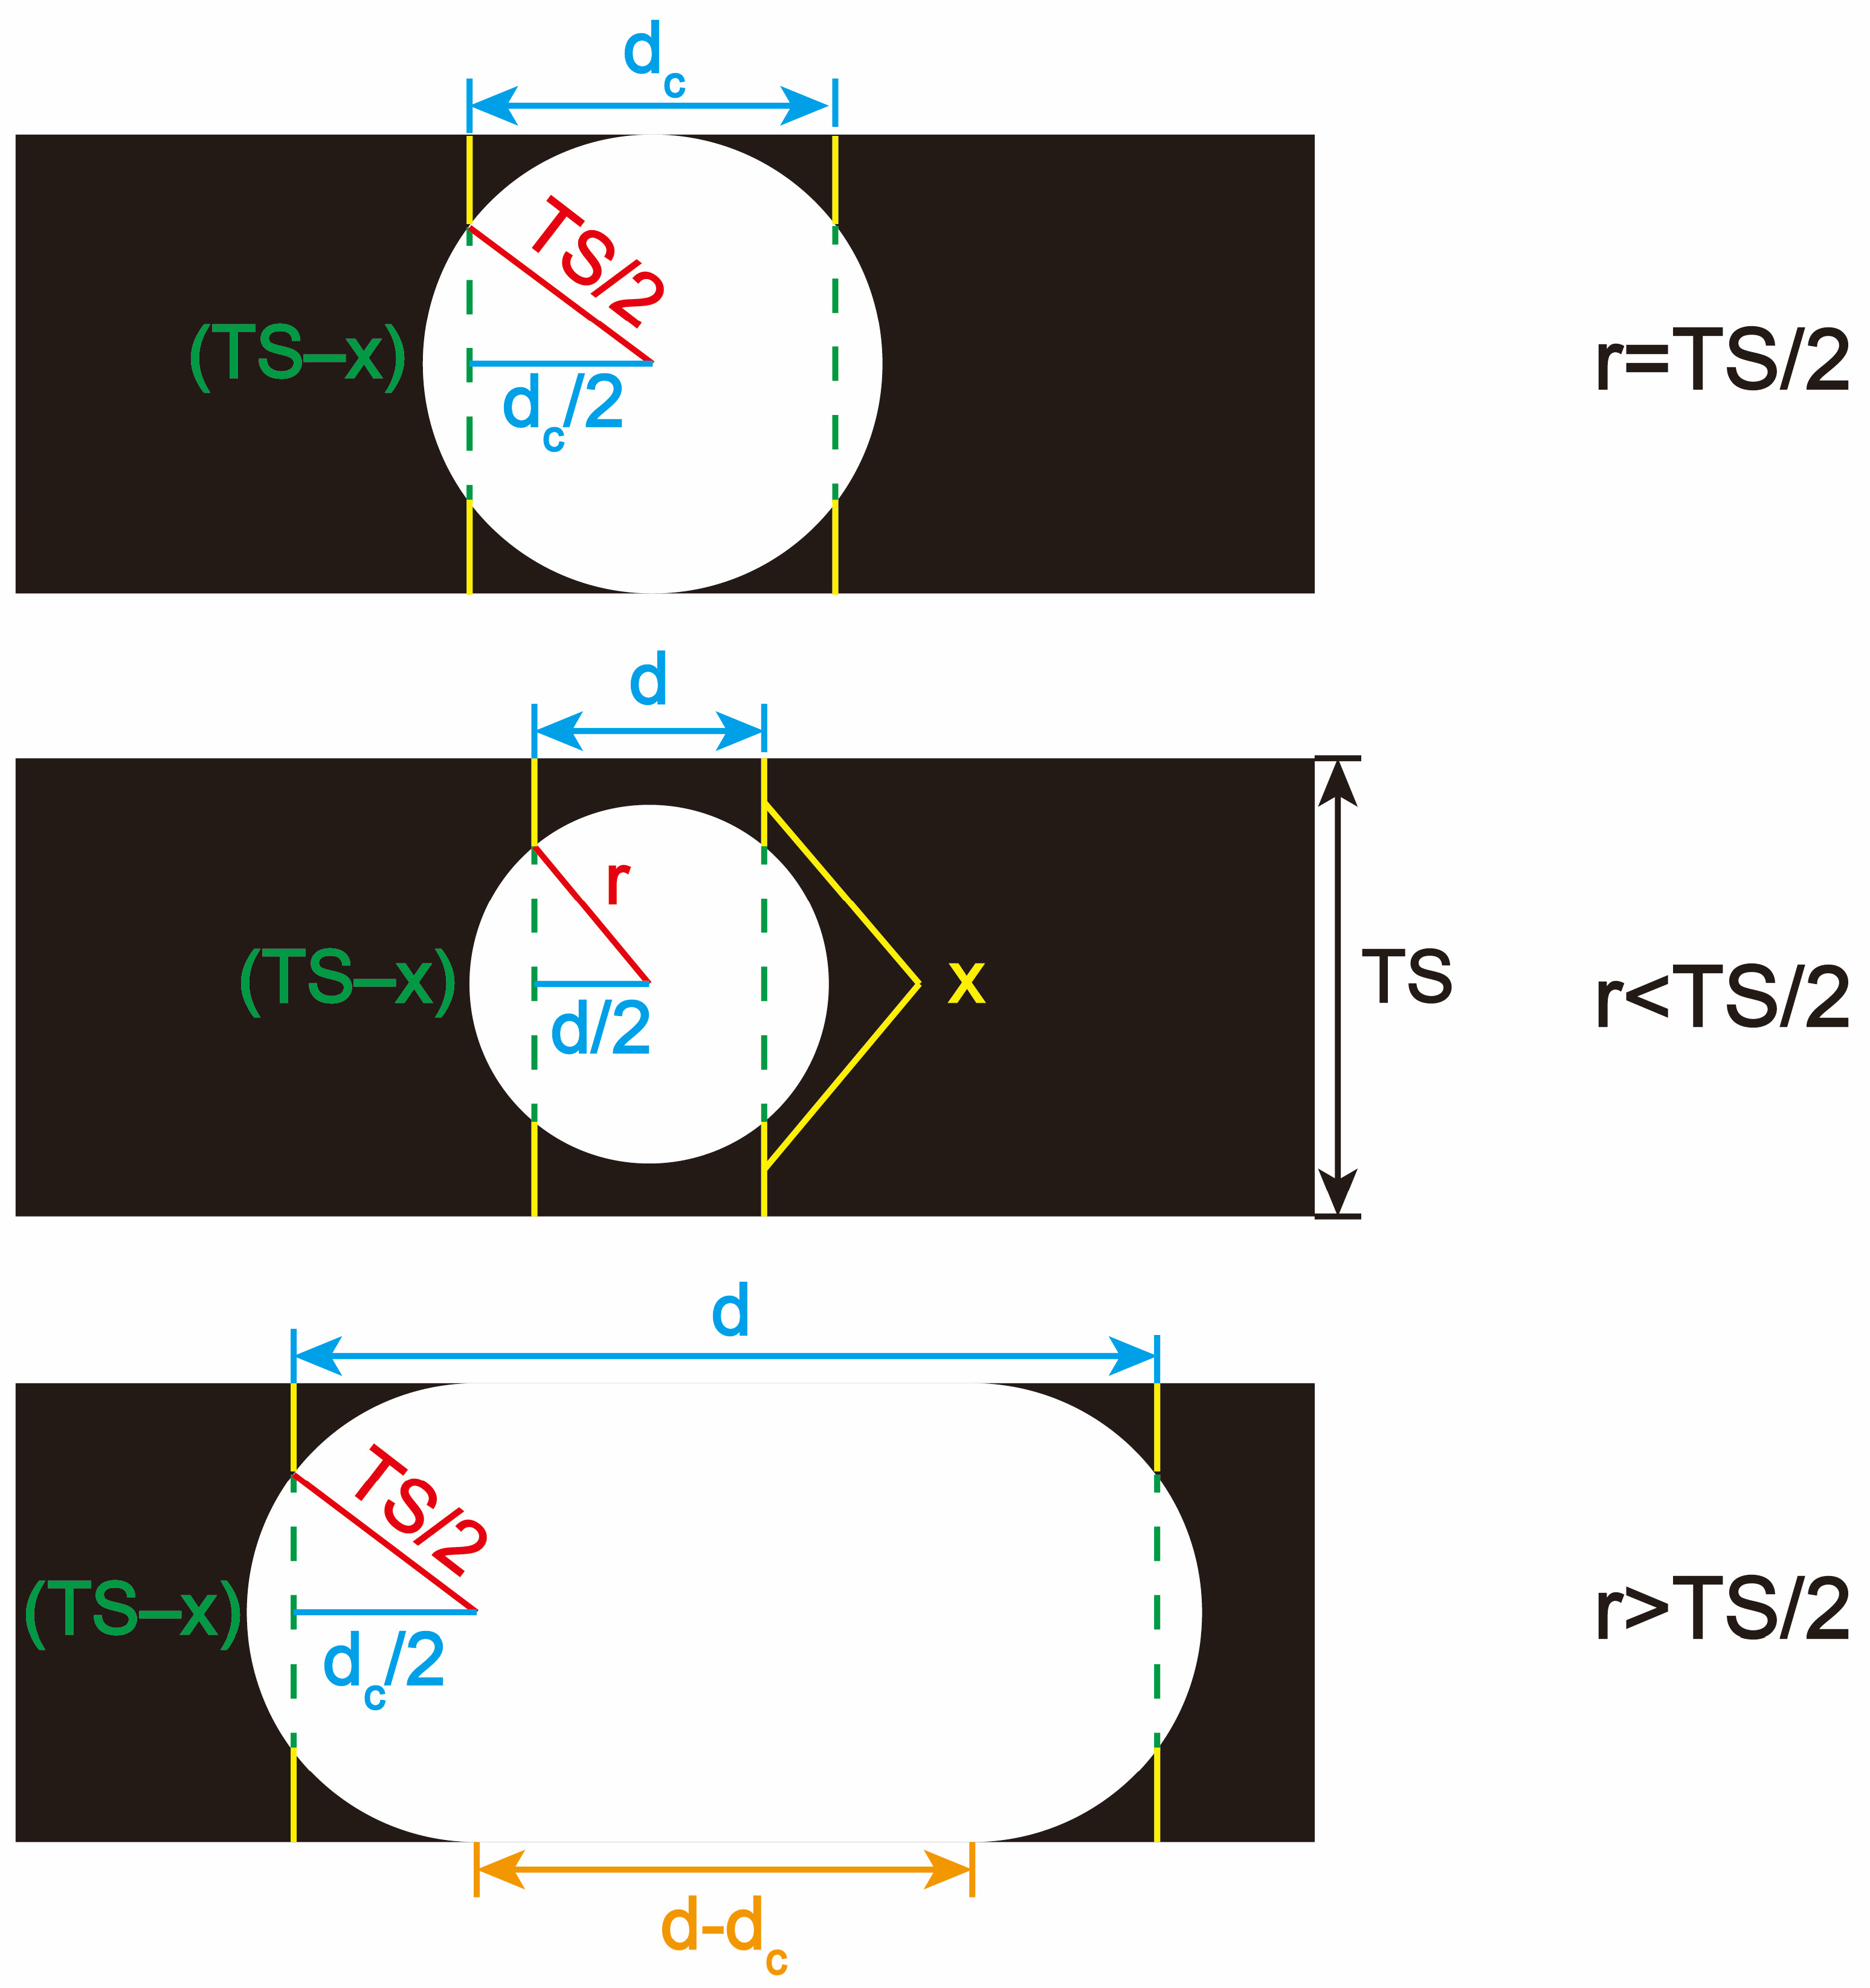
3.3. Data Processing for the PP Method

Water droplets in the crude oil samples appeared as transparent spots on the surface of the oil sample plates after being treated by the PP method (Supplementary Materials). Therefore, the black background in each photo is crude oil, and the water droplets inside appear as bright spots. The content, number, and size of the bright spots in the photos can be measured simultaneously by the ImageJ software, which reflects the distribution of the water droplets. Firstly, the scale bar in ImageJ was calibrated three times based on the photo of the scale ruler [37]. The transmitted light intensity was quantified by converting color images to grayscale, and the threshold was set to define the minimum detected light intensity. However, the transmitted light intensity varies with the distance over which the light travels in the crude oil layer; a certain threshold and the thickness of shims (TS) could determine the minimum detectable droplet size. The same threshold should be set with the same light source, sample, and environment.
Figure 3 is a schematic diagram of the calculation and analysis process. According to the Laplace equation [38], water droplets in crude oil are theoretically spherical. Therefore, if a threshold was set to detect the light transmitted through crude oil with a thickness ≤x, the minimum diameter of the detectable droplets would be (TS-x). When the diameters of water droplets are equal to TS, the radius of the water droplets is TS/2, and the critical diameter (dc) of the detected bright spots is calculated by Formula (1). If the diameter of the bright spots is less than dc, the diameter of the corresponding water droplets is greater than (TS-x) and less than TS; the calculation formula of the radius (r) of the water droplets is shown in Formula (2). For bright spots with diameters greater than dc, the diameter of the corresponding water droplets is greater than TS, and their radius (Rwd) can be calculated using the spherical volume formula (3). The content, total number, and diameter of the water droplets were integrated and analyzed by the Origin software (v10.1.5.132) to describe the distribution of water droplets in the crude oil.
d c = 2 ( T S 2 ) 2 ( T S x 2 ) 2
r = ( T S x 2 ) 2 + ( d 2 ) 2
V w d = 4 3 π ( T S 2 ) 3 + π T S ( d d c 2 ) 2 = 4 3 π R w d 3
where r and Rwd represent the radius of the water droplets, TS is the thickness of the shims, x is the distance over which the light travels in the crude oil layer, d is the diameter of the detected light spots, dc is the critical diameter of the detected light spots, and Vwd is the volume of the water droplets.

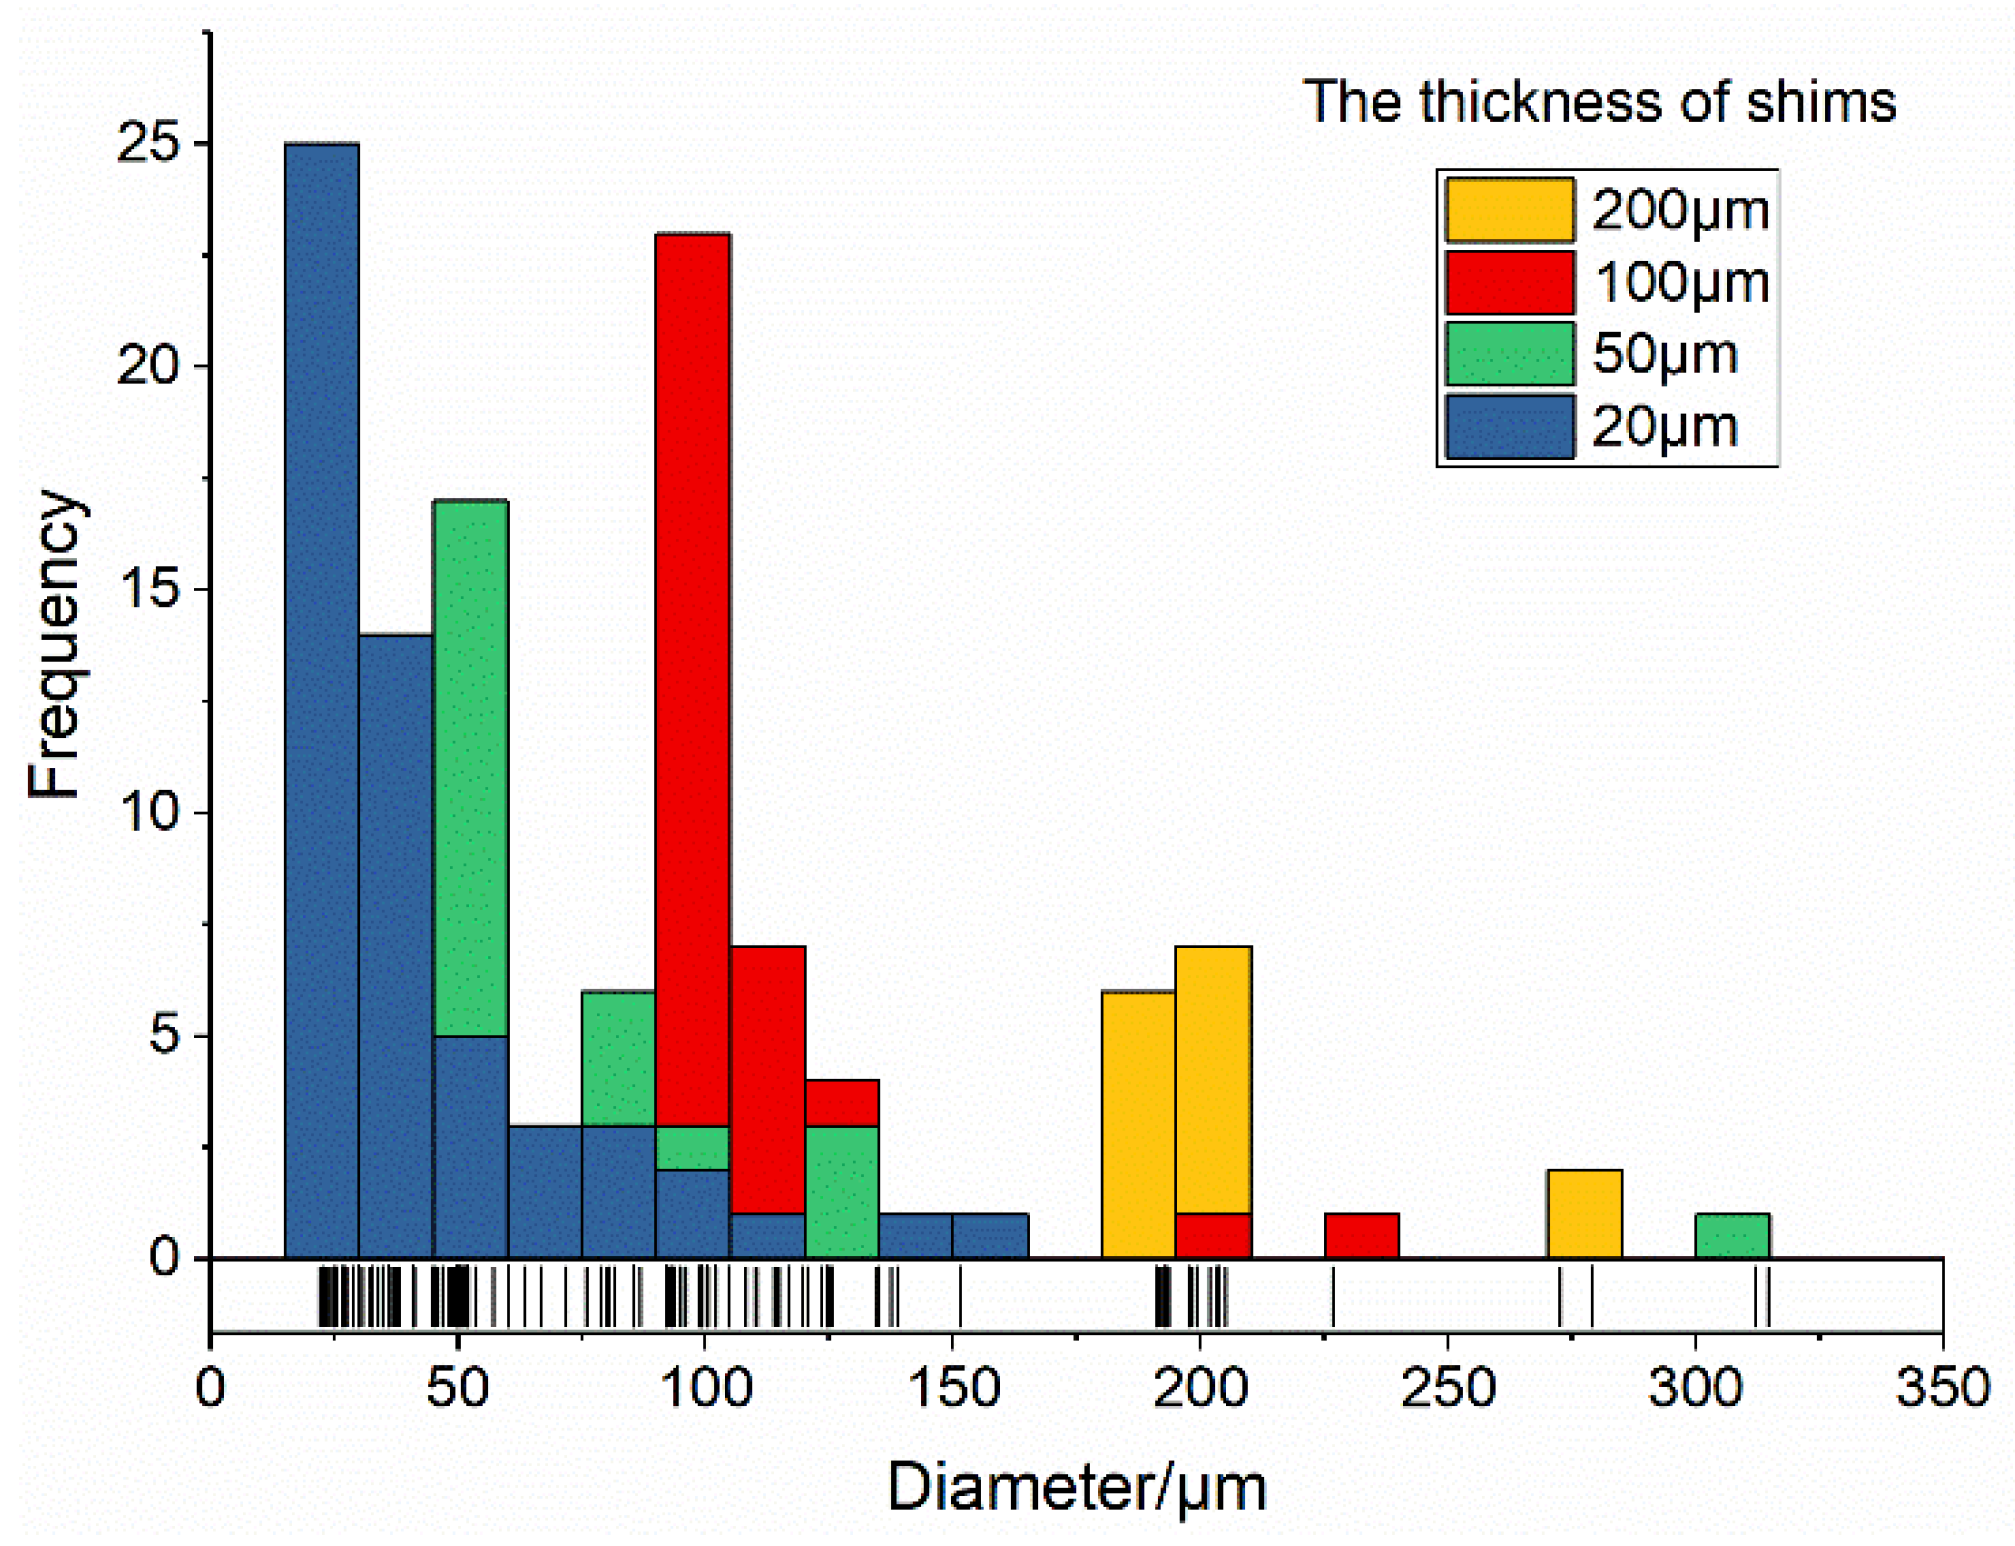
3.4. Determination of the Experimental Conditions for the PP Method

The size range of the detected water droplets was different when shims with different thicknesses were used for the PP method. To find the most suitable TS for reflecting the distribution of water droplets, copper sheets with various thicknesses were utilized and the threshold was set to detect the light that passed through ≤10 μm of crude oil. The copper sheets were cut into rectangles and flattened, and the TS could be increased by stacking additional sheets (right section in Figure 2). Repeated samples were collected at the same point of the same crude oil samples for analysis. Limited by the size of the microscope slide, a large sample volume resulted in crude oil overflow during the process of plate pressing, making it impossible to quantitatively measure the number of water droplets in the crude oil. Therefore, when the TS is greater than or equal to 100 μm, the sample volume should be 0.05 mL, and 0.02 mL of crude oil should be taken for the PP method when the TS is less than 100 μm.
The threshold for crude oil sample P241 from Daqing Oilfield was set to 10, so water droplets with diameters larger than (TS-10) μm were detected. As shown in Figure 4, no water droplets were observed when 400 μm shims were used for the PP method. When the TS was 200 μm, only 16 water droplets were found in 0.15 mL crude oil, and the diameter of most droplets was about 202.5 μm. Water droplets with diameters of 97.5 μm and 52.5 μm were most abundant when the TS was 100 μm or 50 μm. The maximum number of water droplets was detected in the oil samples when the TS was 20 μm, and their diameters were mainly concentrated around 22.5 μm. Given the relatively small sample size, the TS of 20 μm and 50 μm were excluded to prevent sampling bias. Moreover, the distribution of small droplets might be neglected if the 200 μm shims were used for the PP method, so the shim with 100 μm thickness was suitable for the PP method in this study. Furthermore, the threshold in this study was set to detect water droplets with diameters ≥ 50 μm.

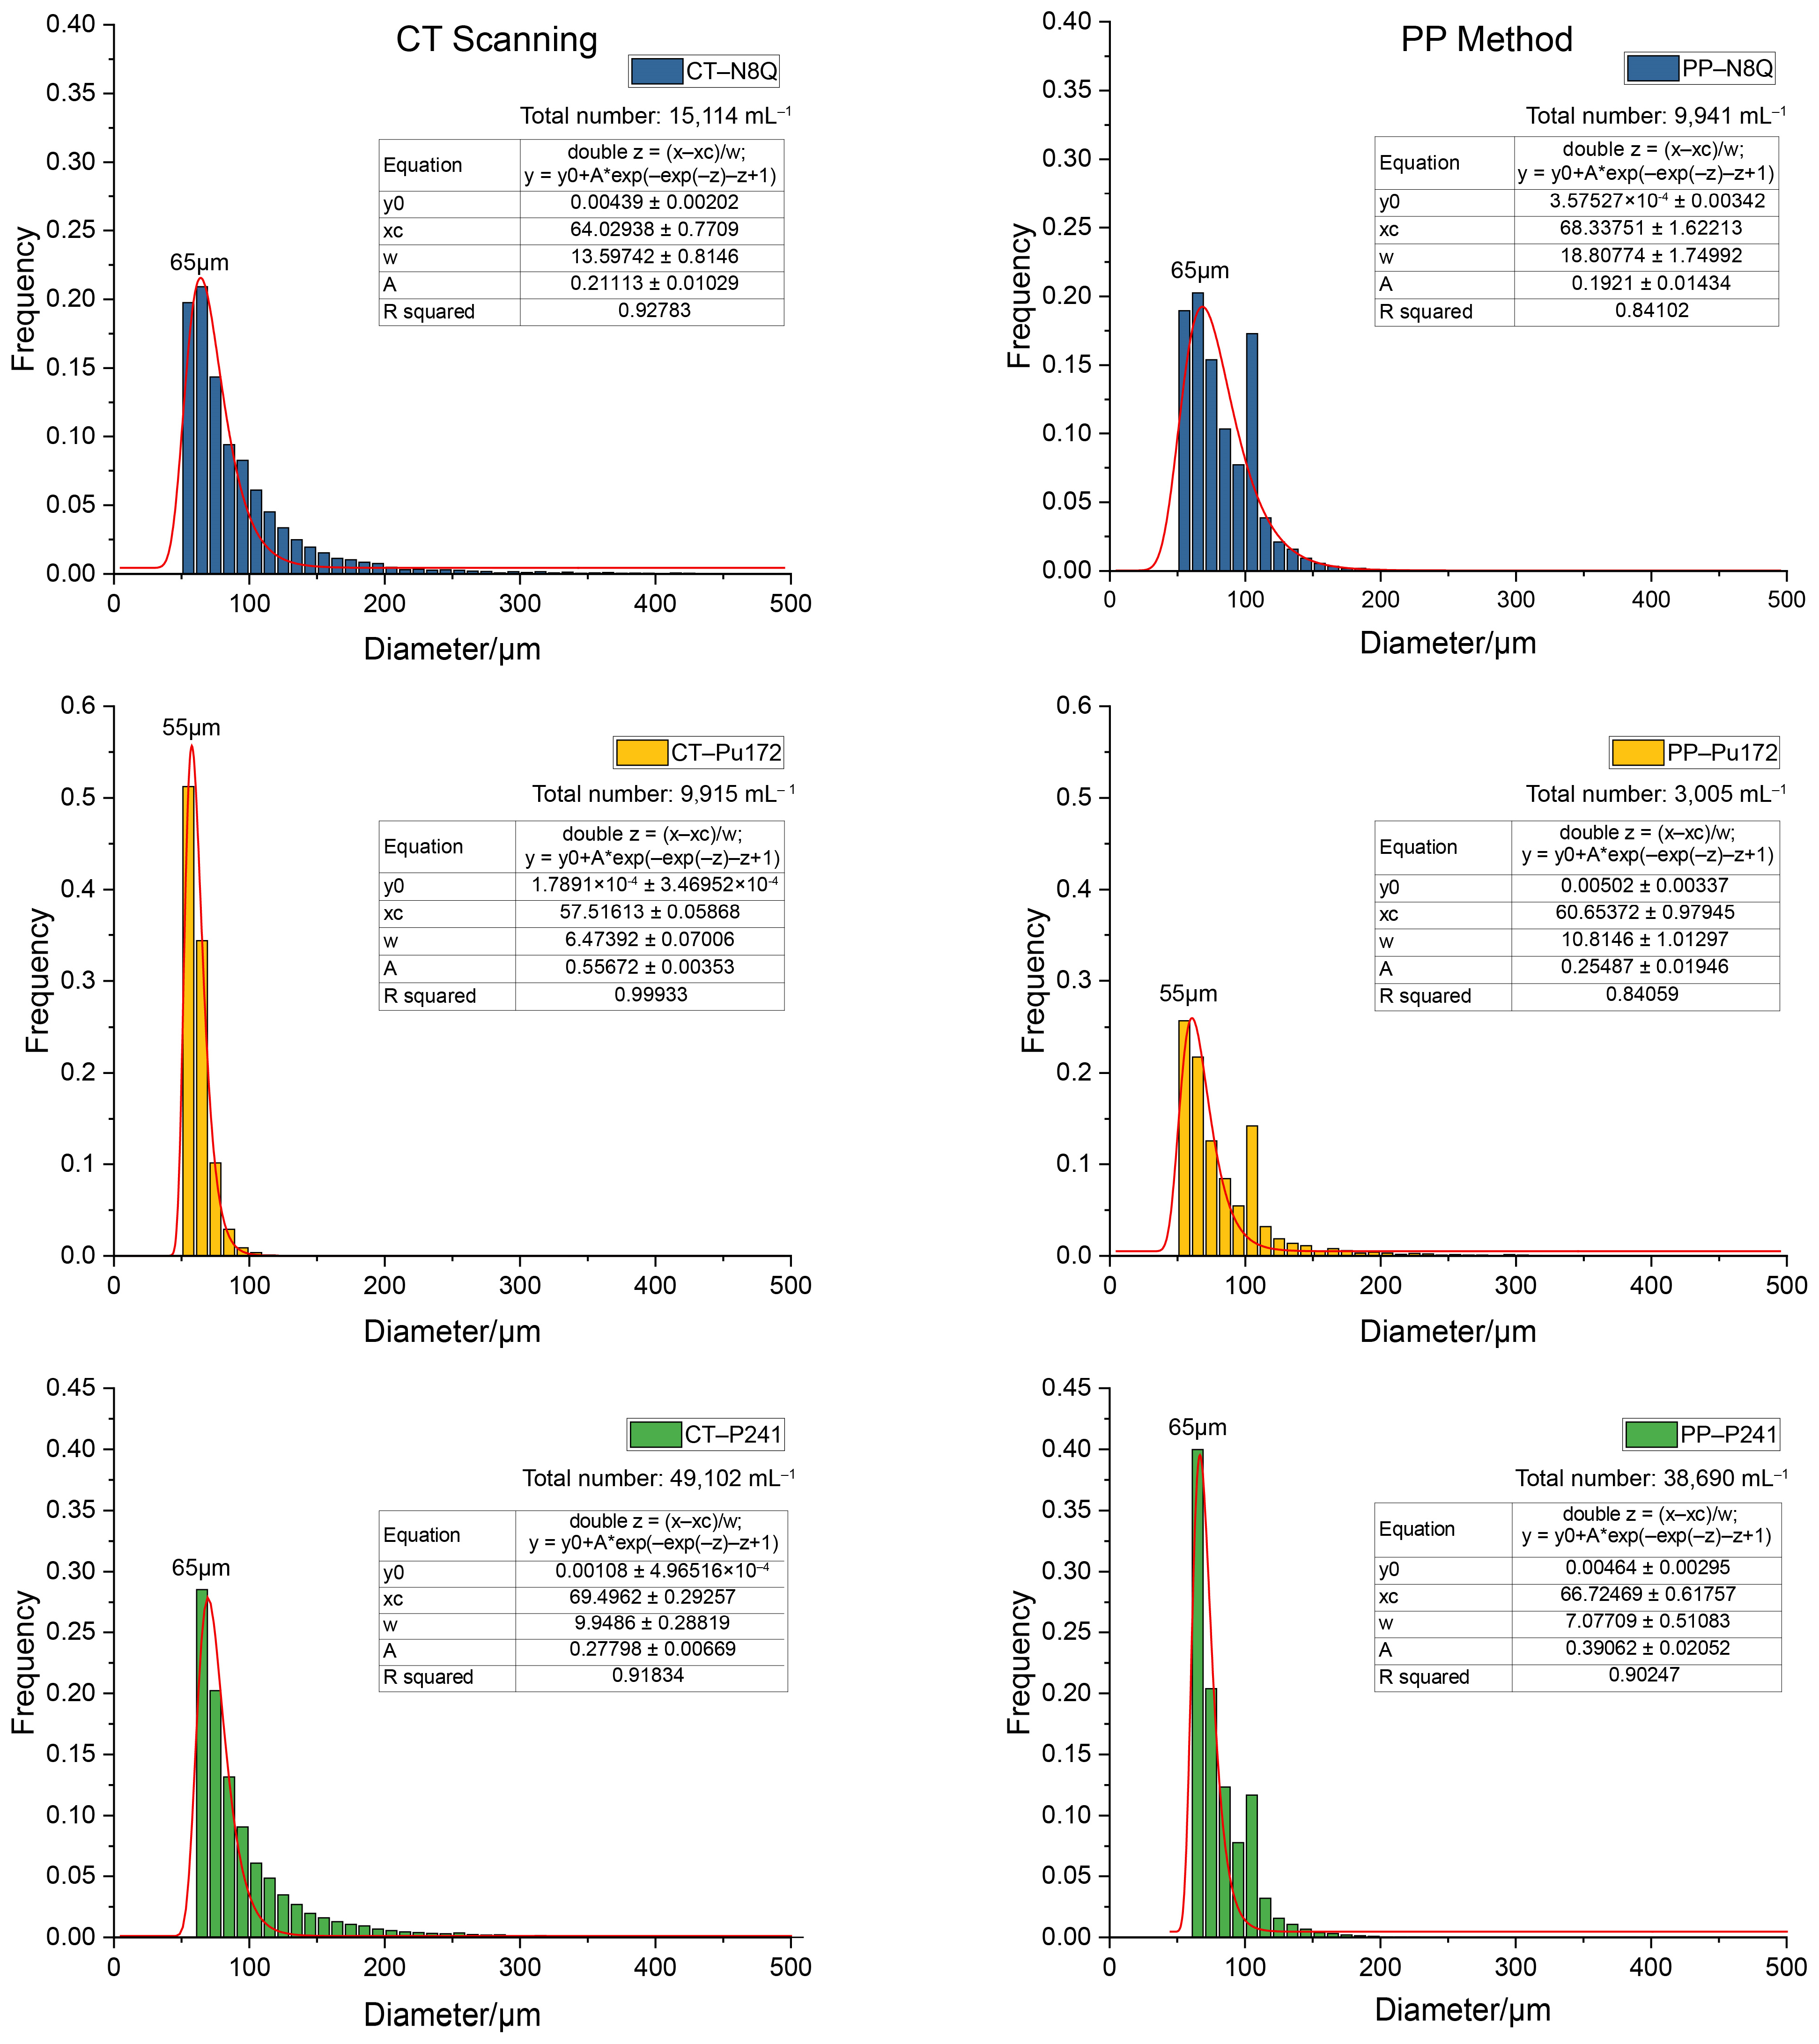
3.5. Reliability Analysis of the PP Method

Water droplets and bubbles in crude oil are transparent, so they both appear as bright spots in the photos, making it difficult to distinguish them. To determine whether there were any bubbles introduced during the process of pressing crude oil, three types of crude oil samples (completely dehydrated oil, dehydrated oil, and untreated oil) were treated by the PP method (Figure 5). Crude oil from N8Q was placed in a water bath at 46 °C for 24 h or at 80 °C for 4 h to obtain the dehydrated and completely dehydrated oil samples, respectively [39,40,41,42].
Each oil sample was pressed under standard operation and all experiments were repeated three times with consistent results. The most abundant bright spots were found in untreated crude oil, and fewer spots were observed in the dehydrated oil samples. The completely dehydrated oil samples were pressed three times and no bright spots were observed, suggesting that no water droplets or bubbles were present in the completely dehydrated oil samples—this result illustrates that almost no bubbles are introduced under the standard operation.
Error bars are unavailable for the PP method because each sample can only be tested once. Therefore, to verify the reliability of the PP method, the distributions of water droplets in the crude oil analyzed by the PP method were compared with those detected by CT scanning. The CT scanning technique is a nondestructive testing method that determines the spatial distribution of droplets in emulsions [43]. For this, 2 mL of each oil sample from three oil wells with/without water injection (N8Q, Pu172, and P241, see Experimental Section for details) was added into a 2 mL centrifuge tube and analyzed by high-resolution 3D X-ray microcomputed tomography (nanoVoxel-2000 system; Sanying Precision Instruments Co., Ltd., Tianjing, China). The thresholds of the N8Q, Pu172, and P241 oil samples were set to 55, 50, and 65, respectively, for the PP method. The size of the detected water droplets in crude oil is related to the threshold, so the distributions of water droplets with a diameter > 50 μm obtained by both methods were compared. Also, in our case, we are more interested in water droplets with large sizes in crude oil, which may provide enough space for the microorganisms in crude oil to grow and reproduce [20]. To describe the distribution of water droplets, simple statistical distribution models such as Gaussian distribution, normal Weibull distribution, and generalized extreme value (GEV) distribution were used to fit the data obtained from a CT scan, and the GEV distribution offered the best fit [44]. As shown in Figure 6, the parameters (xc) of the generalized extreme value distributions of the same sample were similar, revealing that the diameter distributions of water droplets that were obtained by the PP method were similar to those obtained by CT scanning. Most water droplets detected by both methods have the same diameters (65 μm, 55 μm, and 65 μm). Therefore, regardless of whether the oil sample was taken from a waterflooded reservoir, the distribution of water droplets in it can be measured accurately using the PP method.
There is no doubt that CT scanning has advantages in detecting the distribution of small water droplets in crude oil, but the volume of oil samples is limited. However, the PP method has no requirements for the sample volume, and the accuracy of the PP method can be easily controlled by the TS and threshold, which can also be adjusted according to the user’s needs. Moreover, the PP method is cheaper and simpler to operate than a CT scan, which implies its potential to test large numbers of samples on site.

3.6. Distribution of Water Droplets in Crude Oil from Different Oil Reservoirs

We also analyzed three crude oil samples from different oil reservoirs using the PP method. No water was released from any of the three crude oil samples after being heated at 46 °C for 24 h. The thresholds of oil samples from SS5301, Y19, and 35-454 were set to 35, 25, and 25, respectively. As shown in Figure 7, the total numbers of water droplets in the crude oil samples from SS5301 and Y19 were 158 droplets/mL and 167 droplets/mL, and most water droplets had a diameter of 55 μm. Crude oil samples from 35-454 contained approximately 4265 water droplets per milliliter of oil, and the diameter of most water droplets was mainly concentrated around 105 μm. These results revealed that a large number of water droplets were trapped in the crude oil. Moreover, according to the high-pressure environment of oil reservoirs, it is also reasonable to assume that there would be more water droplets in the oil phase than the statistics indicate. And the presence of water droplets provides the possibility for the existence of microorganisms in oil legs in oil reservoirs [26,28,45,46,47].
The distribution of water droplets in crude oil from different oil reservoirs can be measured by the PP method. However, we tested many oil samples and found that oil samples with poor fluidity are more suitable for the PP method. When using the PP method, flowing crude oil will cover the regions of water droplets (bright spots), making the calculation of the droplet size inaccurate. Hence, we recommend operating at low temperatures if it is necessary to detect the flowing crude oil. Theoretically, the application scenarios of the PP method could be expanded to detect droplet distribution in emulsions, as long as there is a difference in transmittance between the emulsions and the droplets. This speculation still requires further experimental verification.

4. Conclusions

In summary, based on the transparency difference between water droplets and crude oil, we proposed a modified optical method (the PP method) to observe and measure the distribution of water droplets in crude oil directly. This method involves pressing the oil with two microscope slides so that the water droplets trapped in the crude oil appear on the surface, and the total number and size distribution of water droplets in the crude oil are consequently obtained by taking photos and performing image processing. The reliability of this method was verified by comparing the results with those of a CT scan. Additionally, three crude oil samples from different oil reservoirs were collected and analyzed using the PP method, revealing that large amounts of water droplets are dispersed in crude oil. Compared to existing methods, the PP method is easier to operate and the results are more intuitive. Also, only a small sample size is required for this new method, and all the experimental parameters can be adjusted according to the samples and experimental conditions. However, it is also important to acknowledge that the PP method has some limitations. Our method is not suitable for heavy oil and works best with conventional crude oil, as it shows excellent repeatability towards droplets with a diameter larger than 50 μm. In a word, the PP method could not only be developed into an on-site method to determine the distribution of water droplets in crude oil, but it could also be further used to detect the droplet distribution in other oil/water emulsions.

Supplementary Materials

The following supporting information can be downloaded at: https://www.mdpi.com/article/10.3390/laboratories2010001/s1, Photos of crude oil at different shims.

Author Contributions

B.M. and J.G. conceived the project. Q.W. designed this study, performed the experiments, and interpreted the results. All authors contributed to the scientific discussion and manuscript revisions. All authors have read and agreed to the published version of the manuscript.

Funding

This work was supported by the National Natural Science Foundation of China (grant no. 42061134011, 42173076, and 52074129), the Natural Science Foundation of Shanghai (grant no. 21ZR1417400), the Fundamental Research Funds for the Central Universities (no. JKJ01241714), and the Research Program of State Key Laboratory of Bioreactor Engineering.

Informed Consent Statement

Not applicable.

Data Availability Statement

Data will be made available on request.

Conflicts of Interest

The authors declare that they have no known competing financial interests or personal relationships that could have appeared to influence the work reported in this paper.

References

  1. Jia, L.; Zhong, L.; Ge, H.; Shen, Y. Effect of crude oil self-emulsification on the recovery of low permeability reservoir after well soaking. J. Pet. Sci. Eng. 2023, 220, 111201. [Google Scholar] [CrossRef]
  2. Kokal, S. Crude-Oil Emulsions: A State-Of-The-Art Review. SPE Prod. Facil. 2005, 20, 5–13. [Google Scholar] [CrossRef]
  3. Sjöblom, J.; Mhatre, S.; Simon, S.; Skartlien, R.; Sørland, G. Emulsions in external electric fields. Adv. Colloid. Interface Sci. 2021, 294, 102455. [Google Scholar] [CrossRef] [PubMed]
  4. Langevin, D.; Poteau, S.; Hénaut, I.; Argillier, J.F. Crude Oil Emulsion Properties and Their Application to Heavy Oil Transportation. Oil Gas Sci. Technol. 2004, 59, 511–521. [Google Scholar] [CrossRef]
  5. Tim, T. Schowalter (2). Mechanics of Secondary Hydrocarbon Migration and Entrapment. Am. Assoc. Pet. Geol. Bull. 1979, 63, 723–760. [Google Scholar] [CrossRef]
  6. Umar, A.A.; Saaid, I.B.M.; Sulaimon, A.A.; Pilus, R.B.M. A review of petroleum emulsions and recent progress on water-in-crude oil emulsions stabilized by natural surfactants and solids. J. Pet. Sci. Eng. 2018, 165, 673–690. [Google Scholar] [CrossRef]
  7. Rane, J.P.; Harbottle, D.; Pauchard, V.; Couzis, A.; Banerjee, S. Adsorption kinetics of asphaltenes at the oil-water interface and nanoaggregation in the bulk. Langmuir 2012, 28, 9986–9995. [Google Scholar] [CrossRef] [PubMed]
  8. Czarnecki, J.; Moran, K. On the stabilization mechanism of water-in-oil emulsions in petroleum systems. Energy Fuels 2005, 19, 2074–2079. [Google Scholar] [CrossRef]
  9. Kilpatrick, P.K. Water-in-crude oil emulsion stabilization: Review and unanswered questions. Energy Fuels 2012, 26, 4017–4026. [Google Scholar] [CrossRef]
  10. Mironova, M.V.; Ilyin, S.O. Effect of silica and clay minerals on rheology of heavy crude oil emulsions. Fuel 2018, 232, 290–298. [Google Scholar] [CrossRef]
  11. Brauner, N.; Ullmann, A. Modeling of phase inversion phenomenon in two-phase pipe flows. Int. J. Multiph. Flow 2002, 28, 1177–1204. [Google Scholar] [CrossRef]
  12. Abdulredha, M.M.; Hussain, S.A.; Abdullah, L.C.; Hong, T.L. Water-in-oil emulsion stability and demulsification via surface-active compounds: A review. J. Pet. Sci. Eng. 2022, 209, 109848. [Google Scholar] [CrossRef]
  13. Subramanian, D.; May, N.; Firoozabadi, A. Functional Molecules and the Stability of Water-in-Crude Oil Emulsions. Energy Fuels 2017, 31, 8967–8977. [Google Scholar] [CrossRef]
  14. Chen, W.S.; Chen, Z.Y.; Chang, J.Y.; Chen, C.Y.; Zeng, Y.P. Ultrasound-assisted desalination of crude oil: The influence of mixing extent, crude oil species, chemical demulsifier and operation variables. Ultrason. Sonochem. 2022, 83, 105947. [Google Scholar] [CrossRef] [PubMed]
  15. Zadymova, N.M.; Skvortsova, Z.N.; Traskin, V.Y.; Yampol’skaya, G.P.; Mironova, M.V.; Frenkin, E.I.; Kulichikhin, V.G.; Malkin, A.Y. Heavy oil as an emulsion: Composition, structure, and rheological properties. Colloid J. 2016, 78, 735–746. [Google Scholar] [CrossRef]
  16. Nguyen, N.N.; Berger, R.; Butt, H.J. Premelting-Induced Agglomeration of Hydrates: Theoretical Analysis and Modeling. ACS Appl. Mater. Interfaces 2020, 12, 14599–14606. [Google Scholar] [CrossRef] [PubMed]
  17. Meckenstock, R.U.; von Netzer, F.; Stumpp, C.; Lueders, T.; Himmelberg, A.M.; Hertkorn, N.; Schmitt-Kopplin, P.; Harir, M.; Hosein, R.; Haque, S.; et al. Water droplets in oil are microhabitats for microbial life. Science 2014, 345, 673–676. [Google Scholar] [CrossRef]
  18. Pannekens, M.; Kroll, L.; Müller, H.; Mbow, F.T.; Meckenstock, R.U. Oil reservoirs, an exceptional habitat for microorganisms. N. Biotechnol. 2019, 49, 1–9. [Google Scholar] [CrossRef]
  19. Natalia, I.; de Oliveir, V.M. Microbial Hydrocarbon Degradation: Efforts to Understand Biodegradation in Petroleum Reservoirs. In Biodegradation—Engineering and Technology; InTech: London, UK, 2013. [Google Scholar] [CrossRef]
  20. Pannekens, M.; Voskuhl, L.; Meier, A.; Müller, H.; Haque, S.; Frösler, J.; Brauer, V.S.; Meckenstock, R.U. Densely populated water droplets in heavy-oil seeps. Appl. Environ. Microbiol. 2020, 86, e00164-20. [Google Scholar] [CrossRef]
  21. Cai, M.; Nie, Y.; Chi, C.-Q.; Tang, Y.-Q.; Li, Y.; Wang, X.-B.; Liu, Z.-S.; Yang, Y.; Zhou, J.; Wu, X.-L. Crude oil as a microbial seed bank with unexpected functional potentials. Sci. Rep. 2015, 5, 16057. [Google Scholar] [CrossRef] [PubMed]
  22. Liang, B.; Zhang, K.; Wang, L.-Y.; Liu, J.-F.; Yang, S.-Z.; Gu, J.-D.; Mu, B.-Z.; Liang, B.; Zhang, K.; Wang, L.-Y.; et al. Different diversity and distribution of archaeal community in the aqueous and oil phases of production fluid from high-temperature petroleum reservoirs. Front. Microbiol. 2018, 9, 841. [Google Scholar] [CrossRef] [PubMed]
  23. Zhou, Z.; Liang, B.; Wang, L.-Y.; Liu, J.-F.; Mu, B.-Z.; Shim, H.; Gu, J.-D. Identifying the core bacterial microbiome of hydrocarbon degradation and a shift of dominant methanogenesis pathways in the oil and aqueous phases of petroleum reservoirs of different temperatures from China. Biogeosciences 2019, 16, 4229–4241. [Google Scholar] [CrossRef]
  24. Van Hamme, J.D.; Singh, A.; Ward, O.P. Recent Advances in Petroleum Microbiology. Microbiol. Mol. Biol. Rev. 2003, 67, 503–549. [Google Scholar] [CrossRef] [PubMed]
  25. Araujo, A.M.; Santos, L.M.; Fortuny, M.; Melo, R.L.F.V.; Coutinho, R.C.C.; Santos, A.F. Evaluation of water content and average droplet size in water-in-crude oil emulsions by means of near-infrared spectroscopy. Energy Fuels 2008, 22, 3450–3458. [Google Scholar] [CrossRef]
  26. Borges, G.R.; Farias, G.B.; Braz, T.M.; Santos, L.M.; Amaral, M.J.; Fortuny, M.; Franceschi, E.; Dariva, C.; Santos, A.F. Use of near infrared for evaluation of droplet size distribution and water content in water-in-crude oil emulsions in pressurized pipeline. Fuel 2015, 147, 43–52. [Google Scholar] [CrossRef]
  27. Fridjonsson, E.O.; Graham, B.F.; Akhfash, M.; May, E.F.; Johns, M.L. Optimized droplet sizing of water-in-crude oil emulsions using nuclear magnetic resonance. Energy Fuels 2014, 28, 1756–1764. [Google Scholar] [CrossRef]
  28. Xiong, C.; Ding, B.; Geng, X.; Guan, B.; Pan, J.; Dong, J.; Huang, B.; Yan, Y. Quantitative analysis on distribution of microcosmic residual oil in reservoirs by frozen phase and nuclear magnetic resonance (NMR) technology. J. Pet. Sci. Eng. 2020, 192, 107256. [Google Scholar] [CrossRef]
  29. Wang, Y.; Niu, F.; Zhang, X.; Xiao, J.; Xu, C. Super resolution reconstruction of digital core image based on transfer learning. Energy Rep. 2022, 8, 87–94. [Google Scholar] [CrossRef]
  30. Pannekens, M.; Voskuhl, L.; Mohammadian, S.; Köster, D.; Meier, A.; Köhne, J.M.; Kulbatzki, M.; Akbari, A.; Haque, S.; Meckenstock, R.U. Microbial Degradation Rates of Natural Bitumen. Environ. Sci. Technol. 2021, 55, 8700–8708. [Google Scholar] [CrossRef] [PubMed]
  31. Sjöblom, J.; Aske, N.; Auflem, I.H.; Brandal, Ø.; Havre, T.E.; Sæther, Ø.; Westvik, A.; Johnsen, E.E.; Kallevik, H. Our current understanding of water-in-crude oil emulsions. Adv. Colloid. Interface Sci. 2003, 100–102, 399–473. [Google Scholar] [CrossRef]
  32. Ni, X.; Shi, H.; Zhang, J.; Liu, R.; Wang, J.; Cheng, R. Modified Laponite synthesized with special wettability as a multifunctional additive in oil-based drilling fluids. J. Pet. Sci. Eng. 2023, 220, 111211. [Google Scholar] [CrossRef]
  33. Chodankar, S.; Aswal, V.K.; Hassan, P.A.; Wagh, A.G. Structure of protein-surfactant complexes as studied by small-angle neutron scattering and dynamic light scattering. Phys. B Condens. Matter 2007, 398, 112–117. [Google Scholar] [CrossRef]
  34. Curtis, D.B.; Aycibin, M.; Young, M.A.; Grassian, V.H.; Kleiber, P.D. Simultaneous measurement of light-scattering properties and particle size distribution for aerosols: Application to ammonium sulfate and quartz aerosol particles. Atmos. Environ. 2007, 41, 4748–4758. [Google Scholar] [CrossRef]
  35. Boxall, J.A.; Koh, C.A.; Sloan, E.D.; Sum, A.K.; Wu, D.T. Measurement and calibration of droplet size distributions in water-in-Oil emulsions by particle video microscope and a focused beam reflectance method. Ind. Eng. Chem. Res. 2010, 49, 1412–1418. [Google Scholar] [CrossRef]
  36. Kong, L.; Deng, J.; Zhou, X.; Cai, B.; Zhang, B.; Chen, X.; Chen, Z.; Wang, W. Sitagliptin activates the p62–Keap1–Nrf2 signalling pathway to alleviate oxidative stress and excessive autophagy in severe acute pancreatitis-related acute lung injury. Cell Death Dis. 2021, 12, 928. [Google Scholar] [CrossRef] [PubMed]
  37. Schneider, C.A.; Rasband, W.S.; Eliceiri, K.W. NIH Image to ImageJ: 25 years of image analysis. Nat. Methods 2012, 9, 671–675. [Google Scholar] [CrossRef]
  38. Myers, T.G.; Charpin, J.P.F. A mathematical model of the Leidenfrost effect on an axisymmetric droplet. Phys. Fluids 2009, 21, 063101. [Google Scholar] [CrossRef]
  39. Zhou, W.; Zhang, Y.; Qi, H.; Wang, Q.; Yao, B.; Li, D. Optical properties of crude oil with different temperatures. Optik 2019, 196, 162946. [Google Scholar] [CrossRef]
  40. Wu, B.; Gao, J. A Viscosity Reduction Study on Chinese Extra Heavy Oil by the Addition of Synthesized Novel Oil-Soluble Viscosity-Reducing Agents. Pet. Sci. Technol. 2010, 28, 1919–1935. [Google Scholar] [CrossRef]
  41. Neto, D.M.; Sad, C.M.; Silva, M.; Santos, F.D.; Pereira, L.B.; Corona, R.R.; Barbosa, L.R.; Silva, S.R.; Bassane, J.F.; Castro, E.V.; et al. Rheological study of the behavior of water-in-oil emulsions of heavy oils. J. Pet. Sci. Eng. 2019, 173, 1323–1331. [Google Scholar] [CrossRef]
  42. Wang, C.; An, S.; Li, Z.; Chen, H.; Yan, Z.; Tan, Y. Novel epigallocatechin gallate-based polyether surfactants: Synthesis, characterization and demulsification properties. Colloids Surf. A Physicochem. Eng. Asp. 2021, 623, 126757. [Google Scholar] [CrossRef]
  43. Wang, Z.; Shu, L.; Su, X.; Niu, S. Evaluating Particle Deposition in the Artificial Groundwater Recharge Process by Physical and CT Imaging Experiments. Water Resour. Manag. 2021, 35, 4789–4807. [Google Scholar] [CrossRef]
  44. Moradi, M.; Alvarado, V.; Huzurbazar, S. Effect of Salinity on Water-in-Crude Oil Emulsion: Evaluation through Drop-Size Distribution Proxy. Energy Fuels 2011, 25, 260–268. [Google Scholar] [CrossRef]
  45. Gibbons, S.M.; Caporaso, J.G.; Pirrung, M.; Field, D.; Knight, R.; Gilbert, J.A. Evidence for a persistent microbial seed bank throughout the global ocean. Proc. Natl. Acad. Sci. USA 2013, 110, 4651–4655. [Google Scholar] [CrossRef]
  46. Lennon, J.T.; Jones, S.E. Microbial seed banks: The ecological and evolutionary implications of dormancy. Nat. Rev. Microbiol. 2011, 9, 119–130. [Google Scholar] [CrossRef] [PubMed]
  47. Wang, L.Y.; Ke, W.J.; Sun, X.B.; Liu, J.F.; Gu, J.D.; Mu, B.Z. Comparison of bacterial community in aqueous and oil phases of water-flooded petroleum reservoirs using pyrosequencing and clone library approaches. Appl. Microbiol. Biotechnol. 2014, 98, 4209–4221. [Google Scholar] [CrossRef] [PubMed]
Figure 1. Schematic diagrams (left) of three methods for observing water droplets in crude oil and the corresponding appearance of the observed water droplets (right). (a) Spreading the crude oil, (b) freezing the crude oil, (c) diluting the crude oil.
Laboratories 02 00001 g001
Figure 2. A schematic diagram of the PP method (left) and a flow chart for determining the optimum thickness of shims (right).
Laboratories 02 00001 g002
Figure 3. A schematic diagram of the calculation and analysis process of water droplet size in the crude oil.
Laboratories 02 00001 g003
Figure 4. The particle size distribution of the water droplets in a crude oil sample. The data were obtained from the PP method using shims of different thicknesses.
Laboratories 02 00001 g004
Figure 5. A schematic diagram of the preparation and pressing process for three oil samples (top), and photos of (a) completely dehydrated, (b) dehydrated, and (c) untreated crude oil samples treated by the PP method.
Laboratories 02 00001 g005
Figure 6. The total number and diameter of water droplets in crude oil from N8Q, Pu172, and P241 were obtained by CT scanning (left) and using the PP method (right).
Laboratories 02 00001 g006
Figure 7. The size distribution of water droplets in three crude oil samples. The data were obtained using the PP method.
Laboratories 02 00001 g007
Table 1. Characterization of the sampled oil reservoirs.
P241N8QPu172SS5301Y1935-454
OilfieldDaqingDaqingDaqingDaqingChangqingShengli
Temperature (°C)454559.444.5–49.44555–60
Water flooding (years)<20<200<200>20
Disclaimer/Publisher’s Note: The statements, opinions and data contained in all publications are solely those of the individual author(s) and contributor(s) and not of MDPI and/or the editor(s). MDPI and/or the editor(s) disclaim responsibility for any injury to people or property resulting from any ideas, methods, instructions or products referred to in the content.

