

Relationship Between Short-Term Blood Pressure Variability and Choroidal–Retinal Thicknesses Assessed by Optical Coherence Tomography in Hypertensive Subjects

 , , , , , , and
Abstract
:1. Introduction
2. Materials and Methods
2.1. Subjects
- Secondary hypertension (renovascular, malignant, or endocrine hypertension, or hypertension associated with obstructive sleep apnea syndrome);
- Diabetic patients;
- Patients with congenital or hereditary kidney diseases, or severe renal insufficiency (eGFR < 30 mL/min/1.73 m2);
- History of ocular diseases (e.g., cataracts) and/or ophthalmic surgery;
- Past or recent history of cerebrovascular events;
- History or clinical signs of heart failure (NYHA II-IV) or coronary artery disease;
- Major non-cardiovascular chronic diseases (COPD, liver cirrhosis);
- Neoplasms.
2.1.1. Clinical and Laboratory Examination
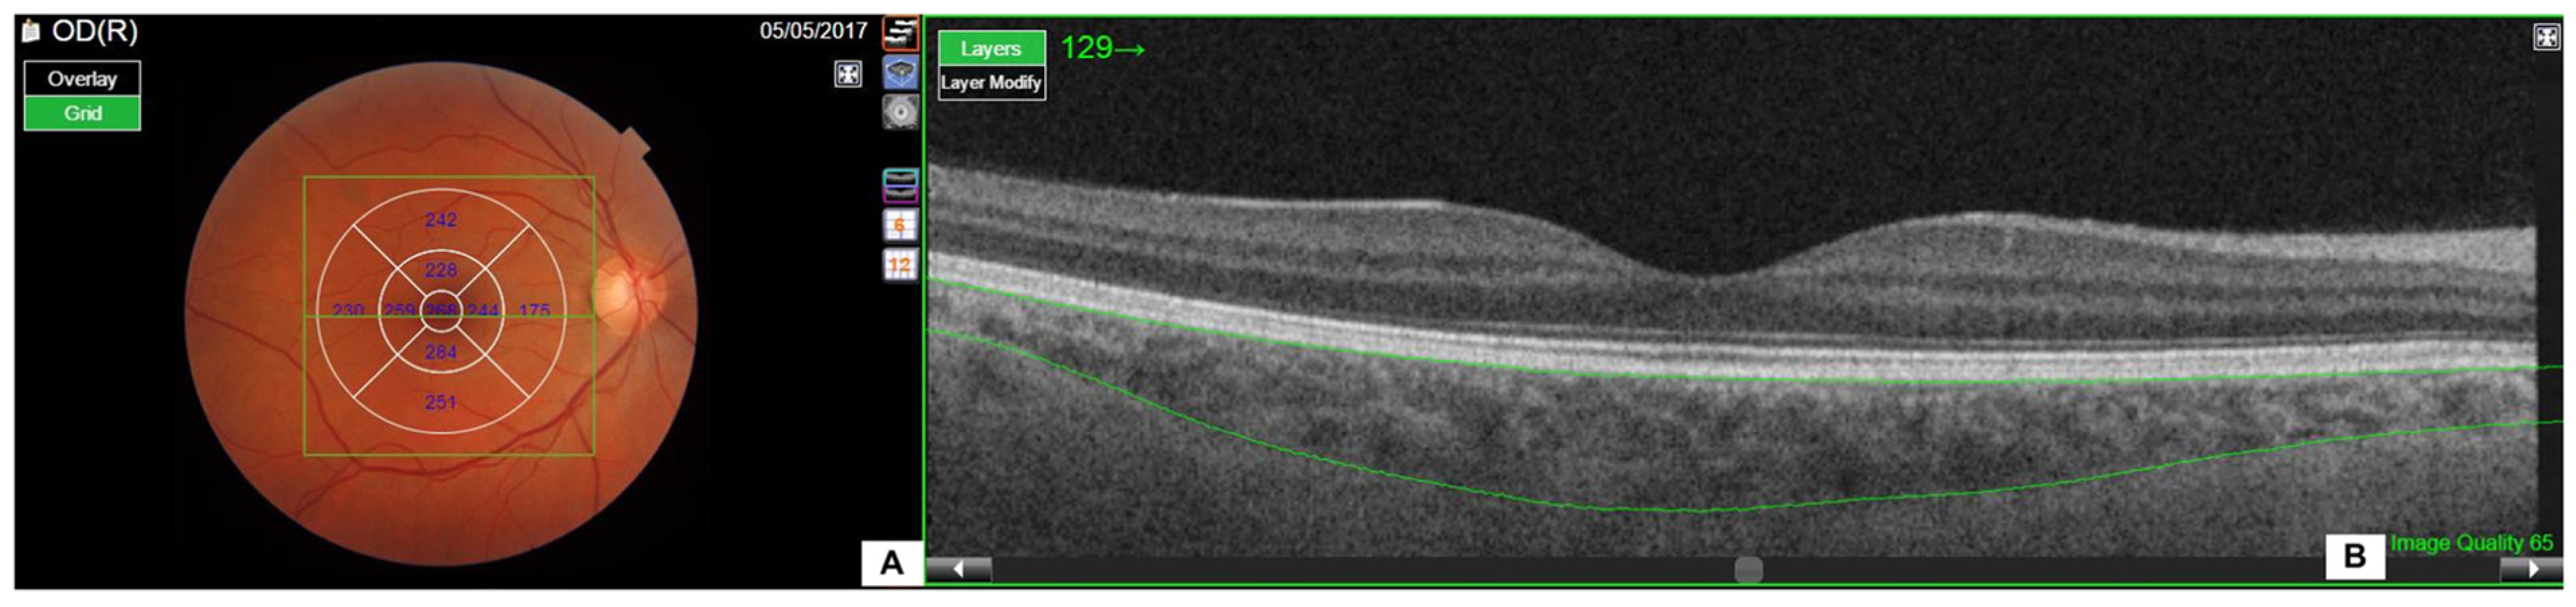
2.1.2. Ophthalmic Examination
2.2. Statistical Analysis
3. Results
4. Discussion
5. Conclusions
Author Contributions
Funding
Institutional Review Board Statement
Informed Consent Statement
Data Availability Statement
Conflicts of Interest
References
- Mancia, G.; Kreutz, R.; Brunström, M.; Burnier, M.; Grassi, G.; Januszewicz, A.; Muiesan, M.L.; Tsioufis, K.; Agabiti-Rosei, E.; Algharably, E.A.E.; et al. 2023 ESH Guidelines for the management of arterial hypertension The Task Force for the management of arterial hypertension of the European Society of Hypertension: Endorsed by the International Society of Hypertension (ISH) and the European Renal Association (ERA). J. Hypertens. 2023, 41, 1874–2071. [Google Scholar] [CrossRef] [PubMed]
- Del Pinto, R.; Mulè, G.; Vadalà, M.; Carollo, C.; Cottone, S.; Rosei, C.A.; De Ciuceis, C.; Rizzoni, D.; Ferri, C.; Muiesan, M.L. Arterial Hypertension and the Hidden Disease of the Eye: Diagnostic Tools and Therapeutic Strategies. Nutrients 2022, 14, 2200. [Google Scholar] [CrossRef] [PubMed]
- Mulè, G.; Vadalà, M.; Sinatra, N.; Mancia, E.; Sorce, A.; Geraci, G.; Carollo, C.; Montalbano, K.; Castellucci, M.; Guarrasi, G.; et al. Relationship of choroidal thickness with pulsatile hemodynamics in essential hypertensive patients. J. Clin. Hypertens. 2021, 23, 1030–1038. [Google Scholar] [CrossRef] [PubMed]
- Palatini, P.; Fania, C.; Gasparotti, F. Accuracy of the WatchBP office ABI device for office blood pressure measurement over a wide range of arm sizes. Blood Press Monit. 2018, 23, 117–119. [Google Scholar] [CrossRef] [PubMed]
- Predictive Factors of Abnormal Circadian Blood Pressure Profile in Recipients of Kidney Transplantation—PubMed. Available online: https://pubmed.ncbi.nlm.nih.gov/28461839/ (accessed on 26 August 2024).
- A New Equation to Estimate Glomerular Filtration Rate—PubMed. Available online: https://pubmed.ncbi.nlm.nih.gov/19414839/ (accessed on 26 August 2024).
- Photocoagulation for Diabetic Macular Edema. Early Treatment Diabetic Retinopathy Study Report Number 1. Early Treatment Diabetic Retinopathy Study Research Group—PubMed. Available online: https://pubmed.ncbi.nlm.nih.gov/2866759 (accessed on 26 August 2024).
- Geraci, G.; Zammuto, M.M.; Vadalà, M.; Mattina, A.; Castellucci, M.; Guarrasi, G.; Nardi, E.; Maida, C.; Zanoli, L.; Cillino, S.; et al. Choroidal thickness is associated with renal hemodynamics in essential hypertension. J. Clin. Hypertens. 2020, 22, 245–253. [Google Scholar] [CrossRef] [PubMed]
- Farias, L.B.; Lavinsky, D.; Benfica, C.Z.; da Silva, M.O.; Lavinsky, J.; Canani, L.H. Changes in choroidal thickness and volume are related to urinary albumin excretion in type 2 diabetic patients without retinopathy. Clin. Ophthalmol. 2018, 12, 1405–1411. [Google Scholar] [CrossRef] [PubMed]
- Ashour, D.M.; El-Shazly, A.A.E.-F.; Abdelgawad, R.H.A.; Saleh, M.I. Choroidal thickness in relation to urinary albumin excretion rate in type 2 diabetes mellitus without retinopathy. Int. J. Retin. Vitr. 2021, 7, 61. [Google Scholar] [CrossRef] [PubMed]
- Microalbuminuria Is Associated with Increased Choroidal Thickness in Type 1 Diabetes Mellitus Patients without Diabetic Retinopathy—PubMed. Available online: https://pubmed.ncbi.nlm.nih.gov/28636111/ (accessed on 26 August 2024).
- Balmforth, C.; van Bragt, J.J.; Ruijs, T.; Cameron, J.R.; Kimmitt, R.; Moorhouse, R.; Czopek, A.; Hu, M.K.; Gallacher, P.J.; Dear, J.W.; et al. Chorioretinal thinning in chronic kidney disease links to inflammation and endothelial dysfunction. JCI Insight 2016, 1, e89173. [Google Scholar] [CrossRef]
- Akay, F.; Gundogan, F.C.; Yolcu, U.; Toyran, S.; Uzun, S. Choroidal thickness in systemic arterial hypertension. Eur. J. Ophthalmol. 2016, 26, 152–157. [Google Scholar] [CrossRef] [PubMed]
- Masís, M.; Hernandez, E.; Wu, L. Choroidal Thickness in Patients with Systemic Hypertension. Investig. Ophthalmol. Vis. Sci. 2011, 52, 5296. [Google Scholar]
- Gök, M.; Karabas, V.L.; Emre, E.; Aksar, A.T.; Aslan, M.S.; Ural, D. Evaluation of choroidal thickness via enhanced depth-imaging optical coherence tomography in patients with systemic hyper- tension. Indian J. Ophthalmol. 2015, 63, 239–243. [Google Scholar] [CrossRef]
- Mule, G.; Cottone, S.; Vadala, A.; Volpe, V.; Mezzatesta, G.; Mongiovi, R.; Piazza, G.; Nardi, E.; Andronico, G.; Cerasola, G. Relationship between albumin excretion rate and aortic stiffness in untreated essential hypertensive patients. J. Intern. Med. 2004, 256, 22–29. [Google Scholar] [CrossRef] [PubMed]
- Schillaci, G.; Bilo, G.; Pucci, G.; Laurent, S.; Macquin-Mavier, I.; Boutouyrie, P.; Battista, F.; Settimi, L.; Desamericq, G.; Dolbeau, G.; et al. Relationship between Short-Term Blood Pressure Variability and Large-Artery Stiffness in Human Hypertension. Hypertension 2012, 60, 369–377. [Google Scholar] [CrossRef]
- García-García, Á.; García-Ortiz, L.; Recio-Rodríguez, J.I.; Patino-Alonso, M.C.; Agudo-Conde, C.; Rodriguez-Sanchez, E.; Gómez-Marcos, M.A. Relationship of 24-h blood pressure variability with vascular structure and function in hypertensive patients. Blood Press. Monit. 2013, 18, 101–106. [Google Scholar] [CrossRef] [PubMed]
- Mulè, G.; Vadalà, M.; La Blasca, T.; Gaetani, R.; Virone, G.; Guarneri, M.; Castellucci, M.; Guarrasi, G.; Terrasi, M.; Cottone, S. Association between early-stage chronic kidney disease and reduced choroidal thickness in essential hypertensive patients. Hypertens. Res. 2019, 42, 990–1000. [Google Scholar] [CrossRef] [PubMed]
- Kim, Y.H.; Oh, J. Choroidal Thickness Profile in Chorioretinal Diseases: Beyond the Macula. Front. Med. 2021, 8, 797428. [Google Scholar] [CrossRef] [PubMed]

| Whole Population (n = 70) | Men (n = 70) | Women (n = 28) | p | |
|---|---|---|---|---|
| Age (Years) | 49 ± 12 | 53 ± 12 | 47 ± 12 | ns |
| Antihypertensive Drugs (%) | 69 | 42.6 | 57 | ns |
| Smokers (%) | 32 | 29 | 71 | ns |
| BMI (kg/m2) | 28 ± 5 | 29 ± 5 | 27 ± 5 | ns |
| Total Cholesterol (mg/dL) | 188 ± 33 | 188 ± 36 | 188 ± 28 | ns |
| HDL Cholesterol (mg/dL) | 47 ± 13 | 53 ± 13 | 45 ± 12 | ns |
| LDL Cholesterol (mg/dL) | 117 ± 29 | 114 ± 29 | 115 ± 30 | ns |
| Triglycerides (mg/dL) | 107 (76–164) | 110 (72–158) | 101 (78–143) | ns |
| Blood Glucose (mg/dL) | 98 ± 18 | 101 ± 19 | 93 ± 14 | ns |
| Hemoglobin (g/dL) | 14.4 ± 1 | 15.1 ± 1 | 13 ± 1 | <0.01 |
| Uricemia (mg/dL) | 7 ± 5 | 6 ± 1.4 | 8.7 ± 8.3 | ns |
| Serum Creatinine (mg/dL) | 1.01 ± 0.4 | 1.04 ± 0.3 | 0.95 ± 0.7 | ns |
| Microalbuminuria (mg/24 h) | 30 (4.8–77.5) | 30 (4–42) | 30 (12–237) | ns |
| Whole Population (n = 70) | Men (n = 70) | Women (n = 28) | p | |
|---|---|---|---|---|
| OBP | ||||
| cSBP (mmHg) | 138 ± 14 | 138 ± 14 | 139 ± 14 | ns |
| cDBP (mmHg) | 86 ± 11 | 87 ± 12 | 85 ± 9 | ns |
| cPP (mmHg) | 52 ± 10 | 51 ± 10 | 54 ± 11 | ns |
| cMAP (mmHg) | 104 ± 11 | 104 ± 12 | 103 ± 10 | ns |
| ABPM | ||||
| Mean 24 h SBP (mmHg) | 130 ± 14 | 130 ± 14 | 130 ± 14 | ns |
| Mean Day SBP (mmHg) | 134 ± 15 | 134 ± 15 | 134 ± 14 | ns |
| Mean Night SBP (mmHg) | 119 ± 15 | 120 ± 15 | 118 ± 14 | ns |
| Day/Night SBP (mmHg) | 1.12 ± 0.09 | 1.12 ± 0.09 | 1.13 ± 0.09 | ns |
| Mean 24 h DBP (mmHg) | 84 ± 9 | 84 ± 8 | 82 ± 9 | ns |
| Mean Day DBP (mmHg) | 87 ± 9 | 88 ± 9 | 86 ± 10 | ns |
| Mean Night DBP (mmHg) | 76 ± 9 | 77 ± 9 | 73 ± 9 | 0.04 |
| Day/Night DBP (mmHg) | 1.16 ± 0.11 | 1.14 ± 0.11 | 1.19 ± 0.12 | ns |
| Mean 24 h PP (mmHg) | 46 ± 12 | 45 ± 12 | 48 ± 11 | ns |
| Mean Day PP (mmHg) | 47 ± 12 | 46 ± 12 | 48 ± 12 | ns |
| Mean Night PP (mmHg) | 43 ± 11 | 42 ± 11 | 45 ± 11 | ns |
| Day/Night PP (mmHg) | 0.45 ± 0.55 | 0.50 ± 0.54 | 0.31 ± 0.55 | ns |
| BP variability indices | ||||
| Mean 24 h ARV SBP (mmHg) | 12 ± 2.6 | 13 ± 2.4 | 12 ± 3.2 | ns |
| Mean 24 h ARV DPB (mmHg) | 10 ± 3.4 | 10 ± 2.4 | 9 ± 2.5 | ns |
| Mean Day ARV SBP (mmHg) | 15 ± 3.6 | 15 ± 3.3 | 14 ± 4 | 0.05 |
| Mean Night ARV SBP (mmHg) | 16 ± 7 | 15 ± 6.4 | 16 ± 8.6 | ns |
| Mean Day ARV DBP (mmHg) | 10 ± 2.3 | 10 ± 2.4 | 10 ± 2 | ns |
| Mean Night ARV DBP (mmHg) | 13 ± 4.6 | 13 ± 4 | 13 ± 6 | ns |
| SD Day SBP (mmHg) | 14 ± 4.5 | 14 ± 3.7 | 15 ± 6.2 | ns |
| SD Night SBP (mmHg) | 12 ± 3.5 | 12 ± 3.5 | 12 ± 3.5 | ns |
| SD Day DBP (mmHg) | 11 ± 3,6 | 11 ± 3,7 | 11 ± 3.4 | ns |
| SD Night DBP (mmHg) | 10 ± 3 | 10 ± 3.1 | 10 ± 2.7 | ns |
| SD Day PP (mmHg) | 13 ± 5.6 | 13 ± 6.1 | 13 ± 4 | ns |
| SD Night PP (mmHg) | 10 ± 5.2 | 10 ± 5.5 | 11 ± 4.4 | ns |
| SD Day HR (bpm) | 9 ± 3.2 | 9 ± 2.8 | 9 ± 4 | ns |
| SD Night HR (bpm) | 7 ± 3 | 7 ± 3.1 | 7 ± 2.72 | ns |
| 24 h Weighted Bilo SBP | 14 ± 4.9 | 14 ± 3 | 14 ± 7.2 | ns |
| 24 h Weighted Bilo DBP | 12 ± 4 | 12 ± 3 | 12 ± 5.7 | ns |
| Whole Population (n = 70) | Men (n = 70) | Women (n = 28) | p | |
|---|---|---|---|---|
| Choroidal thicknesses | ||||
| ChT-c (µm) | 259.5 ± 73.2 | 265.3 ± 73.3 | 245.5 ± 72.7 | ns |
| ChT-air (µm) | 235.1 ± 58.2 | 239.5 ± 60.5 | 224.6 ± 51.6 | ns |
| ChT-aor (µm) | 253.6 ± 65.5 | 258.7 ± 68.2 | 242.7 ± 58 | ns |
| ChT-or (µm) | 249.7 ± 61.4 | 243.1 ± 63.6 | 241.7 ± 55.8 | ns |
| Caliper CSI (µm) | 272.2 ± 72.9 | 274.9 ± 77.1 | 267.5 ± 67 | ns |
| Retinal thicknesses | ||||
| RetT-air (µm) | 279 ± 92.6 | 275.6 ± 85.1 | 287.2 ± 110.1 | ns |
| RetT-aor (µm) | 308 ± 19.5 | 309.7 ± 21.5 | 303.8 ± 12.5 | ns |
| RetT-or (µm) | 290.6 ± 46.4 | 289.7 ± 41.8 | 292.7 ± 56.9 | ns |
| Age | Total Cholesterol | LDL Cholesterol | Glycemia | Hemoglobin | Serum Creatinine | eGFR | Log Albuminuria | |
|---|---|---|---|---|---|---|---|---|
| r | r | r | r | r | r | r | r | |
| Choroidal thicknesses | ||||||||
| ChT-c (µm) | −0.364 ** | 0.263 ** | 0.287 ** | ns | ns | ns | 0.212 * | −0.361 ^ |
| ChT-air (µm) | −0.455 ** | ns | 0.228 * | −0.288 * | ns | −0.241 * | 0.346 ** | −0.303 * |
| ChT-aor (µm) | −0.445 ** | 0.248 * | −0.353 * | −0.289 * | 0.238 * | Ns | 0.264 * | −0.389 ^^ |
| ChT-or (µm) | −0.465 ** | 0.248 * | 0.039* | −0.290 * | ns | −0.261 * | 0.358 ** | −0.370 ^ |
| Retinal thicknesses | ||||||||
| RetT-air (µm) | ns | 0.310 * | 0.278 ^ | ns | ns | ns | ns | ns |
| RetT-aor (µm) | ns | ns | ns | ns | ns | ns | ns | ns |
| RetT-or (µm) | ns | ns | 0.269 ** | ns | ns | ns | ns | ns |
| cPP | cMAP | c-HR | Mean Night SBP | Mean Daytime DBP | Day/Night SBP | SD Night SBP | SD Day PP | SD Day HR | |
|---|---|---|---|---|---|---|---|---|---|
| r | r | r | r | r | r | r | r | r | |
| Choroidal thicknesses | |||||||||
| ChT-c (µm) | ns | 0.203 * | ns | ns | ns | ns | ns | ns | ns |
| ChT-air (µm) | ns | ns | ns | ns | ns | ns | ns | ns | ns |
| ChT-aor (µm) | −0.231 * | ns | ns | ns | 0.272 ** | ns | ns | 0.107 * | −0.232 ** |
| ChT-or (µm) | ns | ns | 0.253 ** | ns | 0.217 * | ns | ns | ns | ns |
| Caliper CSI (µm) | −0.227 * | ns | ns | −0.230 * | ns | ns | ns | ns | ns |
| Retinal thicknesses | |||||||||
| RetT-air (µm) | ns | ns | ns | ns | ns | ns | ns | ns | ns |
| RetT-aor (µm) | ns | ns | ns | ns | ns | −0.226 * | ns | ns | ns |
| RetT-or (µm) | ns | ns | 0.204 * | ns | ns | ns | ns | ns | ns |
| Mean 24 h DBP | Mean 24 h ARV SBP | Mean 24 h ARV DBP | Mean Daytime ARV SBP | Mean Night ARV SBP | Mean Daytime ARV DBP | |
|---|---|---|---|---|---|---|
| r | r | r | r | r | r | |
| Choroidal thicknesses | ||||||
| ChT-c (µm) | ns | ns | −0.331 ** | ns | −0.311 ** | −0.268 ** |
| ChT-air (µm) | 0.222 * | −0.252 * | −0.316 ** | ns | −0.290 ^ | −0.266 ** |
| ChT-aor (µm) | ns | ns | −0.320 ** | ns | −0.283 ** | −0.272 ** |
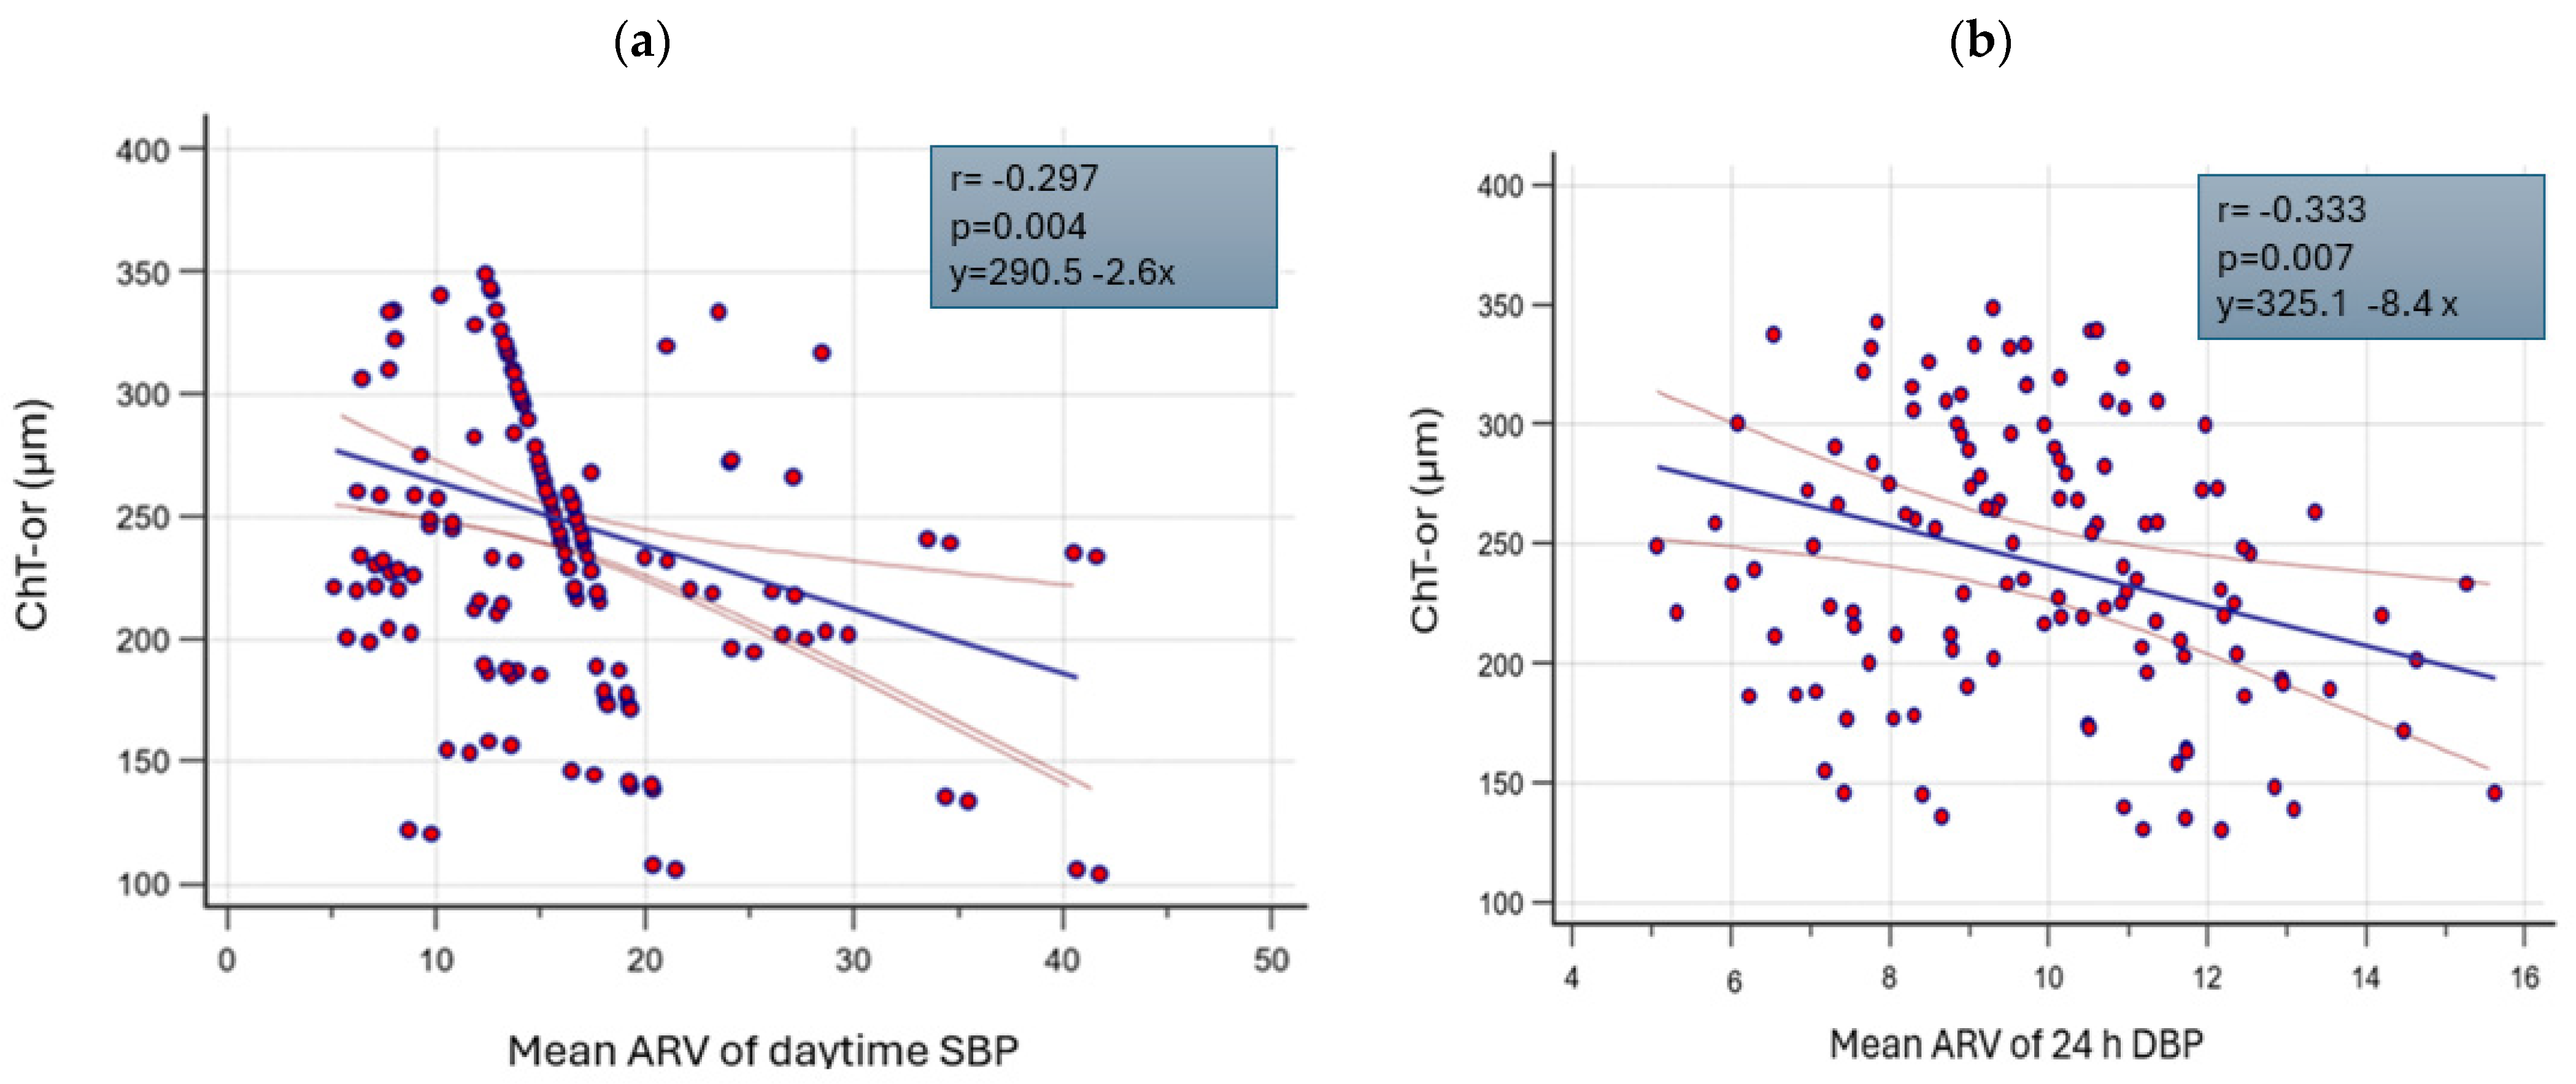
| ChT-or (µm) | ns | ns | −0.333 ** | 0.208 * | −0.295 ^ | −0.297 ^ |
| Caliper CSI (µm) | ns | ns | −0.365 ** | ns | ns | −0.278 * |
| Retinal thicknesses | ||||||
| RetT-air (µm) | ns | ns | ns | ns | ns | ns |
| RetT-aor (µm) | ns | ns | ns | ns | ns | ns |
| RetT-or (µm) | ns | ns | ns | ns | ns | ns |
| Dependent
Variable | ChT-or | ChT-c | ChT-aor | ChT-air | ||||||||||||
|---|---|---|---|---|---|---|---|---|---|---|---|---|---|---|---|---|
| Regressors | ||||||||||||||||
| B | S.E. | β | p | B | S.E. | β | p | B | S.E. | β | p | B | S.E. | β | p | |
| Log-albuminuria | −39 | 9.2 | −0.53 | <0.001 | −46.6 | 10.1 | −0.56 | <0.001 | −37.5 | 8.9 | −0.52 | <0.01 | −37 | 10 | −0.47 | <0.001 |
| Mean daytime DBP | 2.14 | 0.7 | 0.32 | 0.008 | 2.42 | 0.8 | 0.32 | 0.007 | 1.92 | 0.7 | 0.29 | 0.016 | 2.9 | 0.8 | 0.41 | <0.001 |
| Mean ARV day DBP | −10.9 | 3.13 | −0.39 | 0.001 | −10.7 | 3.5 | −0.34 | 0.004 | −9.3 | 3.1 | −0.35 | 0.005 | −10.2 | 3.2 | −0.36 | 0.003 |
Disclaimer/Publisher’s Note: The statements, opinions and data contained in all publications are solely those of the individual author(s) and contributor(s) and not of MDPI and/or the editor(s). MDPI and/or the editor(s) disclaim responsibility for any injury to people or property resulting from any ideas, methods, instructions or products referred to in the content. |
© 2024 by the authors. Licensee MDPI, Basel, Switzerland. This article is an open access article distributed under the terms and conditions of the Creative Commons Attribution (CC BY) license (https://creativecommons.org/licenses/by/4.0/).
Share and Cite
Carollo, C.; Vadalà, M.; Ferrara, M.; Chisci, E.; La Felice, A.; Di Natale, K.V.; Sorce, A.; Bonfiglio, V.M.E.; Mulè, G. Relationship Between Short-Term Blood Pressure Variability and Choroidal–Retinal Thicknesses Assessed by Optical Coherence Tomography in Hypertensive Subjects. J. Pers. Med. 2024, 14, 1123. https://doi.org/10.3390/jpm14121123
Carollo C, Vadalà M, Ferrara M, Chisci E, La Felice A, Di Natale KV, Sorce A, Bonfiglio VME, Mulè G. Relationship Between Short-Term Blood Pressure Variability and Choroidal–Retinal Thicknesses Assessed by Optical Coherence Tomography in Hypertensive Subjects. Journal of Personalized Medicine. 2024; 14(12):1123. https://doi.org/10.3390/jpm14121123
Chicago/Turabian StyleCarollo, Caterina, Maria Vadalà, Marta Ferrara, Enea Chisci, Alberto La Felice, Katia Valeria Di Natale, Alessandra Sorce, Vincenza Maria Elena Bonfiglio, and Giuseppe Mulè. 2024. "Relationship Between Short-Term Blood Pressure Variability and Choroidal–Retinal Thicknesses Assessed by Optical Coherence Tomography in Hypertensive Subjects" Journal of Personalized Medicine 14, no. 12: 1123. https://doi.org/10.3390/jpm14121123
APA StyleCarollo, C., Vadalà, M., Ferrara, M., Chisci, E., La Felice, A., Di Natale, K. V., Sorce, A., Bonfiglio, V. M. E., & Mulè, G. (2024). Relationship Between Short-Term Blood Pressure Variability and Choroidal–Retinal Thicknesses Assessed by Optical Coherence Tomography in Hypertensive Subjects. Journal of Personalized Medicine, 14(12), 1123. https://doi.org/10.3390/jpm14121123