
Article

Do Organizational Conditions Impact Employee Performance?
1
WJCR—William James Center for Research, 1149-041 Lisbon, Portugal
2
Ispa—Instituto Universitário, 1149-041 Lisbon, Portugal
3
APPsyCI—Applied Psychology Research Center Capabilities & Inclusion, 1149-041 Lisbon, Portugal
*
Author to whom correspondence should be addressed.
Occup. Health 2026, 1(3), 32; https://doi.org/10.3390/occuphealth1030032
Submission received: 31 March 2026 / Revised: 10 July 2026 / Accepted: 13 July 2026 / Published: 17 July 2026

Abstract

The COVID-19 pandemic has brought significant changes to the way people live and work, prompting organizations to reconsider how they accommodate their employees. These adjustments may vary depending on the organization’s conditions. This study aimed to identify variables that predict work performance in a sample of professionally active adults. A cross-sectional, quantitative, and correlational study was conducted, with the participation of 1000 Portuguese adults (Mage = 40.8; SD = 10.6; 68.4% female) who were professionally active. The study used a Sociodemographic and Professional Questionnaire to characterize the sample. Data from the Work–Life Balance (WLB) scale, Organizational Culture (O.C.) scale, Organizational Life Cycle scale, and Health and Work Questionnaire were analyzed. The model demonstrated an acceptable fit (χ2/df = 4.14; SRMR = 0.07; CFI = 0.82; TLI = 0.81; GFI = 0.80; RMSEA = 0.05). An O.C. characterized by trust and participation (β = 0.17; p < 0.001) was negatively associated with higher productivity. Increased non-work satisfaction was positively associated with a better perception of WLB (β = 0.44; p < 0.001). These findings suggest that fostering trust and participation in O.C. and supporting employees’ non-work satisfaction are concrete strategies for improving work performance (e.g., productivity, job satisfaction), ultimately improving the overall organizational well-being.

1. Introduction

In recent decades, the labor market has become increasingly competitive. Managers are under pressure to create strategies to optimize employee performance while prioritizing the well-being of their workforce. This approach aims to motivate employees to perform at their best [1].
Performance is defined as the tasks executed, and is often reflected in the outcomes achieved [2]. In other words, performance is manifested through factors such as productivity and employee satisfaction [3].
The literature highlights that various work-related and organizational conditions significantly influence performance, with Organizational Culture (O.C.), Organizational Life Cycle (O.L.C.), and Work–Life Balance (WLB) being particularly noteworthy [4]. WLB is conceptually defined as the equilibrium between work-related duties and personal responsibilities (e.g., social interactions) [5].
According to the literature, collaborators who perceive their WLB positively often perform better at work [6,7], and workers who perceive their WLB as unsatisfactory, on the other hand, often report high levels of workplace stress, lower engagement, and lower job satisfaction [8,9]. Despite recent studies, there is little knowledge about the potential impact of WLB and organizational functioning on work performance [10]. However, one way to mitigate operational challenges in institutions is through O.C. [11].
Culture is the foundation of all institutions, encompassing values, expectations, and historical context [11,12]. Therefore, it acts as a crucial determinant of job performance, as it helps workers understand and internalize the principles of the organization [13].
The recent literature states that O.C. characterized as supportive, particularly in terms of family support, helps employees reduce role conflict [14]. Some studies propose that an O.C. characterized by trustworthiness and innovation can positively affect productivity [15,16]. Given the impact of O.C. typology, it is imperative that organizations allocate time, resources, and different strategies to promote a more supportive and innovative culture [17,18]. However, it is crucial to consider the current stage of the Organizational Life Cycle (O.L.C.) [19,20].
The O.L.C. is a dynamic process [21] in which an institution’s resources can change throughout its life [22]. The model presented by Lester et al. [23] is in line with the conclusions of other five-phase models [24]. The first stage is existence, the aim of which is to establish the company’s pillars and a network of clients [25]. This is followed by the survival stage, with the aim of generating profits to support the costs of organizational activities [26]. The third stage is called success, with the main objective of maintaining the company’s profitability [25]. In the renewal stage, managers show a willingness to implement an Organizational Culture based on cooperation and creativity [27]. Finally, the decline stage is characterized by the disconnection of employees from the organization’s objectives [20].
The state of the art illustrates the impact of the O.L.C. on employees’ work performance [28,29], in which researchers have concluded that, in organizations in the survival, success, and renewal stages, employees have a more positive perception of their performance compared to the other stages [22,30]. In an increasingly competitive market, organizations face challenges both within their internal operations (e.g., conflicts between employees) and externally (e.g., competition for market space) [31]. To improve their workforce performance, companies have implemented new strategies [32]. Some authors theorize that organizations in the existence and survival stages [31] introduce strategies to promote an entrepreneurial culture. In this way, employees are encouraged to see their performance as part of a collective effort [33] and to be more innovative [32].
One theoretical model that enables us to conceptualize changes in various workplace conditions (e.g., Organizational Culture) is the Job Demands–Resources (JD-R) model [34], which serves as the overarching theoretical framework of the present study. This model has two components: job demands, which are the characteristics of work that involve physical or psychological effort and consequently have an associated cost (e.g., stress), and job resources, which enable the achievement of goals, reduce the impact of demands, and promote growth in the workplace [34]. According to the authors, the interaction between job demands and job resources not only has direct effects on the demands and resources themselves but also shapes the impact of the demands (e.g., social support from colleagues can reduce the impact of work demands). Thus, it is possible to conceptualize the relationship between resources and demands in the workplace [34].
Within this framework, workplace conditions can be operationalized across macro and micro levels to capture the complexity of the contemporary organizational environment. Specifically, O.C. can be conceptualized as a fundamental job resource, particularly when viewed through the lens of Psychosocial Safety Climate [35]. A supportive culture serves as an antecedent that influences how other resources are allocated and legitimized within the organization [15,16]. When the overarching culture prioritizes psychological health, it fosters the development of structural resources that directly alleviate strain, such as WLB initiatives [8,9].
Policies aimed at enhancing WLB operate as crucial job resources at the task and organizational levels [36]. These resources play a dual role, as they trigger a motivational process that enhances work engagement and, simultaneously, act as a protector factor to mitigate the psychological costs associated with high job demands [37].
However, the availability and effectiveness of these job resources are not static over time; they are inherently connected with the O.L.C. [38]. The transition through different stages fundamentally alters the balance between demands and resources [39]. For instance, early stages often present intense job demands and a scarcity of formal structural resources, relying heavily on organic cultural support to sustain motivation [39]. Conversely, mature organizations may offer robust structural WLB resources, yet they risk introducing bureaucratic demands. Therefore, to fully grasp how resources function, the JD-R model must be contextualized within O.L.C. [38].
Despite the growing body of research on organizational conditions of work performance, studies examining the combined effects of WLB, O.C., and O.L.C. within a single empirical model remain scarce [10,22,30]. Furthermore, while the JD-R model provides a robust theoretical framework to conceptualize these variables as job resources [34], empirical studies operationalizing all three simultaneously are limited. In this context, the present study seeks to examine if organizational conditions (WLB, O.C., O.L.C.) predict work performance (controlling for sex, age, weekly workload, and work regime) in a sample of the Portuguese population. In light of this objective, we have formulated the following hypotheses: (1) a better perception of WLB is associated with better performance and (2) a poorer perception of WLB is associated with worse performance. Regarding the variables O.C. and O.L.C., as this is an exploratory study and given the scarcity of research on these variables, they were classified as exploratory variables, and no hypotheses were formulated.

2. Materials and Methods

2.1. Research Design

This study was exploratory, observational and cross-sectional in nature, as data collection occurred at a single moment. This quantitative study employed a descriptive correlational design. No variables were manipulated, and the study followed the criteria of Coolican et al. [40].

2.2. Participants

A total of 1007 actively employed adults in Portugal were recruited online using non-probabilistic convenience sampling. The inclusion criteria were as follows: (1) Portuguese nationality, (2) age above 18 years, (3) current employment/professionally active, and (4) access to the Internet.
Seven participants were excluded because they did not meet the third inclusion criterion (professionally active). The sample comprised a total of n = 1000 participants, with an age range between 19 and 75. The sociodemographic analysis is shown in Table 1.

2.3. Measures

2.3.1. Professional and Sociodemographic Questionnaire

Questions were asked to characterize the sample, including sociodemographic variables (e.g., age and biological sex) and variables related to the participants’ professional context (e.g., size of the organization, weekly workload, and working regime).

2.3.2. Work–Life Balance Scale (WLB)

The current scale, developed by Pimenta et al. [41], draws upon the existing literature and incorporates elements from the instruments of Haar et al. [42] and Wepfer et al. [43]. This scale measures Portuguese individuals’ perceptions of WLB.
The instrument comprises six items, including one inverted item, all loaded into a single factor (e.g., “The balance between my work life and my family life (e.g., time and energy to be with the family) is very good.”). Responses were rated on a 5-point Likert scale (0 = Strongly Disagree; 4 = Strongly Agree).
The instrument showed a good fit to the sample under study (χ2/df = 4.78; SRMR = 0.02; CFI = 0.99; GLI = 0.98; TLI = 0.98; RMSEA = 0.09). Apart from item 2, which had a low factor weight (λ = 0.39), all the items had adequate factor weights, namely above 0.83.
The measurement had good convergent evidence (AVE = 0.79), as well as good internal consistency (w = 0.91; α = 0.91). It should be noted that all items showed good psychometric sensitivity (−0.54 < |Sk| < −0.18; −0.90 < |Ku| < −0.43). Overall, this instrument presents good evidence and reliability based on its internal structure.

2.3.3. Organizational Culture Assessment Instrument (OCAI)

The current scale was developed by Cameron and Quinn [11] based on the Competing Values Framework, a theoretical paradigm addressing organizational effectiveness. This scale assesses the primary strategies employed in managing institutional effectiveness and the fundamental characteristics of the Organizational Culture typology (current and wished), as perceived by employees. In this study, only the current Organizational Culture was assessed.
The adaptation of the scale for a sample of the Portuguese population resulted in modifications to its original structure. The proposed model comprises four dimensions: Innovation (e.g., “In general, leadership in your organization is entrepreneurial, innovative, and takes risks.”), Trust/Participation (e.g., “Your organization places a strong emphasis on human development. High levels of trust, openness, and participation persist.”), Results/Competitiveness (e.g., “Your organization prioritizes competitive actions and success. Achieving challenging goals and staying ahead in the market are dominant characteristics.”) and Rigidity/Control (e.g., “What keeps your organization united are formal rules and policies. Maintaining effective organizational functioning is essential.”). Responses were recorded on a 100-point scale.
The instrument exhibited acceptable fit to the sample of the study (χ2/df = 5.00; SRMR = 0.60; CFI = 0.91; NFI = 0.89; GFI = 0.90; RMSEA = 0.09). The items displayed suitable factor loadings, notably exceeding 0.58. The measure presented adequate values of convergent evidence (AVEResults/Competitiveness = 0.51; AVERigidity/Control = 0.55), apart from two factors (AVETrust/Participation = 0.39; AVEInnovation = 0.45). Regarding the internal consistency, the instrument presented good values (0.71 < ω < 0.84; 0.74 < α < 0.88), and all items exhibited reasonable sensitivity (0.96 < |Sk| < 1.92; 0.79 < |Ku| < 6.51). In general, the scale presents reasonable psychometric properties.

2.3.4. Organizational Life Cycle (OLC)

The OLC scale was originally created and developed by Lester et al. [23] to identify the stage of the life cycle in which organizations find themselves.
In adapting this instrument for a sample of the Portuguese population, the original structure of the scale was retained. It includes 20 items grouped into five categories: existence stage (e.g., “Our organization is small, both in size and in comparison, to our competitors.”), survival stage (e.g., “Power in our company is distributed among a group of various owners/investors.”), success stage (e.g., “As a company, we are larger than most of our competitors but not as large as we could be.”), renewal stage (e.g., “We are a widely dispersed organization with a board of directors and shareholders.”), and the decline stage (e.g., “Our structure is centralized with few control systems.”). Responses were rated on a 5-point Likert scale (1 = Strongly Disagree; 5 = Strongly Agree).
The instrument exhibited a modest fit with the sample under study (χ2/df = 4.56; SRMR = 0.09; CFI = 0.83; TLI = 0.79; GFI = 0.85; RMSEA = 0.08). Apart from item 20, which displayed a lower factor weight (λ = 0.39), the items demonstrated suitable factor loadings, exceeding 0.50. Concerning the convergent evidence, the measure presented values below the recommended range (0.30 < AVE < 0.44). The instrument presented low-to-acceptable values for internal consistency (0.62 < ω < 0.75; 0.57 < α < 0.71). It should be noted that all items showed reasonable psychometric sensitivity (0.34 < |Sk| < 0.20; 0.38 < |Ku| < 0.11). Overall, this instrument presents acceptable evidence and reliability based on its internal structure.

2.3.5. Health and Work Questionnaire (HWQ)

The present scale, developed by Shikiar et al. [3], aims to assess employees’ work performance and mental health. In our study of the psychometric properties of this instrument for this sample, no modifications to the original scale structure were necessary.
The scale comprises 20 items, organized into six subscales: productivity (e.g., “Rate your highest level of efficiency this week.”), concentration impairment (e.g., “Feeling restless while at work?”), relationships with supervisors (e.g., “How satisfied were you this week with your relationships with your supervisors?”), non-work satisfaction (e.g., “How personally fulfilling was your life outside of work this week?”), job satisfaction (e.g., “How satisfied were you this week with the physical environment in which you work, for example, the level of noise, temperature?”) and impatience/irritability (e.g., “Getting annoyed or irritated with coworkers, boss/supervisor, customers/suppliers, or others?”). It is worth noting that, for the subscales of concentration impairment and impatience/irritability, the constructs were assessed in a negative direction.
Participants’ responses were recorded using a 10-point Likert scale, ranging from 1 (Not Stressful at All; Very Dissatisfied; Not Gratifying at All; No Control; Not Easy at All; Worst Week Ever; or Never) to 10 (Very Stressful; Very Satisfied; Very Gratifying; Total Control; Very Easy; Best Week Ever; or Almost Always).
The structural model demonstrated a good fit with the study sample (χ2/df = 3.70; SRMR = 0.05; CFI = 0.94; GFI = 0.90; TLI = 0.93; RMSEA = 0.07). The items displayed suitable factor loadings exceeding 0.52. Regarding convergent evidence, the values presented were below the recommended range (0.30 < AVE < 0.44) but showed good values for internal consistency (0.61 < ω < 0.86; 0.80 < α < 0.90). Regarding psychometric sensitivity, all items exhibited good psychometric sensitivity (0.96 < |Sk| < 1.92; 0.79 < |Ku| < 6.51). In general, the measure presents reasonable psychometric properties.

2.4. Procedure

The survey was created using the Google Forms platform, which enabled online distribution via social media platforms (Facebook, Instagram, and LinkedIn) between March 2020 and January 2021. The questionnaire consisted of the previously mentioned instruments, accompanied by an informed consent form presented to participants before they accessed the survey. This form informed participants about the study’s objectives, ensured the anonymity and confidentiality of the collected data, clarified that participants could withdraw at any time without consequences, and provided the contact details of the principal researcher.
It is important to note that the project WorkHappy, in which this protocol is embedded, was submitted to the Ethics Committee of Ispa—Instituto Universitário and subsequently approved (I/055/05/2021). Throughout this research, adherence to the guidelines of the American Psychological Association [44] and the standards of the Portuguese Order of Psychologists [45] was maintained.

2.5. Data Analysis

Data were transferred from Google Forms to Microsoft Excel for data cleaning and coding, after which the analysis was carried out using the Statistical Package for Social Sciences (SPSS, v. 31).
Given that the instruments used in this study had not previously been validated for a Portuguese sample, exploratory and confirmatory factor analyses of the scales described in the Section 2.3 were conducted using Analysis of Moment Structures (AMOS) software (v. 29). Furthermore, a structural equation analysis was performed, employing the AMOS program. A structural equation model was constructed to assess whether the independent variables were significantly related to the dependent variables in question [46] based on the theoretical framework of the JD-R model [34], with O.C., WLB, and O.L.C operationalized as job resources predicting work performance. The specification of paths between specific dimensions of these constructs was informed by the existing literature but should be considered exploratory in nature, given the absence of prior empirical evidence for each individual path.
The assessment of the structural equation model goodness of fit was conducted based on reference values. Concerning χ2/df, values above 5 showed poor fit; values between 2 and 5 showed acceptable fit; and values around 1 reflected very good fit. It is worth noting that, according to the literature, the RMSEA (root mean square error of approximation) index tends to increase with the addition of more variables to the model, with values that vary as follows: >0.10, unacceptable fit; [0.10; 0.05], fair fit; [0.05; 0.01], good fit; and <0.01, very good fit [46]. As for the SRMR (Standardized Root Mean Square Residual), reference values are typically <0.10. For the CFI (Comparative Fit Index) and TLI (Tucker–Lewis Index) indicators, values below 0.9 signified poor fit; [0.9; 1.0] signified good fit; and 1.0 signified perfect fit. Lastly for the GFI (Goodness-of-Fit index), values below 0.9 indicate poor fit; [0.9; 0.95] indicate good fit; and >0.95 indicate very good fit [46].
Regarding the values of convergent evidence (AVE), those higher than 0.50 are considered appropriate [40]. As for the composite reliability, McDonald’s Omega was used. The existing literature indicates that all values greater than 0.70 are considered suitable [47]. The reference values for the internal consistency indicator, Cronbach’s alpha, were as follows: ≥0.90, high consistency; [0.8; 0.9], good consistency; [0.7; 0.8], satisfactory consistency; [0.6; 0.7], low consistency; and <0.6, unacceptable [46].
The sensitivity of the data was also examined by analyzing minimum and maximum values, as well as assessing the asymmetry (Skewness, Sk) and Kurtosis (Ku) coefficients. In this context, absolute values indicating |Sk| > 3 and |Ku| > 7 were taken as indicators of potential sensitivity problems [46].

3. Results

3.1. Descriptive Statistics

As illustrated in Table 2, participants exhibited moderate levels of WLB and O.L.C., while they reported low levels of O.C. Concerning the dependent variable, participants reported an overall moderate level of work performance, with the productivity subscale receiving the highest score and the impatience/irritability subscale receiving the lowest score.

3.2. Structural Equation Modeling of Organizational Conditions and Performance

The preliminary structural model demonstrated an acceptable fit (χ2/df = 3.38; SRMR = 0.07; CFI = 0.86; TLI = 0.85; GFI = 0.81; RMSEA = 0.04); however, it was observed that some variables did not show significant relationships with the various dimensions of performance (e.g., O.L.C. existence → job satisfaction). Therefore, non-significant pathways were removed.
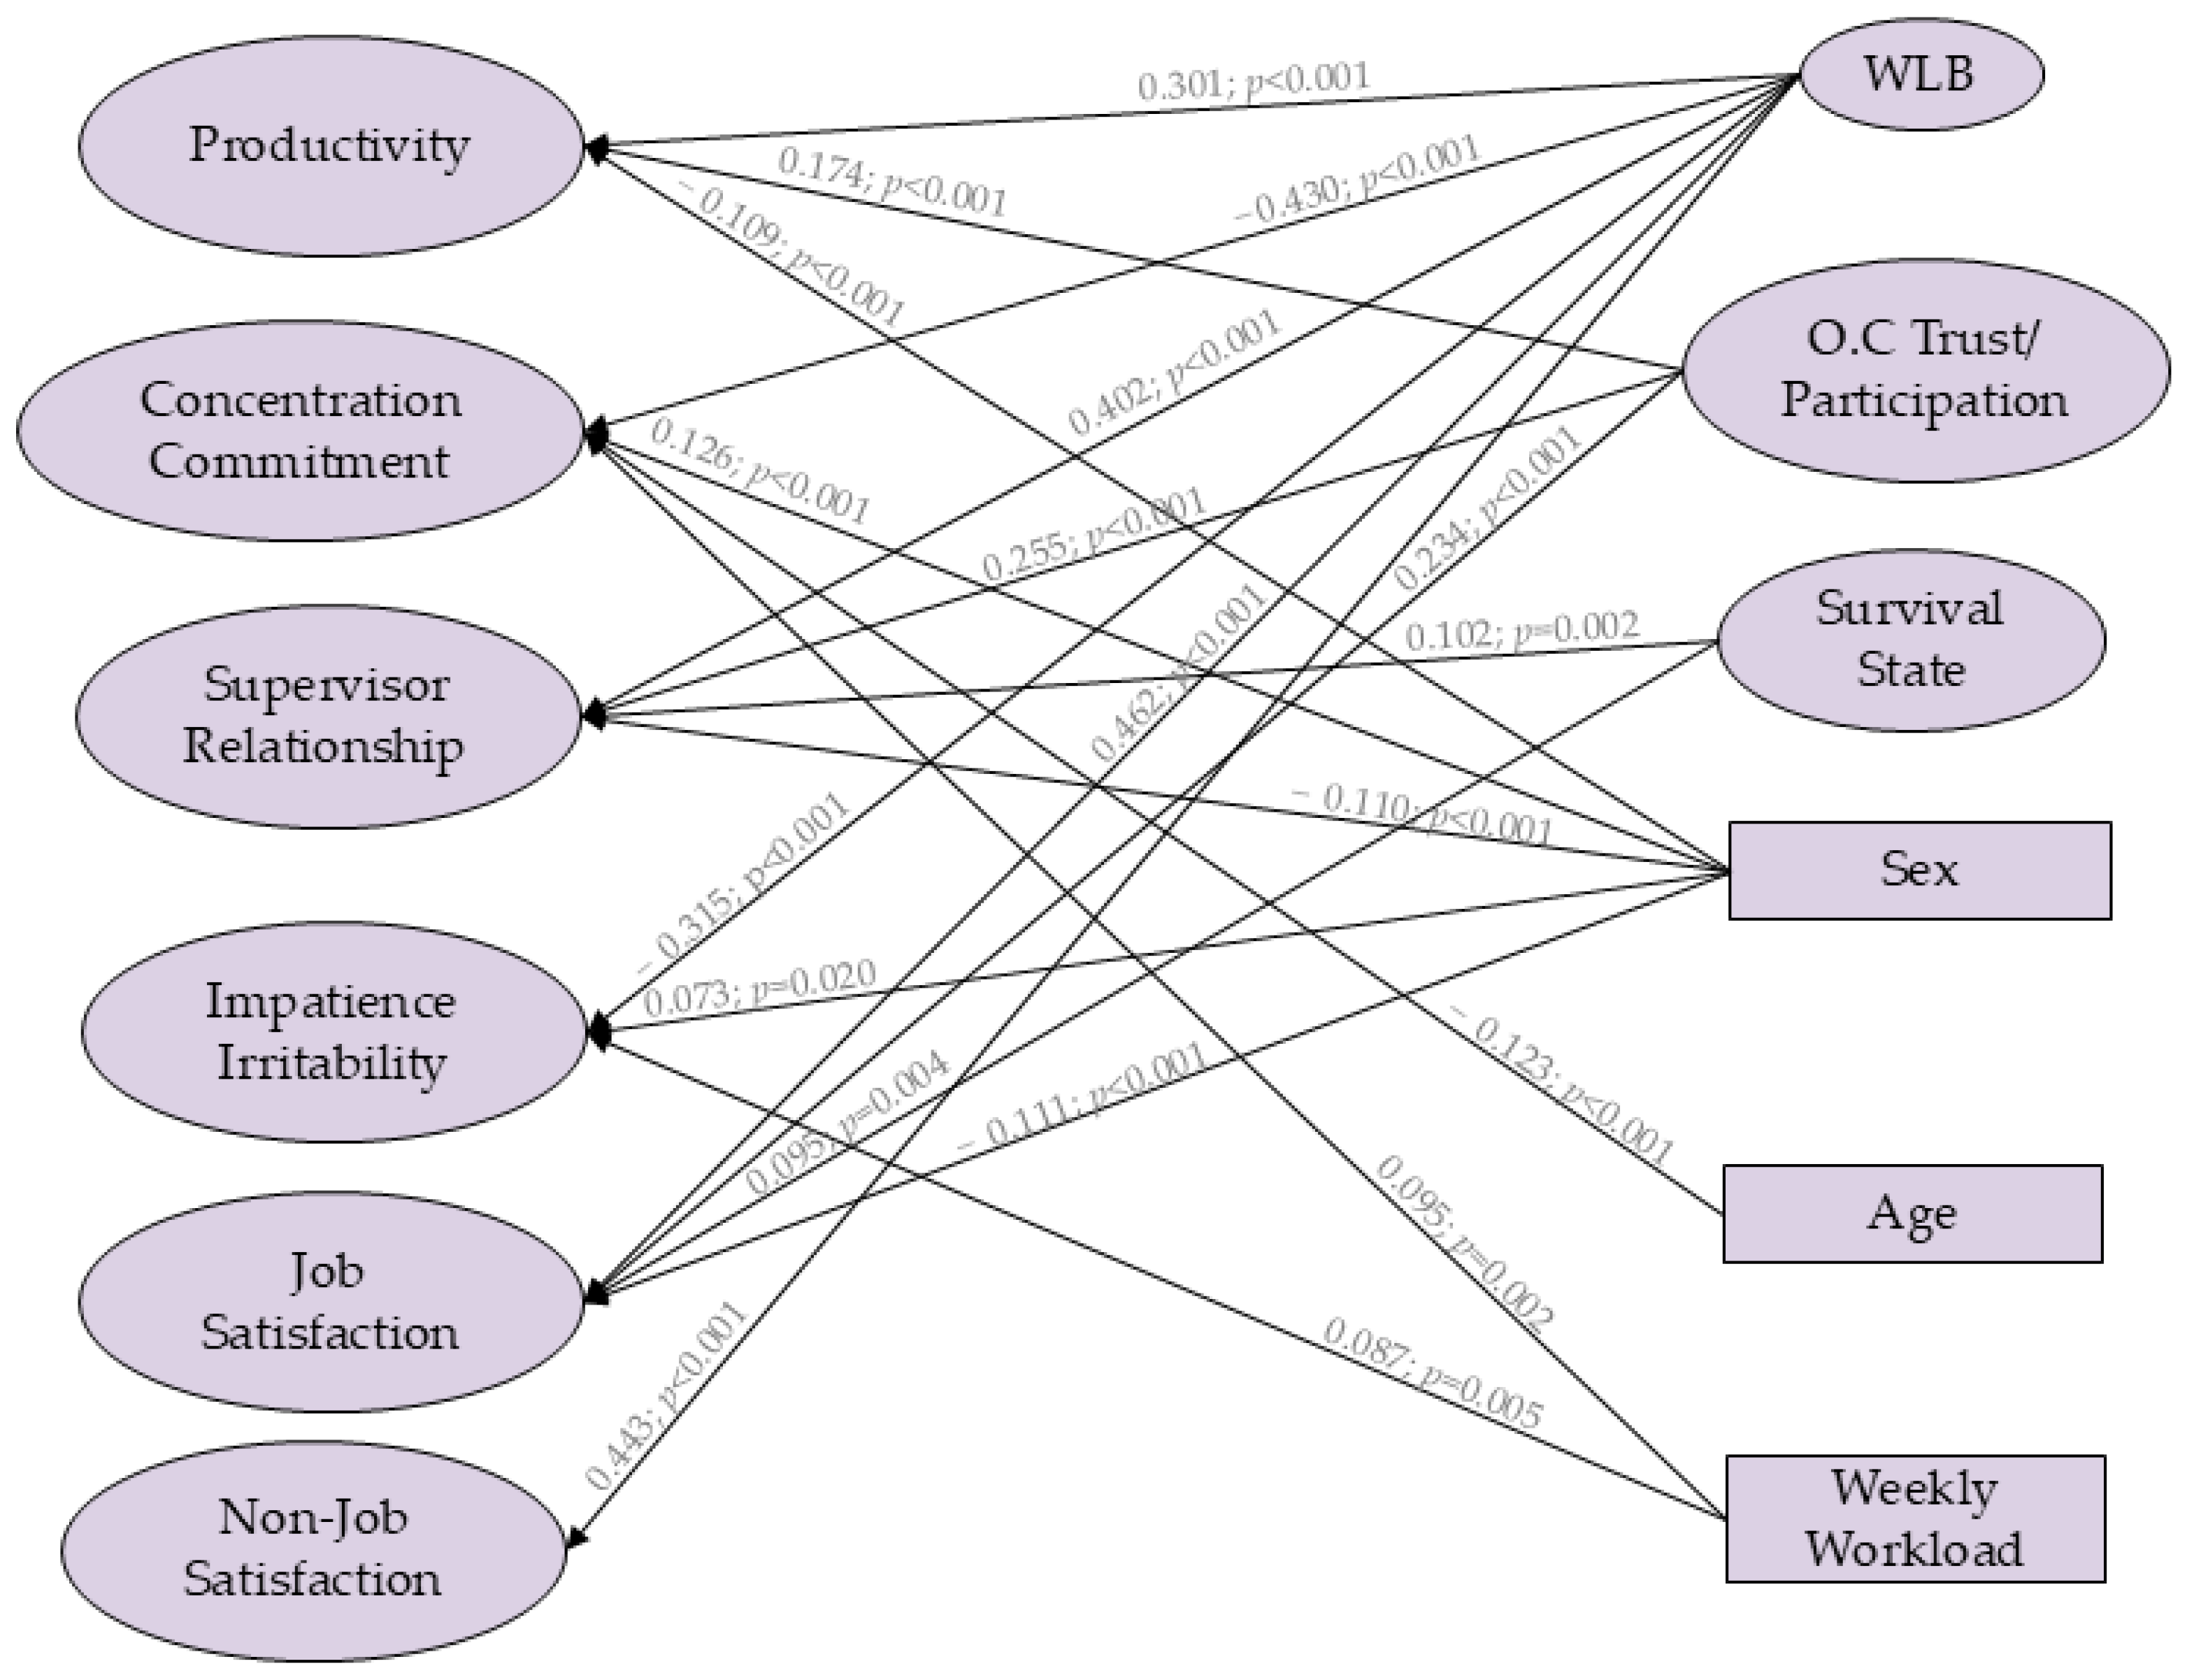
After removing these pathways, the fit of the structural model remained acceptable (χ2/df = 4.14; SRMR = 0.07; CFI = 0.82; TLI = 0.81; GFI = 0.80; RMSEA = 0.05, p < 0.001), as represented in Figure 1. The developed model explains between 11% and 29% of the variability in work performance for variables such as WLB, O.C., O.L.C., sex, age, and working hours in this sample.

4. Discussion

4.1. Discussion of Study Results

The present study aimed to examine whether organizational conditions, namely Work–Life Balance (WLB), Organizational Culture (O.C.), and Organizational Life Cycle (O.L.C.), predict work performance dimensions in a sample of Portuguese working adults, controlling for sociodemographic and occupational variables. The findings were interpreted within the theoretical framework of the Job Demands–Resources (JD-R) model [34], which conceptualizes WLB and O.C. as job resources that may buffer the impact of job demands on performance outcomes. Overall, the results partially supported the proposed hypotheses, with WLB and a trusted/participative O.C. emerging as the most consistent predictors of performance across dimensions, while the role of O.L.C. was more limited in scope. The following sections discuss these findings in detail, considering their theoretical implications and the limitations inherent to the exploratory and cross-sectional nature of the study.
Based on the data analysis carried out, the results suggest that, in the sample studied, workers with a more positive perception of WLB reported greater productivity, confirming our first hypothesis. In the eyes of the JD-R model [34], WLB may be viewed as a job resource that enhances motivation and promotes goal completion. This outcome may be attributed to the adept organization of time by these workers in the workplace, resulting in increased efficiency, aligning with findings from the existing literature [1].
Regarding the sex variable, women reported lower productivity. This result may reflect an imbalance between job demands and job resources among women, consistent with research indicating that women tend to experience higher levels of work–family conflict, which may constrain the resources available for work tasks [34]. Similar findings have been reported in the literature, with some studies suggesting that gender differences in productivity may be context-dependent [48].
Lastly, participants in an O.C. characterized by trust/participation revealed higher productivity. One explanation in the eyes of JD-R model [34] is that, when employees feel listened to and participate in team decisions, they are more willing to be efficient and perceive more job resources. This aligns with the data reported by Pechincha [49], who emphasized the positive impact of adopting this type of O.C. This will allow the institution to be seen as a place where everyone contributes to maintaining the organization and increasing productivity [15].
Concentration impairment was another dimension of performance under investigation. Participants who reported better perceived WLB experienced lower levels of concentration impairment. Within the JD-R model [34], WLB may operate as a resource that reduces the impact of job demands. The current literature corroborates the presented results, while highlighting the consequences of a negative perception of WLB, such as heart disease and insecurity [50]. Another result reflects the impact of workers’ age: older workers reported having less difficulty concentrating. A possible explanation for this result is the experience and strategies that older workers have developed to concentrate on their tasks [51]. Regarding the sex variable, men reported having more concentration impairment than women. The reported results align with the current state of the art [52]; in most studies, men reported cognitive difficulties (e.g., memory lapses) [53]. Regarding the workload variable, participants who worked more hours per week reported greater concentration impairment. A possible explanation is that people with longer working hours (job demand) are at a greater risk of experiencing difficulties in maintaining focus, as the literature verifies [54].
Another performance dimension studied was the relationship with the supervisor. Regarding the WLB variable, participants with a more positive WLB perception indicated that they had a better quality of relationship with their supervisor (job resource). This aligns with the literature, where employees characterize their relationships as safe and flexible [55], as hypothesized in this study. For the sex variable, men reported having a higher quality of relationship with their supervisor compared to women. This result is inconsistent with the prevailing literature. One possible explanation, supported by research on work–family conflict, is that women may face additional demands outside of the workplace that affect the quality of workplace relationships [56], though this interpretation requires further empirical investigation.
Regarding the variable O.C., participants indicated that working in an O.C. that is trustworthy/participative improves the quality of their relationship with their supervisor. One possible explanation for this outcome is that employees perceive their opinions and efforts as valued within the framework of their relationships with supervisors, representing a positive job resource [34,57]. Additionally, the variable O.L.C., specifically the survival stage, had a positive impact on the quality of a participant’s relationship with their supervisor. This result can be attributed to organizations’ emphasis on facilitating communication between departments, fostering improved interaction between employees and supervisors [23,25].
Impatience/irritability was another performance dimension examined in the study. For the WLB variable, participants with a more positive WLB perception reported feeling less impatience/irritability. One explanation for this finding is the fact that workers can find a balance between their professional and non-work responsibilities, meaning that they perceive fewer conflicts and more job resources [34,58]. On the other hand, the results We obtained suggest that women tend to report feeling less impatience and irritability. This finding is consistent with research suggesting gender differences in emotional regulation strategies in occupational contexts [59], though the mechanisms underlying this association remain unclear. Regarding the workload variable, participants reported that the more hours per week they worked, the more impatience/irritability they felt. The current literature corroborates the reported results, but researchers emphasize that working conditions can be a mediating factor in the relationship between working hours and workers’ impatience/irritability [59], leading to the hypothesis of there being more job demands than job resources [34].
The fifth dimension of performance studied was job satisfaction. Analysis of the data concerning the sex variable revealed that women reported lower professional satisfaction, a finding supported by the existing literature. Research suggests that gender differences in job satisfaction may be associated with structural factors, including unequal access to career advancement opportunities and greater work–family conflict among women [60]. Regarding the WLB variable, workers with a better perception of WLB perceive greater job satisfaction. This outcome could be attributed to the notion that participants with an improved WLB foster more satisfying relationships with colleagues and perceive their work as more rewarding, while perceiving more job resources [34,61]. For the O.C. variable, employees integrated into a trustworthy and participatory O.C. perceived greater professional satisfaction. An explanatory hypothesis for this outcome is that employees may feel empowered to share their opinions, resulting in greater job satisfaction and more positive relationships with colleagues [62,63]. In the O.L.C. survival stage, employees reported greater job satisfaction. One explanation for this result is that employees working in organizations at this stage may feel part of the organization’s foundation, reinforcing the role of organizational resources in promoting positive work-related outcomes [34]. This sense of involvement allows them to derive greater satisfaction from work and perceive relationships with colleagues as more rewarding [23,31].
The last dimension of performance studied was non-work satisfaction, with participants reporting greater satisfaction with non-work aspects when they had a more positive perception of WLB. One explanation for this result is that employees with a better perception of WLB tend to invest more in their life outside of work, consequently experiencing greater satisfaction in their non-work life. Current research aligns with these results and highlights that this relationship acts as a protective factor against the symptoms of Burnout syndrome [64,65].
Regarding the generalizability of these findings, the occupational heterogeneity of the sample warrants consideration. Because recruitment was conducted online [66] with professional activity as the sole occupational inclusion criterion, the sample reflects a broad cross-section of Portuguese working adults rather than a specific professional field. This sampling approach is consistent with the study’s theoretical framework, as the JD-R model was developed as a heuristic applicable across a wide range of occupations and work settings [34], and its core propositions have been empirically supported across distinct occupational samples [37]. Similarly, the relationship between WLB and work-related outcomes has been demonstrated across diverse samples of workers and cultural contexts [42]. Accordingly, the present findings are best interpreted as applying to professionally active Portuguese adults in general, within the specific socio-historical context of data collection. Nevertheless, because individual occupation was not recorded in the survey protocol, it was not possible to test whether the observed associations vary across professional fields, which constitutes a boundary condition of the present conclusions.

4.2. Study Limitations

Regarding the limitations of the study, the following should be highlighted: (1) there was a lack of measurements for peer relationships in the workplace; (2) the O.C. scale, with multi-thematic items and an extensive response scale, may have led participants to exceed or fall below 100 points when characterizing their organization; (3) the measures used to assess O.C., O.L.C. and performance variables revealed a low level of convergent validity, which we attribute to the fact that the scales assessed different characteristics of the constructs; (4) the lack of recent literature on the O.L.C. potentially affected the applicability of the model, given advances in the organizational structure; (5) there was a low participation for men; (6) the online sample and data collection method facilitated data collection but could exclude people with low digital literacy [66]; (7) the JD-R model [34] was not constructed through data analysis, and therefore these interpretations should be considered theoretical rather than confirmatory; and (8) the use of a convenience sample of Portuguese working adults, without controlling for the specifics of the work or knowing the impact of the characteristics of different professions, limits the generalizability of the findings. The results should not be extrapolated to other occupational groups, cultural contexts, or national populations without further empirical verification. Additionally, the predominantly female sample further restricts the extent to which the findings can be generalized across gender groups.

4.3. Future Research

Future research should explore the impact of various variables on job performance, particularly by examining how employees seek organizations that align with their personal values and exploring the phenomena of job hopping and quiet quitting. Additionally, research should investigate the influence of workplace peer relationships on performance. Future studies may benefit from developing and adapting instruments with Likert-type response scales to facilitate a more intuitive participant response. Regarding O.L.C., future studies should investigate the formation of new organizations and how Artificial Narrow Intelligence is influencing this process. In terms of methodology, future studies should consider combining qualitative methods with quantitative studies. Finally, it would be valuable for future research projects to replicate the present study to determine if the results obtained hold in non-pandemic periods, using the reported results as a point of comparison.

4.4. Implications for Occupational Health

The findings of the present study provide relevant insights into occupational health by highlighting how different working conditions contribute to employees’ functioning and well-being. In line with the Job Demands–Resources (JD-R) model [34], variables such as workload operate as job demands, being associated with concentration difficulties and irritability. Conversely, variables such as WLB and an O.C. characterized by trust/participation can be understood as key job resources, consistently related to more favorable outcomes, including a better perception of productivity, improved supervisory relationships, and greater job satisfaction.
From an occupational health perspective, these findings are consistent with the notion that employee functioning may not be solely determined by the presence of job demands but may also be influenced by the balance between job demands and available job resources. In particular, the findings indicate that resource-enhancing conditions may mitigate the negative impact of demanding work environments, supporting both well-being and performance. This has practical implications for organizations, as these findings tentatively suggest that interventions targeting both the reduction in job demands and the strengthening of structural and social resources within the workplace may be worth exploring, though longitudinal research is needed to verify these associations.

5. Conclusions

In conclusion, this study involving professionally active adults revealed that O.C., O.L.C., WLB, sex, age, and workload are the most influential predictors for the performance of job demands. However, certain characteristics of these job demands, such as O.C. (Innovation, Results/Competitiveness, and Rigidity/Control), stages of the O.L.C. (existence, success, renewal, and decline), and the organization’s size, were not found to be significant predictors of performance based on the proposed model. The results from this study emphasize the importance of institutions investing in measures to promote WLB and foster trust and participation within their O.C. These institutions may witness improved employee job resources and performance, potentially leading to increased organizational profitability.

Author Contributions

Conceptualization, I.P., I.L. and F.P.; methodology, A.R.N., I.P. and F.P.; software, A.R.N. and F.P.; validation, A.R.N., I.P., I.L. and F.P.; formal analysis, A.R.N. and F.P.; investigation, I.P. and F.P.; resources, I.P., I.L. and F.P.; data curation, I.P. and F.P.; writing—original draft preparation, A.R.N. and F.P.; writing—review and editing, I.P. and I.L.; visualization, A.R.N., I.P. and F.P.; supervision, I.L.; project administration, I.P. and F.P.; funding acquisition, I.P., I.L. and F.P. All authors have read and agreed to the published version of the manuscript.

Funding

This work was funded by national funds through FCT—Fundação para a Ciência e a Tecnologia, I.P., within the scope of the R&D Unit UID/04810/2025—William James Center for Research, https://doi.org/10.54499/UID/04810/2025.

Institutional Review Board Statement

The project in this study was conducted in accordance with the Declaration of Helsinki and Ethics Council of Ispa—Instituto Universitário (approval code I/055/05/2021 on 6 May 2021).

Informed Consent Statement

Informed consent was obtained from all subjects involved in the study.

Data Availability Statement

The dataset presented in this article is available upon request from the corresponding author.

Conflicts of Interest

The authors declare no conflicts of interest.

Abbreviations

The following abbreviations are used in this manuscript:
WLBWork–Life Balance
O.C.Organizational Cultural
O.LC.Organizational Life Cycle
JD-RJob Demands–Resources

References

  1. Galinha, F.G. A Perceção dos Colaboradores da Empresa Elevus Sobre a Relação Entre o Work-Life Balance, a Produtividade e o Compromisso Organizacional; Internship Report; Universidade Europeia: Lisbon, Portugal, 2022. [Google Scholar]
  2. Abubakar, A.M.; Elrehail, H.; Alatailat, M.A.; Elçi, A. Knowledge management, decision-making style and organizational performance. J. Innov. Knowl. 2019, 4, 104–114. [Google Scholar] [CrossRef]
  3. Shikiar, R.; Halpern, M.T.; Rentz, A.M.; Khan, Z.M. Development of the Health and Work Questionnaire (HWQ): An instrument for assessing workplace productivity in relation to worker health. Work 2004, 22, 219–229. [Google Scholar] [CrossRef] [PubMed]
  4. Sivatte, I.; Gordon, J.R.; Rojo, P.; Olmos, R. The impact of work-life culture on organizational productivity. Pers. Rev. 2015, 44, 883–905. [Google Scholar] [CrossRef]
  5. Pinheiro, B.; Pimenta, F.; Patrão, I. Work life balance e sua relação com a produtividade. In Actas do 13º Congresso Nacional de Psicologia da Saúde; Pereira, H., Monteiro, S., Esgalhado, G., Cunha, A., Leal, I., Eds.; Edições ISPA: Lisboa, Portugal, 2020; pp. 823–832. [Google Scholar]
  6. Nugraha, R.; Wolor, C.W.; Yohana, C. The Effect of Work from Home, Work-Life Balance, and Job Satisfaction on Employee Performance. Econ. Manag. 2022, 95, 103–112. [Google Scholar] [CrossRef]
  7. Putra, K.C.; Pratama, T.A.; Linggautama, R.A.; Prasetyaningtyas, S.W. The impact of flexible working hours, remote working, and work life balance to employee satisfaction in banking industry during COVID-19 pandemic period. J. Bus. Manag. Rev. 2020, 1, 341–353. [Google Scholar] [CrossRef]
  8. Chigeda, F.; Ndofirepi, T.M.; Steyn, R. Continuance in organizational commitment: The role of emotional intelligence, work-life balance support, and work-related stress. Glob. Bus. Organ. Excell. 2022, 42, 22–38. [Google Scholar] [CrossRef]
  9. Kelliher, C.; Richardson, J.; Boiarintseva, G. All of work? All of life? Reconceptualising work-life balance for the 21st century. Hum. Resour. Manag. J. 2019, 29, 97–112. [Google Scholar] [CrossRef]
  10. Andrade, M.C.P. Work-Life Balance: Condições de trabalho facilitadoras da integração do papel profissional e familiar. Exedra Rev. Cient. 2011, 1, 41–54. [Google Scholar] [CrossRef]
  11. Cameron, K.S.; Quinn, R.E. Diagnosing and Changing Organizational Culture, 1st ed.; Jossey-Bass: San Francisco, CA, USA, 2006. [Google Scholar]
  12. Pandey, R. The Impact of Organisational Culture on Employees’ Behaviour in Research and Development Organisation. J. Pharm. Negat. Results 2022, 13, 874–887. [Google Scholar] [CrossRef]
  13. Espasandín-Bustelo, F.; Ganaza-Vargas, J.; Diaz-Carrion, R. Employee happiness and corporate social responsibility: The role of organizational culture. Empl. Relat. 2020, 43, 609–629. [Google Scholar] [CrossRef]
  14. Sriram, K.V.; Drisya, R.; Giridhar, K. Does Work Environment & Work-Life Balance Influence Women Employees’ Intention to Stay? Stud. Bus. Econ. 2022, 17, 239–251. [Google Scholar] [CrossRef]
  15. Mohsen, A.; Neyazi, N.; Ebtekar, S. The impact of organizational culture on employees performance: An overview. Int. J. Manag. 2020, 11, 879–888. [Google Scholar]
  16. Nazneen, A.; Miralam, M.S.; Qazi, S. Impact of employee engagement and organizational culture in high performing accredited university of Saudi Arabia. Int. J. Account. Financ. Report. 2018, 8, 180–196. [Google Scholar] [CrossRef]
  17. Assens-Serra, J.; Boada-Cuerva, M.; Serrano-Fernández, M.J.; Villajos, E.; Boada-Grau, J. Spanish Adaptation of the Organizational Culture Assessment Instrument: Reflection on the Difficulty in Transferring the Ad Hoc Factor. Front. Psychol. 2021, 12, 817232. [Google Scholar] [CrossRef] [PubMed]
  18. Papa, A.; Dezi, L.; Gregori, G.L.; Mueller, J.; Miglietta, N. Improving innovation performance through knowledge acquisition: The moderating role of employee retention and human resource management practices. J. Knowl. Manag. 2018, 24, 589–605. [Google Scholar] [CrossRef]
  19. Freshwater, W.S. Assessment and Evaluation of Organizational Life Cycle Theorizing. Organ. Dev. J. 2020, 38, 21–32. [Google Scholar]
  20. Quinn, R.E.; Cameron, K. Organizational life cycles and shifting criteria of effectiveness: Some preliminary evidence. Manag. Sci. 1983, 29, 33–51. [Google Scholar] [CrossRef]
  21. Helfat, C.E.; Peteraf, M.A. The dynamic resource-based view: Capability lifecycles. Strateg. Manag. J. 2003, 24, 997–1010. [Google Scholar] [CrossRef]
  22. Gamal, L.; Wahba, H.; Correia, M.D. Corporate sustainability performance throughout the firm life cycle: Case of Egypt. Corp. Gov. Organ. Behav. Rev. 2022, 6, 79–97. [Google Scholar] [CrossRef]
  23. Lester, D.L.; Parnell, J.A.; Carraher, S. Organizational life cycle: A five-stage empirical scale. Int. J. Organ. Anal. 2003, 11, 339–354. [Google Scholar] [CrossRef]
  24. Greiner, L.E. Evolution and Revolution as Organizations Grow. In Readings in Strategic Management, 1st ed.; Asch, D., Bowman, C., Eds.; Palgrave: London, UK, 1989; pp. 373–387. [Google Scholar] [CrossRef]
  25. Daft, R.L.; Weick, K.E. Toward a model of organizations as interpretation systems. Acad. Manag. Rev. 1984, 9, 284–295. [Google Scholar] [CrossRef]
  26. Adizes, I. Organizational passages—Diagnosing and treating lifecycle problems of organizations. Organ. Dyn. 1979, 8, 3–25. [Google Scholar] [CrossRef]
  27. Miller, D.; Friesen, P.H. Momentum and revolution in organizational adaptation. Acad. Manag. J. 1980, 23, 591–614. [Google Scholar] [CrossRef] [PubMed]
  28. Habib, A.; Hasan, M.M. Firm life cycle, corporate risk-taking and investor sentiment. Account. Financ. 2017, 57, 465–497. [Google Scholar] [CrossRef]
  29. Su, X. Entrepreneurial orientation and performance of Chinese high-tech firms: The mediating role of organizational learning and moderating role of firm life cycle. Front. Bus. Res. China 2013, 7, 487–504. [Google Scholar]
  30. Santana Junior, G.M.; Callado, A.L.C. A Influência dos Estágios do Ciclo de Vida Organizacional no Uso de Medidas de Desempenho em Empresas Industriais. GESTÃO Org. 2020, 18, 64–81. [Google Scholar] [CrossRef]
  31. Parellada, F.S.; Campos, H.M.; Atondo, G.H.; Quintero, M.R. Strategic decision making, entrepreneurial orientation and performance: An organizational life cycle approach. Rev. Adm. FACES J. 2015, 14, 9–24. [Google Scholar]
  32. Rauch, A.; Wiklund, J.; Lumpkin, G.T.; Frese, M. Entrepreneurial orientation and business performance: Cumulative empirical evidence. Entrep. Theory Pract. 2009, 33, 761–787. [Google Scholar] [CrossRef]
  33. Withisuphakorn, P.; Jiraporn, P. The effect of firm maturity on corporate social responsibility (CSR): Do older firms invest more in CSR? Appl. Econ. Lett. 2016, 23, 298–301. [Google Scholar] [CrossRef]
  34. Bakker, A.B.; Demerouti, E. The job demands-resources model: State of the art. J. Manag. Psychol. 2007, 22, 309–328. [Google Scholar] [CrossRef]
  35. Dollard, M.F.; Bakker, A.B. Psychosocial safety climate as a precursor to conducive job demands and job resources: A multilevel model. J. Occup. Health Psychol. 2010, 15, 579–599. [Google Scholar] [CrossRef] [PubMed]
  36. Bakker, A.B.; Demerouti, E.; Schaufeli, W.B. Work-home interference and burnout: A study on the role of job demands and job resources. Hum. Relat. 2005, 58, 170–189. [Google Scholar] [CrossRef]
  37. Schaufeli, W.B.; Bakker, A.B. Job demands, job resources, and their relationship with burnout and engagement: A multi-sample study. J. Organ. Behav. 2004, 25, 293–315. [Google Scholar] [CrossRef]
  38. Demerouti, E.; Bakker, A.B. Job demands–resources theory and organizational change: New insights and prospects. Int. J. Environ. Res. Public Health 2017, 14, 1213. [Google Scholar] [CrossRef] [PubMed]
  39. Newbert, S.L. Empirical research on the resource-based view of the firm: An assessment and suggestions for future research. Strateg. Manag. J. 2007, 28, 121–147. [Google Scholar] [CrossRef]
  40. Coolican, H. Research Methods and Statistics in Psychology, 1st ed.; Psychology Press: London, UK, 2014. [Google Scholar]
  41. Pimenta, F.; Ferreira, M.C.; Mainprize, H.; Romão, F.; Patrão, I. Work-Life Balance Scale: Desenvolvimento e estudo das propriedades psicométricas. Psicol. Saúde Doenças 2022, 23, 187–188. [Google Scholar]
  42. Haar, J.M.; Russo, M.; Suñe, A.; Ollier-Malaterre, A. Outcomes of work–life balance on job satisfaction, life satisfaction and mental health: A study across seven cultures. J. Vocat. Behav. 2014, 85, 361–373. [Google Scholar] [CrossRef]
  43. Wepfer, A.G.; Brauchli, R.; Jenny, G.J.; Hämmig, O.; Bauer, G.F. The experience of work-life balance across family-life stages in Switzerland: A cross-sectional questionnaire-based study. BMC Public Health 2015, 15, 1290. [Google Scholar] [CrossRef] [PubMed]
  44. American Psychological Association. Ethical Principles of Psychologists and Code of Conduct; APA: Washington, DC, USA, 2017; Available online: http://www.apa.org/ethics/code/ (accessed on 1 March 2026).
  45. Ordem dos Psicólogos Portugueses. Código Deontológico; OPP: Lisboa, Portugal, 2011. Available online: https://www.ordemdospsicologos.pt/ (accessed on 1 March 2026).
  46. Marôco, J. Análise de Equações Estruturais: Fundamentos Teóricos, Software e Aplicações, 3rd ed.; ReportNumber: Pêro Pinheiro, Portugal, 2021. [Google Scholar]
  47. Rodrigues, F.; Cid, L.; Forte, P.; Teixeira, D.; Travassos, B.; Monteiro, D. A avaliação do hábito em praticantes de exercício físico: Testando a validade do self-report behavioral automaticity índex. Motricidade 2021, 17, 185–192. [Google Scholar] [CrossRef]
  48. Wood, W. Meta-analytic review of sex differences in group performance. Psychol. Bull. 1987, 102, 53–71. [Google Scholar] [CrossRef]
  49. Pechincha, A.D.C.C. Cultura Organizacional: Influência na Produtividade: Análise de um Caso. Master’s Thesis, Universidade Lusófona, Lisbon, Portugal, 2010. [Google Scholar]
  50. Goyal, K.A.; Babel, A.A. Issues and challenges of work life balance in banking industry of India. Pac. Bus. Rev. Int. 2015, 8, 113–118. [Google Scholar]
  51. Perestrelo, C.M. Idade, Antiguidade, Autonomia e Propensão ao Risco: Serão Estas Características Diferenciadoras nos Incentivos, Performance e Satisfação nas Empresas? Master’s Thesis, University of Lisbon, Lisbon, Portugal, 2021. [Google Scholar]
  52. Lakshmi, N.; Prasanth, V.S. A study on work-life balance in working women. Int. J. Adv. Multidiscip. Sci. Res. 2018, 1, 76–88. [Google Scholar] [CrossRef]
  53. McLafferty, S.; Preston, V. Who has long commutes to low-wage jobs? Gender, race, and access to work in the New York region. Urban Geogr. 2019, 40, 1270–1290. [Google Scholar] [CrossRef]
  54. Elbaz, S.; Richards, J.B.; Savard, Y.P. Teleworking and work–life balance during the COVID-19 pandemic: A scoping review. Can. Psychol. 2022, 64, 227–258. [Google Scholar] [CrossRef]
  55. Talukder, A.M.H.; Galang, M.C. Supervisor support for employee performance in Australia: Mediating role of work-life balance, job, and life attitude. J. Employ. Couns. 2021, 58, 2–22. [Google Scholar] [CrossRef]
  56. Blanch, A.; Aluja, A. Social support (family and supervisor), work–family conflict, and burnout: Sex differences. Hum. Relat. 2012, 65, 811–833. [Google Scholar] [CrossRef]
  57. Lee, K.; Cho, W. The relationship between transformational leadership of immediate superiors, organizational culture, and affective commitment in fitness club employees. Sport Mont 2018, 16, 15–19. [Google Scholar] [CrossRef]
  58. Mihelic, K.K.; Tekavcic, M. Work-family conflict: A review of antecedents and outcomes. Int. J. Manag. Inf. Syst. 2014, 18, 15–26. [Google Scholar] [CrossRef]
  59. Santos, P.K.M.D. Sofrimento Mental no Acadêmico de Enfermagem: Práticas Integrativas Complementares Como Estratégias Terapêuticas. Master’s Thesis, Faculdade de Educação e Meio Ambiente, Ariquemes, Brazil, 2020. [Google Scholar]
  60. Andrade, M.S.; Westover, J.H.; Peterson, J. Job Satisfaction and Gender. J. Bus. Divers. 2019, 19, 22–40. [Google Scholar] [CrossRef]
  61. Bellmann, L.; Hübler, O. Working from home, job satisfaction and work–life balance–robust or heterogeneous links? Int. J. Manpow. 2021, 42, 424–441. [Google Scholar] [CrossRef]
  62. Irfan, M.; Alaloul, W.S.; Ghufran, M.; Yaseen, G.; Thaheem, M.J.; Qureshi, A.H.; Bilal, M. Analyzing the impact of organizational culture on social sustainability: A perspective of the construction industry. Environ. Dev. Sustain. 2022, 26, 1103–1133. [Google Scholar] [CrossRef]
  63. Nurlina, N. Examining Linkage Between Transactional Leadership, Organizational Culture, Commitment and Compensation on Work Satisfaction and Performance. Gold. Ratio Hum. Resour. Manag. 2022, 2, 108–122. [Google Scholar] [CrossRef]
  64. Kelly, L.A.; Lefton, C.; Fischer, S.A. Nurse leader burnout, satisfaction, and work-life balance. J. Nurs. Adm. 2019, 49, 404–410. [Google Scholar] [CrossRef] [PubMed]
  65. Wong, K.P.; Chan, A.H.S. Exploration of the socioecological determinants of Hong Kong workers’ work-life balance: A grounded theory model. Int. J. Environ. Res. Public Health 2021, 18, 10732. [Google Scholar] [CrossRef] [PubMed]
  66. Falleiros, F.; Kappler, C.; Pontes, F.A.R.; Silva, S.S.C.; Goes, F.S.N.; Cucick, C.D. Uso de questionário online e divulgação virtual como estratégia de coleta de dados em estudos científicos. Texto Contexto Enferm. 2016, 25, e3880014. [Google Scholar] [CrossRef]
Figure 1. Structural equation modeling of organizational conditions and performance. Note. WLB = Work–Life Balance; O.C. = Organizational Culture.
Occuphealth 01 00032 g001
Table 1. Characterization of the sample according to sociodemographic variables.
Characteristicsn (SD)%
Age M (SD) 40.76 (10.58)---
Biological sexMasculine31631.6
Feminine68468.4
Relationship statusIn a relationship, and living with the partner66066.0
In a relationship, but not living with the partner13513.5
Single20520.5
Number of children037837.8
127327.3
228128.1
3 or more686.8
EducationPrimary, middle and high school282.9
College degree35835.8
Post-graduate or higher (master’s/doctorate)35035.0
Year of work experience M (SD) 18.32 (10.67)---
Years of organizational tenure M (SD) 10.92 (9.94)---
Weekly workload M (SD) 38.44 (9.13)---
Employment regimePart-time575.7
Full-time94394.3
Employment contractPermanent contract59959.9
Fixed-term contract17517.5
Indefinite duration contract14314.3
Freelance invoices585.8
Temporary work131.3
Secondment121.2
Size of the organizationMicro-enterprise (1 to 9 employees)12312.3
Small enterprise (10 to 49 employees)13113.1
Medium-sized enterprise (50 to 249 employees)15015.0
Large enterprise (250 or more employees)59659.6
Table 2. Descriptive statistics of the variables: Performance, Work–Life Balance, Organizational Culture and Organizational Life Cycle.
CharacteristicsM (DP)Minimum *Maximum *
PerformanceProductivity34.14 (8.11)5.0050.00
Concentration Impairment14.85 (8.72)4.0040.00
Supervisor Relationship13.14 (4.92)2.0020.00
Impatience Irritability10.30 (6.21)3.0030.00
Job Satisfaction26.35 (7.91)4.0040.00
Non-Job Satisfaction14.43 (4.05)2.0020.00
WLB 13.76 (5.28)0.0024.00
O.C.Innovation121.96 (88.08)0.00600.00
Trust Participation121.58 (80.93)0.00400.00
Results Competitiveness79.73 (54.52)0.00300.00
Rigidity Control92.91 (59.97)0.00300.00
O.L.C.Existence Stage10.04 (3.45)4.0020.00
Survival Stage11.54 (3.26)4.0020.00
Success Stage11.25 (3.16)4.0020.00
Renovation Stage10.92 (3.58)4.0020.00
Decline Stage11.17 (3.19)4.0020.00
* Minimum and maximum possible, considering the response scale of the instruments. Work–Life Balance = WLB; Organizational Culture = O.C.; Organizational Life Cycle = O.L.C.
Disclaimer/Publisher’s Note: The statements, opinions and data contained in all publications are solely those of the individual author(s) and contributor(s) and not of MDPI and/or the editor(s). MDPI and/or the editor(s) disclaim responsibility for any injury to people or property resulting from any ideas, methods, instructions or products referred to in the content.