Article

Designing Reproducible Test Environments for rPPG: A System for Camera Sensor Response Validation


Xim Limited, The University of Southampton Science Park, 2 Venture Road, Southampton SO16 7NP, UK
*
Author to whom correspondence should be addressed.
Submission received: 23 January 2026 / Revised: 10 March 2026 / Accepted: 23 March 2026 / Published: 25 March 2026

Abstract

Remote photoplethysmography (rPPG) enables non-contact vital sign measurements using standard smart device cameras, opening up the potential of scalable health applications on consumer smart devices. However, rPPG signal quality is highly sensitive to camera sensor characteristics and image processing pipelines, which can vary between devices. This variation limits reproducibility and generalisation of rPPG-based algorithms beyond specific hardware platforms. This work presents a reproducible test environment for the validation of the camera sensor response in the context of rPPG signals. A microcontroller-driven illumination system and mechanically constrained setup are used to generate controlled, repeatable optical signals. Two characterisation tests are introduced: a time domain morphology analysis and a frequency domain attenuation analysis. Pulse timing consistency, pulse waveform morphology and normalised frequency responses are compared to assess sensor similarity. This method is applied to selected consumer devices and demonstrates consistent camera response patterns under the controlled test conditions. By explicitly addressing validation of the camera sensor and image processing pipeline, this work supports the development of more robust and transferable rPPG-based vital sign applications across a wider range of consumer devices.

1. Introduction

Photoplethysmography (PPG) is an optical measurement technique that captures blood volume changes by analysing variations in light absorption and reflection. It is most commonly known for its use in pulse oximeters to measure pulse rate (PR) and blood oxygen saturation (SpO2), but also in smart wearables [1,2,3]. PPG signals are commonly extracted from the ear, wrist, or finger but can be extracted from other sites too. In recent years, remote PPG (rPPG) has emerged, allowing the extraction of PPG signals without direct contact [4] using video recordings of exposed skin, most commonly the face.
The idea of capturing rPPG using standard cameras, especially those integrated into smartphones, has generated significant interest. Camera-based physiological sensing offers the potential for scalable, low-cost deployment in telemedicine as well as large scale screening applications. As a result, significant research efforts have focused on improving rPPG signal extraction through techniques such as colour space analysis, blind source separation, motion compensation, and machine learning-based signal inpainting techniques [5,6,7,8,9].
Under ideal conditions, rPPG has successfully been used for PR and blood pressure (BP) estimation [10,11]. Due to the low amplitude relative to the overall intensity, rPPG signals are highly sensitive to disturbances such as variation in lighting and subject motion. Challenges can also occur with darker skin tones due to the higher absorption of light or with facial hair covering the skin. Less commonly addressed is the influence of the camera sensor and its inbuilt image signal processing (ISP) pipeline [12]. Most studies use a single specific device to overcome this, but to create an algorithm suitable for all consumer devices, it is critical to understand the camera’s behaviour. There are differences in the physical camera, such as colour filter design or spectral sensitivity, but also potential differences in the image-capturing process, such as auto-exposure, auto-white balance, tone mapping and compression that can complicate the signal interpretation.
Camera characterisation and calibration techniques are well established in optical metrology and imaging science [13,14]. However, these techniques are rarely adapted to the specific requirements of rPPG signal capture, where temporal stability, repeatability, and the preservation of low-amplitude physiological signals are important. Moreover, many existing calibration approaches rely on laboratory-grade instrumentation which is not easily transferable to routine validation of consumer cameras at scale.
These limitations demonstrate the need for the development of reproducible test environments for validating camera sensor responses in the context of rPPG. Rather than evaluating rPPG algorithms on their own, it is necessary to establish whether a given camera and its associated ISP pipeline can reliably preserve the low-amplitude rPPG signal required for physiological measurements. For any rPPG-based approach, this camera validation is an important step towards enabling deployment across a wide range of devices. In this work, we present a system for camera sensor and processing pipeline validation designed specifically for rPPG applications, enabling controlled and repeatable measurements of camera response under standardised conditions. Baseline measurements on a control device are used to assess system stability and reproducibility, and to derive quantitative signal similarity thresholds, which are subsequently applied to selected consumer devices to illustrate inter-device variability and its implications for broadening rPPG deployment. By explicitly addressing sensor-level validation, this work provides a methodological approach for rPPG research and supports the development of more robust and transferable rPPG-based vital sign applications.

2. Materials and Methods

2.1. Camera Control

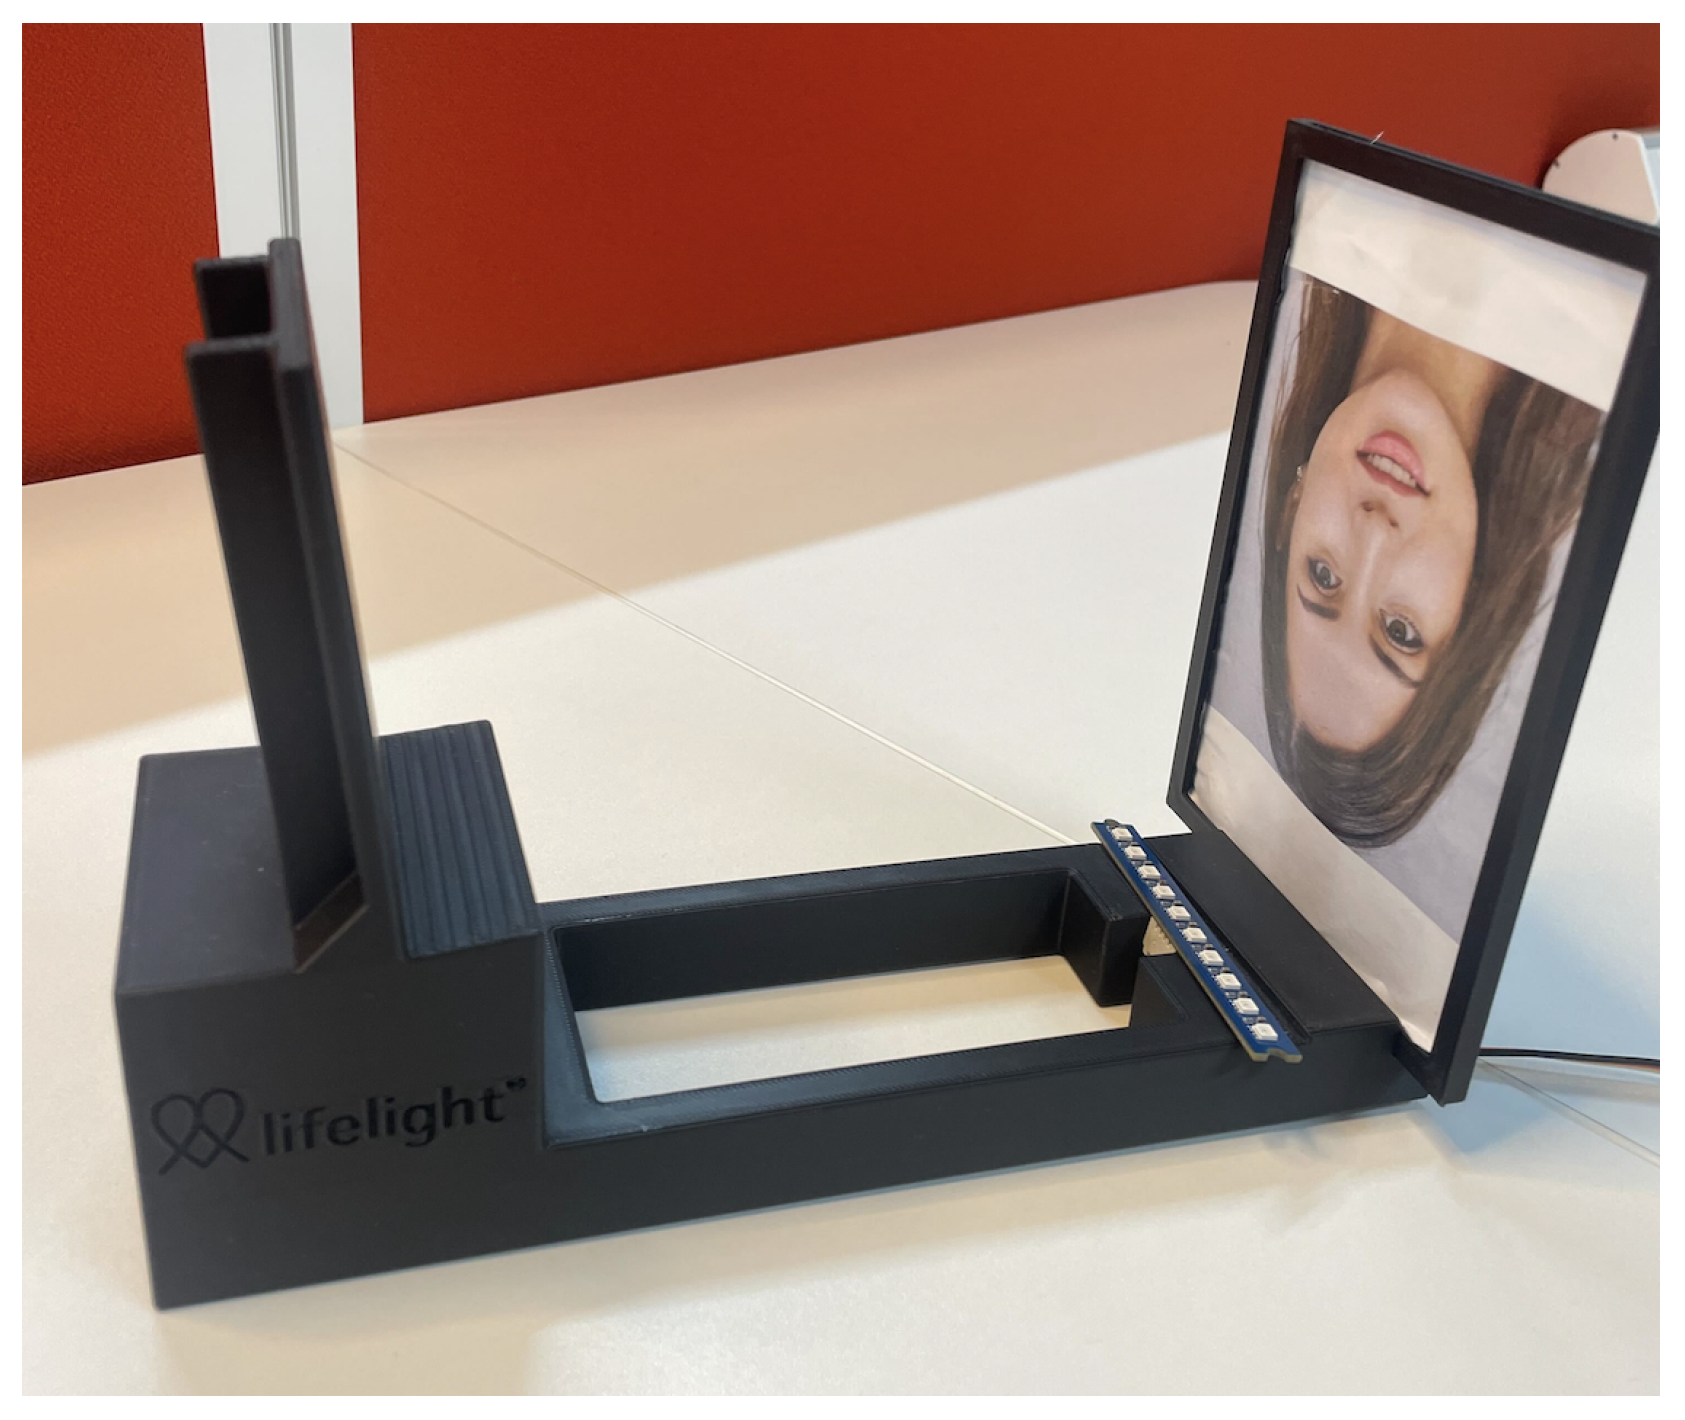
All signals are captured using the same custom app used for rPPG signal collection and data analysis created by Lifelight, Xim Ltd, Southampton, United Kingdom. Within this application, the signal recording process relies on face recognition, as described in [15]. In short, the mid-face region brightness is spatially averaged into three 1D signals, one for each colour channel (red, green, and blue). In order for this app to work in the rig described in Section 2.2, where no real human face is present, an AI-generated image of a face is used, as shown in Figure 1. The same image is used throughout all measurements, printed on matt paper to avoid complicated reflection patterns, and is illuminated using light-emitting diodes (LEDs).
Camera settings such as the frame rate are fixed within the application at a constant rate of 30 frames per second for rPPG capture. Additionally, automatic image processing functions such as white balance and exposure adjustment were disabled or fixed where supported by the device, enforcing consistent capture conditions. The exposure duration was constrained to remain stable during recording, as variations in the integration time attenuate higher frequency components due to the averaging of the signal over the exposure duration window.
On Android devices, a custom tone mapping configuration was applied where supported to enhance the consistency of the sensor’s response [16], while on iOS devices, global tone mapping was enabled to promote stable and repeatable image processing behaviour across recordings. Global tone mapping applies a consistent luminance transformation across the full video, while local tone mapping may introduce varying adjustments based on the specific scene, for example, in different brightnesses or environments [17].
An uncompressed video format was used to avoid negatively impacting the rPPG signal quality and remove physiological variation from the signal [18]. Certain low-level ISP operations are inherent to the device’s hardware (e.g., sensor integration, analogue gain and internal temporal denoising) and, as such, can’t be bypassed. Therefore, maintaining consistent control ensures that any observed differences reflect intrinsic sensor and ISP characteristics, instead of configuration capability.

2.2. Experimental Setup

The experimental setup to characterise the camera behaviour within the custom app was designed to provide a reproducible and controlled test environment. The system consists of a programmable illumination source driven by a microcontroller and a mechanically constrained imaging rig that enforces consistent camera alignment and geometry. Together, these components enable repeatable optical stimulation and standardised image acquisition across multiple devices.
An Arduino microcontroller controls a set of LEDs, allowing predefined waveforms to be emitted with high repeatability. LEDs provide controllable illumination with negligible warm-up time and minimal intensity drift over the timescales relevant to accurately capture the physiological fluctuations measured in rPPG signals. Their narrowband spectral characteristics and linear drive behaviour make them well suited for generating repeatable signals [19]. The illumination patterns were deterministic and identical between measurement sessions, ensuring that any observed variability in the recorded signals originated from the camera sensor and capture pipeline rather than from the signal itself.
To ensure consistency between measurements, a custom 3D rig as shown in Figure 1 is used. This rig constrains the relative positions of the camera, LEDs, and target scene, minimising variation in measurements due to camera placement. The rig is placed in an enclosed, opaque box during measurements to avoid variability in light. On one side, the device under test (DUT) is placed upside down, with the camera to be characterised facing the side of the rig with the LEDs and an image of a face held within a fixed picture frame. The image of the face was generated using StyleGAN2 [20].
The LED brightness is updated every 15 ms, corresponding to an update rate of approximately 67 Hz. This is more than double the frame rate of the camera capture rate, ensuring that temporal modulation is sufficiently sampled, while at the same time avoiding aliasing effects.

2.3. Camera Sensor Characterisation

Using controlled signals from the LEDs, different waveforms can be used for systematic evaluation of the camera’s response under repeatable conditions. In this manuscript we describe two different tests: one to assess the waveform morphology fidelity and one to assess frequency-dependent behaviour across different operating conditions.
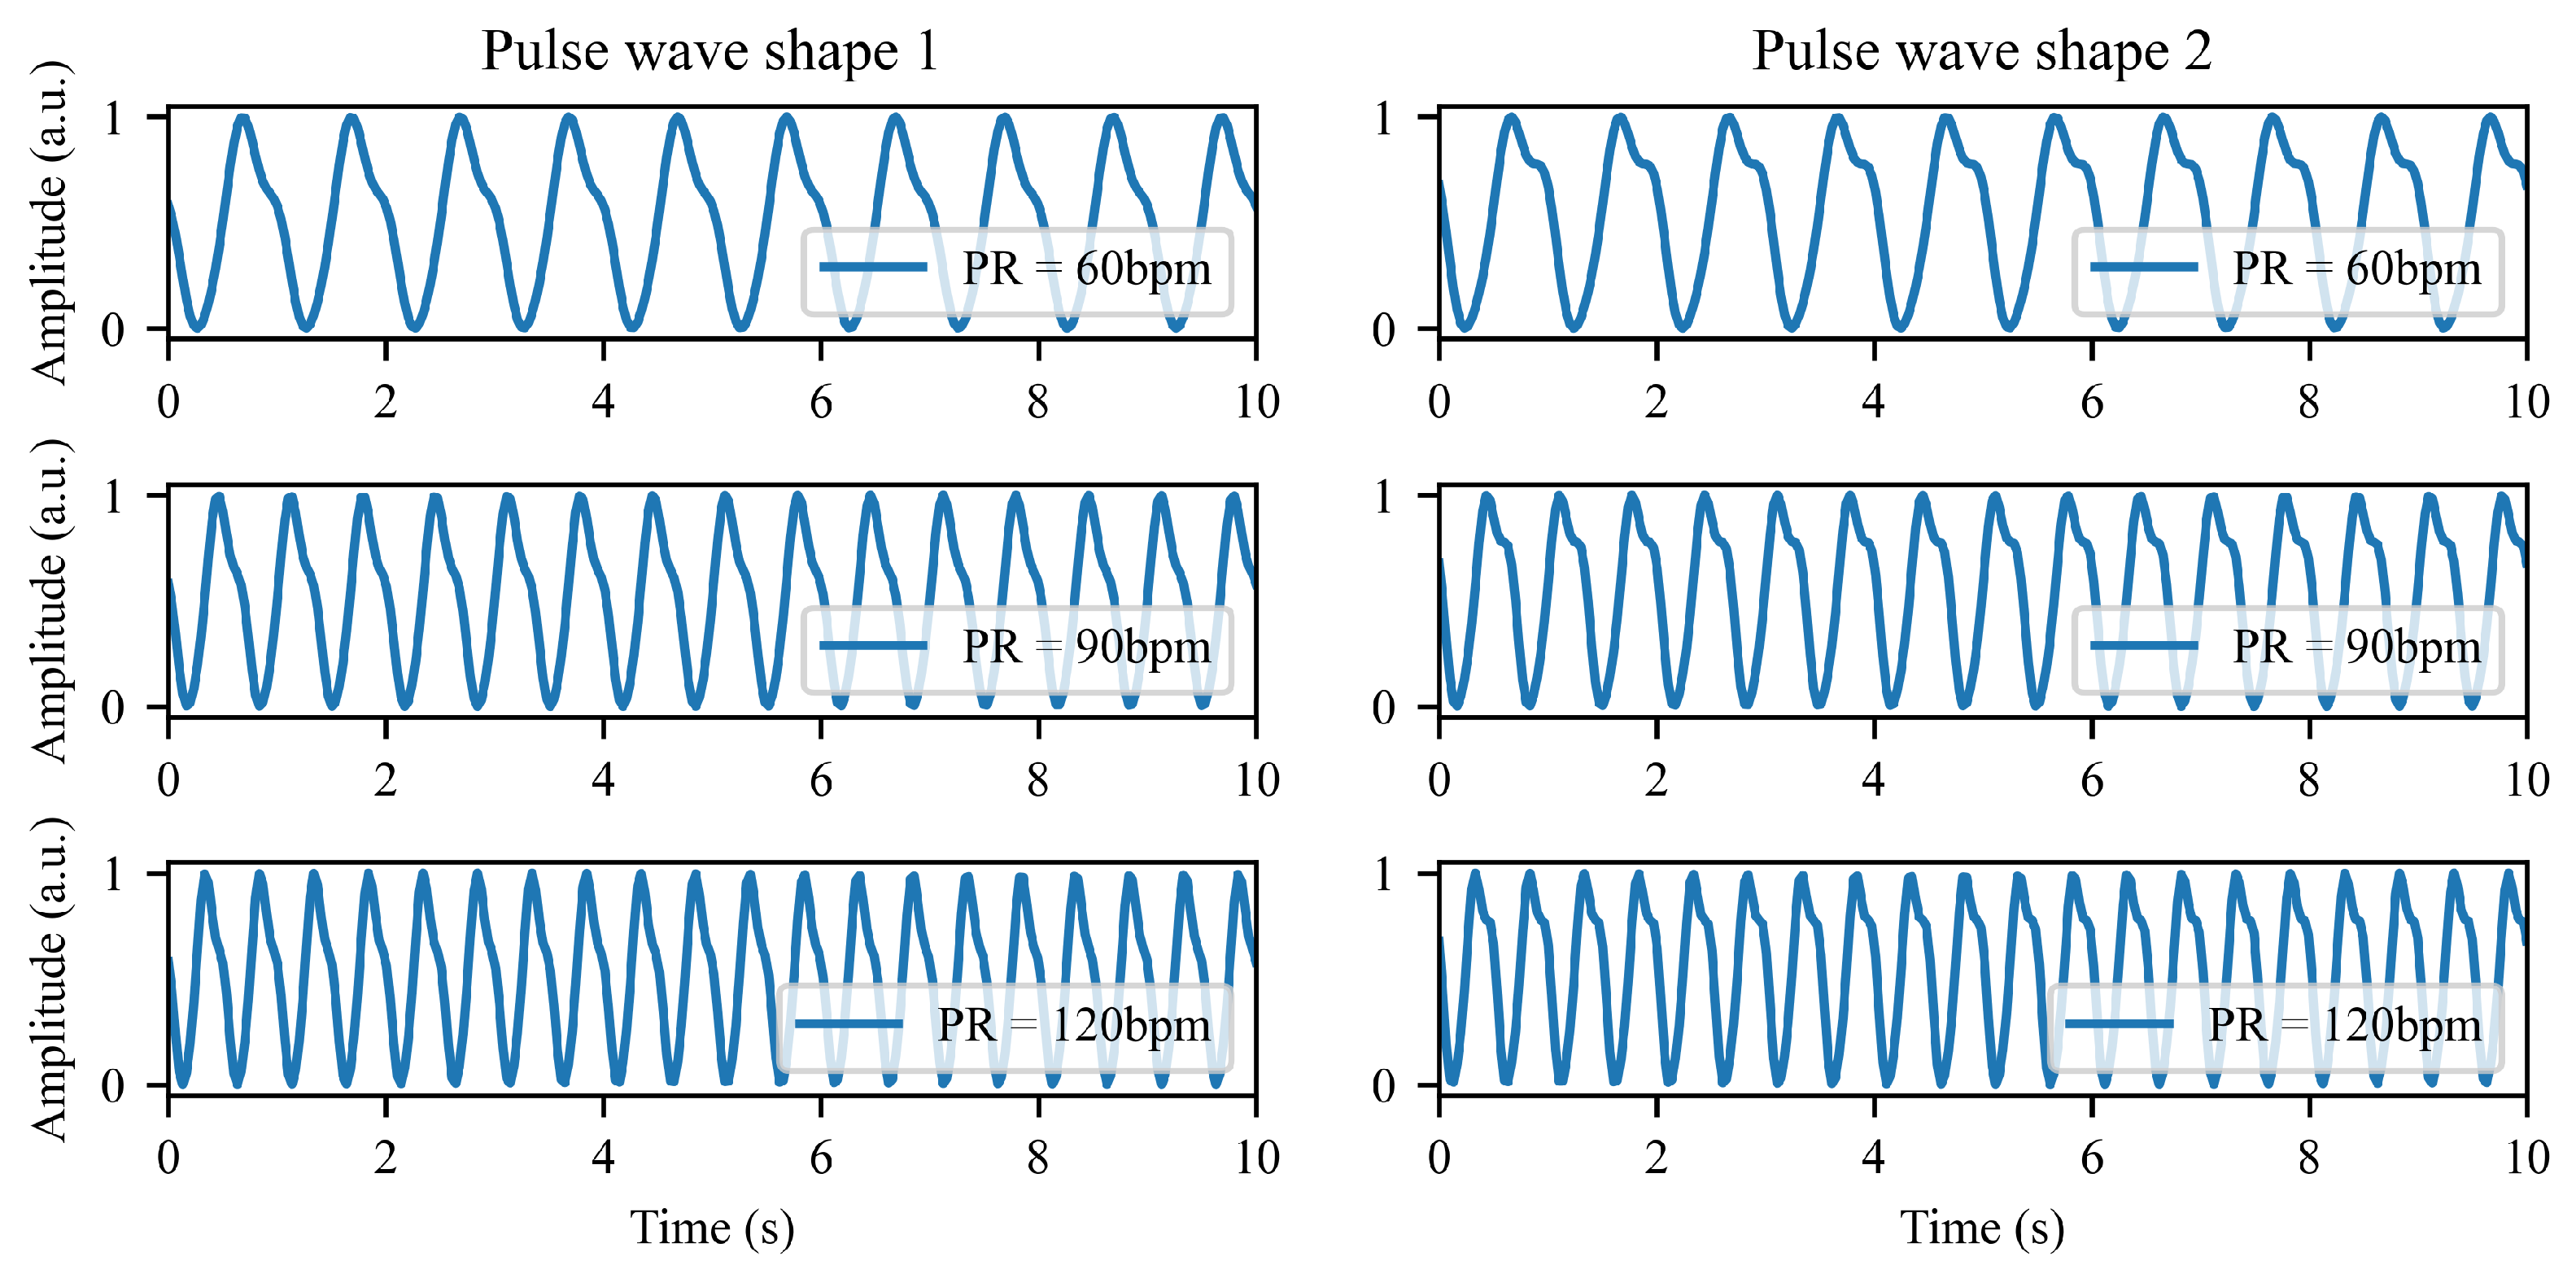
The first test uses predefined pulse-like waveforms, ensuring the frequency and amplitudes are representative of physiological pulse signals. The waveforms were constructed using sinusoidal components with fundamental frequencies varying between 1 and 2 Hz (equivalent to a pulse rate range of 60–120 beats per min). Signal amplitudes were deliberately kept small, with peak-to-peak variations limited to two digital intensity units (i.e., roughly 2% of scene intensity) to reflect the low-amplitude nature of rPPG signals compared to overall scene brightness. The aim of this test was to examine the ability of the camera sensor and manufacturer’s proprietary ISP to preserve the shape of individual pulses, and to understand whether the morphology was affected by camera processing artefacts such as attenuation, temporal distortion, or nonlinear effects. Examples of the predefined pulse waveforms are shown in Figure 2.
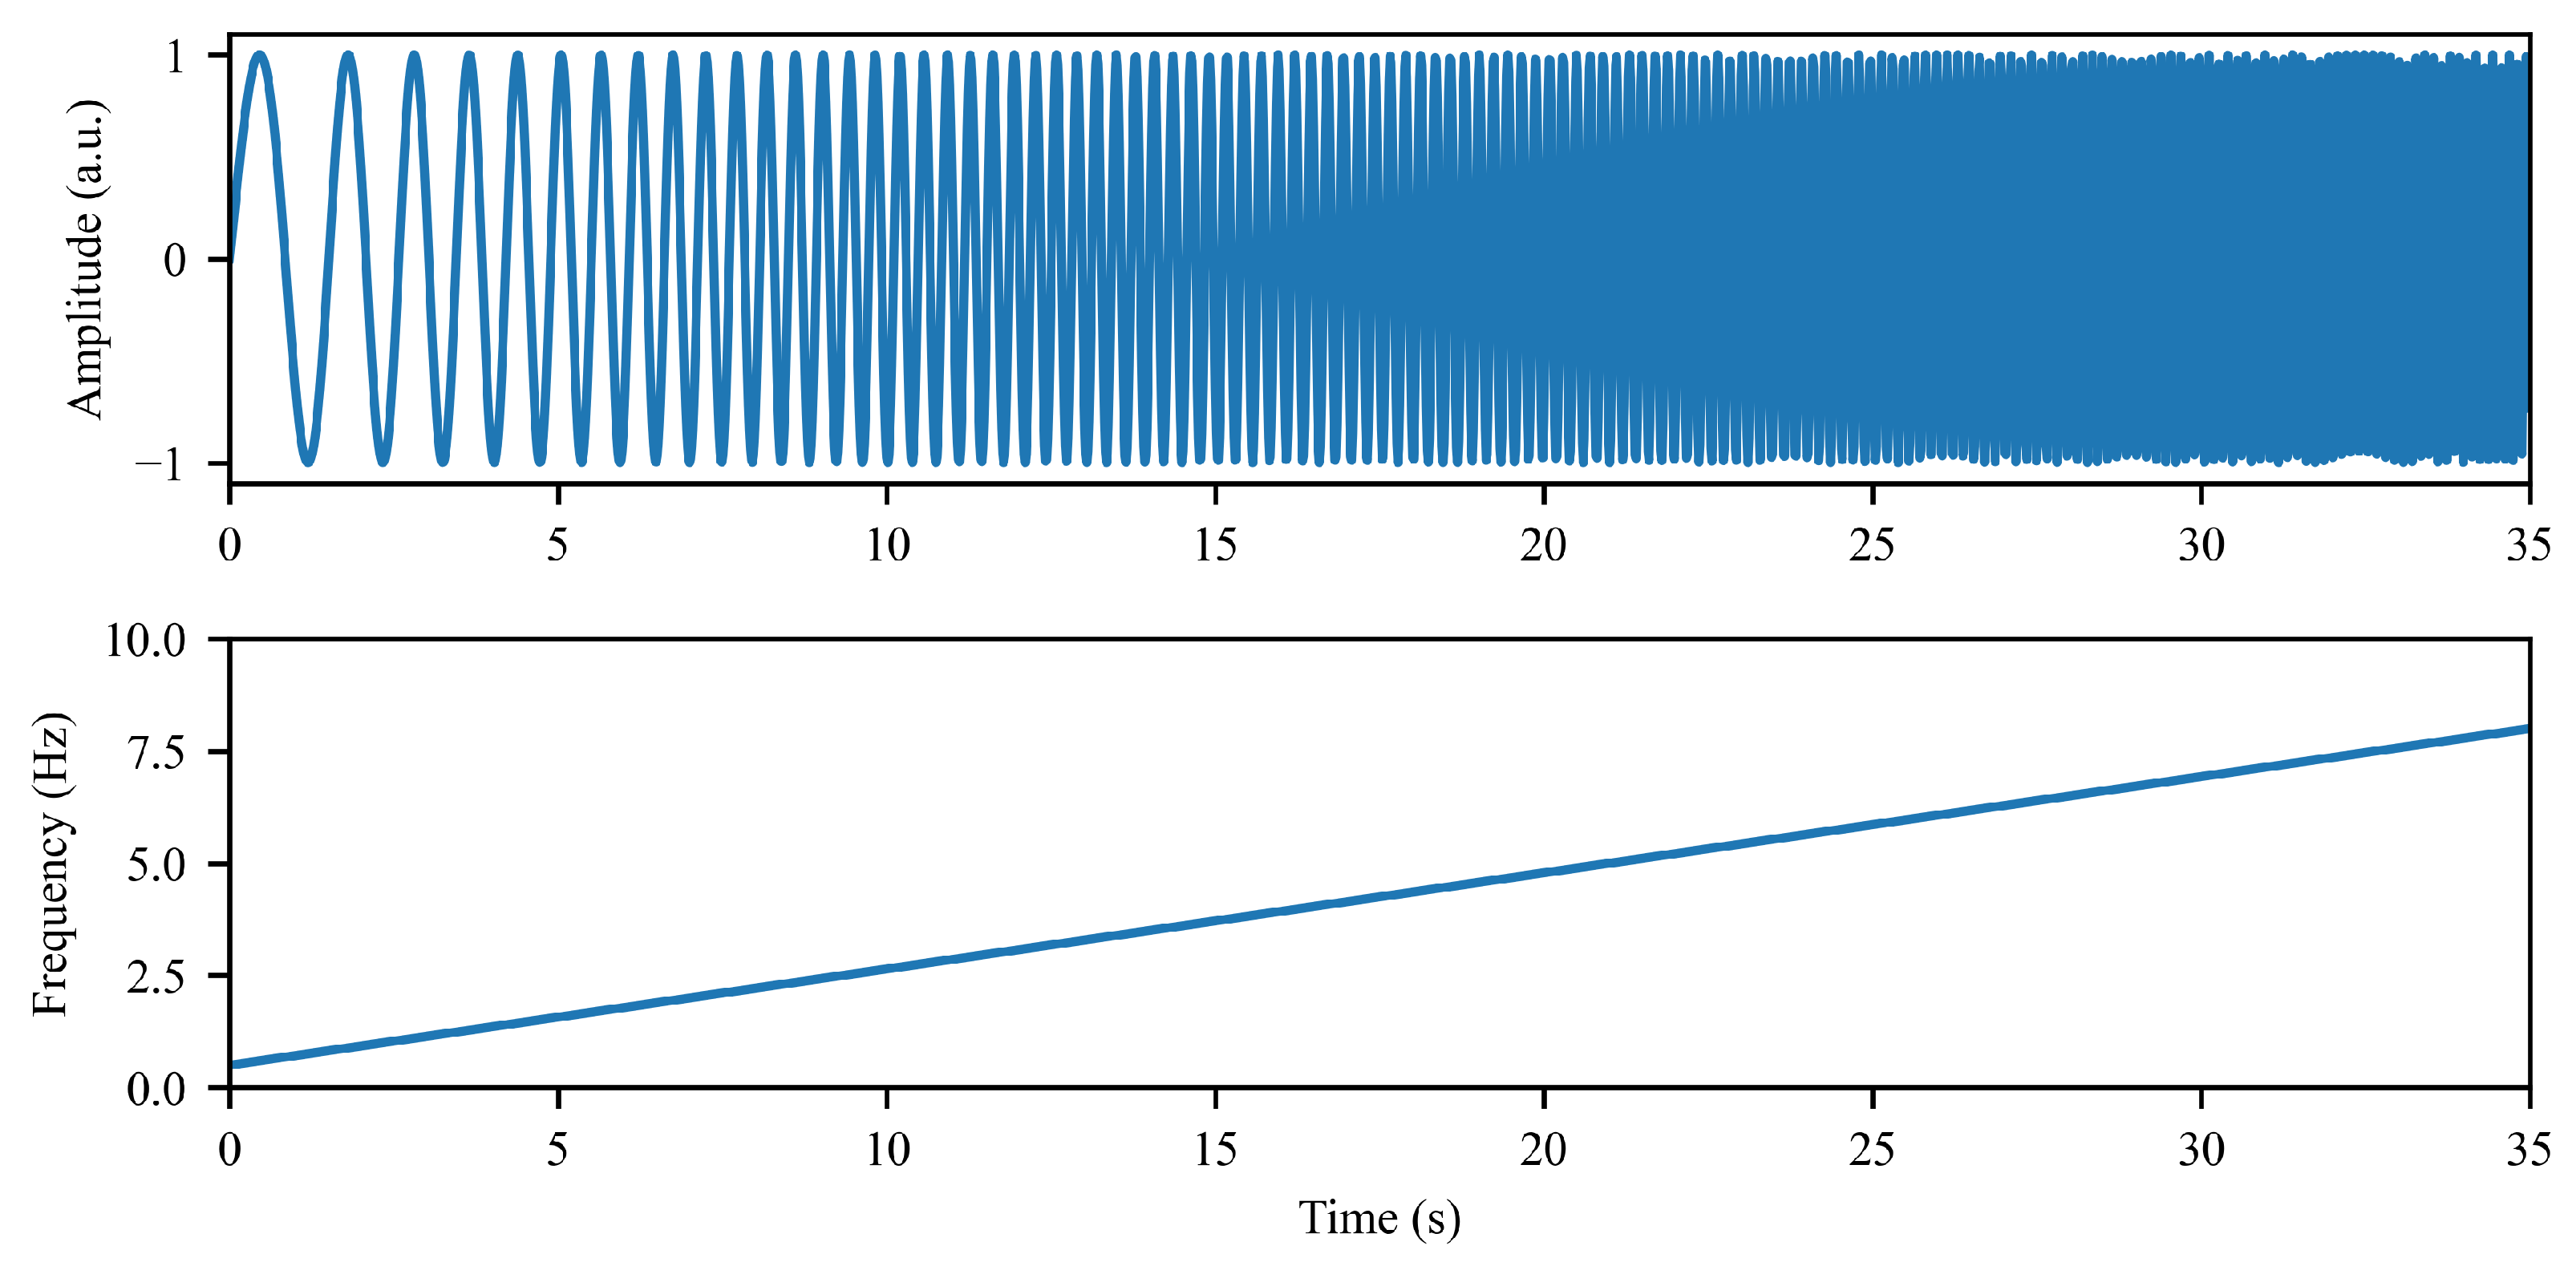
The second test uses a frequency sweep from 0.5 to 8 Hz. This procedure is performed across a range of fixed brightness levels, to evaluate the consistency of the camera’s temporal response across different operating points, for example, different exposure settings, gain settings or brightness-related image processing. By repeating the test at multiple brightness levels, the stability of the camera sensor response is captured under conditions that may trigger changes in the camera’s behaviour. As vital sign measurements with Lifelight span 40 s, the sweep is designed to happen over 35 s, allowing a brightness change to happen before and after the sweep test starts. A graph showing the frequency sweep part of the signal with the corresponding frequency is shown in Figure 3.
To use a camera for rPPG signal capture, it is important that the behaviour is not situation-dependent. Combined, these tests enable evaluation of the camera’s suitability to be used to capture rPPG by analysing the robustness of the camera’s response across different frequencies and brightness levels.

2.4. Measurement Protocol

All measurements are taken using the rig shown in Figure 1 in an enclosed environment, avoiding interference of any light sources other than the light emitted by the LEDs in the setup.
For the waveform morphology test, signals were generated at three distinct PR frequencies, corresponding to physiologically plausible heart rates: 60 bpm, 90 bpm and 120 bpm. These were chosen to span a range of resting and elevated heart rates and, most importantly, to assess the difference when a different number of frames is recorded in a pulse to see whether the morphology is still maintained. For each PR, multiple recordings were acquired under identical conditions to evaluate repeatability and assess variability in the captured pulse waveform morphology.
For the frequency sweep tests, signals were generated with a fixed modulation amplitude as shown in Figure 3, with measurements acquired over a predefined range of initial brightness settings. The available brightness range is constrained by the camera control implemented within Lifelight, which enforces specific exposure and brightness criteria prior to recording. Signal acquisition starts only when these conditions are satisfied. As a result, the set of brightness levels at which measurements can be started can vary between devices, reflecting the differences in camera hardware and exposure control. This constraint is necessary as it maintains consistent signal quality by reducing noise amplification, clipping and exposure-related artefacts that could compromise the rPPG signal.
While the input wave is known and the measured signals of the device under test (DUT) could be compared against the known input waves, we have chosen to use a reference device (RD) for comparison instead. An iPad 8th Gen was selected as the RD due to its use in Lifelight’s previous data collection and algorithm development studies [21]. All baselines measured on the RD were repeated on three iPad 8 units to characterise baseline variability and establish acceptance thresholds. It is particularly relevant in this use case for the camera of a DUT to have a consistent camera response relative to the RD to enable the use of rPPG algorithms trained on data acquired using the RD.

2.5. Signal Processing and Evaluation Metrics

2.5.1. Time Domain Morphology Comparison

Analysis of the pulse morphology was performed to assess the ability of the camera sensor and ISP to preserve the structure of pulse-like signals. Two criteria were used to assess the DUT’s suitability: the waveform similarity relative to the RD and the temporal consistency of the detected pulses.
Lifelight’s pulse detection algorithm was used to find individual pulse peaks and individual pulse durations [22]. Due to the setup’s stable signal frequency, the expected pulse duration is known based on the input PR. This expected duration was compared to the measured individual pulse durations in the recorded signal, providing a direct assessment of frame rate consistency and temporal stability, because deviations between expected and observed pulse durations indicate timing irregularities or distortion introduced by the ISP. Consistent frame timing is essential for a camera used as an rPPG sensor, as variations in frame rate could alter the apparent PR and compromise the reliability of morphology-derived physiological features.
Morphological similarity of the pulse waveform was evaluated by comparing the individually extracted pulses against the reference waveform derived from the RD. For the reference waveform, all detected repeated pulses were aligned and averaged to form a representative waveform. Each individual pulse from the DUT was compared to this reference using the fitness score (FS):
F S = 1 ( p R D p D U T ) 2 ( p R D p ¯ R D ) 2
where p R D is the reference waveform, p ¯ R D the average of the reference waveform and p D U T the individual pulse being compared against the reference. The FS used here follows the metric described by [23], originally introduced in the context of system identification to quantify the agreement between measured and modelled system outputs. However, Ref. [24] used the same metric to quantify morphological similarity between waveforms, which has been introduced in this work as a similarity metric between the recorded pulse waveform and the reference template. The FS assumes temporal alignment and identical sampling between the two signals, and evaluates the relative shape agreement. It cannot distinguish between different sources of waveform distortion (e.g., noise, jitter, or nonlinear distortion) and should, as a result, only be interpreted as a similarity metric.
To set a threshold for what is deemed a tolerable variation in FS, the effects of quantisation imposed by the camera frame rate were considered, because the FS assumes temporal alignment in its calculation. The reference waveform was used to generate a worst-case quantisation misalignment scenario, by using a temporal offset of half a frame (1/60th of a second in a 30 fps capture rate) and a mismatch of two frames in pulse duration due to differences in the located start and end of the waveform. The FS was computed between the reference waveform and the offset waveform, and the resulting value was used to set a lower-bound threshold for acceptable morphological similarity. FS values below the threshold indicate distortion introduced by the camera sensor or ISP that the rPPG algorithm might not be able to tolerate.

2.5.2. Frequency Response

The frequency response of the camera was evaluated using the frequency sweep test by analysing the amplitude of the recorded signal as a function of the applied modulation frequency. The consistency of the measured amplitude across frequencies provides an indication of the stability of the camera’s temporal response to varying input stimuli. In an ideal system, this response would be flat due to the fixed amplitude of the input wave. However, in practical ISP pipelines, a decay is typically observed due to quantisation and the exposure duration of the sensor, which together act as a low-pass filter. Additionally, ISP pipelines incorporate temporal noise reduction filters, leading to a reduction in gain at higher frequencies. This is undesirable for rPPG extraction due to the information content found in the morphological detail correlating with vital signs such as BP [15,25,26,27,28]. It is complicated due to the variation between manufacturers and individual devices, and the algorithms are usually kept as proprietary information. Although the amplitude of the input modulation is held constant, the measured response may vary with the initial brightness level and exposure settings used during acquisition. To allow meaningful comparison across repeated measurements and different DUTs, the frequency response was therefore normalised with respect to the measured amplitude at 1 Hz. Absolute gain was not taken into consideration due to the fact that the Lifelight video capture algorithm disables automatic exposure and white balance controls and implements a custom exposure algorithm that targets a fixed DC range of the green channel used principally to derive the rPPG signal. These make the response largely independent of illumination intensities similar to the processing steps commonly used in rPPG processing, such as AC/DC normalisation [29,30] or by subtracting the pixel norm and dividing by the pixel standard deviation [31]. In line with the recommendations of Xuan et al. [16], a static tone map, using a 2.2 gamma curve, was also implemented wherever possible to minimise the influence of ISP.
To quantify the similarity between the frequency responses of the DUT and the RD, the measured responses were first represented using polynomial fits obtained from the frequency sweep measurements. These provide a smooth approximation of the measured attenuation frequency relationship while reducing the influence of measurement noise such as quantisation.
Each polynomial grid was evaluated on the same frequency grid, spanning 0.5 to 8 Hz with 100 uniformly spaced points. This ensured that all responses were compared at identical frequency values. For each DUT response, the deviation from the RD average response was quantified using the root mean square error (RMSE):
R M S E = 1 N i = 1 N A D U T , i A R D , i 2
where A D U T , i and A R D , i are the attenuation values of the DUT and RD, respectively, at the i-th frequency point and N is the total number of samples used for comparison (in this case, 100 due to the frequency grid spacing).
Additional metrics were also computed to characterise both the magnitude differences and similarity of response shape: mean absolute error (MAE), maximum absolute error, and the Pearson correlation coefficient between the two curves. For each DUT, these were calculated at each of the different brightness levels. The resulting RMSE values were summarised using the mean and standard deviation to assess consistency of the DUT’s frequency response relative to the RD’s frequency response under varying operating conditions.
The acceptance thresholds were derived from the repeatability testing of the reference device. The RMSE between repeated measurements and the average frequency response was calculated to quantify the inherent variability of the measurement system. An empirical acceptance threshold was then defined as twice the maximum RMSE observed during this repeatability analysis. A DUT was considered comparable in response to the RD if the RMSE between its frequency response and the RD’s average frequency response remained below this threshold.
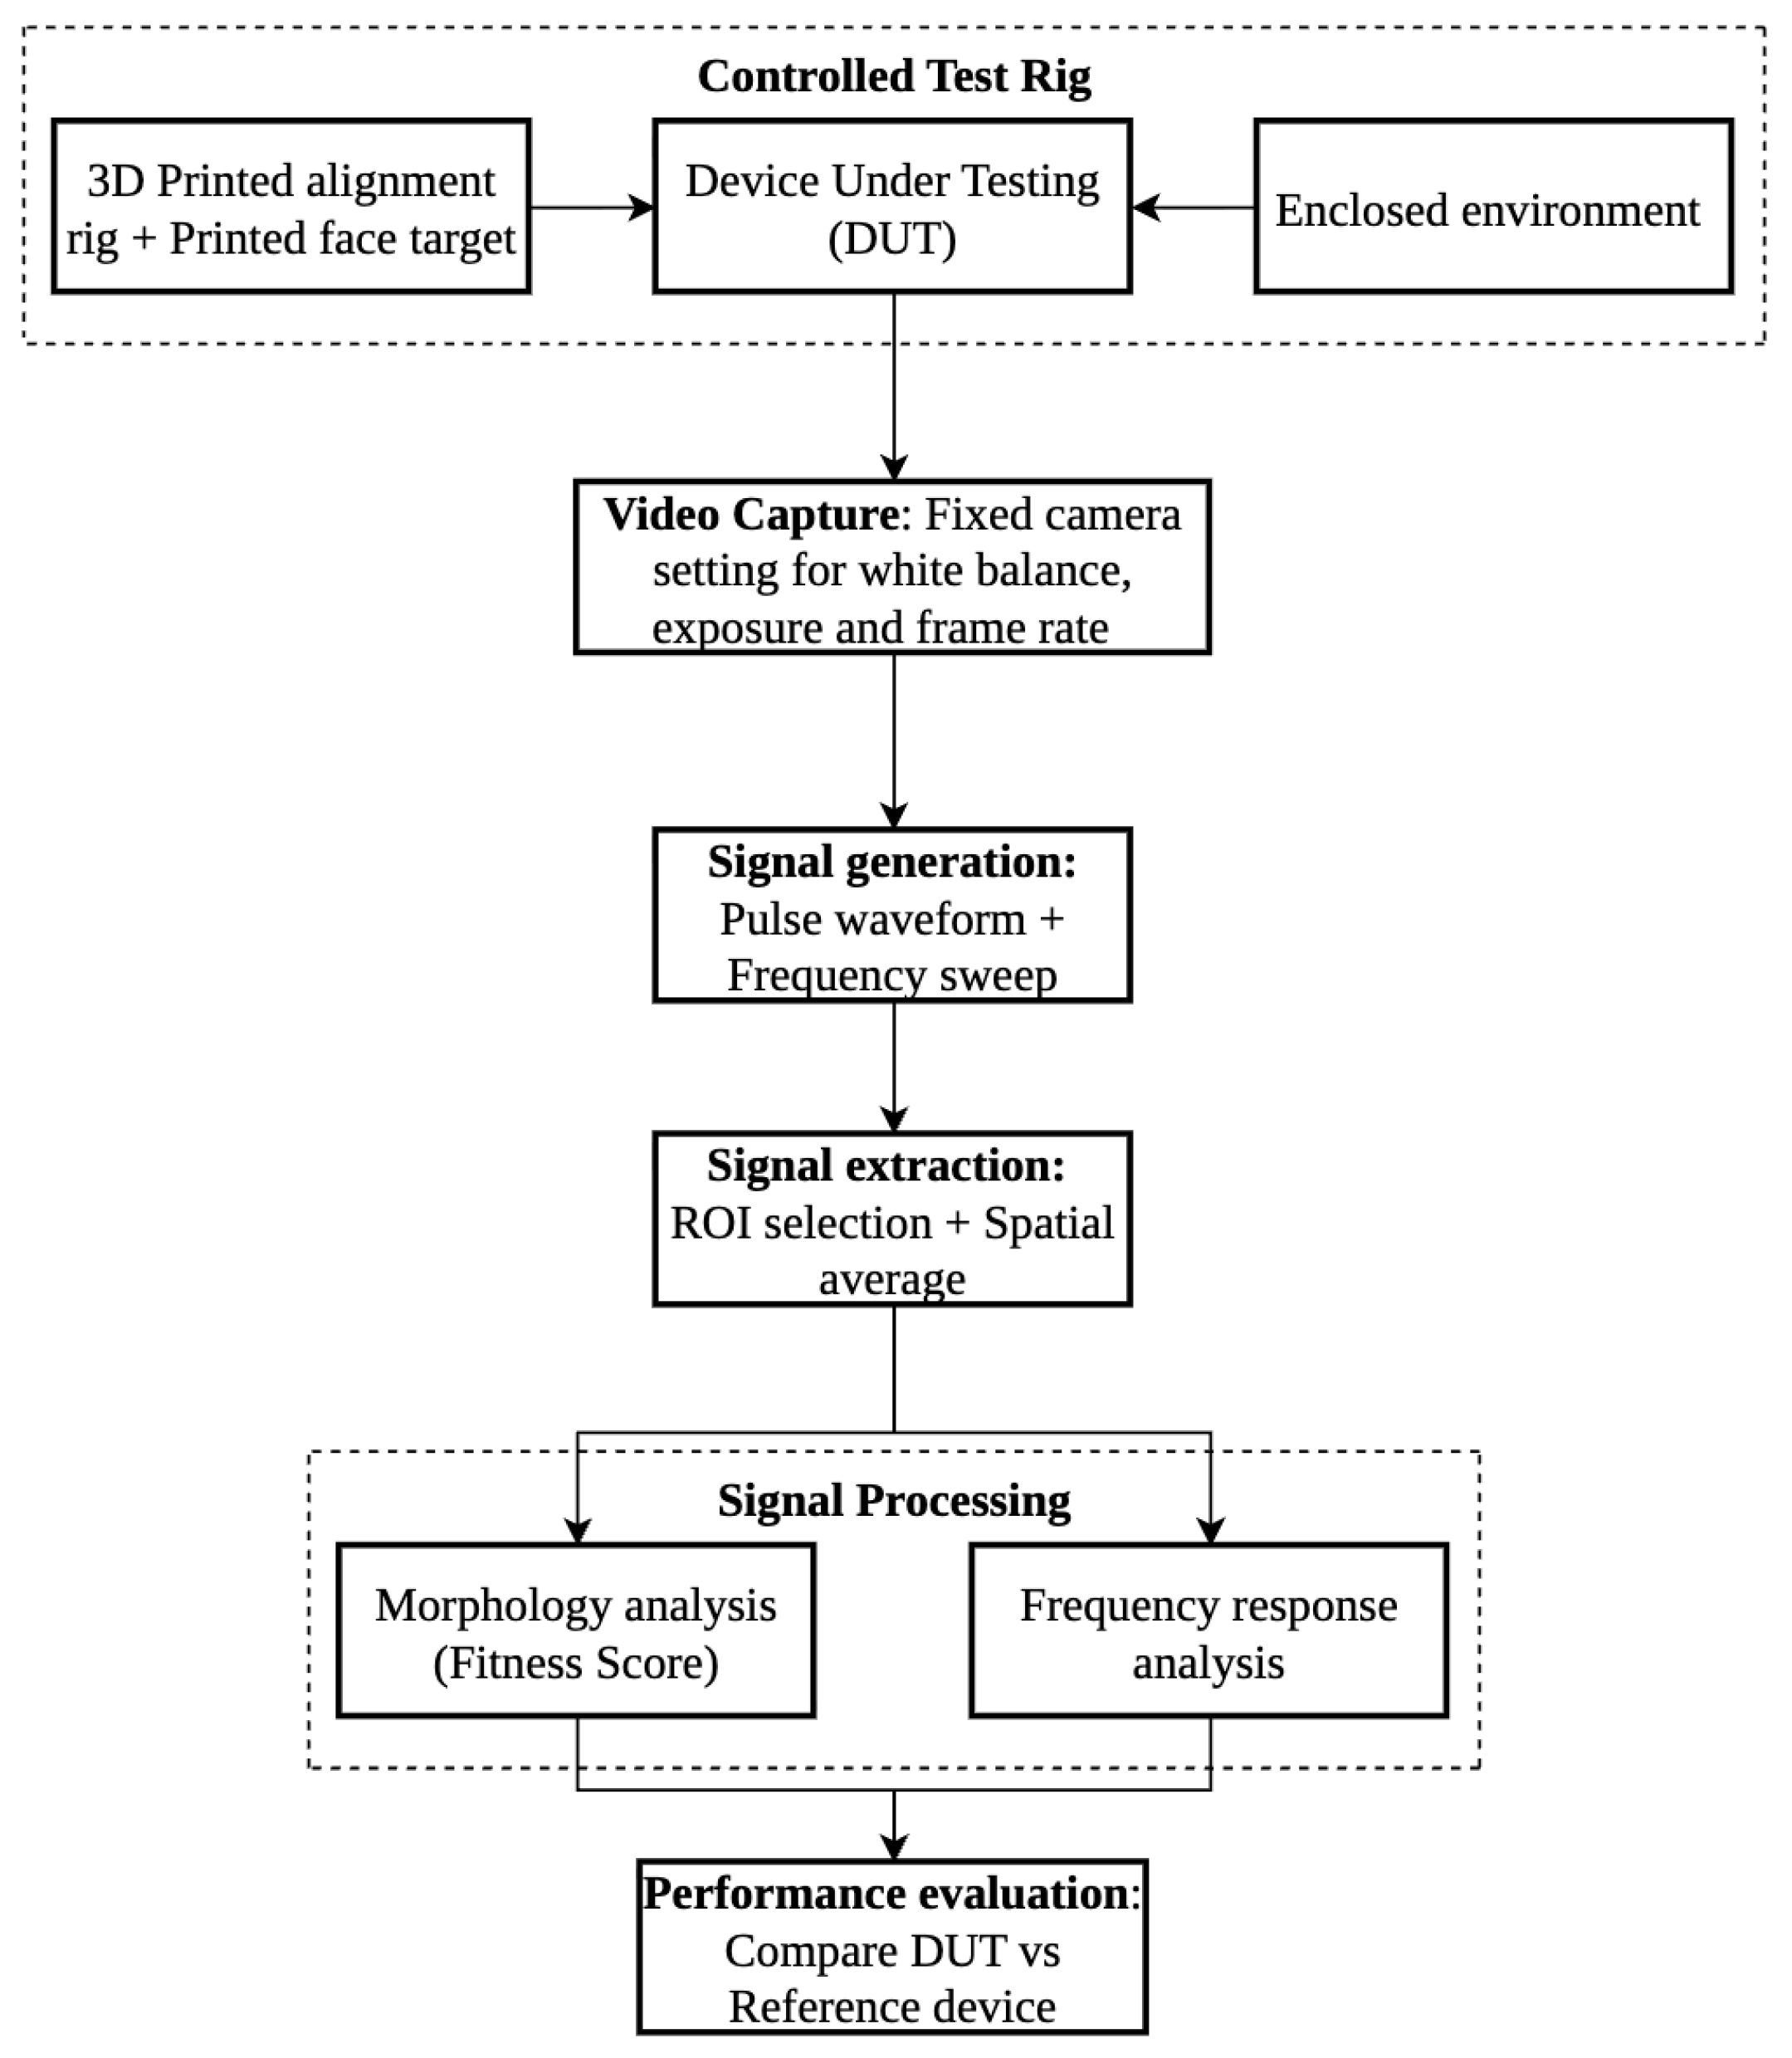
Figure 4 shows a block diagram detailing the steps of the camera sensor response validation procedure from signal acquisition to performance metrics calculation.

3. Results

3.1. Baseline Measurements

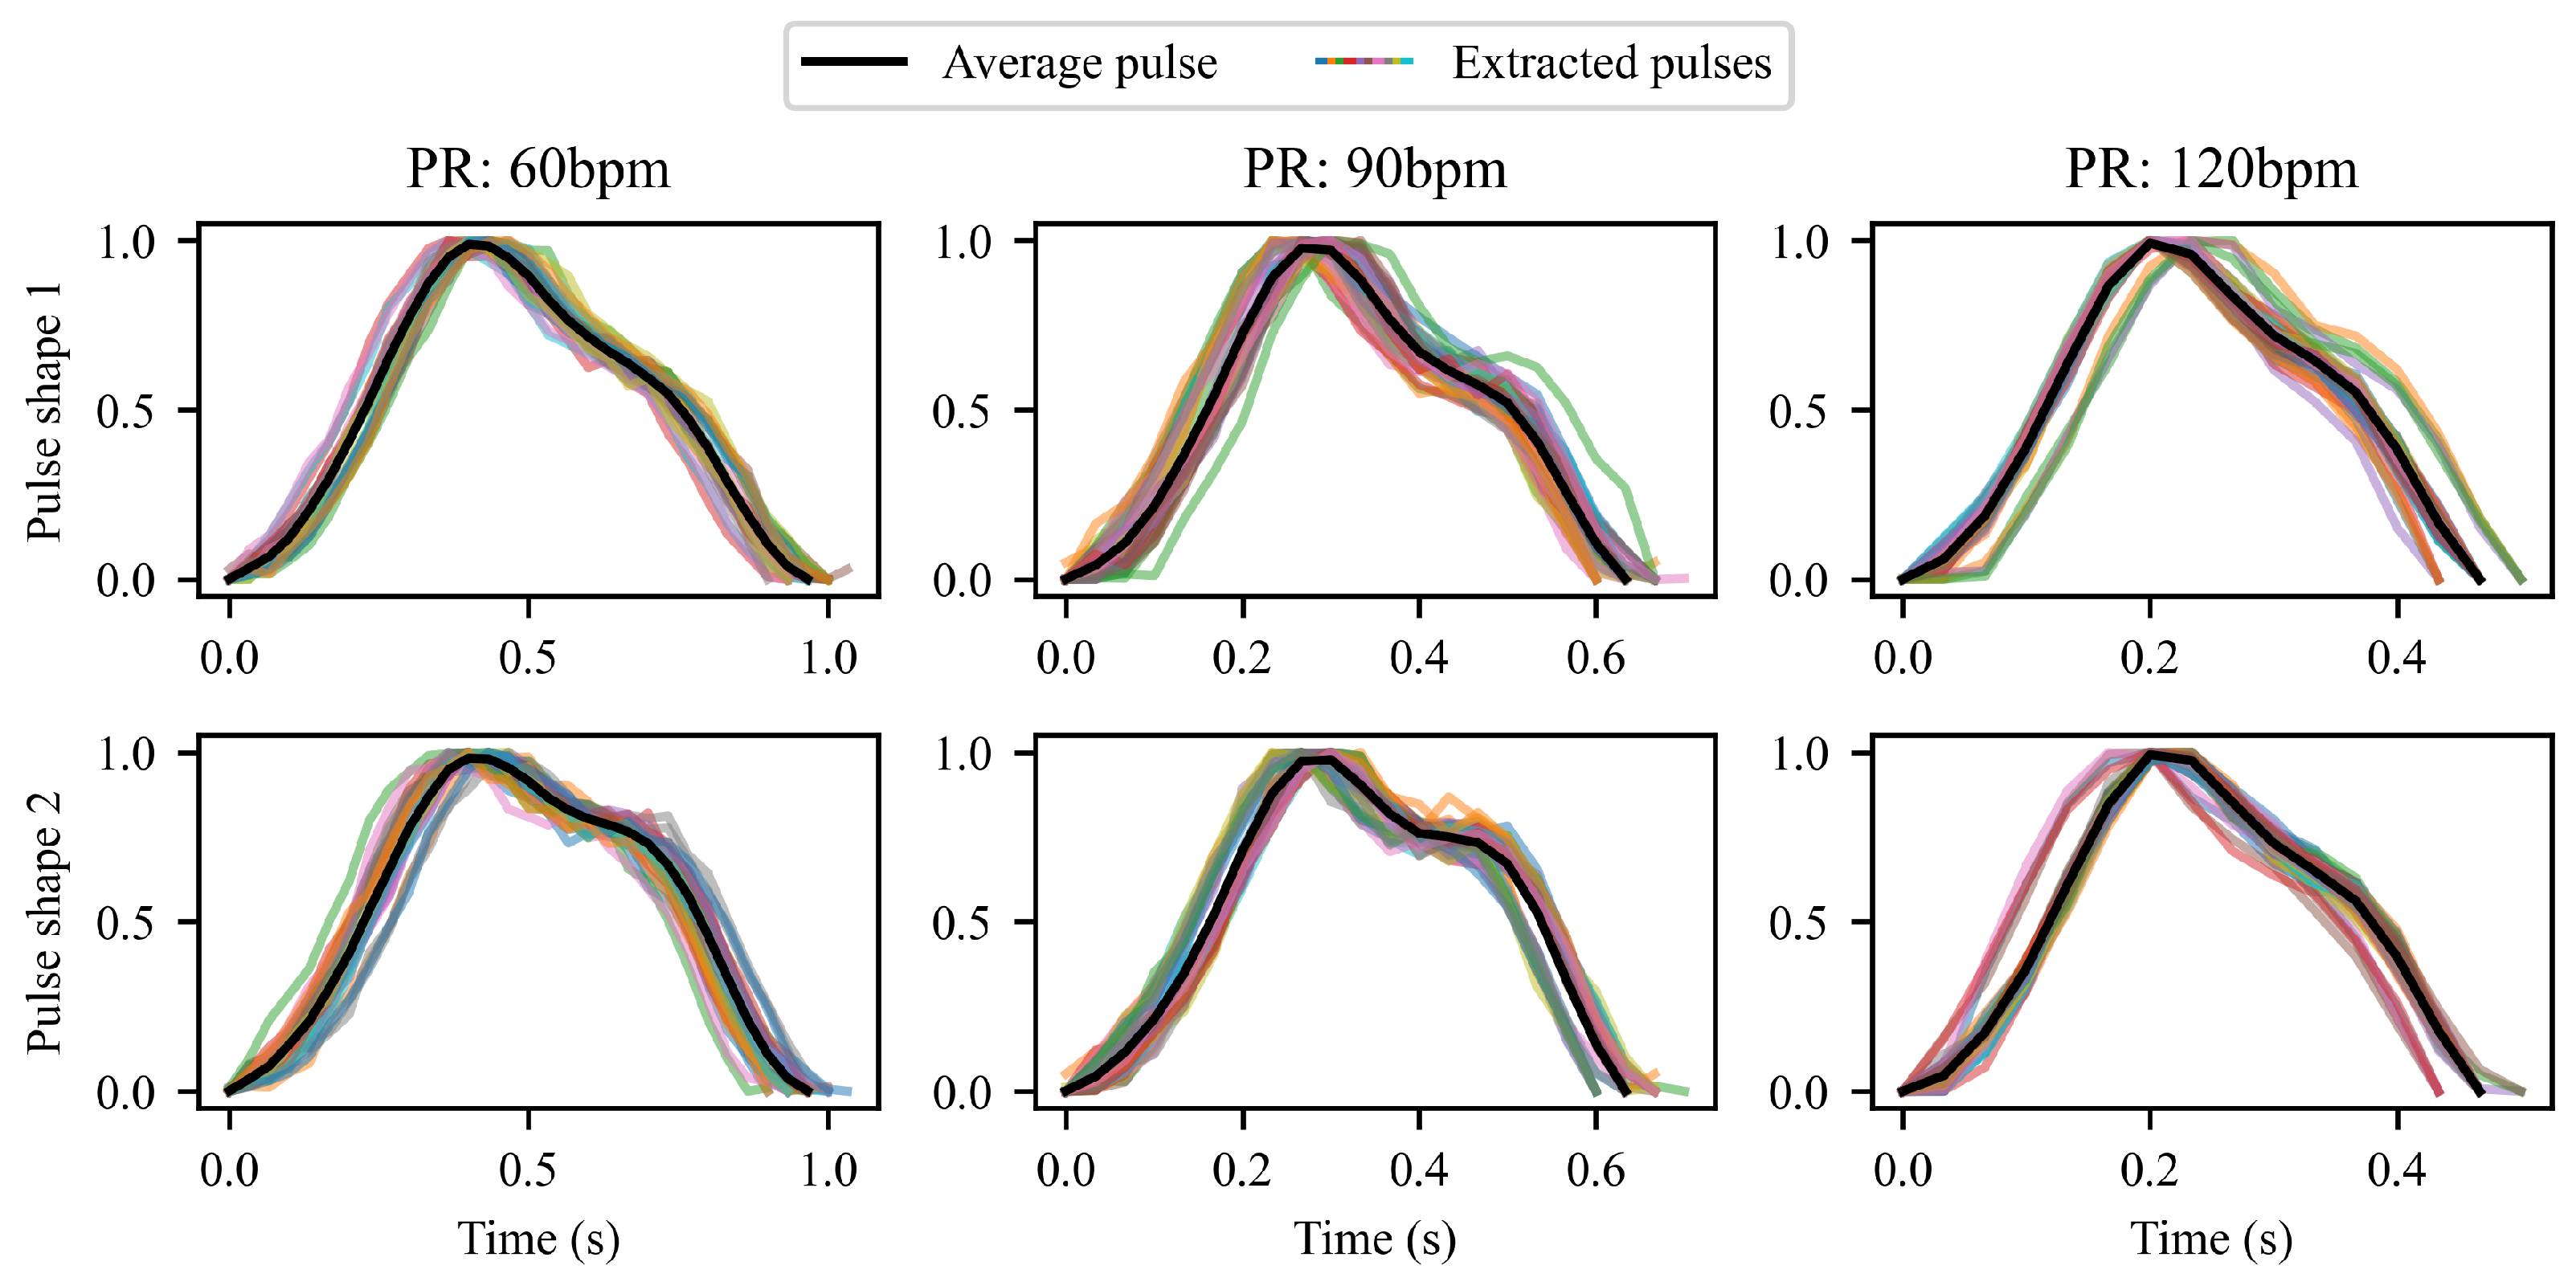
Using the iPad 8 as RD, repeated measurements are taken for each pulse-shape waveform at each of the three tested PRs. In Figure 5, the average of the extracted pulses for each pulse shape waveform is shown. It can be seen that the shape is repetitive, with the exception of variation due to quantisation. The average waveforms are used to calculate the thresholds for FS based on the worst-case scenario time offset as described in Section 2.5.1.

3.1.1. Threshold Setting

Table 1 shows the thresholds for the different PR and pulse wave shape combinations tested. As expected from Equation (1), shorter pulses (i.e., pulses with a higher PR) have a lower realistically achievable FS. For a DUT to pass the validation, the calculated FS for each of the waveforms and PR used must be above the thresholds shown in Table 1.
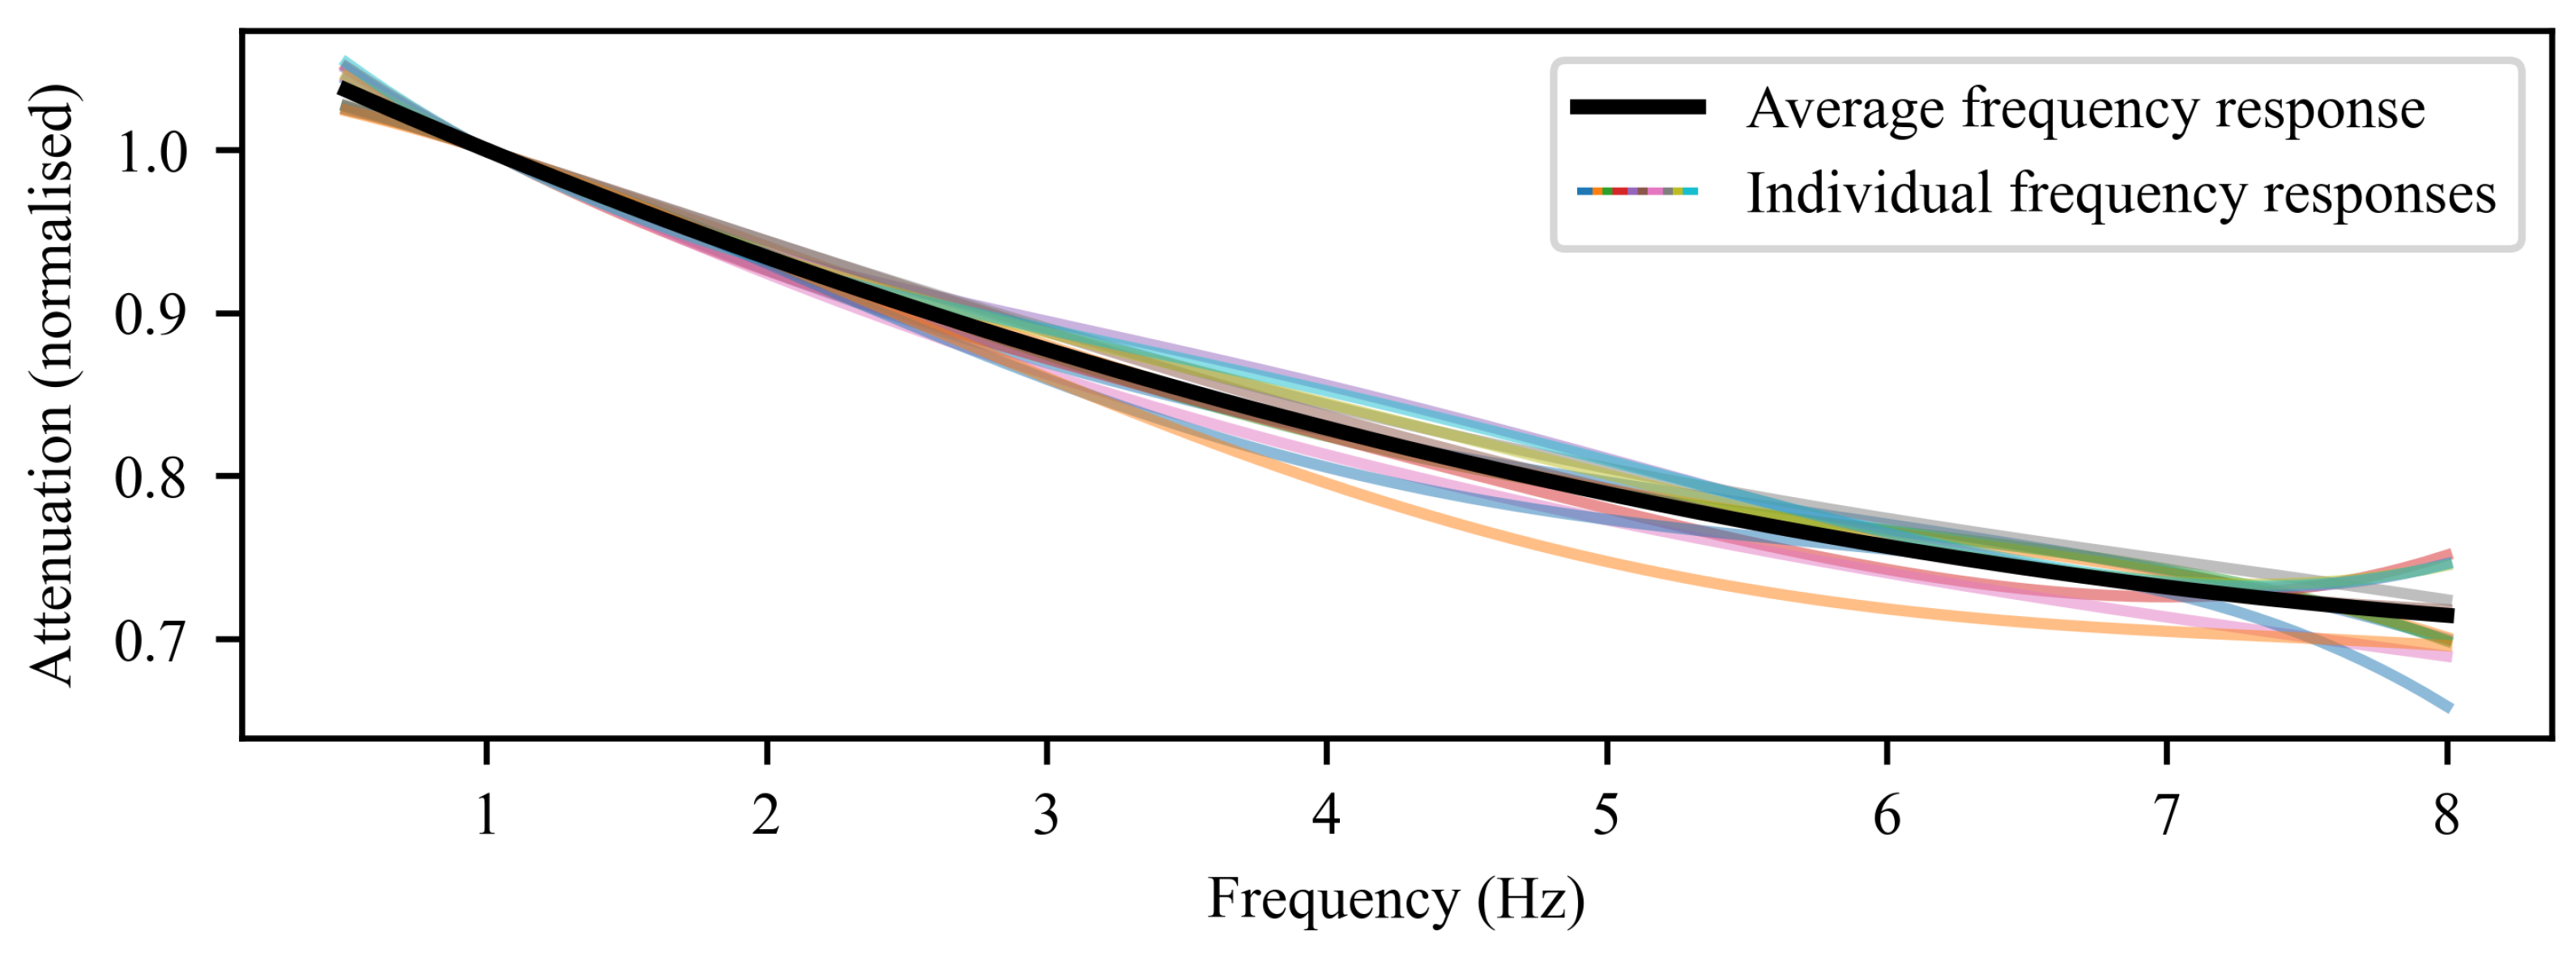
Figure 6 shows the measured frequency response: measured attenuation as a function of frequency based on the sweep tests for the RD. It can be seen that at higher frequencies, the amplitude is reduced compared to the attenuation at lower frequencies. However, the response is consistent between different measurements, showing that the training data collected using the RD will have been collected with a stable sensor and ISP.
To quantify the repeatability of the RD frequency responses, the RMSE between each measurement and the average reference response was calculated. An average RMSE over all ten measured frequency responses of 0.0197 was found with a standard deviation in RMSEs of 0.0128, and the maximum observed RMSE was 0.0535 across the ten different tested brightness conditions, indicating a high level of consistency between the responses in different brightnesses. Based on this analysis, the empirical acceptance threshold was set at 0.11, ensuring that the allowable deviation reflects the intrinsic variability of the measurement system. For a DUT to pass validation, the calculated RMSE (calculated using (2)) between the frequency response of the RD and DUT must be less than 0.11.

3.1.2. Reproducibility Testing

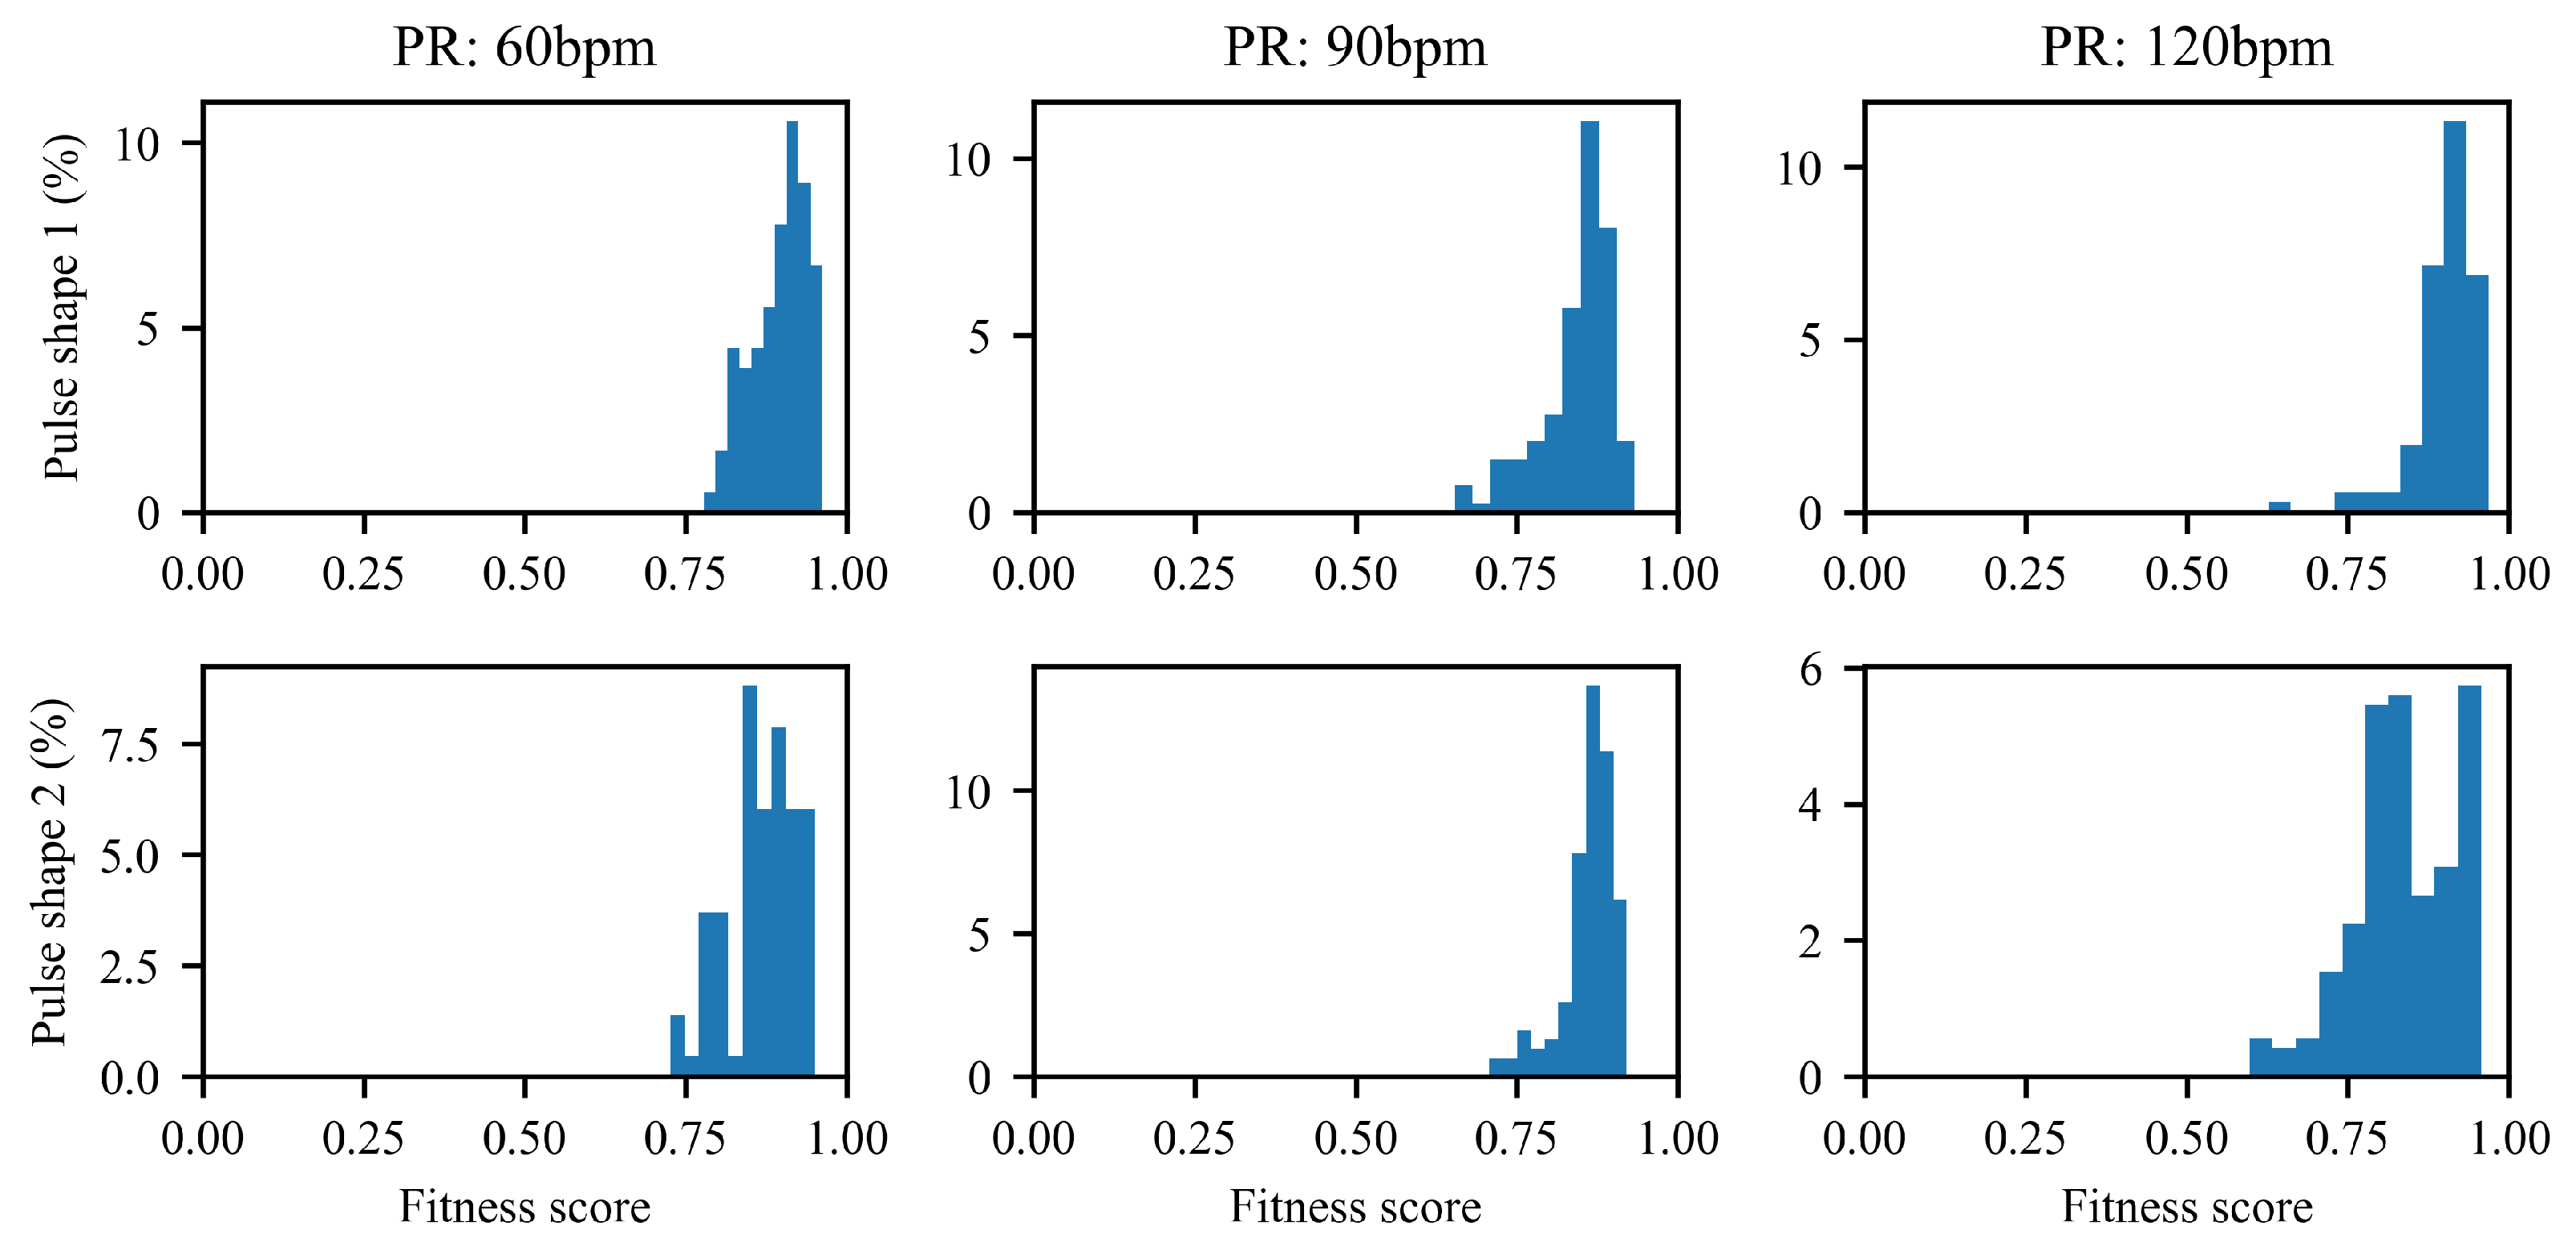
To assess reproducibility of the RD, multiple recordings of each signal were taken under identical circumstances. For each recorded signal, the FS of the detected individual pulses against the reference waveform was calculated. Figure 7 shows the distribution of the FS for each measurement. The distribution for the higher PRs is wider, as expected, due to the increased relative uncertainty in pulse length due to quantisation.

3.2. Characterisation and Comparison of Other Devices

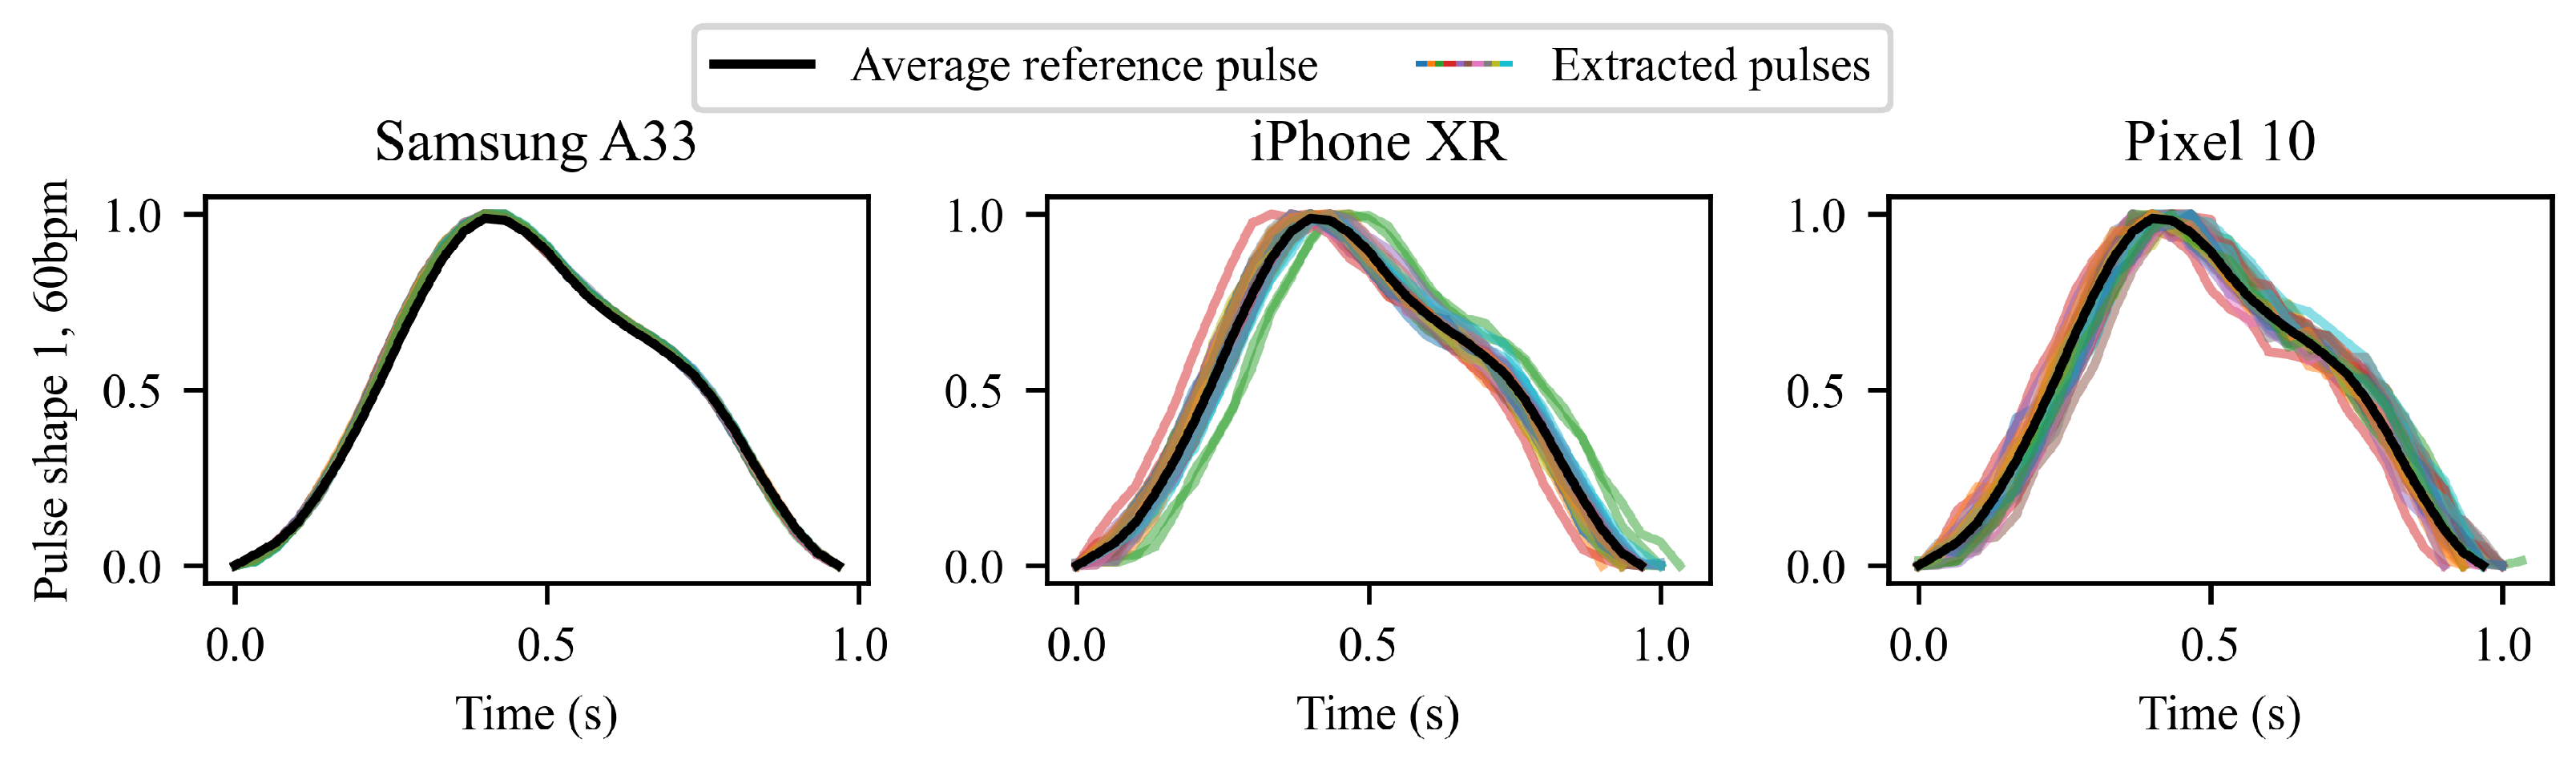
Following characterisation of the RD, three additional devices were evaluated: the Samsung A33, the iPhone XR and the Pixel 10. Figure 8 shows the comparison of waveform morphology for all recorded pulses for the different phones within one of the test signals, indicating a good agreement between the reference waveform and the recorded morphology on the DUT. Results for both pulse shapes and all three PRs for each of the devices are shown in Table 2. For each set of pulses, the mean FS and standard deviation (SD) of all FS for that measurement are shown, demonstrating consistency as well as satisfying the FS thresholds set in Table 1. It can also be seen that one of the DUTs, the Samsung A33, has a much closer agreement with the RD than the other devices. While all three devices are in close agreement, the Samsung A33 shows a smaller variation and the closest overlap with the RD, despite being from a different brand.
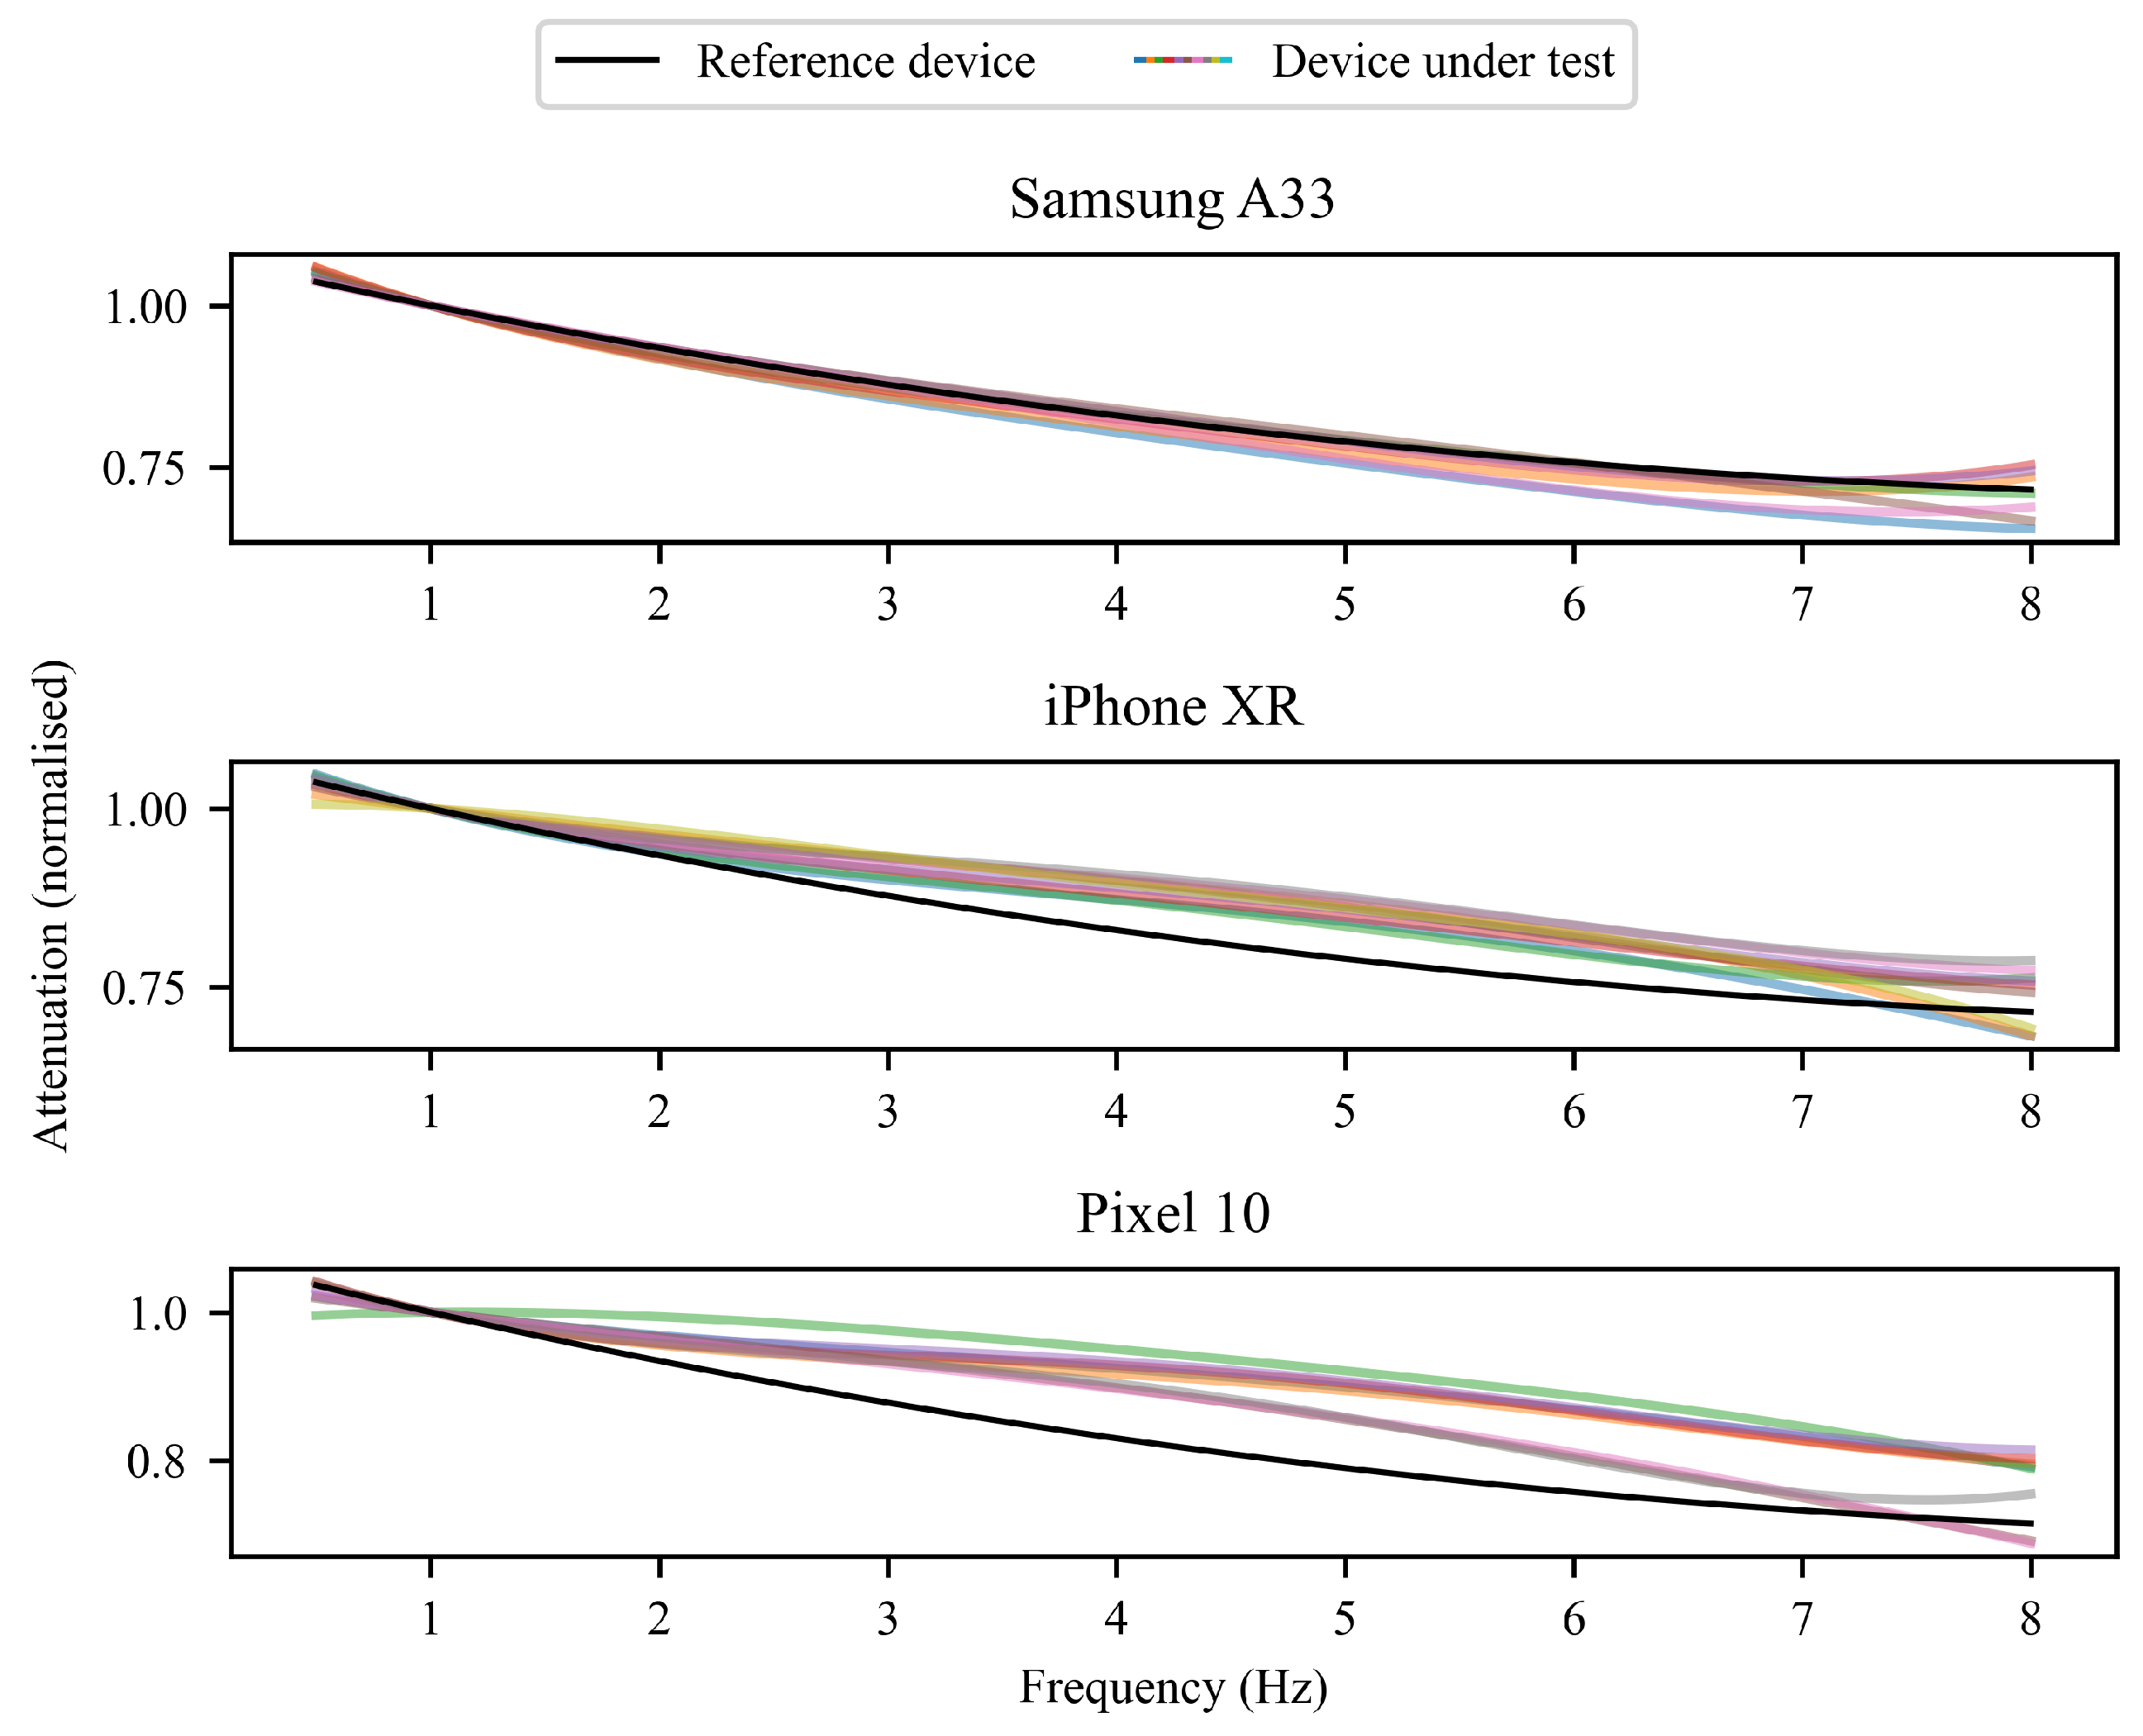
Figure 9 shows the frequency responses measured for the three different DUTs’ front cameras, compared against the mean frequency response of the RD. Across the evaluated frequency range of 0.5–8 Hz the responses are consistent with the RD, both in overall shape and the degree of attenuation observed at higher frequencies. This indicates that the DUTs demonstrate a comparable sensor response to the RD, despite the differences in hardware and ISP pipelines. The calculated RMSE values obtained for all three DUTs remained below the acceptance threshold derived in Section 3.1.1, as shown in Table 3, indicating that all devices have comparable frequency attenuation behaviour in the targeted DC range.

4. Discussion

4.1. Implications for rPPG Work

The proposed camera validation procedure has important implications for rPPG research and algorithm deployment, particularly in the context of smart-device-based home monitoring of vital signs. By explicitly characterising the camera sensor’s behaviour, rPPG-based algorithms trained on data from the RD can be used with improved confidence on different consumer devices as long as the camera passes the validation protocol. In addition to the devices presented in this manuscript, further consumer devices were assessed using the validation framework described in this manuscript, indicating that the protocol can be applied across multiple brands [32]. While the individual components of the system are not novel in isolation, the contribution of this work lies in the structured, rPPG-specific validation methodology, linking controlled optical stimulation to quantitative acceptance criteria. This application-focused framework bridges the gap between generic camera characterisation procedures and rPPG algorithm performance evaluation.

4.2. Limitations

Several limitations of the proposed approach should be acknowledged. While the validation method allows a wider range of devices to use an rPPG-based application as a medical device, the procedure requires physical access to each device and does not currently have an approach to handle cameras that fail the acceptance criteria, limiting the applicability to all consumer devices. The mechanical setup is technically reproducible, but not necessarily scalable, and currently requires manual intervention for device placement, configuration of each test setup and downstream analyses.
Further, the proposed test environment is designed to evaluate camera sensor response and ISP behaviour under controlled light variation settings and does not attempt to replicate the full optical complexity of human skin and vascular structure. In particular, the use of a printed, 2D, facial image illuminated by LEDs does not reproduce effects such as subsurface scattering, multi-layer tissue variability, or blood perfusion effects that contribute to the rPPG waveform morphology. Therefore, the system can only assess the camera’s ability to preserve low-amplitude light intensity variations. This separation and distinction is intentional, because isolating the ISP and camera sensor pipeline from biological variability allows the framework to provide a reproducible method for characterisation of the device’s camera. The use of artificial materials to simulate human skin with realistic scattering and absorption properties could be explored in future work.

4.3. Future Work

Future work will focus on improving the scalability of the camera sensor validation system. This could include streamlining the mechanical setup, automating the taking of multiple measurements and analysis, and expanding the range of test conditions to reflect more diverse real-world applications. Further investigation into camera sensor behaviour and ISPs might enable application-level optimisation, ultimately allowing a greater proportion of devices to be validated without the need for hardware changes.
Additionally, a more detailed investigation into the Samsung A33’s similarity to the RD is warranted. Any given consumer smart device will eventually no longer receive updates and support. A high degree of similarity between an RD and a DUT offers the opportunity to further investigate how specific camera characteristics impact the sensor response, as well as the opportunity to replace the RD in future studies if the device has become unsupported.

5. Conclusions

This work presents a reproducible system for the validation of a camera sensor response in the context of rPPG. By focusing on sensor-level characterisation instead of rPPG algorithm performance alone, the proposed validation system addresses a gap in the generalisability of smart-device-based rPPG algorithms for vital sign prediction such as BP and PR. This validation is particularly important for the intended applications of medical software, where consistent signal acquisition across a wide range of consumer devices is essential.

6. Patents

A patent application has been filed related to the work described in this manuscript.

Author Contributions

Conceptualization, I.V., L.D.v.P. and S.W.; methodology, L.D.v.P. and S.W.; software, A.A., I.V. and L.D.v.P.; validation, I.V. and L.D.v.P.; formal analysis, I.V. and L.D.v.P.; investigation, A.A. and A.M.; data curation, A.A., A.M., I.V. and L.D.v.P.; writing—original draft preparation, L.D.v.P.; writing—review and editing, all authors; visualization, L.D.v.P.; supervision, L.D.v.P. and S.W. All authors have read and agreed to the published version of the manuscript.

Funding

This research received no external funding.

Data Availability Statement

The original contributions presented in this study are included in the article. Further inquiries can be directed to the corresponding author.

Acknowledgments

The authors would like to thank the engineering team at Xim Ltd. for their help with the camera algorithm development and data collection. We are also grateful to David Petronzio and Gauri Misra for their help in proofreading the final manuscript. During the preparation of this study, the authors used StyleGAN2 to create an artificial face image for the setup, as shown in Figure 1. The authors have reviewed and edited the output and take full responsibility for the content of this figure.

Conflicts of Interest

All the authors were employed by the company Xim Limited. The authors declare that the research was conducted in the absence of any commercial or financial relationships that could be construed as a potential conflict of interest.

Abbreviations

The following abbreviations are used in this manuscript:
BPBlood Pressure
DUTDevice Under Test
FSFitness Score
ISPImage Signal Processing
LEDsLight Emitting Diodes
PPGPhotoplethysmography
PRPulse Rate
rPPGRemote Photoplethysmography
RDReference Device
RMSERoot Mean Square Error
SDStandard Deviation

References

  1. Allen, J. Photoplethysmography and its application in clinical physiological measurement. Physiol. Meas. 2007, 28, R1–R39. [Google Scholar] [CrossRef] [PubMed]
  2. Charlton, P.H.; Kyriacou, P.A.; Mant, J.; Marozas, V.; Chowienczyk, P.; Alastruey, J. Wearable photoplethysmography for cardiovascular monitoring. Proc. IEEE 2022, 110, 355–381. [Google Scholar] [CrossRef]
  3. Tamura, T.; Maeda, Y.; Sekine, M.; Yoshida, M. Wearable photoplethysmographic sensors—past and present. Electronics 2014, 3, 282–302. [Google Scholar] [CrossRef]
  4. Verkruysse, W.; Svaasand, L.O.; Nelson, J.S. Remote plethysmographic imaging using ambient light. Opt. Express 2008, 16, 21434–21445. [Google Scholar] [CrossRef] [PubMed]
  5. Kim, B.S.; Yoo, S.K. Motion artifact reduction in photoplethysmography using independent component analysis. IEEE Trans. Biomed. Eng. 2006, 53, 566–568. [Google Scholar] [CrossRef]
  6. Yao, J.; Warren, S. A short study to assess the potential of independent component analysis for motion artifact separation in wearable pulse oximeter signals. In Proceedings of the 2005 IEEE Engineering in Medicine and Biology 27th Annual Conference; IEEE: New York, NY, USA, 2006; pp. 3585–3588. [Google Scholar]
  7. Shahmirzadi, D.; Rahmani, A.M.; Wang, W.F. Hybrid approach to heart rate estimation: Comparing Green, CHROM and POS methods in rPPG analysis. In Proceedings of the International Workshop on Advanced Imaging Technology (IWAIT) 2025; SPIE: Bellingham, WA, USA, 2025; Volume 13510, pp. 77–81. [Google Scholar]
  8. Khaleel Sallam Ma’aitah, M.; Helwan, A. 3D DenseNet with temporal transition layer for heart rate estimation from real-life RGB videos. Technol. Health Care 2025, 33, 419–430. [Google Scholar] [CrossRef]
  9. Haugg, F.; Elgendi, M.; Menon, C. Effectiveness of remote PPG construction methods: A preliminary analysis. Bioengineering 2022, 9, 485. [Google Scholar] [CrossRef]
  10. Yu, Z.; Li, X.; Zhao, G. Facial-video-based physiological signal measurement: Recent advances and affective applications. IEEE Signal Process. Mag. 2021, 38, 50–58. [Google Scholar] [CrossRef]
  11. Lu, Y.; Wang, C.; Meng, M.Q.H. Video-based Contactless Blood Pressure Estimation: A Review. In Proceedings of the 2020 IEEE International Conference on Real-Time Computing and Robotics (RCAR), Asahikawa, Japan, 28–29 September 2020; pp. 62–67. [Google Scholar] [CrossRef]
  12. Mironenko, Y.; Kalinin, K.; Kopeliovich, M.; Petrushan, M. Remote photoplethysmography: Rarely considered factors. In Proceedings of the IEEE/CVF Conference on Computer Vision and Pattern Recognition Workshops, Seattle, WA, USA, 14–19 June 2020; pp. 296–297. [Google Scholar]
  13. Pointer, M.R.; Attridge, G.G.; Jacobson, R.E. Practical camera characterization for colour measurement. Imaging Sci. J. 2001, 49, 63–80. [Google Scholar] [CrossRef]
  14. Mullikin, J.C.; van Vliet, L.J.; Netten, H.; Boddeke, F.R.; Van der Feltz, G.; Young, I.T. Methods for CCD camera characterization. In Proceedings of the Image Acquisition and Scientific Imaging Systems; SPIE: Bellingham, WA, USA, 1994; Volume 2173, pp. 73–84. [Google Scholar]
  15. van Putten, L.D.; Bamford, K.E.; Veleslavov, I.; Wegerif, S. From video to vital signs: Using personal device cameras to measure pulse rate and predict blood pressure using explainable AI. Discov. Appl. Sci. 2024, 6, 184. [Google Scholar] [CrossRef]
  16. Xuan, Y.; Barry, C.; Antipa, N.; Wang, E.J. A calibration method for smartphone camera photophlethysmography. Front. Digit. Health 2023, 5, 1301019. [Google Scholar] [CrossRef] [PubMed]
  17. Nosko, S.; Musil, M.; Zemcik, P.; Juranek, R. Color HDR video processing architecture for smart camera: How to capture the HDR video in real-time. J. Real-Time Image Process. 2020, 17, 555–566. [Google Scholar] [CrossRef]
  18. Wang, J.; Shan, C.; Liu, Z.; Zhou, S.; Shu, M. Physiological Information Preserving Video Compression for rPPG. IEEE J. Biomed. Health Inform. 2025, 29, 3563–3575. [Google Scholar] [CrossRef] [PubMed]
  19. Procka, P.; Borik, S. System for contactless monitoring of tissue perfusion. In Proceedings of the 2022 ELEKTRO (ELEKTRO); IEEE: New York, NY, USA, 2022; pp. 1–5. [Google Scholar]
  20. Karras, T.; Laine, S.; Aittala, M.; Hellsten, J.; Lehtinen, J.; Aila, T. Analyzing and Improving the Image Quality of StyleGAN. In Proceedings of the IEEE/CVF Conference on Computer Vision and Pattern Recognition, Seattle, WA, USA, 14–19 June 2020. [Google Scholar]
  21. Wiffen, L.; Brown, T.; Maczka, A.B.; Kapoor, M.; Pearce, L.; Chauhan, M.; Chauhan, A.J.; Saxena, M.; Lifelight Trials Group. Measurement of vital signs by lifelight software in comparison to standard of care multisite development (VISION-MD): Protocol for an observational study. JMIR Res. Protoc. 2023, 12, e41533. [Google Scholar] [CrossRef]
  22. van Putten, L.D.; Ahmed, A.; Wegerif, S. Remote photoplethysmography for contactless pulse rate monitoring: Algorithm development and accuracy assessment. Physiol. Meas. 2025, 46, 115004. [Google Scholar] [CrossRef]
  23. Lennart, L. System Identification: Theory for the User; PTR Prentice Hall: Upper Saddle River, NJ, USA, 1999; Volume 28, p. 540. [Google Scholar]
  24. Zahedi, E.; Sohani, V.; Ali, M.M.; Chellappan, K.; Beng, G.K. Experimental feasibility study of estimation of the normalized central blood pressure waveform from radial photoplethysmogram. J. Healthc. Eng. 2015, 6, 121–144. [Google Scholar] [CrossRef]
  25. Takazawa, K. Clinical usefulness of the second derivative of a plethysmogram (acceleration plethysmogram). J. Cardiol. 1993, 23, 207–217. [Google Scholar]
  26. Imanaga, I.; Hara, H.; Koyanagi, S.; Tanaka, K. Correlation between wave components of the second derivative of plethysmogram and arterial distensibility. Jpn. Heart J. 1998, 39, 775–784. [Google Scholar] [CrossRef]
  27. Kurylyak, Y.; Lamonaca, F.; Grimaldi, D. A Neural Network-based method for continuous blood pressure estimation from a PPG signal. In Proceedings of the 2013 IEEE International Instrumentation and Measurement Technology Conference (I2MTC), Minneapolis, MN, USA, 6–9 May 2013; pp. 280–283. [Google Scholar] [CrossRef]
  28. Tigges, T.; Pielmuş, A.; Klum, M.; Feldheiser, A.; Hunsicker, O.; Orglmeister, R. Model selection for the Pulse Decomposition Analysis of fingertip photoplethysmograms. In Proceedings of the 2017 39th Annual International Conference of the IEEE Engineering in Medicine and Biology Society (EMBC), Jeju, Republic of Korea, 11–15 July 2017; pp. 4014–4017. [Google Scholar] [CrossRef]
  29. de Haan, G.; van Leest, A. Improved motion robustness of remote-PPG by using the blood volume pulse signature. Physiol. Meas. 2014, 35, 1913. [Google Scholar] [CrossRef]
  30. Moco, A.V.; Stuijk, S.; de Haan, G. New insights into the origin of remote PPG signals in visible light and infrared. Sci. Rep. 2018, 8, 8501. [Google Scholar] [CrossRef] [PubMed]
  31. Nowara, E.M.; McDuff, D.J.; Veeraraghavan, A. A Meta-Analysis of the Impact of Skin Type and Gender on Non-contact Photoplethysmography Measurements. In Proceedings of the 2020 IEEE/CVF Conference on Computer Vision and Pattern Recognition Workshops (CVPRW), Seattle, WA, USA, 13–19 June 2020; pp. 1148–1155. [Google Scholar]
  32. Lifelight. Validated Devices|Lifelight. 2026. Available online: https://lifelight.ai/validated-devices (accessed on 10 March 2026).
Figure 1. Example photograph of the described setup for device validation. The custom 3D-printed rig is shown, holding the test image and Arduino-driven LEDs opposite the fixed support for a device under test.
Lights 02 00003 g001
Figure 2. Ten second snippets of two repeated pulse-like waveforms used as known waveform input to characterise the camera sensor responses. Both waveforms are shown at three different pulse rates (60, 90, and 120 bpm).
Lights 02 00003 g002
Figure 3. Visualisation of the 35 s frequency sweep test input signal’s amplitude (top), alongside its frequency in Hz as a function of time (bottom).
Lights 02 00003 g003
Figure 4. Block diagram of the camera sensor response validation procedure, from signal acquisition to the evaluation of performance metrics.
Lights 02 00003 g004
Figure 5. Captured responses from the reference device sensor, for the two pulse-like input waveforms at the three fixed pulse rates (60, 90, 120 bpm). Each individual pulse is shown in colour, with the average of the extracted pulses from the full input signal shown in black.
Lights 02 00003 g005
Figure 6. Frequency responses recorded using the reference device from the frequency sweep test input. The trace from individual sweep tests is shown in colour, with the mean frequency response of the reference device over all individual sweep tests shown in black.
Lights 02 00003 g006
Figure 7. Density histograms of fitness scores between all extracted pulses and their average waveform, all obtained on the reference device—demonstrating consistent video capture behaviour. These are shown for both of the two unique pulse-like reference waveforms, at the three fixed pulse rates (60, 90 and 120 bpm).
Lights 02 00003 g007
Figure 8. Comparison of individual pulses for different devices under test against the averaged reference wave for pulse wave shape 1 with a pulse rate of 60 bpm.
Lights 02 00003 g008
Figure 9. Comparison of the measured frequency responses for all three devices under test compared against the mean frequency response of the reference device.
Lights 02 00003 g009
Table 1. Fitness score thresholds for the two different input pulse-like waveforms used, calculated for the three fixed pulse rates (60, 90, 120 bpm).
Pulse Rate (bpm)Pulse Wave Shape 1Pulse Wave Shape 2
600.810.82
900.710.72
1200.610.62
Table 2. Time-domain test results for the reference device compared to each of the three devices under test. Fitness score values are given for each of the two pulse-like input waveforms, for each of the fixed pulse rates (60, 90, 120 bpm). The mean and standard deviation of the derived fitness score from all extracted waveforms are reported for each test condition.
Pulse Rate (bpm)Pulse Shape:
FS Threshold
Samsung A33
(Mean ± SD)
iPhone XR
(Mean ± SD)
Pixel 10
(Mean ± SD)
601: >0.810.94 ± 0.010.88 ± 0.050.89 ± 0.04
901: >0.710.84 ± 0.010.86 ± 0.050.85 ± 0.06
1201: >0.610.86 ± 0.020.84 ± 0.030.84 ± 0.06
602: >0.820.88 ± 0.030.86 ± 0.050.88 ± 0.04
902: >0.720.91 ± 0.010.85 ± 0.040.84 ± 0.06
1202: > 0.620.79 ± 0.010.74 ± 0.050.79 ± 0.06
Table 3. Frequency response agreement metrics for the devices under test compared to the reference device. RMSE values are calculated relative to the mean reference device frequency response across the tested brightness conditions. The acceptance threshold derived from reference device repeatability testing was RMSE ≤ 0.11.
DeviceMean RMSESD RMSEMax RMSEMean Correlation (r)
iPad 8 (Reference device)0.01970.01280.0535
Samsung A330.01700.01120.03600.99
iPhone XR0.04830.01110.06380.98
Pixel 100.07180.02210.10190.96
Disclaimer/Publisher’s Note: The statements, opinions and data contained in all publications are solely those of the individual author(s) and contributor(s) and not of MDPI and/or the editor(s). MDPI and/or the editor(s) disclaim responsibility for any injury to people or property resulting from any ideas, methods, instructions or products referred to in the content.