Systematic Review

AI Posture Recognition Performance for Work-Related Musculoskeletal Disorders Prevention in Manufacturing: Comparison Between Logit and Freeman-Tukey Transformation in Meta-Analysis


by
Julien Jacquier-Bret
1,2,* and
Philippe Gorce
1,2
1
Université de Toulon, CS 60584, CEDEX 9, 83041 Toulon, France
2
International Institute of Biomechanics and Occupational Ergonomics, Avenue du Docteur Marcel Armanet, CS 10121, 83418 Hyères Cedex, France
*
Author to whom correspondence should be addressed.
Theor. Appl. Ergon. 2026, 2(3), 16; https://doi.org/10.3390/tae2030016
Submission received: 8 June 2026 / Revised: 21 July 2026 / Accepted: 28 July 2026 / Published: 1 August 2026

Abstract

The objective of this study was to assess the performance of posture recognition systems based on artificial intelligence (AI) using deep learning (DL) and machine learning (ML) approaches for the prevention of work-related musculoskeletal disorders (WMSDs) in manufacturing. The study was conducted as a systematic review and meta-analysis following the PRISMA (Preferred Reporting Items for Systematic Reviews and Meta-Analyses) guidelines. Four open-access databases were screened in May 2026 without date restrictions: PubMed/MedLine, Google Scholar, ScienceDirect, and IEEE Xplore. The selected studies had to be original, peer-reviewed studies written in English. The study had to evaluate the performance of an AI posture recognition system (ML or DL) for the prevention of WMSDs in manufacturing using at least one of the following parameters: accuracy, specificity, sensitivity, precision, or F1 score. The risk of bias for each included study was assessed using PROBAST (Prediction Model Study Risk of Bias Assessment Tool). A meta-analysis was conducted to pool the values of the five performance metrics separately. Logit and Freeman-Tukey transformations were applied prior to pooling, and the results were compared after back-transformation. Cochran’s Q test, the I2 statistic, and inter-study variability (τ2), computed using the generalized inverse variance method with the restricted maximum likelihood model, were applied to assess heterogeneity. Forest plots including pooled values with 95% confidence intervals were used to present the results. Subgroup analyses and meta-regressions were performed to test the effect of AI methods and ergonomic tools on performance and to explore potential causes of heterogeneity. Finally, publication bias (Egger’s test) and certainty of evidence (GRADE method—Grading of Recommendations Assessment, Development, and Evaluation) were assessed to ensure the generalizability of the results. Ten studies were included: Among the 200 studies identified through database searches and the snowball method, 12 met the inclusion criteria and were selected. Two studies were excluded due to an insufficient number of participants, bringing the final number of studies considered to 10. The logit transformation yielded the best overall fit for the normality of the data distribution for the use of a random-effects model. High posture detection performance was observed, with pooled values ranging from 84.78% (95% CI: 80.23–88.19%, specificity with Freeman-Tukey) to 93.40% (95% CI: 89.57–95.89%, precision with logit). The values obtained with logit were higher than those obtained with Freeman-Tukey, with differences ranging from 2.75% to 4.75% across all performance metrics. Meta-regression showed that DL outperformed ML for all metrics, with differences ranging from 5% to 17%. RULA and REBA achieved better performance than other ergonomic tools. However, high heterogeneity (I2 > 90%) and substantial inter-study variability were observed in all analyses, and a very low level of evidence was evidenced for all performance parameters. Consequently, the results should be interpreted with caution, particularly regarding the deployment of the systems in real-world settings. Future work could strengthen training and testing procedures on datasets, as well as external validation. These aspects are essential for effective use in manufacturing environments to ensure operator safety by reducing their exposure to WMSD risks associated with work postures.

1. Introduction

Work-related musculoskeletal disorders (WMSDs) are one of the leading occupational health issues, as workers are frequently exposed to significant biomechanical strains such as awkward postures, repetitive movements, manual handling, and prolonged exertion [1,2]. Worldwide, WMSDs are a major cause of pain, functional disability, and work absenteeism, with direct and indirect costs amounting to tens of millions of dollars [3,4,5]. A high prevalence of WMSDs has been identified in many occupational sectors, such as healthcare [6,7], construction [8], agriculture [9], office work [10], tourism [11], and education [12]. In manufacturing, the prevalence remains particularly high. Studies have reported an overall 12-month prevalence of 53.1% in the automotive sector [13], 40.6% among workers in the electronics industry [14], and 69.2% in the steel industry [15]. Given their high prevalence and their economic and human consequences, musculoskeletal disorders are now a major challenge for improving working conditions in the manufacturing sector and justify the development of appropriate monitoring and prevention solutions.
The rise of Industry 4.0 has enabled the implementation of automated equipment and digital solutions, both to increase productivity and to ensure safety at work. In this context, artificial intelligence (AI) is playing an increasingly important role, particularly in supporting the implementation of policies aimed at reducing the incidence of WMSDs to protect workers and improve their quality of life at work. It relies on the analysis of a wide variety of data types (physiological, postural, muscular, kinematic, dynamic, etc.) collected from wearable, non-wearable sensors, or hybrid solutions [16,17]. Using this data and advanced algorithms, AI is now able to recognize human activity (HAR) using machine learning (ML) and deep learning (DL) methods [18,19]. For the prevention of WMSDs, the approach is based on the identification of postures—qualified and quantified through various variables—followed by the application of an ergonomic assessment method to determine the level of risk. Assessment methods may be based on tools that use objectively defined biomechanical and ergonomic standards, such as the Rapid Upper Limb Assessment (RULA) [20], the Rapid Entire Body Assessment (REBA) [21], the Ovako Working Posture Analysis System (OWAS) [22], or the NIOSH Lifting Equation (National Institute for Occupational Safety and Health) [23], or on a more subjective assessment of posture, classified as correct (or safe) and incorrect (or unsafe) [24]. Numerous studies have proposed AI-based solutions to assess the risk of WMSDs based on posture analysis or its characteristics [25,26]. The authors evaluated their system’s ability to correctly identify this risk by constructing a confusion matrix and then computing various metrics, among which the most commonly used are accuracy, specificity, sensitivity, precision, and the F1 score [27]. Several systematic reviews have provided a state-of-the-art overview of different topics: WMSD risk management [28], risk assessment using vision-based tools applying ML methods [29], or using wearable sensors in industrial and non-industrial environments [30]. However, performance metrics are often missing or rarely reported, even though they are crucial to the viability of an assessment system. Only a recent study by Gorce et al. [31] has synthesized performance metrics for WMSD prevention, but it did so only by averaging performance values across occupational sectors. To our knowledge, there is no systematic review with a meta-analysis that addresses the performance of WMSD risk assessment using an AI method in manufacturing. The application of a rigorous meta-analysis approach such as PRISMA (Preferred Reporting Items for Systematic reviews and Meta-Analyses [32]) ensures the robustness and level of evidence required for the generalization of results, their applications, and the formulation of recommendations.
In this context, the objective of this study was to evaluate the performance of posture detection systems for the prevention of WMSDs in manufacturing using a meta-analysis that followed the recommendations of the PRISMA guidelines. A thorough analysis was conducted to examine the effect of the AI approach (ML vs. DL) and the ergonomic tool assessment on the five parameters most frequently used in the literature. Since performance metrics are binomial proportions ranging from 0 to 1 and the aim is to maximize them, their distribution is often skewed. Consequently, they do not directly meet the normality assumptions of the random-effects models used in meta-analysis. To stabilize variance and handle extreme proportions, variance-stabilizing transformations are typically applied prior to data synthesis [33]. The two most commonly used transformations are the logit transformation [34] and the Freeman-Tukey double arcsine transformation [35]. These methods handle proportions near extreme values and ensure a better data distribution. To our knowledge, only one meta-analysis regarding the prevalence of WMSDs—affecting the neck, lower back, and shoulders—has applied the logit and Freeman-Tukey transformations [36]. A meta-analysis was also conducted using the logit to evaluate the performance of an AI system for classifying Parkinson’s disease severity levels [37]. No study has been conducted to analyze the performance of AI-based posture recognition methods in the context of WMSD prevention. Thus, for each AI method, each ergonomic assessment tool, and each performance parameter, the two transformations (Logit and Freeman-Tukey) were compared. The aim was to provide evidence to guide future research and assist manufacturing sector leaders and policymakers in improving workplace safety and quality of life.

2. Materials and Methods

2.1. Search Strategy

This study focuses on analyzing the performance of an AI-based posture detection and recognition system designed to prevent the occurrence of WMSDs in manufacturing. To conduct a meta-analysis, four open-access databases were searched in May 2026 to identify relevant studies without date restrictions: PubMed/MedLine, Google Scholar, ScienceDirect, and IEEE Xplore. Table 1 presents the combination of keywords linked by the logical operators AND and OR used during the search. Given the different restrictions depending on the search engines, a slight adjustment to the keyword combination was necessary.
The results of the search conducted in each database were compiled into a single Excel file (Microsoft® Office Excel 2019, Microsoft, Redmond, WA, USA), with one row per result. Duplicates were removed using the matching function based on the title and authors’ names. An initial selection was made based on the title and abstract independently by two reviewers (PG and JJB) according to the inclusion and exclusion criteria. The results were compared to validate the list of remaining articles. Then, a second selection was carried out independently by the two reviewers (PG and JJB) based on the full text to retain only those articles meeting the inclusion/exclusion criteria. The lists from each reviewer were compared again to determine the final list of studies included from the database analysis. At each stage, any discrepancies were resolved through discussion to reach a consensus after re-reading and re-evaluating the article if necessary.
During the second phase of selection, the reviewers identified additional potentially relevant studies from the reference list (using a “snowball” selection method). The two reviewers independently assessed each study based on its full text and then reached a consensus on whether to include it in the meta-analysis. Studies meeting the criteria were manually added to the list of selected articles after the database screening.

2.2. Inclusion/Exclusion Criteria

To be included, a study had to meet several criteria. First, the authors had to present an AI-based posture recognition method applied to an activity in the manufacturing sector. This recognition had to be conducted within an ergonomic context aimed at preventing WMSDs, i.e., the objective was to identify WMSD risks associated with the postures under study. Finally, the study had to evaluate the performance of WMSD risk identification using at least one of the following parameters: accuracy, precision, specificity, sensitivity, and F1 score. To ensure a sufficient level of quality, only original, published, and peer-reviewed studies were considered.
The following exclusion criteria were applied: (1) the study was a conference paper, a book or chapter, a review, a report, a case study, or a case report; (2) the study was not written in English; (3) the level of ergonomic risk was not assessed qualitatively or quantitatively; (4) the methodological details were insufficient; (5) performance parameters were not available.

2.3. Risk of Bias Assessment

The Prediction Model Study Risk of Bias Assessment Tool (PROBAST [38]), designed for diagnostic test accuracy studies, was used to assess the risk of bias. PROBAST evaluates this risk across four domains based on several criteria: participants (2 items), predictors (3 items), outcomes (6 items), and analysis (9 items). Each item is formulated as a question, where a “yes” answer indicates the absence of bias. The first step involves selecting one of the following responses for each item: “yes,” “probably yes,” “probably no,” “no,” or “missing information.” The second step involves assigning a risk of bias level to each of the four domains based on the responses given to the criteria within it, as follows: “low” if all responses were “yes” or “probably yes,” “high” if at least one item received a “no” or “probably no” response, or “moderate” if at least one response was “missing information” and the other responses were “yes” or “probably yes.” The final step involves assessing the overall risk of bias based on the risk assigned to each domain. The following rule was applied: “low risk of bias” if all domains had a low risk of bias; “moderate risk of bias” if a moderate risk of bias was identified in at least one domain and a low risk was assigned to all others, and “high risk of bias” if at least one domain presented a high risk of bias. It should be noted that in the context of evaluating an AI solution, validation is an essential methodological step for clinical transferability. Thus, a lack of validation consistently led to a judgment of high risk of bias for the considered study [17]. The results were presented with a traffic light plot [39].

2.4. Data Extraction

For each included study, contextual and performance data were considered. For the first part, the first author’s name, year of publication, manufacturing activity, the postures studied, the ergonomic assessment method, the sensors used and their positions, the number of subjects tested, the AI method (ML or DL), and the algorithms implemented (Convolutional Neural Network—CNN, Support Vector Machine—SVM, K-Nearest Neighbors—KNN, Long Short-Term Memory—LSTM, Decision Tree—DT, …) were extracted. Next, the data for each performance metric were collected for each AI method presented. The five metrics considered are the most commonly used in the literature: accuracy, precision, sensitivity, specificity, and F1 score [40]. They are derived from the confusion matrix containing correct positive predictions called true positives (TP), correct negative predictions called true negatives (TN), incorrect positive predictions called false positives (FP), and incorrect negative predictions called false negatives (FN). The formulas used to determine these five metrics are: accuracy = (TP + TN)/(TP + TN + FP + FN), sensitivity = TP/(TP + FN), specificity = TN/(FP + TN), precision = TP/(TP + FP), and F1-score = 2 × (sensitivity × precision)/(sensitivity + precision).

2.5. Statistical Analysis

The objective is to provide an overview of posture identification performance for the prevention of WMSDs in manufacturing. Since the performance indicators are bounded between 0 and 1 with a skewed sampling distribution, it is necessary to transform the data prior to pooling, particularly to stabilize the variance and bring the distribution closer to a normal distribution [33]. Several transformation methods exist in the literature. The logit method enables good handling of performance values close to the bounds (0% and 100%) but requires a continuity correction for these two extreme values. The main advantage is that it is easily interpretable and widely used in diagnostic meta-analyses [34]. The Freeman-Tukey transformation [35] is an extension of the arcsine transformation designed to better handle extreme proportions. It naturally handles these proportions and reduces problems associated with small sample sizes. To meet our objective, the two transformations were performed before conducting the meta-analysis using the equations presented below.
The formula for the logit transformation was:
l o g i t p = l n p 1 p = l
The Freeman-Tukey (FT) transformation formula was:
F T p = 1 2 a r c s i n x n + 1 + a r c s i n x + 1 n + 1 = α
where p is performance (between 0 and 1), ln is the natural logarithm, x is the number of successes, and n is the sample size.
The standard error (SE) corresponding to each transformation was computed according to the following respective formulas:
S E l o g i t p = 1 p + 1 n p
S E F T p = 1 4 n
where p is performance (between 0 and 1) and n corresponds to the sample size.
If p is equal to 0 or 1, the logit transformation and the computation of the corresponding SE become mathematically impossible. Then, a Haldane-Anscombe continuity correction (p(HA)) [41,42] was applied to recompute p to enable logit transformation and standard error computation according to the formula:
p ( H A ) = p + 0.5 n + 1
where p is performance (between 0 and 1) and n corresponds to the sample size.
Once the transformations were completed, two series of analyses were conducted. The first step involved comparing the effects of each transformation on the data distribution prior to pooling. Three measures of normality were considered. The Shapiro–Wilk test detects deviations from normality. The Shapiro–Wilk coefficient W indicates the degree to which the distribution approximates a normal distribution (the higher the value, the closer the distribution is to a normal distribution), while the Shapiro–Wilk p-value indicates whether the distribution is statistically normal [43]. Skewness quantifies the imbalance of the distribution, and kurtosis measures the thickness of the distribution’s tails. For both indicators, the closer the values are to zero, the closer the distribution is to normality [44].
The second series consisted of conducting a meta-analysis separately for each performance parameter. The values from each transformation were successively pooled using a random-effects model due to high heterogeneity. Inter-study variability (τ2) was estimated using the inverse variance method with the restricted maximum likelihood model. Heterogeneity was assessed using Cochran’s Q-test (significance level set at 10%) and the I2 statistic [45] and classified into four levels based on the I2 value: low heterogeneity (0–40%), moderate heterogeneity (30–60%), substantial heterogeneity (50–90%), and high heterogeneity (75–100%) [45]. For each analysis, the transformed outcome was reported as its pooled value and 95% confidence interval. The results were presented using forest plots.
The analysis was expanded by exploring the causes of heterogeneity. A subgroup analysis was conducted to assess the effect of the AI method used, i.e., ML vs. DL methods. The performances of each factor were compared using a pairwise mixed-effects meta-regression.
Finally, a sensitivity analysis with a leave-one-out method was conducted to test the robustness of the meta-analysis results, and Egger’s test [46] was applied to assess publication bias (significance threshold set at 5%).
To interpret and compare the results, all pooled performance values were back-transformed to the original scale using the following equations corresponding to each transformation:
p l o g i t = a n t i l o g i t l = e l 1 + e l
p F T = ( sin α ) 2
where l is the value on the logit scale (Equation (1)), and α is the value on the Freeman-Tukey scale (Equation (2)).
All analyses were performed with JASP software (JASP Team, v0.96.0.0, Amsterdam, The Netherlands) with a significance threshold set at 5%.

2.6. Certainty of Evidence

The quality of evidence for each performance parameter was assessed for each transformation using the four-level scale of the GRADE (Grade of Recommendations Assessment, Development and Evaluation) method [47]: high, moderate, low, and very low. Two reviewers independently assessed the five domains that compose the GRADE, i.e., risk of bias, indirectness of evidence, inconsistency of results, imprecision of results, and publication bias, before reaching a final judgment. The results of each reviewer were compared and discussed to validate the final rating.

2.7. Registration and Guidelines

The protocol was registered in PROSPERO (CRD420261413187). The PRISMA guidelines (Preferred Reporting Items for Systematic reviews and Meta-Analyses) [32,48,49] were followed to present the results. A detailed presentation of the application of PRISMA (including for the abstract) was provided as Supplementary Materials.

3. Results

3.1. Search Results

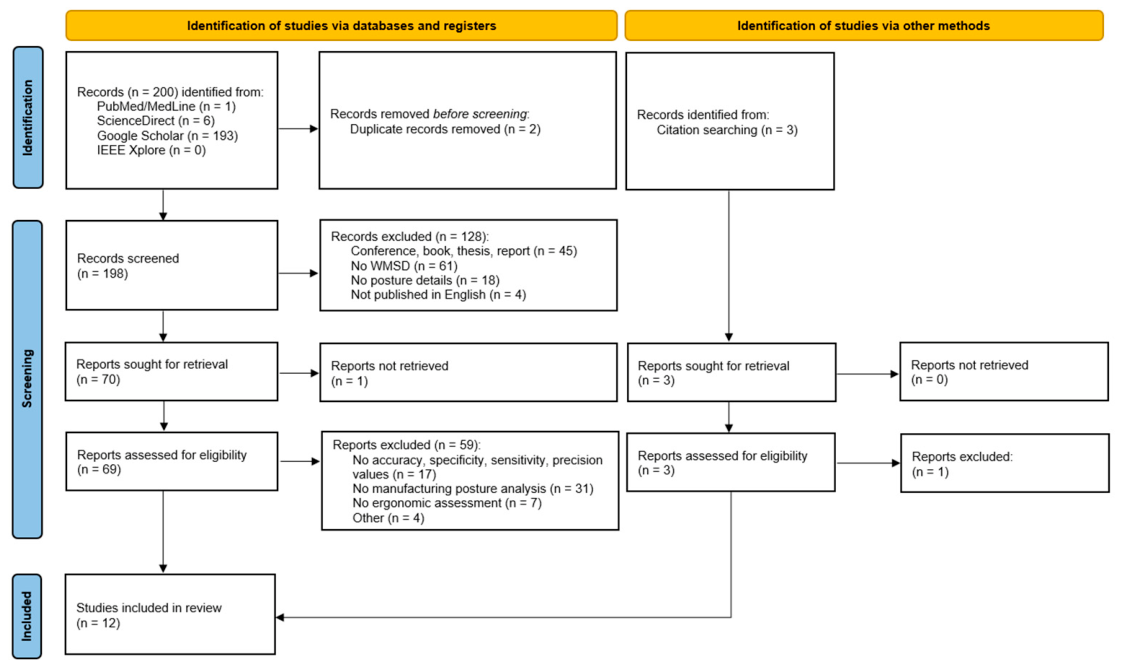
A search of the four databases identified 200 studies. After removing two duplicates, 128 studies were excluded for the following reasons: they were not original peer-reviewed studies, they did not include an analysis in the context of WMSD prevention, or they lacked information on the postures studied. Of the 70 remaining studies, evaluation of the full text led to the exclusion of an additional 60 studies because the performance results did not concern one of the five selected parameters, the analysis was not conducted in a manufacturing setting, or because the ergonomic assessment was imprecise or missing. To the 10 studies included following the database search, 2 were manually added following snowball sampling. Ultimately, the meta-analysis included 12 unique studies. Figure 1 illustrates the full selection process.

3.2. Study Characteristics

Table 2 presents the characteristics of the 12 included studies: manufacturing activity, postures studied, methods and algorithms used, measurement methods employed, sensors and their locations, as well as the number of subjects who participated in the evaluation process. Five different tasks were analyzed in the context of manufacturing: handling [50,51], lifting [24,52,53,54,55,56], sewing [57,58], assembly [59], and multiple manufacturing tasks [60]. Most of these activities were performed in a standing position (10 studies [24,50,51,52,53,54,55,56,59,60]). Only the two studies on sewing examined subjects in a seated position [57,58]. The assessment of WMSD risk was conducted using five different approaches. Ten studies used ergonomics tools recognized in the literature: RULA [50,51,57,59], REBA [55,58], NIOSH [53,54,56], and OSHA (Occupational Safety and Health Administration) [60]. The other two studies simply defined posture categories: safe and unsafe [24,52]. In terms of AI methods, 5 studies used a DL approach [50,51,53,55,59], while 7 used an ML approach [24,52,54,56,57,58,60]. The sensors used belong to the two main categories: wearable and non-wearable. For wearable sensors, the authors primarily used IMUs (inertial measurement units) [24,52,54], EMGs (electromyography) [53,56], and sensors built into smartphones [60]. For the non-wearable sensors, three studies used cameras [55,58,59] and one study used an optoelectronic system [57]. Two studies proposed a hybrid approach by combining IMUs with cameras [50,51].
Table 3 presents the performance metrics reported in each study among the five metrics considered: accuracy, specificity, sensitivity, precision, and F1 score. The symbol X indicates that the authors evaluated their solution using that metric. Accuracy was the most frequently used metric for evaluating performance (9 studies [24,50,51,52,53,54,56,58,60]). Seven studies used sensitivity [24,51,52,53,54,55,60] or F1 score [24,51,53,55,57,59,60]. Precision was reported in 6 studies [24,51,52,53,55,60] and specificity in only 3 studies [24,52,54]. Only the study by Prisco et al. [24] reported performance values for all five parameters. Cruciata et al. [51], Davoudi Kakhki et al. [53], and Nath et al. [60] used 4 parameters (specificity was not evaluated in any of the three studies). Five studies used only one parameter [50,56,57,58,59].

3.3. Exclusion of Selected Studies and Available Data for Meta-Analysis

Although they all met the expected criteria, the studies by Mudiyanselage et al. [56] and Nath et al. [60] were excluded because the sample sizes used to validate the method were 1 and 2 subjects, respectively. However, it has been demonstrated that such a small sample size is not sufficient to validate an AI method [61,62].
Since the 10 remaining studies often presented multiple solutions, the total number of data available for this performance analysis was 418, distributed as follows: 106 data for accuracy, 83 for specificity, 99 for sensitivity, 72 for precision, and 58 data for F1 score.

3.4. Risk of Bias

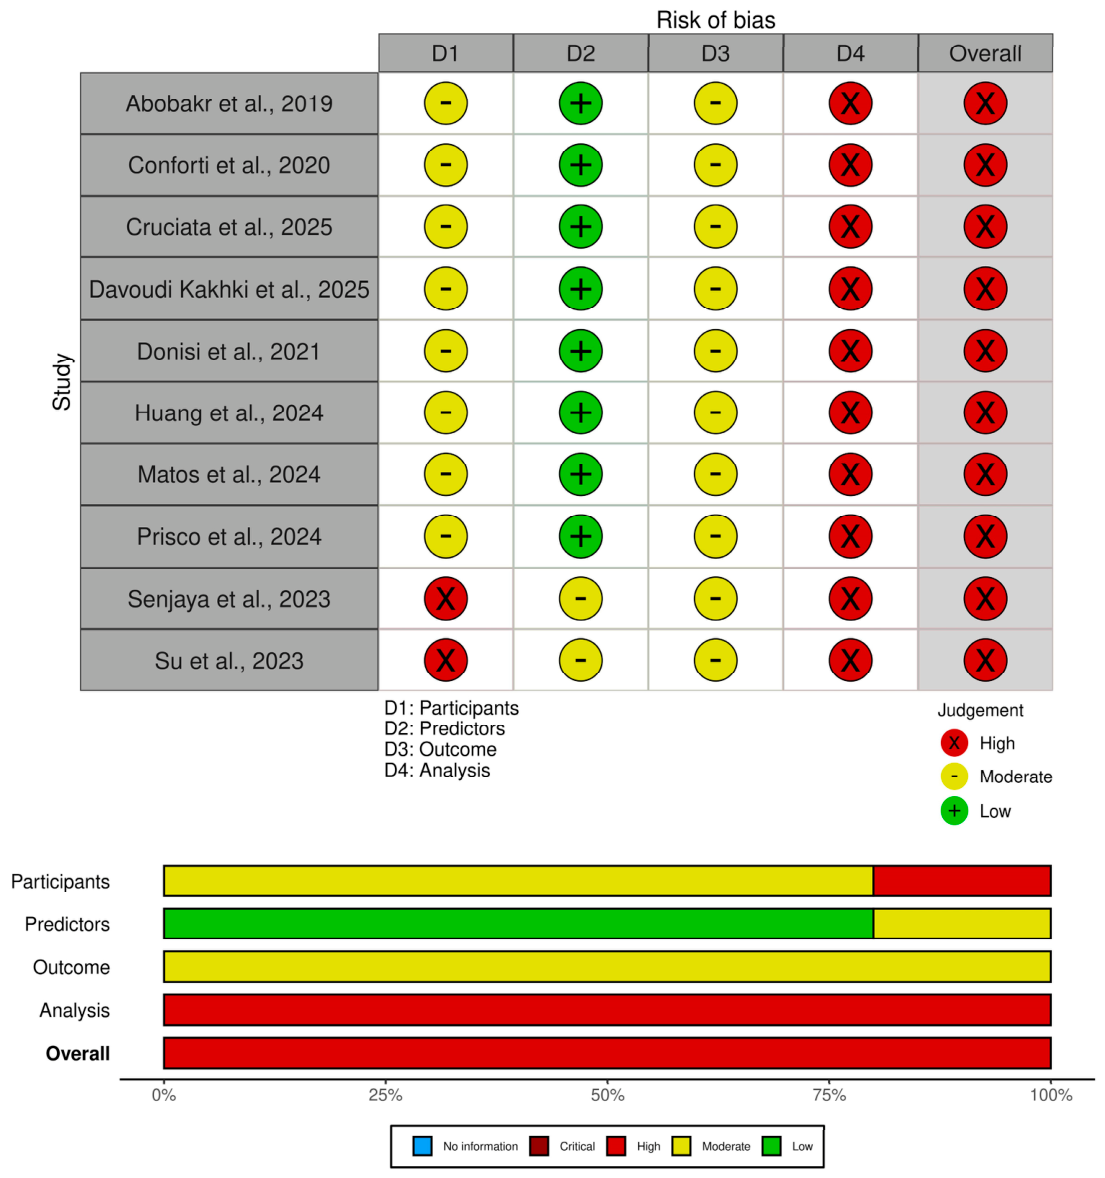
The 10 studies presented a high risk of bias, primarily due to the “Analysis” domain (Figure 2). Several critical issues were identified: overlapping sliding windows and non-independent observations, which pose a major risk of pseudo-replication bias; imprecise separation of training and testing data, raising concerns about the risk of data leakage and an optimistic estimate of model performance; and the absence of external validation or calibration analysis. All these issues limit the generalizability of the results to real-world professional environments, which explains the high risk of bias.

3.5. Comparison of Performance Between Logit and Freeman-Tukey Transformations

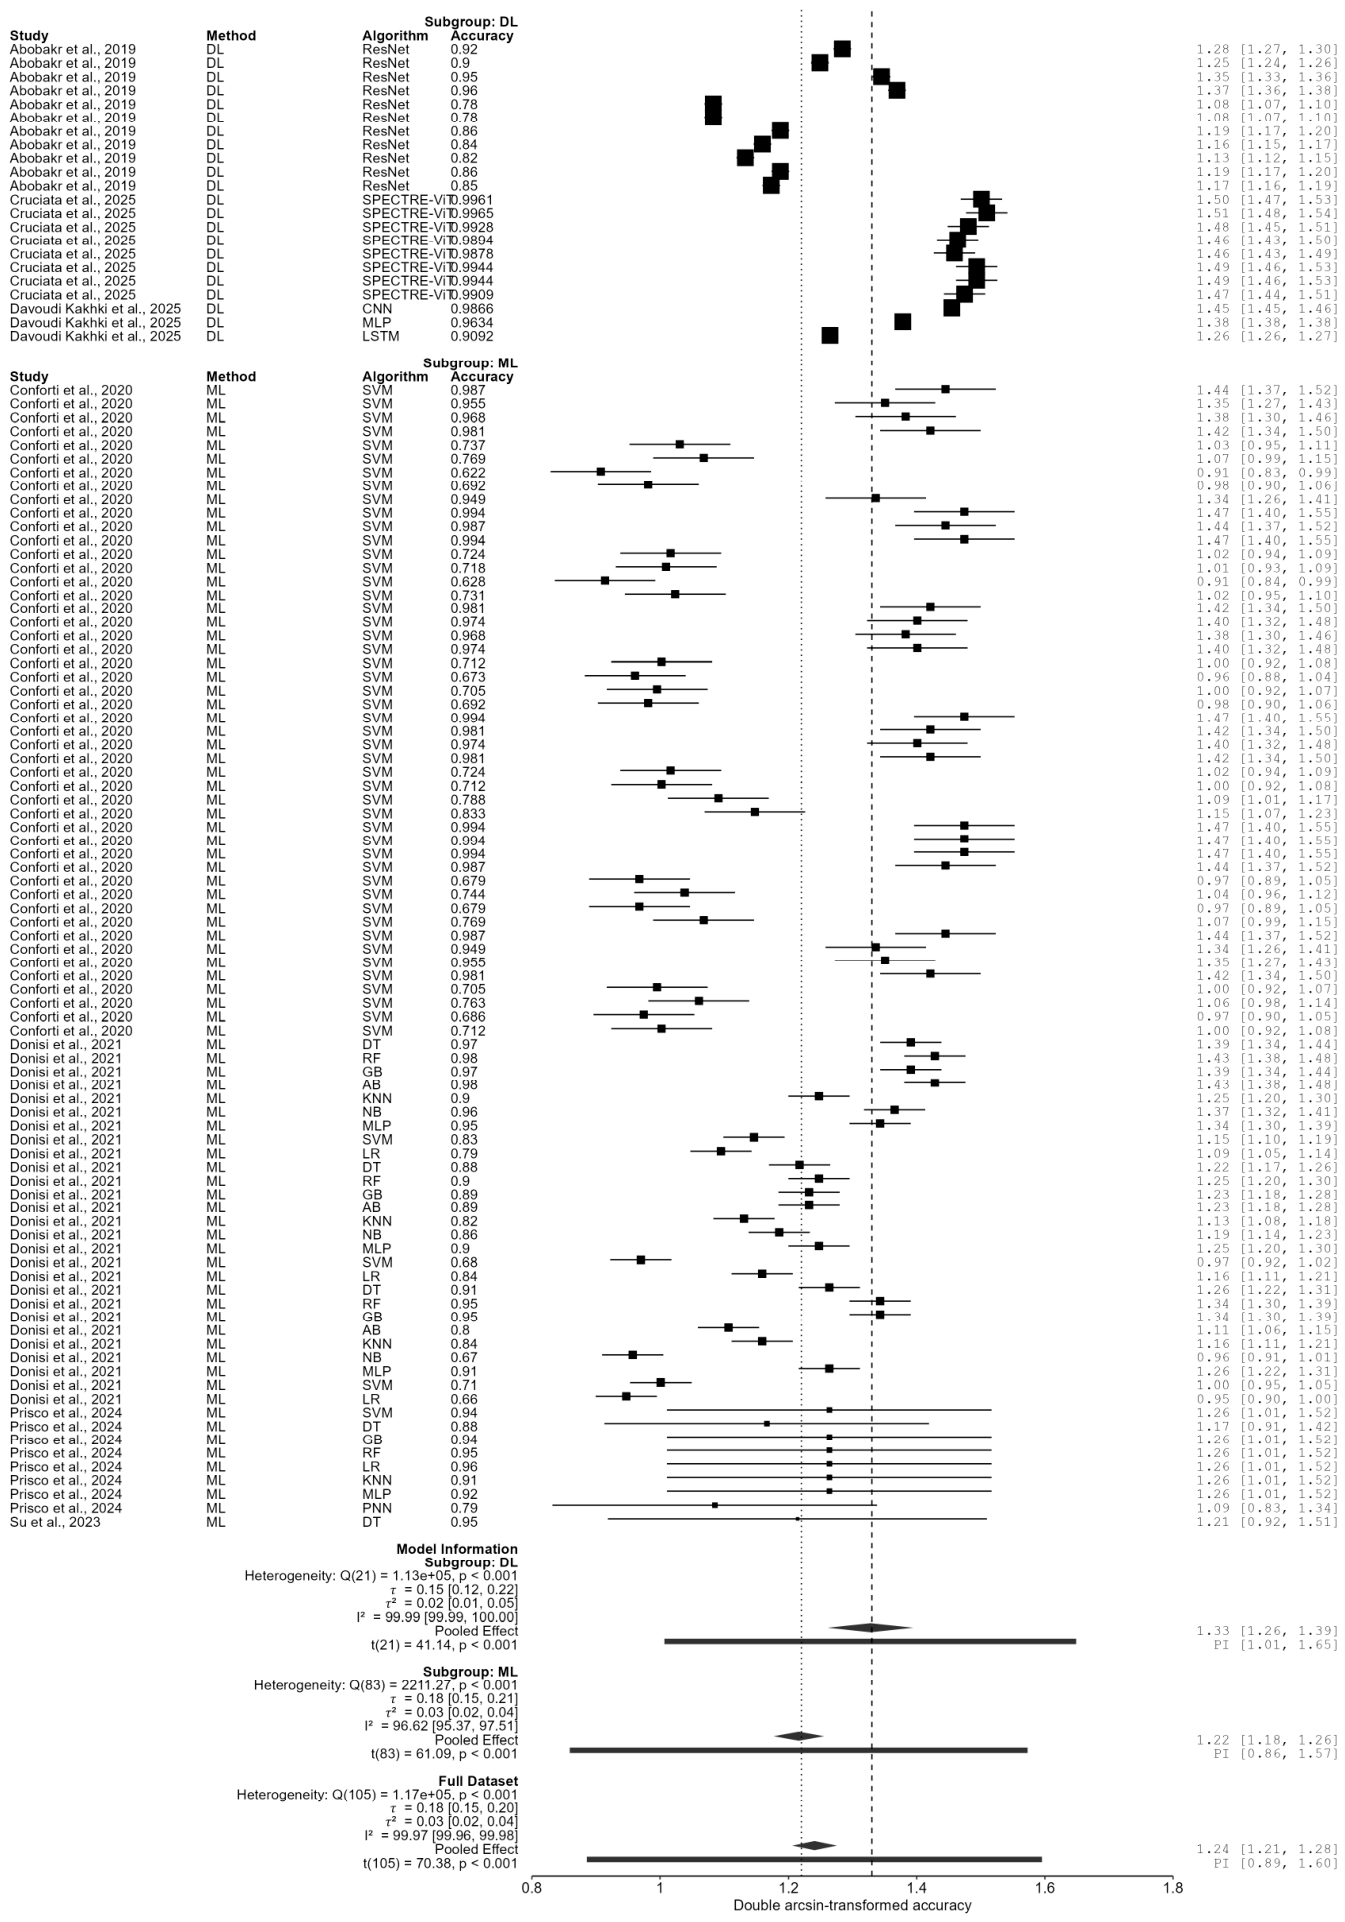
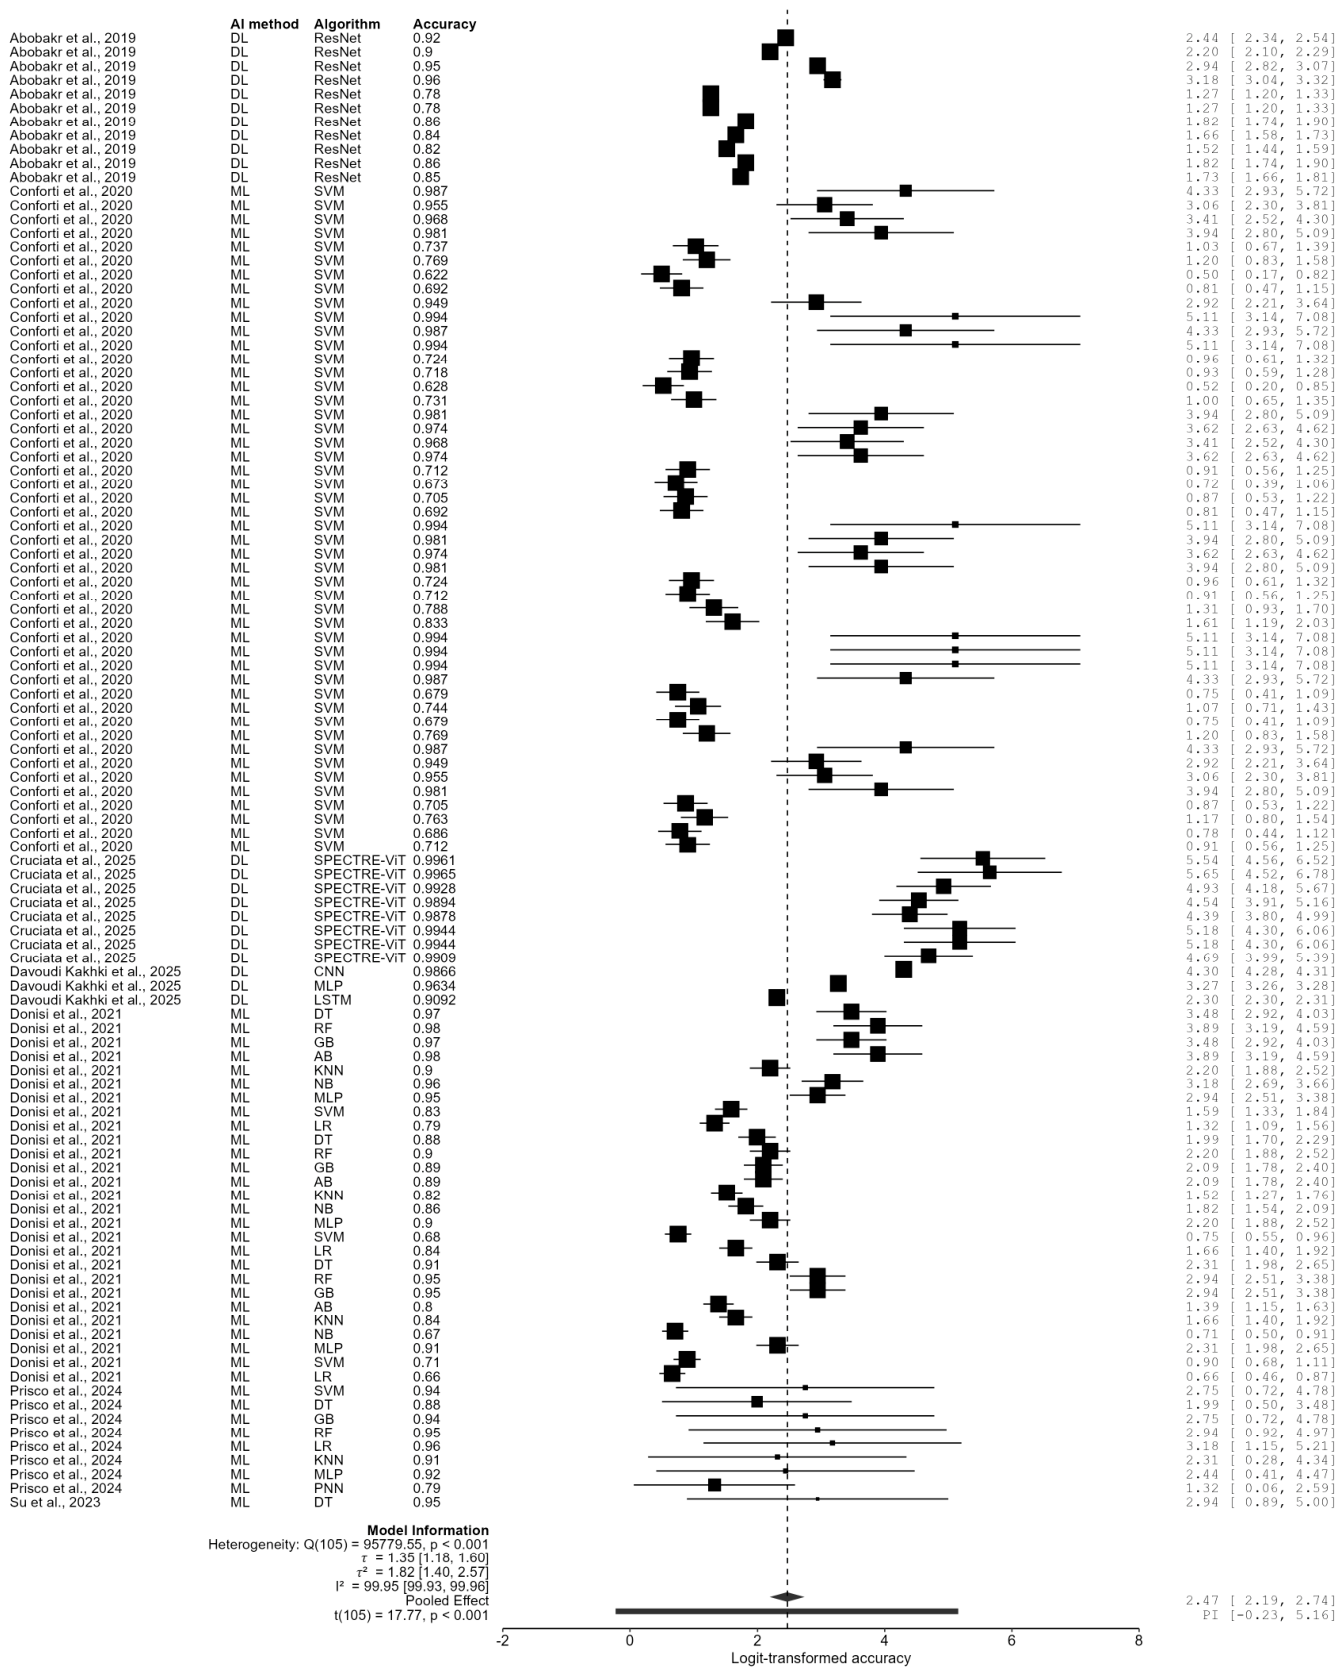
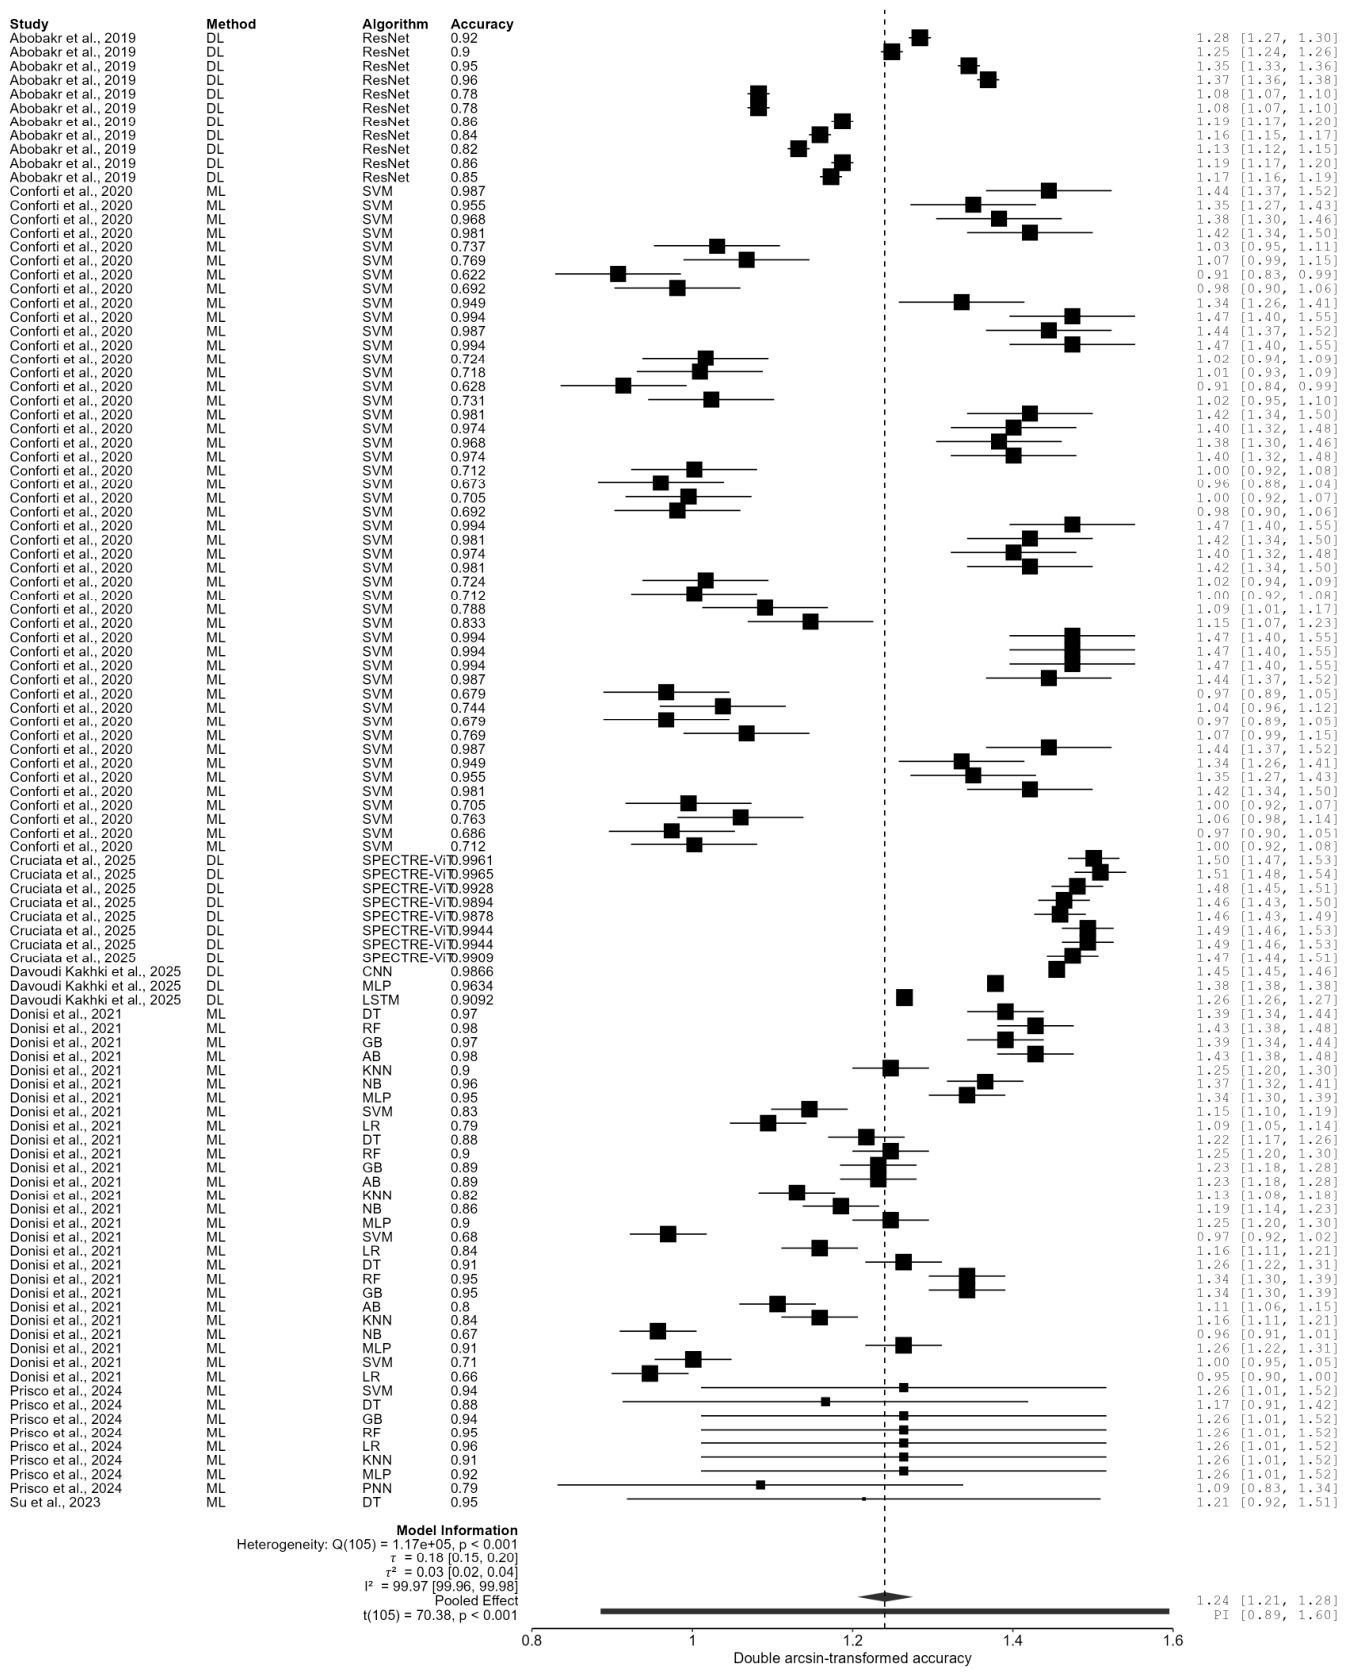
Figure 3 and Figure 4 present the transformed accuracy results using the logit and Freeman-Tukey methods, respectively. The pooled values were 2.47 (95% CI: 2.19–2.74) and 1.24 (95% CI: 1.21–1.28), corresponding to a back-transformed accuracy of 92.20% (95% CI: 89.93–93.93) and 89.45% (95% CI: 87.54–91.78%), respectively. All back-transformed results were summarized in Table 4. The results showed that the pooled values obtained using the logit transformation were consistently higher than those obtained using the Freeman-Tukey transformation. The difference ranged from 2.75% to 4.75% across all performance metrics. With the logit transformation, only the specificity (87.54%) performed below 90%. The highest performance was recorded for precision and the F1 score at 93.40%. With the Freeman-Tukey double arcsine transformation, only F1 (90.06%) achieved a score above 90%. For the other parameters, the values ranged from 84.78% to 89.45%. Regardless of the transformation used, substantial heterogeneity among studies was observed for all pooled performance measures. The I2 statistic ranged from 95.88% to 99.99%, indicating that nearly all of the observed variability was attributable to true differences between studies rather than sampling errors. Similarly, the τ2 values were high, suggesting a high degree of dispersion in model performance across datasets, populations, and the sensors or characteristics used. Consequently, the pooled estimates should be interpreted with caution and considered primarily as average effects across highly heterogeneous studies.
Table 5 presents the results of statistical normality indicators for each of the two transformations. Regardless of the transformation, the Shapiro–Wilk test was significant for all performance parameters, indicating that the data distribution was not normal. However, for accuracy, specificity, sensitivity, and precision, the logit transformation yielded a distribution closest to normality. The Freeman-Tukey transformation provided a better approximation for only three of the F1 score parameters. Therefore, these results suggest that the logit transformation achieved the best overall model fit.

3.6. Subgroup Analysis: ML vs. DL

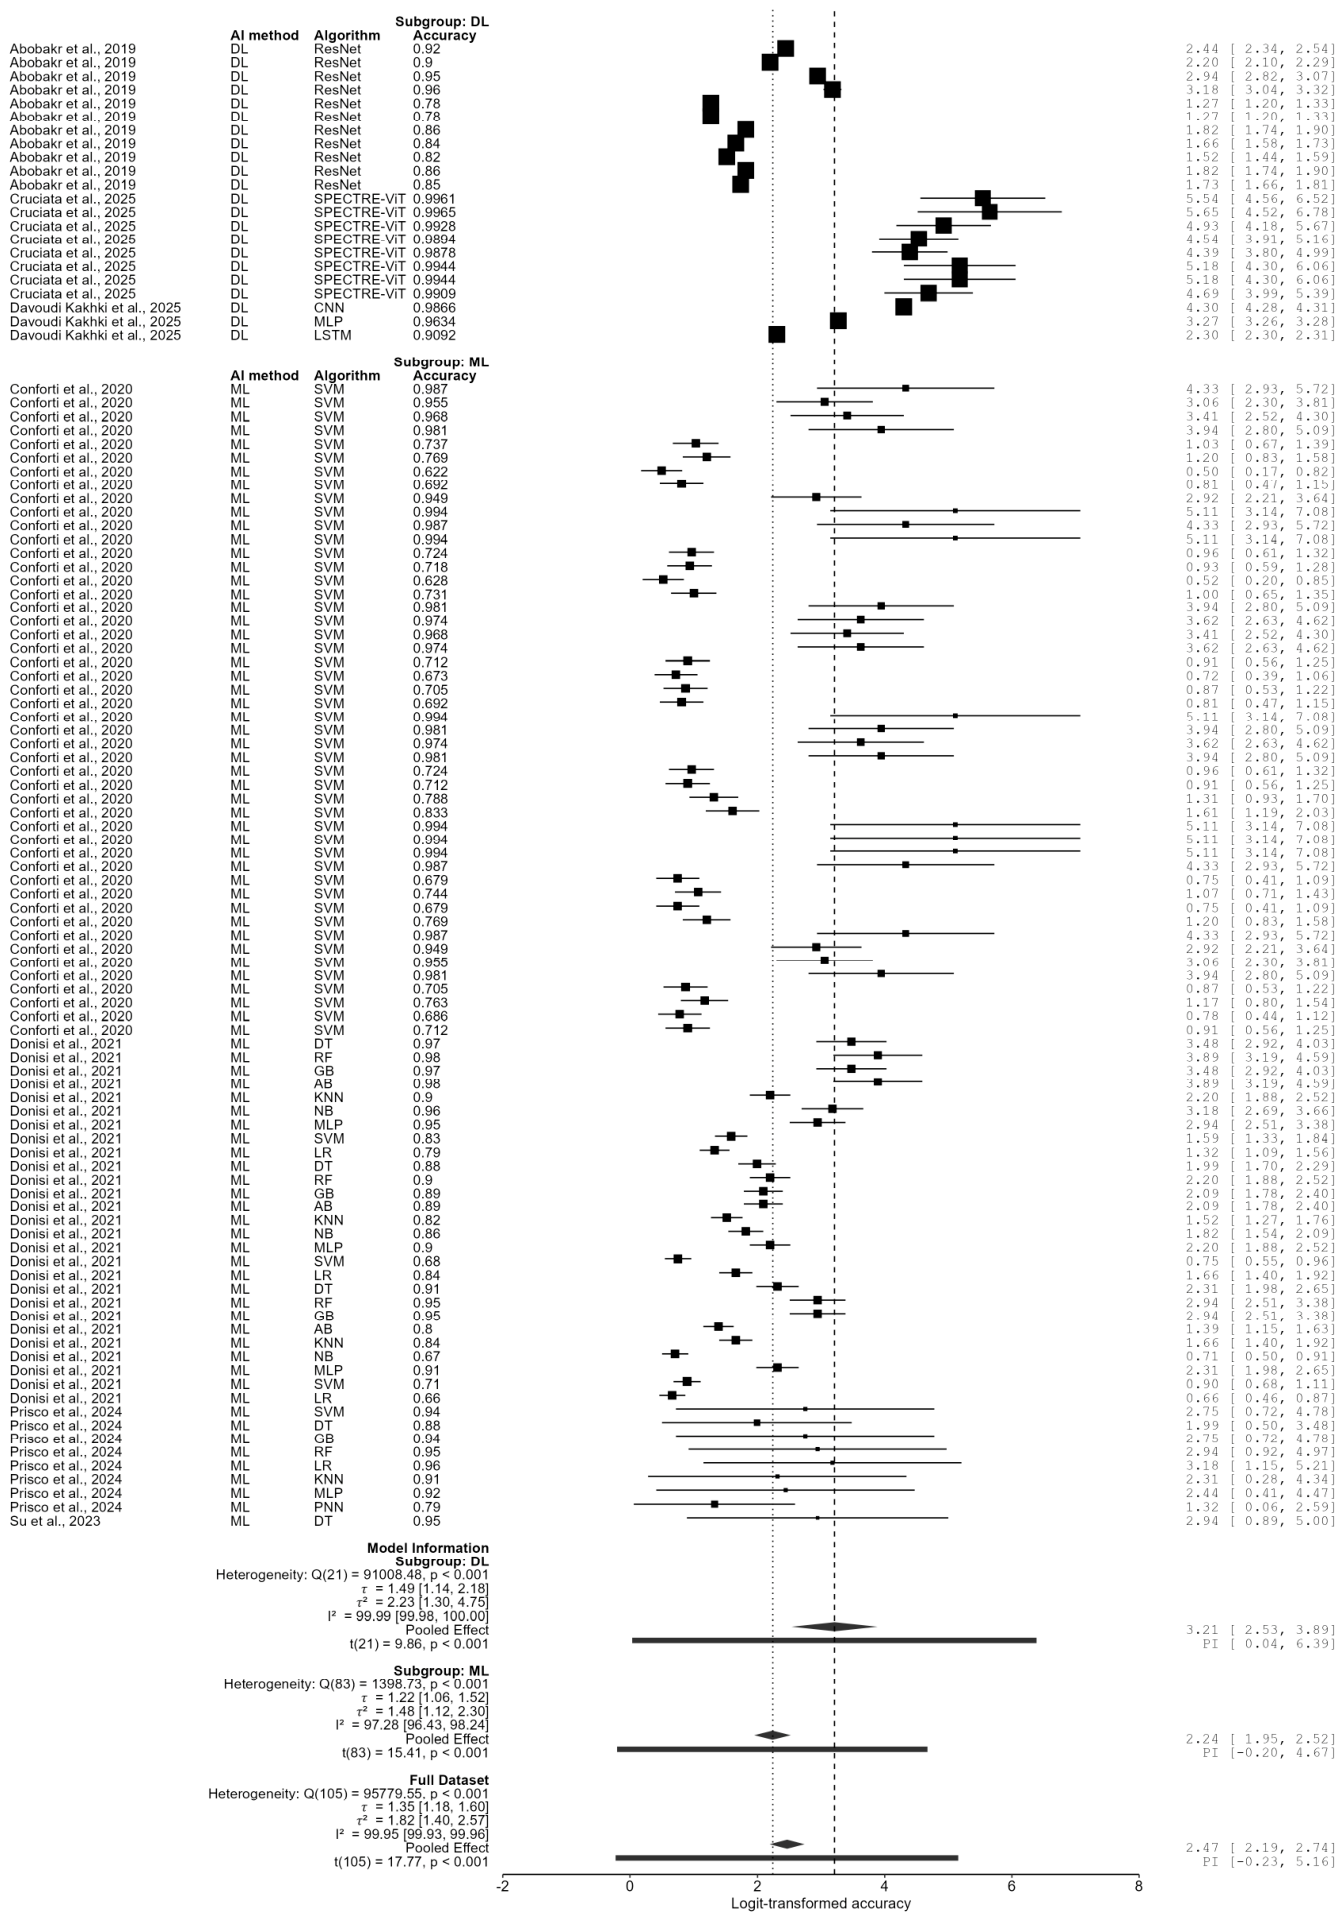
Figure 5 and Figure 6 present the accuracy results after applying each transformation separately for DL and ML. The pooled transformed values for DL were 3.21 (95% CI: 2.53–3.89) with the logit model and 1.33 (95% CI: 1.26–1.39) with the Freeman-Tukey model, corresponding to a back-transformed accuracy of 96.12% (95% CI: 92.62–98.00%) and 94.31% (95% CI: 90.65–96.77%), respectively. For ML, the transformed pooled values were 2.24 (95% CI: 1.95–2.52) with logit and 1.22 (95% CI: 1.18–1.26) with Freeman-Tukey, corresponding to a back-transformed accuracy of 90.38% (87.54–92.55%) and 88.19% (85.49–90.65%), respectively. All results after back-transformation were summarized in Table 6. The analysis revealed a difference in performance between the two AI methods. The values obtained with DL were higher than those with ML for all metrics. However, the magnitude of the difference varies depending on the performance metric and the transformation method. This difference ranged from 5% for accuracy (logit: 5.74%; Freeman-Tukey: 6.12%) to 17% (logit: 16.68%; Freeman-Tukey: 16.40%) for the F1 score, with similar values for both transformations. For sensitivity, the difference between the two transformations was more significant: a difference of 12.16% was observed with logit, whereas it was 16.43% for Freeman-Tukey. A similar trend was observed for precision (logit: 11.64%; Freeman-Tukey: 14.94%). The lack of data for specificity using the DL approach made it impossible to make a comparison. Overall, the performance obtained with the DL approach ranged from 95.43% to 99.18% with logit and from 93.35% to 98.99% with Freeman-Tukey. For ML, they ranged from 78.75% to 90.38% with logit and from 76.95% to 88.19% with Freeman-Tukey. The lowest values were consistently obtained for the F1 score. Despite the subgroup analysis, significant heterogeneity among the studies was observed for all performance metrics (I2 > 95% except for the F1 score, where ML had an I2 between 60% and 70%).

3.7. Subgroup Analysis: Ergonomic Tool Assessment

Ergonomic assessment tools had a significant impact on several performance metrics. The pairwise mixed-effects meta-regression revealed that AI methods based on RULA demonstrated higher accuracy than those based on NIOSH or S vs. U. RULA and REBA exhibited better sensitivity and precision performance than the other two tools. Finally, AI methods using REBA outperformed all other ergonomic tools in terms of F1 score. These effects were observed for both transformations, indicating the robustness of the results. All results are detailed in Appendix A.

3.8. Sensitivity Analysis

The sensitivity analysis, conducted by successively excluding studies one by one, demonstrated the robustness of the results for accuracy, specificity, and F1 score with both transformations. The observed performance variations for the logit and Freeman-Tukey transformations were 1.26% and 1.91% for accuracy, 1.25% and 2.76% for specificity, and 3.93% and 3.29% for the F1 score, respectively. The results of the study by Conforti et al. [52] had a greater impact on the other two parameters. For sensitivity, an increase of 6.48% was observed with the Freeman-Tukey transformation (the variation was only 2.32% with the logit transformation). For precision, the increase was 4.98% and 9.20%, respectively, for the two transformations. These results indicate a notable influence of the performance reported by the authors for these two parameters. Regarding heterogeneity and inter-study variability, the parameters remained very high during the analysis: I2 ranged from 91.25% to 100%, and τ2 ranged from 0.83 to 5.69 for the logit model and from 0.01 to 0.12 for the Freeman-Tukey model.
Furthermore, the performance meta-analyses were conducted by considering all solutions tested and reported in the included studies. This approach introduces a bias stemming from the fact that multiple results were derived from the same dataset; consequently, the data are not statistically independent. To investigate this effect, a second sensitivity analysis was performed, retaining only the best AI method from each included study. The results showed performance improvements of 5–7% for accuracy, 10–12% for specificity, 7–12% for sensitivity, 6–10% for precision, and 4–6% for F1 score. However, heterogeneity remained very high in this analysis (I2 > 65%). The detailed results were presented in Appendix A.

3.9. Publication Bias

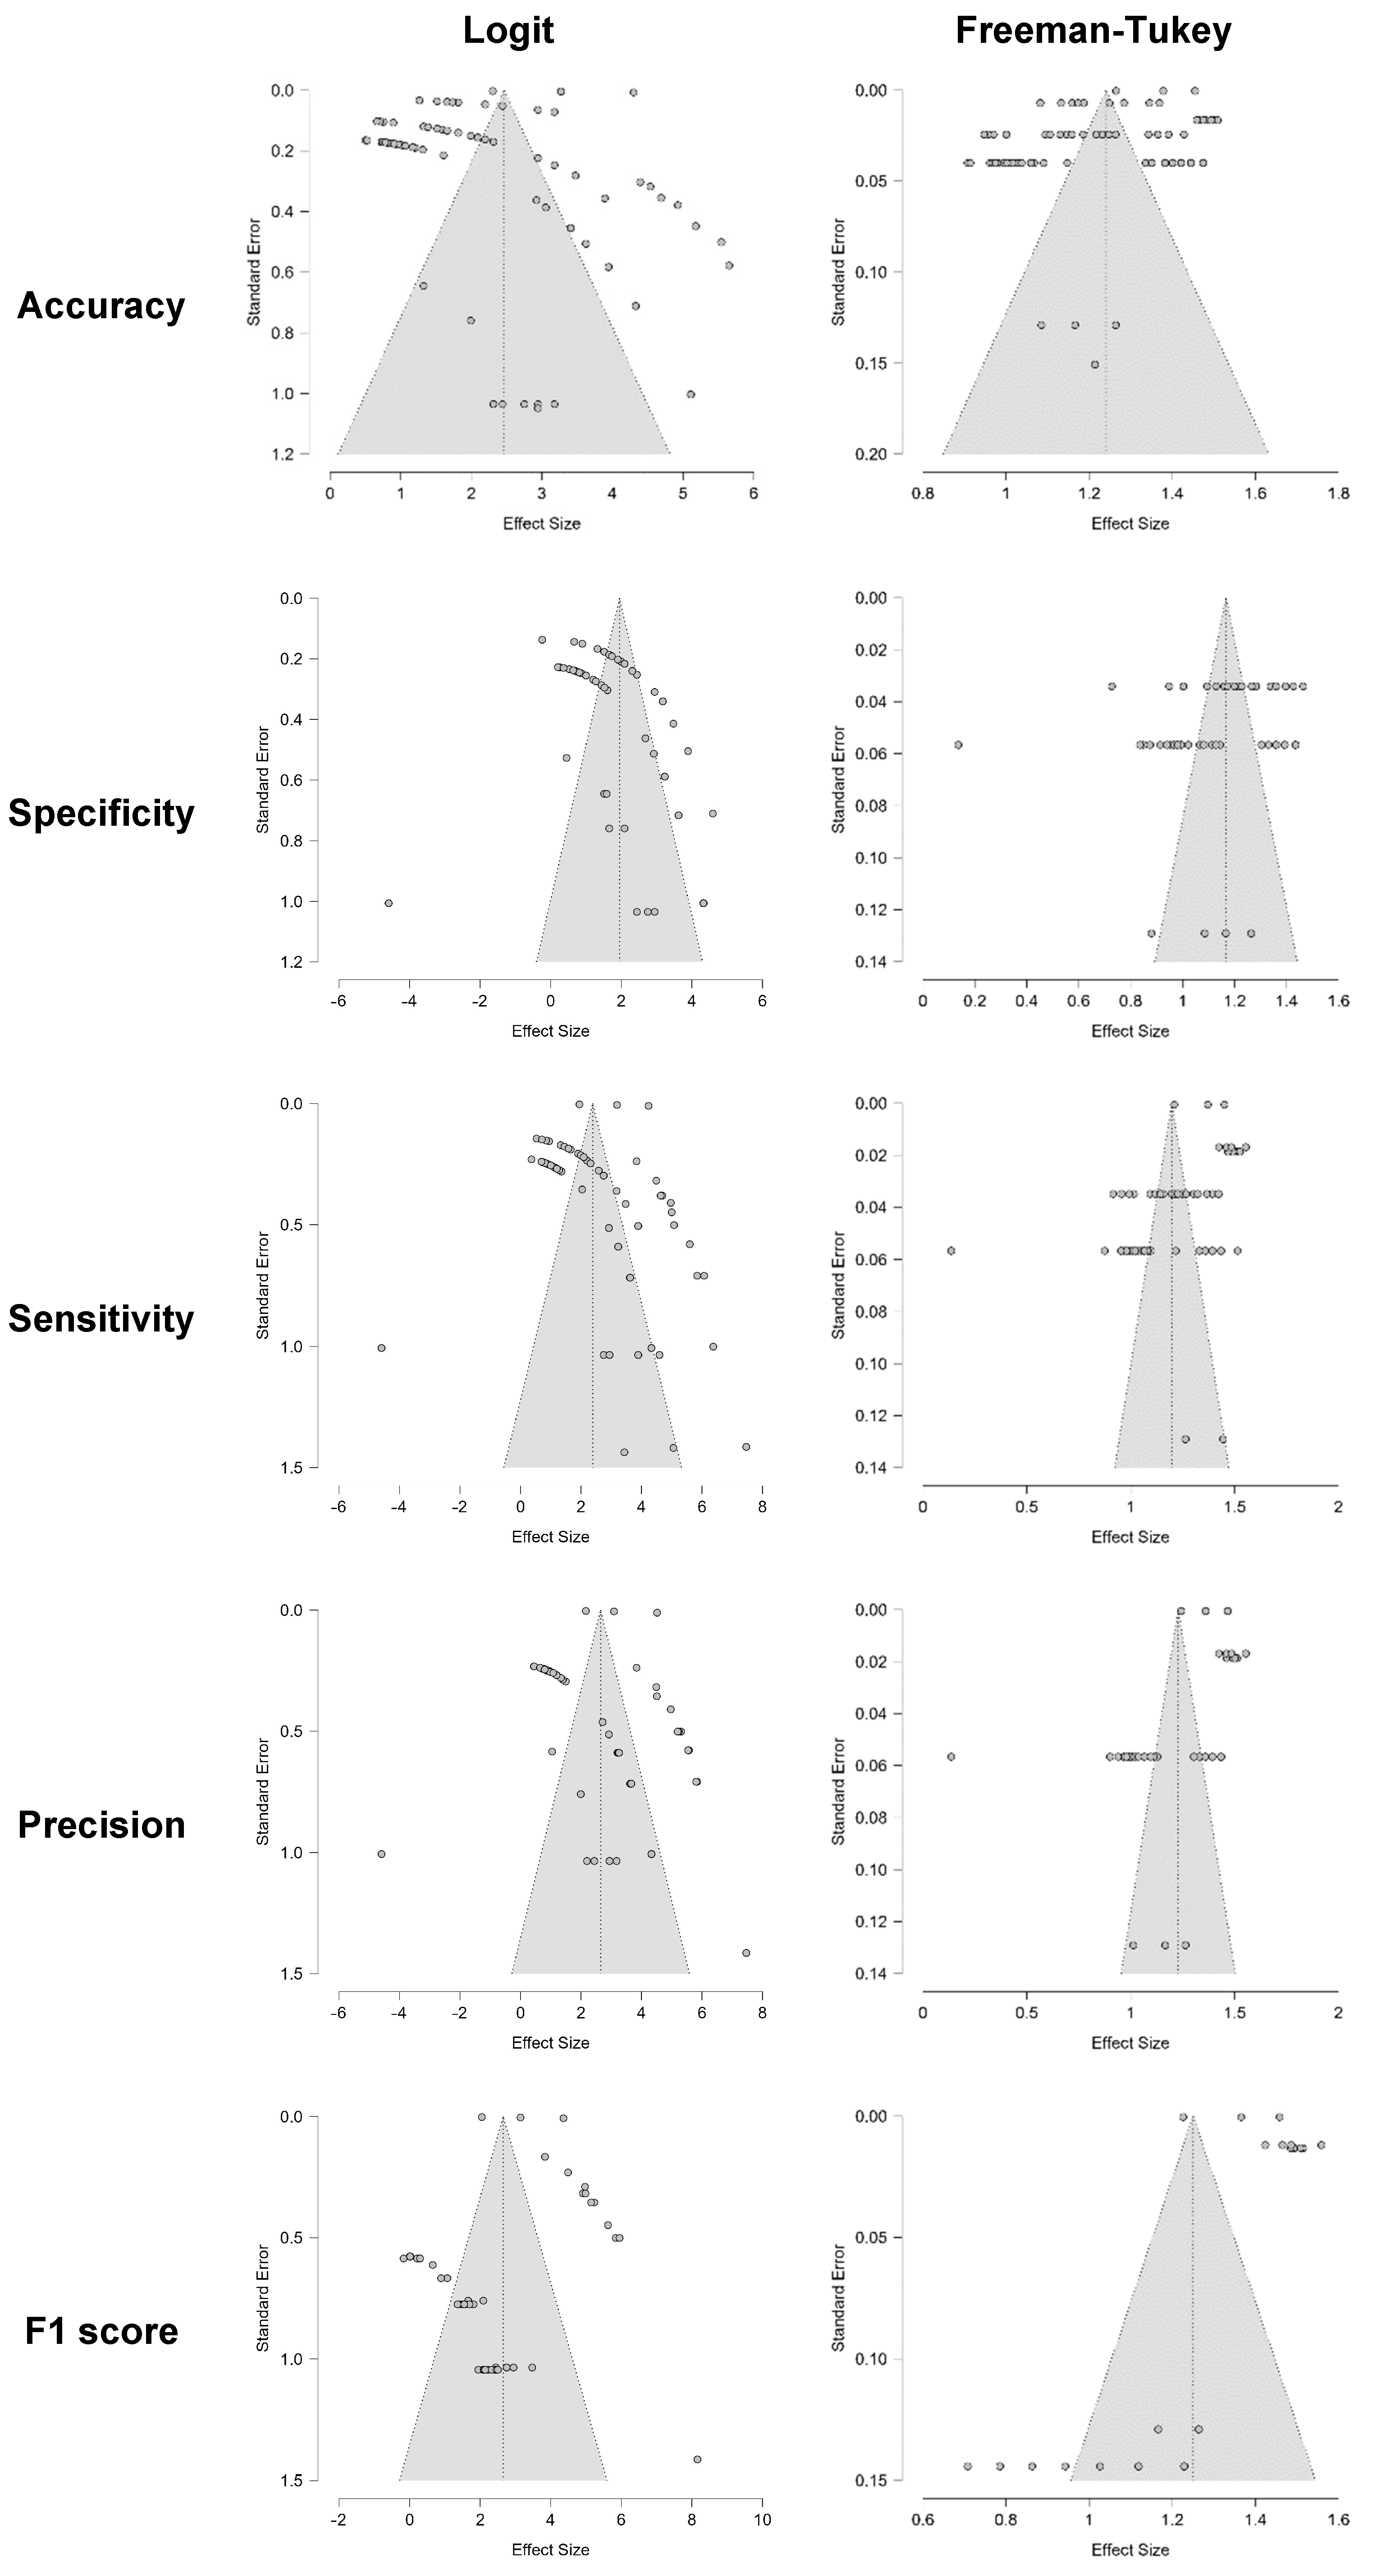
The symmetry of the funnel plots was examined (Figure 7), and Egger’s test was performed for each performance parameter and each transformation. The results were summarized in Table 7. Only specificity with the logit transformation showed asymmetry (t = 5.112; p < 0.001). For the other parameters, Egger’s test was not significant (p > 0.05), suggesting no evidence of publication bias or small-study effects. These results should be interpreted with caution due to the small number of studies included in our meta-analysis.

3.10. Level of Evidence

Accuracy studies of diagnostic tests have a high initial level of evidence. Despite the absence of imprecision and publication bias, several downgrades had to be applied in view of the results obtained for the various GRADE domains. On the one hand, indirectness is a serious concern for both transformation methods. Although the subjects in the datasets performed manufacturing activities, their number was too small, not representative of workers in the industrial sector, and there was often a lack of presentation of participant demographic and anthropometric data. On the other hand, the heterogeneity observed for all parameters was very high (I2 > 95%), reflecting significant between-study variability and thus serious inconsistency. Finally, the PROBAST analysis highlighted a high risk of bias for all included studies. These three points led to three successive downgrades. Thus, the overall level of evidence regarding the performance of posture detection systems in the context of WMSD prevention in manufacturing was judged to be very low for all performance parameters, regardless of the data transformation method. The detailed GRADE analysis is presented in Table A2 for the logit transformation and Table A3 for the Freeman-Tukey transformation.

4. Discussion

The objective of this meta-analysis was to provide an overview of the performance of AI-based methods for recognizing work postures in order to prevent the occurrence of WMSDs in manufacturing. The analysis was based on the results of 10 studies focusing on assembly, handling, and lifting activities performed in both seated and standing positions, using ML and DL approaches.

4.1. Performance Results for WMSD Prediction

The results demonstrated that AI systems are highly accurate in detecting WMSD risk levels based on an analysis of manufacturing workers’ postures. The pooled values for each parameter were approximately 90%. The best results were observed for accuracy and precision. This indicates that the systems are able to generally recognize all situations and produce fewer than 10% false alerts, i.e., indicating a posture as risky when it is not actually the case. Depending on the chosen transformation, the pooled sensitivity ranged from 86% to 91%. This result indicates that 10% to 15% of risky postures were not detected. These false negatives correspond to workers exposed to awkward postures that were incorrectly classified as safe postures. Such errors can prevent interventions and increase the risk of developing WMSDs, especially if the posture is repeated or maintained over a long period. Consequently, maximizing sensitivity is particularly important because it minimizes the number of undetected high-risk postures. This principle is consistent with recommendations in the fields of safety-critical AI and medical AI, where high sensitivity is prioritized because a missed positive case can have serious consequences [63,64]. The poorest results were obtained for specificity (approximately 85% regardless of the transformation). In the context of WMSDs, specificity reflects the system’s ability to correctly identify postures that are truly risk-free, i.e., to avoid false ergonomic alerts. Unlike other fields such as fall detection, for example, where a false alarm unnecessarily alerts caregivers or medical staff [65], these false ergonomic alerts are less problematic because they call for caution and require operators to maintain a high level of attention to avoid high-risk situations.
A comparison of the values derived from the two transformations showed that those obtained using the logit transformation were consistently higher than those obtained using the Freeman-Tukey transformation, with differences ranging from 2.7% to 4.7%. This difference can be explained by the more conservative nature of the Freeman-Tukey transformation, which reduces the influence of extreme proportions close to 1 [33,66]. Indeed, Schwarzer et al. [67] demonstrated that using this transformation “pulls” extreme proportions closer to the mean, and consequently the pooled estimates may become lower than those obtained with the logit transformation, a finding reflected in the results. Furthermore, Dimitrijević et al. [36] demonstrated that the reliability of arcsine-based transformation models depends heavily on the statistical power of the dataset: performance is high when statistical power is sufficient, whereas these models are vulnerable to small sample sizes, a situation encountered in the present study (<30 subjects). Conversely, although the logit tends to exhibit high coverage accuracy for small samples [36], this transformation tends to amplify inter-study variance (τ2 > 1, Table 4 and Table 6).
In any case, the performance differences between the two transformations remain modest, and the results led to the same general conclusions. However, from a methodological standpoint, the logit transformation better satisfies the normality assumptions required for applying random-effects models. Consequently, this transformation is preferable for studying the performance of AI-based posture recognition systems in the context of WMSD prevention.

4.2. Subgroup Analyses for Logit and Freeman-Tukey Transformations

For all parameters, high inter-study heterogeneity was observed. However, this observed variability does not appear to be solely due to differences in sensors, populations, or industrial tasks. Subgroup analyses suggest that the AI method is a major source of heterogeneity. The pairwise mixed-effects meta-regression DL models consistently outperformed conventional ML approaches across all metrics for which a comparison was possible (>5%), with particularly marked differences in sensitivity, precision, and F1-score (>10–15%). The higher performance observed for DL approaches may partly reflect their ability to automatically learn hierarchical representations from raw data, without requiring prior manual feature extraction [68]. In the context of posture analysis, DL directly exploits the spatial information contained in images or human skeletons as well as their temporal relationships during movement [69,70]. Conversely, traditional ML approaches generally rely on a priori-defined biomechanical variables, the quality of which depends heavily on the feature engineering stage [71]. This ability to automatically learn representations is consistent with the better performance observed for DL in detecting postures at risk for WMSDs.
Regarding the effect of the transformation, the performance metrics obtained using the logit transformation were higher than those obtained using the Freeman-Tukey transformation for all parameters, regardless of the AI method. However, the differences observed between the transformations were smaller for the DL approach. The difference ranged from 0.16% (sensitivity) to 2.08% (F1 score), whereas for ML, the differences ranged from 1.8% (F1 score) to 4.43% (sensitivity). This small variation in the subgroup analysis by AI method indicates the robustness of the presented results.
However, it is important to note that comparing performance across AI methods can be influenced by several factors, particularly the dataset used. Indeed, the datasets employed in various studies differ, and it has been shown that their properties—specifically size—affect performance metrics [72]. It therefore seems relevant to conduct further studies comparing these methods under similar conditions (using the same training and test datasets) to substantiate these results.
This meta-regression revealed that AI models based on RULA and REBA achieved better performance than those using NIOSH or simply comparing safe versus unsafe (S vs. U) postures. Indeed, RULA and REBA simultaneously evaluate multiple biomechanical factors—such as joint angles, posture, force, repetition, and muscle activity—thereby capturing a broader representation of WMSD exposure. This result suggests that methods based on a detailed multi-segmental description of posture, based on biomechanically defined thresholds, perform better at identifying at-risk postures across the diverse tasks found in manufacturing. However, these results should be interpreted with caution, as the number of studies varied considerably between ergonomic tools, potentially affecting the statistical power of some pairwise comparisons. Furthermore, although significant differences were observed for several performance metrics, substantial heterogeneity persisted even after accounting for the assessment tool, indicating that other methodological factors likely contribute to the variability observed across studies. A relevant factor that warrants in-depth examination is the posture associated with the task being performed. In the studies included in this meta-analysis, the authors analyzed various activities—such as lifting (with or without load release) and manual handling (loading, pushing, pulling, etc.)—carried out in either a seated or standing position. These different postures can significantly influence detection performance. However, it is currently difficult to obtain results broken down by activity, which complicates an objective analysis of this parameter’s impact on performance.

4.3. Overall Findings and Future Research Directions

Full implementation of PRISMA revealed that, despite high posture recognition performance (>85%), the associated level of evidence remains very low for all parameters, suggesting that caution is warranted and highlighting the need for further studies to confirm these results and ensure transferability to real-world industrial settings. The first area for improvement in future diagnostic test accuracy studies would be to pay particular attention to the database used to train AI methods. It is necessary to have a very large number of subjects with the most varied anthropometric and demographic characteristics and whose professional experience is recognized and quantifiable. AI solutions are highly dependent on the amount of available data, and the size of the dataset has a direct influence on performance levels [72]. The second point concerns the validation procedure, which must be strengthened. Solutions must be tested on independent external datasets, under conditions different from those used during the training phase. It is important that this phase be conducted in situations as close to reality as possible to ensure maximum industrial credibility. The third improvement relates to the significant heterogeneity observed across studies (I2 > 95%). This important point is frequently discussed in meta-analyses, and high inter-study variability is commonly observed in random-effects analyses. Borenstein et al. concluded that the goal is not to eliminate heterogeneity but to understand it [73]. Harrer et al. also addressed this issue, noting that the objective is to explore sources of heterogeneity using moderators rather than viewing heterogeneity as a problem to be eliminated [74]. Meta-regressions and subgroup analyses serve precisely to provide insights into the causes of these variations. Subgroup analysis based on the AI method showed that DL outperformed ML. The analysis regarding ergonomic assessment tools showed that RULA and REBA were also more effective for assessing WMSD risks. However, neither led to a significant reduction in heterogeneity. Similarly, heterogeneity remained significant when only the best AI solution was selected for each included study. Thus, these moderators are insufficient to explain the observed heterogeneity. Other factors—specifically datasets, sensor types, tasks and posture, algorithms, and evaluation protocols—vary significantly across studies and directly impact performance values. Consequently, further subgroup analyses should be conducted to examine the respective effects of these factors on heterogeneity and to combine them in order to better explain its causes. However, such analyses require a large volume of data that is not yet available in the current literature. Under such conditions, pooled performance values should be interpreted very cautiously.
From a practical standpoint, it seems worthwhile to continue developing new solutions aimed at minimizing the false-negative rate in posture recognition—that is, maximizing sensitivity—in order to strengthen the presented results, ensure the detection of all high-risk postures, and thereby protect operators against situations likely to lead to WMSDs.

4.4. Limitations

The first limitation concerns the differences observed in how the risk level for developing WMSDs was defined. Some studies used standardized scales derived from ergonomic tools such as RULA and REBA, while others simply distinguished between a safe and unsafe posture. This difference may account for variability in performance that was not accounted for in the analysis.
The second limitation concerns the wide variety of conditions under which detection system performance was evaluated. Indeed, each study had its own dataset, with differences in the number of subjects, their characteristics, the tasks they performed, and consequently the postures they adopted. This high heterogeneity is likely to affect the measured performance and thus makes comparison difficult.
The third limitation is that the exploration of possible causes of heterogeneity was limited to the AI method and ergonomic assessment tool used. It has been demonstrated that other factors, such as the type of system (wearable, non-wearable, or hybrid) or the type of algorithm, can have a direct impact on detection performance and could be used for future subgroup analyses.
The fourth limitation concerns the number of studies included in the meta-analysis. The small number limits the overall robustness of the results. Increasing this number would strengthen the findings and allow for additional analyses. As it stands, the results of the subgroup analyses and meta-regressions should be interpreted as exploratory, given the limited evidence base.
Similarly, specificity was the least evaluated parameter in the included studies (only three). This small number precluded a comparison between DL and ML, and significant publication bias was identified using Egger’s test for the logit transformation. Consequently, the results regarding this parameter should be interpreted with even greater caution.
The fifth limitation concerns the high risk of bias, particularly due to the lack of external validation of the included studies under real-world conditions. Consequently, the pooled values in this meta-analysis are likely to be optimistic and limit the transfer of these performance figures to actual workplace deployment.
A methodological limitation in the conduct of the meta-analysis should also be noted. First, the analyses were conducted considering all the algorithms proposed in the included studies, which introduced a bias related to the interdependence of the results. Sensitivity analysis showed that this procedure yielded results 5% to 13% lower, but the amount of data limited generalizability. Secondly, the criteria for evaluating detection performance were limited to the five most commonly used metrics directly derived from the confusion matrix (accuracy, specificity, sensitivity, precision, and F1 score). Other metrics exist, such as AUC (Area Under the Curve), which represents an AI system’s ability to correctly distinguish between two classes regardless of the decision threshold used [75]. Although very few of the included studies reported this parameter, taking it into account could have enriched the performance analysis. Finally, the choice of keywords and the restriction to original, peer-reviewed studies written in English may have led to the exclusion of some studies that could have provided additional insights into the results.

5. Conclusions

Posture recognition systems have demonstrated high performance in preventing WMSDs in manufacturing, with the DL approach performing better. Applying logit transformations before data pooling provided performance metrics higher than those of the Freeman-Tukey method. Despite these differences, the overall conclusions remain similar, demonstrating the robustness of the results. However, the level of certainty of the evidence remained very low due to a significant risk of bias in the included studies and the high heterogeneity observed. Consequently, the results should be interpreted with caution, particularly regarding the deployment of the systems in real-world settings. Future primary studies could strengthen training and testing procedures on datasets as well as external validation and should report task-specific performance results to enable more detailed subgroup analyses based on different manufacturing activities. These aspects are essential for enabling effective use in manufacturing environments to ensure operator safety by reducing their exposure to WMSD risks associated with working postures.

Supplementary Materials

The following supporting information can be downloaded at: https://www.mdpi.com/article/10.3390/tae2030016/s1; PRISMA 2020 checklist (S1), PRISMA 2020 for abstract checklist (S2) [32].

Author Contributions

Conceptualization, P.G. and J.J.-B.; Methodology, P.G. and J.J.-B.; Software, P.G. and J.J.-B.; Validation, P.G. and J.J.-B.; Formal Analysis, P.G. and J.J.-B.; Investigation, P.G. and J.J.-B.; Resources, P.G. and J.J.-B.; Data Curation, P.G. and J.J.-B.; Writing—Original Draft Preparation, P.G. and J.J.-B.; Writing—Review and Editing, P.G. and J.J.-B.; Visualization, P.G. and J.J.-B.; Supervision, P.G.; Project Administration, P.G.; Funding Acquisition, P.G. All authors have read and agreed to the published version of the manuscript.

Funding

This research received no external funding.

Institutional Review Board Statement

Not applicable.

Informed Consent Statement

Not applicable.

Data Availability Statement

The raw data supporting the conclusions of this article will be made available by the authors on request.

Conflicts of Interest

The authors declare no conflicts of interest.

Abbreviations

The following abbreviations are used in this manuscript:
AdaBoostAdaptive Boosting
AIArtificial Intelligence
CIConfidence Interval
CNNConvolutional Neural Network
DLDeep Learning
DNNDeep Neural Network
DTDecision Tree
DTASDiagnostic Test Accuracy Study
EMGElectromyography
FNFalse Negative
FPFalse Positive
GBGradient Boosted Tree
GRADEGrade of Recommendations Assessment, Development, and Evaluation
HARHuman Activity Recognition
IMUInertial Measurement Unit
KNNK-Nearest Neighbors
LRLogistic Regression
LSTMLong Short-Term Memory
MLMachine Learning
MLPMultiLayer Perceptron
NANot Available
NBNaïve Bayes Classifier
NIOSHNational Institute for Occupational Safety and Health
OSHAOccupational Safety and Health Administration
OWASOvako Working Posture Analysis System
PNNProbabilistic Neural Network
PRISMAPreferred Reporting Items for Systematic reviews and Meta-Analyses
PROBAST Prediction Model Study Risk of Bias Assessment Tool
REBARapid Entire Body Assessment
RFRandom Forest
RULARapid Upper Limb Assessment
SVMSupport Vector Machine
TNTrue Negative
TPTrue Positive
WMSDsWork-related Musculoskeletal Disorders

Appendix A

Sensitivity Analysis—Performance with Only the Best-Performing Algorithm from Each Study

The following table presents the pooled values based solely on the best AI method reported in each included study for each performance metric.
Table A1. Comparison of pooled values and heterogeneity parameters obtained with each transformation for the five performance parameters, considering only the best algorithm from each study.
ParameterTransformationPooled95% CIτ2I2N
AccuracyLogit97.77%92.78–99.34%1.57399.69%7
Freeman-Tukey96.77%91.61–99.54%0.01399.24%7
SpecificityLogit97.68%54.76–99.93%1.70279.42%3
Freeman-Tukey97.56%80.15–97.82%0.01490.52%3
SensitivityLogit99.11%97.31–99.71%0.50267.55%6
Freeman-Tukey99.18%97.95–99.86%0.00288.35%6
PrecisionLogit99.22%94.53–99.89%1.95994.40%5
Freeman-Tukey99.14%96.25–99.99%0.00696.16%5
F1 scoreLogit97.91%78.38–99.84%5.15099.98%6
Freeman-Tukey96.22%82.41–99.84%0.03899.97%6
95% CI: 95% confidence interval; N: number of algorithms.

Appendix B

Appendix B.1. Detailed GRADE Analysis for Logit Transformation

The following table details the various GRADE categories used to assess the level of evidence for each performance parameter using the logit transformation.

Appendix B.2. Detailed GRADE Analysis for Freeman-Tukey Transformation

The following table details the various GRADE categories used to assess the level of evidence for each performance parameter using the Freeman-Tukey transformation.
Table A2. Detailed GRADE analysis for logit transformation.
Performance ParameterNumber of StudiesCertainty AssessmentEffectOverall Level of Evidence
Study
Design
Publication Bias
(Egger Test)
Indirectness aInconsistency bImprecision cRisk of Bias dnEvent Rate(95% CI)
Accuracy7DTASNot serious
(p = 0.275)
SeriousSerious
(I2 = 99.95%)
Not seriousSerious10692.20%89.93–93.93%Very low
⬤◯◯◯
Specificity3DTASSerious
(p < 0.001)
SeriousSerious
(I2 = 95.88%)
Not seriousSerious8387.54%83.34–90.80%Very low
⬤◯◯◯
Sensitivity6DTASNot serious
(p = 0.866)
SeriousSerious
(I2 = 99.96%)
Not seriousSerious9991.61%87.54–94.37%Very low
⬤◯◯◯
Precision5DTASNot serious
(p = 0.788)
SeriousSerious
(I2 = 99.97%)
Not seriousSerious7293.40%89.57–95.89%Very low
⬤◯◯◯
F1-score6DTASNot serious
(p = 0.452)
SeriousSerious
(I2 = 99.98%)
Not seriousSerious5893.40%89.60–95.89%Very low
⬤◯◯◯
DTAS: Diagnostic test accuracy study; n: number of available data; 95% CI: 95% confidence interval; GRADE overall quality significance: ⬤◯◯◯ = Very low; ⬤⬤◯◯ = Low; ⬤⬤⬤◯ = Moderate; ⬤⬤⬤⬤ = High. a Studied population correspond to the population in study. b Serious if I2 > 50%. c Serious if 95% CI Range Difference > 50% of Event Rate. d Studies have at least a fair critical appraisal score.
Table A3. Detailed GRADE analysis for Freeman-Tukey transformation.
Performance ParameterNumber of StudiesCertainty AssessmentEffectOverall Level of Evidence
Study
Design
Publication Bias
(Egger Test)
Indirectness aInconsistency bImprecision cRisk of Bias dnEvent Rate(95% CI)
Accuracy7DTASNot serious
(p = 0.116)
SeriousSerious
(I2 = 99.97%)
Not seriousSerious10689.45%87.54–91.78%Very low
⬤◯◯◯
Sensitivity3DTASNot serious
(p = 0.227)
SeriousSerious
(I2 = 96.52%)
Not seriousSerious8384.78%80.23–88.19%Very low
⬤◯◯◯
Specificity6DTASNot serious
(p = 0.477)
SeriousSerious
(I2 = 99.98%)
Not seriousSerious9986.87%82.56–90.65%Very low
⬤◯◯◯
Precision5DTASNot serious
(p = 0.748)
SeriousSerious
(I2 = 99.98%)
Not seriousSerious7288.83%84.05–92.32%Very low
⬤◯◯◯
F1-score6DTASNot serious
(p = 0.845)
SeriousSerious
(I2 = 99.99%)
Not seriousSerious5890.06%86.19–93.35%Very low
⬤◯◯◯
DTAS: Diagnostic test accuracy study; n: number of available data; 95% CI: 95% confidence interval; GRADE overall quality significance: ⬤◯◯◯ = Very low; ⬤⬤◯◯ = Low; ⬤⬤⬤◯ = Moderate; ⬤⬤⬤⬤ = High. a Studied population correspond to the population in study. b Serious if I2 > 50%. c Serious if 95% CI Range Difference > 50% of Event Rate. d Studies have at least a fair critical appraisal score.

References

  1. da Costa, B.R.; Vieira, E.R. Risk factors for work-related musculoskeletal disorders: A systematic review of recent longitudinal studies. Am. J. Ind. Med. 2010, 53, 285–323. [Google Scholar] [CrossRef] [Scilit] [PubMed]
  2. Gorce, P.; Jacquier-Bret, J. A systematic review of work-related musculoskeletal disorders among physical therapists and physiotherapists. J. Bodyw. Mov. Ther. 2024, 38, 350–367. [Google Scholar] [CrossRef] [Scilit] [PubMed]
  3. U.S. Bureau of Labor Statistics. Occupational Injuries and Illnesses Resulting in Musculoskeletal Disorders (MSDs). 2020. Available online: https://www.bls.gov/iif/factsheets/msds.htm (accessed on 15 January 2025).
  4. Bevan, S. Economic impact of musculoskeletal disorders (MSDs) on work in Europe. Best. Pract. Res. Clin. Rheumatol. 2015, 29, 356–373. [Google Scholar] [CrossRef] [Scilit] [PubMed]
  5. Kang, D.; Kim, Y.K.; Kim, E.A.; Kim, D.H.; Kim, I.; Kim, H.R.; Min, K.B.; Jung-Choi, K.; Oh, S.S.; Koh, S.B. Prevention of work-related musculoskeletal disorders. Ann. Occup. Environ. Med. 2014, 26, 9–10. [Google Scholar] [CrossRef] [Scilit] [PubMed]
  6. Jacquier-Bret, J.; Gorce, P. Worldwide work-related musculoskeletal disorder prevalence among nurses: Systematic review and meta-analysis. Saf. Sci. 2025, 191, 106970. [Google Scholar] [CrossRef] [Scilit]
  7. Gorce, P.; Jacquier-Bret, J. Global prevalence of musculoskeletal disorders among physiotherapists: A systematic review and meta-analysis. BMC Musculoskelet. Disord. 2023, 24, 265. [Google Scholar] [CrossRef] [Scilit] [PubMed]
  8. Anwar, W.; Rashid, F.A.; Hazari, A.; Kandakurti, P.K. Work-related Musculoskeletal Disorders (WMSDs) and Quality of Life (QoL) among the construction workers in the United Arab Emirates. F1000Research 2025, 14, 80. [Google Scholar] [CrossRef] [Scilit]
  9. Akbar, K.A.; Try, P.; Viwattanakulvanid, P.; Kallawicha, K. Work-Related Musculoskeletal Disorders Among Farmers in the Southeast Asia Region: A Systematic Review. Saf. Health Work 2023, 14, 243–249. [Google Scholar] [CrossRef] [Scilit] [PubMed]
  10. Mohammadian, M.; Mollahoseini, S.; Naghibzadeh-Tahami, A. Musculoskeletal disorders among office workers: Prevalence, ergonomic risk factors, and their interrelationships. Sci. Rep. 2025, 15, 45425. [Google Scholar] [CrossRef] [Scilit] [PubMed]
  11. Sousa dos Santos, M.; dos Santos Silva, J.; de Paula Dias, W.; Silva Nunes, T.; Marques Rodrigues, J.; Awoniyi, A.M.; Cremonese, C. Prevalence of work-related musculoskeletal disorders among beach workers. Front. Public Health 2025, 13, 1701654. [Google Scholar] [CrossRef] [Scilit] [PubMed]
  12. Tahernejad, S.; Hejazi, A.; Rezaei, E.; Makki, F.; Sahebi, A.; Zangiabadi, Z. Musculoskeletal disorders among teachers: A systematic review and meta-analysis. Front. Public Health 2024, 12, 1399552. [Google Scholar] [CrossRef] [Scilit] [PubMed]
  13. He, X.; Xiao, B.; Wu, J.; Chen, C.; Li, W.; Yan, M. Prevalence of work-related musculoskeletal disorders among workers in the automobile manufacturing industry in China: A systematic review and meta-analysis. BMC Public Health 2023, 23, 2042. [Google Scholar] [CrossRef] [Scilit] [PubMed]
  14. Yang, F.; Di, N.; Guo, W.W. The prevalence and risk factors of work-related musculoskeletal disorders among electronics manufacturing workers: A cross-sectional analytical study in China. BMC Public Health 2023, 23, 10. [Google Scholar] [CrossRef] [Scilit] [PubMed]
  15. Lan, Y.; Zhan, X.; Wang, Z.; Jiang, D.; Li, X.; Peng, C. Global prevalence and associated risk factors of work-related musculoskeletal disorders among steelworkers: A systematic review and meta-analysis. Front. Public Health 2026, 14, 718101. [Google Scholar] [CrossRef] [Scilit] [PubMed]
  16. Guerra, B.M.V.; Torti, E.; Marenzi, E.; Schmid, M.; Ramat, S.; Leporati, F.; Danese, G. Ambient assisted living for frail people through human activity recognition: State-of-the-art, challenges and future directions. Front. Neurosci. 2023, 17, 1256682. [Google Scholar] [CrossRef] [Scilit] [PubMed]
  17. Gorce, P.; Jacquier-Bret, J. Fall Detection in Elderly People: A Systematic Review of Ambient Assisted Living and Smart Home-Related Technology Performance. Sensors 2025, 25, 6540. [Google Scholar] [CrossRef] [Scilit] [PubMed]
  18. Sanchez-Comas, A.; Synnes, K.; Hallberg, J. Hardware for Recognition of Human Activities: A Review of Smart Home and AAL Related Technologies. Sensors 2020, 20, 4227. [Google Scholar] [CrossRef] [Scilit] [PubMed]
  19. Qureshi, T.S.; Shahid, M.H.; Farhan, A.A.; Alamri, S. A systematic literature review on human activity recognition using smart devices: Advances, challenges, and future directions. Artif. Intell. Rev. 2025, 58, 276. [Google Scholar] [CrossRef] [Scilit]
  20. McAtamney, L.; Nigel Corlett, E. RULA: A survey method for the investigation of work-related upper limb disorders. Appl. Ergon. 1993, 24, 91–99. [Google Scholar] [CrossRef] [Scilit] [PubMed]
  21. Hignett, S.; McAtamney, L. Rapid entire body assessment (REBA). Appl. Ergon. 2000, 3, 201–205. [Google Scholar] [CrossRef] [Scilit] [PubMed]
  22. Karhu, O.; Kansi, P.; Kuorinka, I. Correcting working postures in industry: A practical method for analysis. Appl. Ergon. 1977, 8, 199–201. [Google Scholar] [CrossRef] [Scilit] [PubMed]
  23. Waters, T.R.; Putz-Anderson, V.; Garg, A. Applications Manual for the Revised NIOSH Lifting Equation; DHHS (NIOSH) Publication No. 94-110 (Revised 9/2021); U.S. Department of Health and Human Services, Centers for Disease Control and Prevention, National Institute for Occupational Safety and Health: Cincinnati, OH, USA, 1994. [CrossRef] [Scilit]
  24. Prisco, G.; Romano, M.; Esposito, F.; Cesarelli, M.; Santone, A.; Donisi, L. Capability of Machine Learning Algorithms to Classify Safe and Unsafe Postures during Weight Lifting Tasks Using Inertial Sensors. Diagnostics 2024, 14, 576. [Google Scholar] [CrossRef] [Scilit] [PubMed]
  25. Villalobos, A.; Mac Cawley, A. Prediction of slaughterhouse workers’ RULA scores and knife edge using low-cost inertial measurement sensor units and machine learning algorithms. Appl. Ergon. 2022, 98, 103556. [Google Scholar] [CrossRef] [Scilit] [PubMed]
  26. Wang, J.; Chen, D.; Zhu, M.; Sun, Y. Risk assessment for musculoskeletal disorders based on the characteristics of work posture. Autom. Constr. 2021, 131, 103921. [Google Scholar] [CrossRef] [Scilit]
  27. Rainio, O.; Teuho, J.; Klén, R. Evaluation metrics and statistical tests for machine learning. Sci. Rep. 2024, 14, 6086. [Google Scholar] [CrossRef] [Scilit] [PubMed]
  28. Shakerian, M.; Barakat, S.; Saber, E. Risk Management of Work-Related Musculoskeletal Disorders Using an Artificial Intelligence Approach (Narrative Review). J. Occup. Health Epidemiol. 2025, 14, 214–225. [Google Scholar] [CrossRef] [Scilit]
  29. Yang, Z.; Song, Z.; Ning, D.; Wu, Z. A Systematic Review: Advancing Ergonomic Posture Risk Assessment Through the Integration of Computer Vision and Machine Learning Techniques. IEEE Access 2024, 12, 180481–180519. [Google Scholar] [CrossRef] [Scilit]
  30. Donisi, L.; Cesarelli, G.; Pisani, N.; Ponsiglione, A.M.; Ricciardi, C.; Capodaglio, E. Wearable Sensors and Artificial Intelligence for Physical Ergonomics: A Systematic Review of Literature. Diagnostics 2022, 12, 3048. [Google Scholar] [CrossRef] [Scilit] [PubMed]
  31. Gorce, P.; Jacquier-Bret, J. Current Trends in Artificial Intelligence for Recognizing Work Postures to Prevent Work-Related Musculoskeletal Disorders: Systematic Review and Meta-Analysis by Occupational Activity. Bioengineering 2026, 13, 298. [Google Scholar] [CrossRef] [Scilit] [PubMed]
  32. Page, M.J.; McKenzie, J.E.; Bossuyt, P.M.; Boutron, I.; Hoffmann, T.C.; Mulrow, C.D.; Shamseer, L.; Tetzlaff, J.M.; Akl, E.A.; Brennan, S.E.; et al. The PRISMA 2020 statement: An updated guideline for reporting systematic reviews. BMJ 2021, 372, n71. [Google Scholar] [CrossRef] [Scilit] [PubMed]
  33. Barendregt, J.J.; Doi, S.A.; Lee, Y.Y. Meta-analysis of prevalence. J. Epidemiol. Community Health 2013, 67, 974–978. [Google Scholar] [CrossRef] [Scilit] [PubMed]
  34. Seiffert, S.; Weber, S.; Sack, U.; Keller, T. Use of logit transformation within statistical analyses of experimental results obtained as proportions: Example of method validation experiments and EQA in flow cytometry. Front. Mol. Biosci. 2024, 11, 1335174. [Google Scholar] [CrossRef] [Scilit] [PubMed]
  35. Freeman, M.F.; Tukey, J.W. Transformations related to the angular and the square root. Ann. Math. Stat. 1950, 21, 607–611. [Google Scholar] [CrossRef] [Scilit]
  36. Dimitrijević, V.; Rašković, B.; Popović, M.; Drid, P.; Obradović, B. Comparative Mathematical Evaluation of Models in the Meta-Analysis of Proportions: Evidence from Neck, Shoulder, and Back Pain in the Population of Computer Vision Syndrome. Mathematics 2026, 14, 556. [Google Scholar] [CrossRef] [Scilit]
  37. Gorce, P.; Jacquier-Bret, J. Current Trends in AI Gait Analysis for the Detection and Assessment of Parkinson’s Dis-ease Severity: Systematic Review and Meta-Analysis of Performance Using Logit Transformation. Healthcare 2026, 14, 1820. [Google Scholar] [CrossRef] [Scilit] [PubMed]
  38. Wolff, R.F.; Moons, K.G.M.; Riley, R.D.; Whiting, P.F.; Westwood, M.; Collins, G.S.; Reitsma, J.B.; Kleijnen, J.; Mallett, S.; PROBAST Group. PROBAST: A Tool to Assess the Risk of Bias and Applicability of Prediction Model Studies. Ann. Intern. Med. 2019, 170, 51–58. [Google Scholar] [CrossRef] [Scilit] [PubMed]
  39. McGuinness, L.A.; Higgins, J.P.T. Risk-of-bias VISualization (robvis): An R package and Shiny web app for visualizing risk-of-bias assessments. Res. Synth. Methods 2021, 12, 55–61. [Google Scholar] [CrossRef] [Scilit] [PubMed]
  40. Steyerberg, E.W.; Vergouwe, Y. Towards better clinical prediction models: Seven steps for development and an ABCD for validation. Eur. Heart J. 2014, 35, 1925–1931. [Google Scholar] [CrossRef] [Scilit] [PubMed]
  41. Haldane, J.B.S. The mean and variance of the moments of w2, when used as a test of homogeneity, when expectations are small. Biometrika 1940, 29, 133–143. [Google Scholar]
  42. Anscombe, F.J. On estimating binomial response relations. Biometrika 1956, 43, 461–464. [Google Scholar] [CrossRef] [Scilit]
  43. Shapiro, S.S.; Wilk, M.B. An Analysis of Variance Test for Normality (Complete Samples). Biometrika 1955, 52, 591–611. [Google Scholar] [CrossRef] [Scilit]
  44. Kim, H.Y. Statistical notes for clinical researchers: Assessing normal distribution (2) using skewness and kurtosis. Restor. Dent. Endod. 2013, 38, 52–54. [Google Scholar] [CrossRef] [Scilit] [PubMed]
  45. Cochrane Training. Cochrane Handbook for Systematic Reviews of Interventions. Available online: https://training.cochrane.org/handbook/archive/v6/chapter-10#section-10-10-2 (accessed on 2 February 2022).
  46. Egger, M.; Smith, G.D.; Schneider, M.; Minder, C. Bias in meta-analysis detected by a simple, graphical test. BMJ 1997, 315, 629–634. [Google Scholar] [CrossRef] [Scilit] [PubMed]
  47. Guyatt, G.; Oxman, A.D.; Akl, E.A.; Kunz, R.; Vist, G.; Brozek, J.; Norris, S.; Falck-Ytter, Y.; Glasziou, P.; DeBeer, H.; et al. GRADE guidelines: 1. Introduction-GRADE evidence profiles and summary of findings tables. J. Clin. Epidemiol. 2011, 64, 383–394. [Google Scholar] [CrossRef] [Scilit] [PubMed]
  48. Harris, J.D.; Quatman, C.E.; Manring, M.M.; Siston, R.A.; Flanigan, D.C. How to Write a Systematic Review. Am. J. Sports Med. 2014, 42, 2761–2768. [Google Scholar] [CrossRef] [Scilit] [PubMed]
  49. Moher, D.; Liberati, A.; Tetzlaff, J.; Altman, D.G. Preferred reporting items for systematic reviews and meta-analyses: The PRISMA statement. PLoS Med. 2009, 6, 1006–1012. [Google Scholar] [CrossRef] [Scilit] [PubMed]
  50. Abobakr, A.; Nahavandi, D.; Hossny, M.; Iskander, J.; Attia, M.; Nahavandi, S.; Smets, M. RGB-D ergonomic assessment system of adopted working postures. Appl. Ergon. 2019, 80, 75–88. [Google Scholar] [CrossRef] [Scilit] [PubMed]
  51. Cruciata, L.; Contino, S.; Ciccarelli, M.; Pirrone, R.; Mostarda, L.; Papetti, A.; Piangerelli, M. Lightweight Vision Transformer for Frame-Level Ergonomic Posture Classification in Industrial Workflows. Sensors 2025, 25, 4750. [Google Scholar] [CrossRef] [Scilit] [PubMed]
  52. Conforti, I.; Mileti, I.; Del Prete, Z.; Palermo, E. Measuring biomechanical risk in lifting load tasks through wearable system and machine-learning approach. Sensors 2020, 20, 1557. [Google Scholar] [CrossRef] [Scilit] [PubMed]
  53. Davoudi Kakhki, F.; Vora, H.; Moghadam, A. Biomechanical Risk Classification in Repetitive Lifting Using Multi-Sensor Electromyography Data, Revised National Institute for Occupational Safety and Health Lifting Equation, and Deep Learning. Biosensors 2025, 15, 84. [Google Scholar] [CrossRef] [Scilit] [PubMed]
  54. Donisi, L.; Cesarelli, G.; Coccia, A.; Panigazzi, M.; Capodaglio, E.M.; D’Addio, G. Work-related risk assessment according to the revised NIOSH lifting equation: A preliminary study using a wearable inertial sensor and machine learning. Sensors 2021, 21, 2593. [Google Scholar] [CrossRef] [Scilit] [PubMed]
  55. Huang, K.; Jia, G.; Wang, Q.; Cai, Y.; Zhong, Z.; Jiao, Z. Spatial relationship-aware rapid entire body fuzzy assessment method for prevention of work-related musculoskeletal disorders. Appl. Ergon. 2024, 115, 104176. [Google Scholar] [CrossRef] [Scilit] [PubMed]
  56. Mudiyanselage, S.E.; Nguyen, P.H.D.; Rajabi, M.S.; Akhavian, R. Automated workers’ ergonomic risk assessment in manual material handling using sEMG wearable sensors and machine learning. Electronics 2021, 10, 2558. [Google Scholar] [CrossRef] [Scilit]
  57. Matos, L.M.; Dias, P.; Matta, A.; Machado, D.; Sampaio, R.; Pilastri, A.; Cortez, P. Proactive prevention of work-related musculoskeletal disor ders using a motion capture system and time series machine learning. Eng. Appl. Artif. Intell. 2024, 138, 109353. [Google Scholar] [CrossRef] [Scilit]
  58. Su, J.M.; Chang, J.H.; Indrayani, N.L.D.; Wang, C.J. Machine learning approach to determine the decision rules in ergonomic assessment of working posture in sewing machine operators. J. Saf. Res. 2023, 87, 15–26. [Google Scholar] [CrossRef] [Scilit] [PubMed]
  59. Senjaya, W.F.; Yahya, B.N.; Lee, S.L. Ergonomic risk level prediction framework for multiclass imbalanced data. Comput. Ind. Eng. 2023, 184, 109556. [Google Scholar] [CrossRef] [Scilit]
  60. Nath, N.D.; Chaspari, T.; Behzadan, A.H. Automated ergonomic risk monitoring using body-mounted sensors and machine learning. Adv. Eng. Informat. 2018, 38, 514–526. [Google Scholar] [CrossRef] [Scilit]
  61. Vabalas, A.; Gowen, E.; Poliakoff, E.; Casson, A.J. Machine learning algorithm validation with a limited sample size. PLoS ONE 2019, 14, e0224365. [Google Scholar] [CrossRef] [Scilit] [PubMed]
  62. Riley, R.D.; Debray, T.P.A.; Collins, G.S.; Archer, L.; Ensor, J.; van Smeden, M.; Snell, K.I.E. Minimum sample size for external validation of a clinical prediction model with a binary outcome. Stat. Med. 2021, 40, 4230–4251. [Google Scholar] [CrossRef] [Scilit] [PubMed]
  63. Parikh, R.; Mathai, A.; Parikh, S.; Chandra Sekhar, G.; Thomas, R. Understanding and using sensitivity, specificity and predictive values. Indian J. Ophthalmol. 2008, 56, 45–50. [Google Scholar] [CrossRef] [Scilit] [PubMed]
  64. Narteni, S.; Orani, V.; Vaccari, I.; Cambiaso, E.; Mongelli, M. Sensitivity of Logic Learning Machine for Reliability in Safety-Critical Systems. IEEE Intell. Syst. 2022, 37, 66–74. [Google Scholar] [CrossRef] [Scilit]
  65. Kangas, M.; Korpelainen, R.; Vikman, I.; Nyberg, L.; Jämsä, T. Sensitivity and False Alarm Rate of a Fall Sensor in Long-Term Fall Detection in the Elderly. Gerontology 2014, 61, 61–68. [Google Scholar] [CrossRef] [Scilit] [PubMed]
  66. Lin, L.; Xu, C. Arcsine-based transformations for meta-analysis of proportions: Pros, cons, and alternatives. Health Sci. Rep. 2020, 3, e178. [Google Scholar] [CrossRef] [Scilit] [PubMed]
  67. Schwarzer, G.; Chemaitelly, H.; Abu-Raddad, L.J.; Rücker, G. Seriously misleading results using inverse of Freeman-Tukey double arcsine transformation in meta-analysis of single proportions. Res. Synth. Methods 2019, 10, 476–483. [Google Scholar] [CrossRef] [Scilit] [PubMed]
  68. LeCun, Y.; Bengio, Y.; Hinton, G. Deep learning. Nature 2015, 521, 436–444. [Google Scholar] [CrossRef] [Scilit] [PubMed]
  69. Krizhevsky, A.; Sutskever, I.; Hinton, G.E. ImageNet classification with deep convolutional neural networks. Commun. ACM 2017, 60, 84–90. [Google Scholar] [CrossRef] [Scilit]
  70. Donahue, J.; Hendricks, L.A.; Guadarrama, S.; Rohrbach, M.; Venugopalan, S.; Darrell, T.; Saenko, K. Long-term recurrent convolutional networks for visual recognition and description. In Proceedings of the 2015 IEEE Conference on Computer Vision and Pattern Recognition (CVPR), Boston, MA, USA, 7–12 June 2015; IEEE: New York, NY, USA, 2015; pp. 2625–2634. [Google Scholar] [CrossRef] [Scilit]
  71. Wang, J.; Chen, Y.; Hao, S.; Peng, X.; Hu, L. Deep Learning for Sensor-based Activity Recognition: A Survey. Pattern Recognit. Letters 2019, 119, 3–11. [Google Scholar] [CrossRef] [Scilit]
  72. Althnian, A.; AlSaeed, D.; Al-Baity, H.; Samha, A.; Dris, A.B.; Alzakari, N.; Abou Elwafa, A.; Kurdi, H. Impact of Dataset Size on Classification Performance: An Empirical Evaluation in the Medical Domain. Appl. Sci. 2021, 11, 796. [Google Scholar] [CrossRef] [Scilit]
  73. Borenstein, M.; Hedges, L.V.; Higgins, J.P.T.; Rothstein, H.R. Introduction to Meta-Analysis; John Wiley & Sons: Chichester, UK, 2009. [Google Scholar]
  74. Harrer, M.; Cuijpers, P.; Furukawa, T.A.; Ebert, D.D. Doing Meta-Analysis with R: A Hands-On Guide; Chapman & Hall/CRC Press: Boca Raton, FL, USA, 2021. [Google Scholar]
  75. Fawcett, T. An Introduction to ROC Analysis. Pattern Recognit. Lett. 2006, 27, 861–874. [Google Scholar] [CrossRef] [Scilit]
Figure 1. PRISMA flow diagram.
Tae 02 00016 g001
Figure 2. Traffic-light plot of the risk of bias. References [24,50,51,52,53,54,55,57,58,59].
Tae 02 00016 g002
Figure 3. Forest plot of logit-transformed accuracy pooled across all studies. Each square represents the logit-transformed accuracy of one algorithm and its size is proportional to its statistical weight. The horizontal bars represent the 95% confidence intervals. The diamond at the bottom represents the overall pooled accuracy. The number in parentheses in the Q and t statistics represents the degrees of freedom (df) of the test, with df = N − 1. References [24,50,51,52,53,54,58].
Tae 02 00016 g003
Figure 4. Forest plot of double arcsin-transformed accuracy pooled across all studies. Each square represents the double arcsin-transformed accuracy of one algorithm and its size is proportional to its statistical weight. The horizontal bars represent the 95% confidence intervals. The diamond at the bottom represents the overall pooled accuracy. The number in parentheses in the Q and t statistics represents the degrees of freedom (df) of the test, with df = N − 1. References [24,50,51,52,53,54,58].
Tae 02 00016 g004
Figure 5. Forest plot of logit-transformed accuracy pooled across all studies separately for ML and DL. Each square represents the logit-transformed accuracy of one algorithm and its size is proportional to its statistical weight. The horizontal bars represent the 95% confidence intervals. The diamond at the bottom represents the overall pooled accuracy for DL, ML, and across all studies, respectively. The number in parentheses in the Q and t statistics represents the degrees of freedom (df) of the test, with df = N − 1. References [24,50,51,52,53,54,58].
Tae 02 00016 g005
Figure 6. Forest plot of double arcsin-transformed accuracy pooled across all studies separately for ML and DL. Each square represents the double arcsin-transformed accuracy of one algorithm and its size is proportional to its statistical weight. The horizontal bars represent the 95% confidence intervals. The diamond at the bottom represents the overall pooled accuracy for DL, ML, and across all studies, respectively. The number in parentheses in the Q and t statistics represents the degrees of freedom (df) of the test, with df = N − 1. References [24,50,51,52,53,54,58].
Tae 02 00016 g006
Figure 7. Funnel plot for each performance parameter with the two transformations.
Tae 02 00016 g007
Table 1. Keyword combination for each database.
DatabaseKeyword Combinations
PubMed/Medline
Google Scholar
IEEE Xplore
posture AND (“artificial intelligence” OR AI) AND (“work-related musculoskeletal disorders” OR “WMSDs”) AND accuracy AND precision AND (“F1 score” OR F1-score) AND specificity AND sensitivity AND manufacturing
ScienceDirectposture AND AI AND WMSD AND accuracy AND precision AND F1-score AND specificity AND sensitivity AND manufacturing
Table 2. Detailed presentation of the characteristics of the included studies.
AuthorsTaskPostureWMSD AssessmentData Acquisition MethodSensors’ Positions on BodyNumber of Subjects TestedMethodAlgorithms
Abobakr et al., 2019 [50]HandlingStandingRULAIMU, depth, and RGB camera-6DLResNet
Conforti et al., 2020 [52]Lifting and releasingStandingSafe vs. unsafe postureIMUSternum, Pelvis, Thigh, Shank, Foot26MLSVM
Cruciata et al., 2025 [51]Handling, assembly, and quality controlStandingRULAIMU, RGB cameraFull bodyNADLSPECTRE-ViT
Davoudi Kakhki et al., 2025 [53]LiftingStandingRisk vs. no risk from NIOSHEMGLeft and right deltoid, levator scapulae, biceps brachii, flexor carpi radialis25 DLCNN, MLP, LSTM
Donisi et al., 2021 [54]LiftingStandingRisk vs. no risk from NIOSHIMUWaist7MLDT, RF, GB, AdaBoost, KNN, NB, MLP, SVM, LR
Huang et al., 2024 [55]LiftingStandingREBACamera-26DLCNN
Matos et al., 2024 [57]Seated during work on textile machinesSittingRULAOptoelectronic motion capture system-12MLSVM, NB
Mudiyanselage et al., 2021 [56]LiftingStandingNIOSHEMGThoracic and lumbar extensor muscles1MLDT, SVM, KNN, RF
Nath et al., 2018 [60]Load, push, lift, inspect, pull, unloadStandingOSHASmartphonesArm, Waist2MLSVM
Prisco et al., 2024 [24]LiftingStandingSafe vs. unsafe postureIMUChest15MLSVM, DT, GB, RF, LR, KNN, MLP, PNN
Senjaya et al., 2023 [59]Assembly activitiesStandingRULACamera, Leap Motion-12DLDNN, Bi-LSTM, CNN, HBU, HyNet
Su et al., 2023 [58]Seated during work on textile machinesSittingREBACamera-11MLDT
AdaBoost: Adaptive Boosting; CNN: Convolutional Neural Network; DL: Deep Learning; DNN: Deep Neural Network; DT: Decision Tree; EMG: Electromyography; GB: Gradient Boosted Tree; HBU: Hybrid Network of Bi-LSTM and Unidirectional LSTM; IMU: Inertial Measurement Unit; KNN: K-Nearest Neighbors; LR: Logistic Regression; LSTM: Long Short-Term Memory; ML: Machine Learning; MLP: MultiLayer Perceptron; NA: Not available; NB: Naïve Bayes Classifier; NIOSH: National Institute for Occupational Safety and Health; OSHA: Occupational Safety and Health Administration; PNN: Probabilistic Neural Network; REBA: Rapid Entire Body Assessment; RF: Random Forest; RULA: Rapid Upper Limb Assessment; SVM: Support Vector Machine; WMSD: Work-related musculoskeletal disorder.
Table 3. Performance parameters reported in each included study.
AuthorsAccuracySpecificitySensitivityPrecisionF1 Score
Abobakr et al., 2019 [50]X
Conforti et al., 2020 [52]XXXX
Cruciata et al., 2025 [51]X XXX
Davoudi Kakhki et al., 2025 [53]X XXX
Donisi et al., 2021 [54]XXX
Huang et al., 2024 [55] XXX
Matos et al., 2024 [57] X
Mudiyanselage et al., 2021 [56]X
Nath et al., 2018 [60]X XXX
Prisco et al., 2024 [24]XXXXX
Senjaya et al., 2023 [59] X
Su et al., 2023 [58]X
Table 4. Comparison of pooled values and heterogeneity parameters obtained with each transformation for the five performance parameters.
ParameterTransformationPooled95% CIτ2I2N
AccuracyLogit92.20%89.93–93.93%1.8299.95%106
Freeman-Tukey89.45%87.54–91.78%0.0399.97%106
SpecificityLogit87.54%83.34–90.80%1.8795.88%83
Freeman-Tukey84.78%80.23–88.19%0.0696.52%83
SensitivityLogit91.61%87.54–94.37%4.0299.96%99
Freeman-Tukey86.87%82.56–90.65%0.0999.98%99
PrecisionLogit93.40%89.57–95.89%3.9199.97%72
Freeman-Tukey88.83%84.05–92.32%0.0799.98%72
F1 scoreLogit93.40%89.66–95.89%3.0099.98%58
Freeman-Tukey90.06%86.19–93.35%0.0499.99%58
95% CI: 95% confidence interval; N: number of algorithms.
Table 5. Statistical comparison of Logit and Freeman–Tukey normality parameters.
ParameterCriterionLogitFreeman-TukeyPreferred Transformation
AccuracyShapiro–Wilk W0.9420.933Logit
Shapiro–Wilk p<0.05<0.05-
Skewness0.316−0.188Freeman-Tukey
Kurtosis−1.076−1.290Logit
SpecificityShapiro–Wilk W0.9100.816Logit
Shapiro–Wilk p<0.05<0.05-
Skewness−0.895−1.984Logit
Kurtosis1.9676.530Logit
SensitivityShapiro–Wilk W0.9080.763Logit
Shapiro–Wilk p<0.05<0.05-
Skewness−0.962−2.116Logit
Kurtosis2.0295.218Logit
PrecisionShapiro–Wilk W0.9270.791Logit
Shapiro–Wilk p<0.05<0.05
Skewness−0.646−1.987Logit
Kurtosis1.1766.039Logit
F1 scoreShapiro–Wilk W0.9230.933Freeman-Tukey
Shapiro–Wilk p<0.05<0.05-
Skewness0.730−0.228Freeman-Tukey
Kurtosis−0.060−0.374Logit
Table 6. Subgroup analysis—effect of AI method. Comparison of pooled values and heterogeneity parameters obtained with each transformation for the five performance parameters separately for ML and DL.
ParameterAI MethodTransformationPooled95% CIτ2I2N
AccuracyDLLogit96.12% *92.62–98.00%2.2399.99%22
Freeman-Tukey94.31% *90.65–96.77%0.0299.99%22
MLLogit90.38%87.54–92.55%1.4897.28%84
Freeman-Tukey88.19%85.49–90.65%0.0396.62%84
SpecificityDLLogit-----
Freeman-Tukey-----
MLLogit87.54%83.34–90.80%1.8795.88%83
Freeman-Tukey84.78%80.23–88.19%0.0696.52%83
SensitivityDLLogit99.15% *98.29–99.58%1.4199.98%16
Freeman-Tukey98.99% *97.74–99.63%0.0199.96%16
MLLogit86.99%81.46–91.05%2.9497.23%83
Freeman-Tukey82.56%77.78–87.54%0.0997.60%83
PrecisionDLLogit99.18% *98.40–99.58%1.2699.98%16
Freeman-Tukey98.99% *98.03–99.63%0.0199.96%16
MLLogit87.54%81.15–91.91%2.5395.08%56
Freeman-Tukey84.05%77.78–88.83%0.0795.28%56
F1 scoreDLLogit95.43% *92.20–97.37%2.8999.90%44
Freeman-Tukey93.35% *90.06–96.02%0.0399.99%44
MLLogit78.75%63.41–88.80%1.0867.06%14
Freeman-Tukey76.95%66.16–86.87%0.0360.20%14
*: indicates a significant difference between DL and ML for the transformation considered (p < 0.05). 95% CI: 95% confidence interval; N: number of algorithms.
Table 7. Egger test results for each performance parameter and by transformation method.
ParameterLogitFreeman-Tukey
tdfptdfp
Accuracy1.0971040.275−1.5841040.116
Specificity5.11281<0.001 *−1.217810.227
Sensitivity0.169970.866−0.714970.477
Precision0.270700.788−0.323700.748
F1 score0.758560.4520.196560.845
*: significant Egger test.
Disclaimer/Publisher’s Note: The statements, opinions and data contained in all publications are solely those of the individual author(s) and contributor(s) and not of MDPI and/or the editor(s). MDPI and/or the editor(s) disclaim responsibility for any injury to people or property resulting from any ideas, methods, instructions or products referred to in the content.