Article

Fast Conversion of Molecular Diagrams into Plausible Crystal Structures Using Graph-Based Force Fields

CEA, DAM, Le Ripault, 37260 Monts, France
AI Chem. 2025, 1(1), 2; https://doi.org/10.3390/aichem1010002
Submission received: 29 August 2025 / Revised: 3 October 2025 / Accepted: 14 October 2025 / Published: 21 October 2025

Abstract

Despite the value of molecular packing (MP) calculations in modeling the properties of organic crystals, its widespread adoption is hindered by the absence of a simple tool broadly accessible to non-specialists, and by the lack of reliability inherent to transferable force fields. To fill these gaps, we describe a versatile workflow, leveraging recent progress in the application of machine learning to the parameterization of interatomic potentials. It is provided as a Python script based only on free academic software running on any Linux system. A key ingredient to this workflow is a recent neural network pretrained to predict bespoke force field parameters for any organic compound on the basis of its molecular diagram. The resulting graph-based force field (GB-FF) is fed into the Tinker simulation engine and applied to crystal structures generated using the USPEX crystal structure prediction package. This low-cost workflow is found to outperform current state-of-the-art procedures based on heavily parameterized force fields, thus demonstrating the value of machine-learned bespoke potential parameters.

1. Introduction

Are crystal structures predictable? Thirty years ago, Gavezzotti noted that he could write the shortest research paper in literature by answering ‘No’ to this question [1]. Since then, crystal structure prediction (CSP) from molecular diagrams has made dramatic progress, as regularly demonstrated by the CCDC blind tests, to the point of having essentially met this challenge for relatively simple cases. For instance, the top competitor in the seventh blind test managed to generate the structures of all seven submitted compounds, while the second best found six of them [2]. Thus, routine CSP now seems within reach, at least in such fields as drug formulation, where pure substances made of relatively simple organic compounds are frequently considered [3]. However, this remarkable achievement comes at a price. For instance, the successful identification of the crystal structures of the seven compounds submitted in the 7th blind test required nearly 10 million CPU hours [2]. This technique therefore mainly caters to clients for whom accurate structure prediction and identification of likely polymorphs is critical, for instance in the pharmaceutical sector.
Fortunately, the successful idenfication of the most stable crystal structure is not that critical for many applications of organic compounds in materials science. Indeed, while the polymorphs of a given compound may show differences in significant properties such as melting point or solubility, many bulk properties, including density, sublimation enthalpy, heat capacity or refractive index, tend to be close in value between polymorphs. In such cases, the crystal structure is just a proxy information that allows the property of interest to be estimated, potentially with greater accuracy than from the structure of its constituent molecules alone. For instance, MOLPAK (MOLecular PAcKing), an early CSP package, was primarily designed in view of estimating the density of high energy molecules from generated structures [4]. Similarly, UPACK (Utrecht Crystal Packer), another early CSP package [5], was applied to the estimation of lattice energy for simple salts [6]. PMC, a similar program, is still currently applied for this goal [7]. For organic semiconductors (OSCs), molecular packing calculations yield a realistic description of the role of substitution on the resulting transport properties through a modification of the charge transfer integrals between neighboring molecules [8,9]. What is required here is a realistic description of the interactions between neighboring molecules so as to obtain reasonable estimates of the charge transfer integrals. As a last example, embedding thermally activated delayed fluorescence (TADF) emitters in a plausible crystal environment was found to successfully describe their photophysical properties [10].
As opposed to CSP for which finding the right experimental structure is critical, such applications draw upon the creation of model crystal structures through molecular packing (MP) calculations. They do not require that the potential precisely rank the most stable structures. It is, however, important to identify plausible ones and for their calculated properties, to be sufficiently close to the values that would be obtained for the actual structure.
While early CSP packages can be used for MP studies, they are ill-suited for this purpose because they were designed to operate with specific or oversimplified force fields, not meant to be valid for arbitrary compounds. In this context, MP studies are typically conducted using proprietary software providing broadly applicable force fields, such as the PolymorphPredictor module in the Materials Studio (MS) modeling suite [11], which was used in some of the abovementioned examples [8,9,10]. Unfortunately, although MP is far less demanding than CSP, such tools are only accessible to specialized teams whose needs justify the purchase of expensive software. Moreover, they are not easily integrated in custom workflow requiring data exchange with third-party software. Therefore, integrating additional advanced models such as polarizable or neural network force fields is not straightforward. Finally, it appears from literature that crystal structures relaxed using standard force fields exhibit large deviations from experiment, even when starting from the known experimental structure [12,13,14].
Leveraging recent advances in the use of machine learning (ML) to predict bespoke force field parameters for any organic molecule, this paper describes a more versatile and fully automated low-cost alternative to current molecular packing tools. A specific feature of our approach is the fact it is fully modular, with the three tasks of force field assignment, crystal structure relaxation, and generation of trial structures addressed by three distinct pieces of software, namely a recently reported generator of custom parameters based on deep learning [15], the Tinker molecular modeling package [16], and the USPEX code that implements an evolutionary algorithm featuring local optimization, real-space representation, and flexible physically motivated variation operators to search the crystal configuration space [17,18,19,20].
This workflow is depicted in Figure 1. The three main components involved are detailed in Section 2. Based on this versatile tool, the routine generation of plausible crystal structures is demonstrated in Section 3 for organic crystal data sets previously considered in recent benchmarking studies of force fields and MP procedures. The results are further discussed in Section 4.

2. Materials and Methods

2.1. Graph-Based Force Field Generator

As emphasized above, the routine generation of realistic crystal structures allowed by the present workflow heavily relies on the fast generation of custom force field parameters for any new molecule described by its structural formula (molecular diagram). A physical approach to this problem would require building a 3D model of the molecule and computing interatomic forces using quantum chemistry, which is not suitable in a high-throughput design context. This is why we opted for a recent pretrained neural network aimed at converting molecular diagrams into custom parameters to be used with the simple energy expression used in the General Amber Force Field (GAFF) [15]. More specifically, this tool quickly generates optimal GAFF parameters for virtually any molecule made of elements H, C, N, O, F, P, S, Cl, Br, and I, thus providing a so-called Graph-Based Force Field, or GB-FF. This approach being described in full details in the original paper [15], only a brief overview is provided here.
Since the derivation of a GB-FF is based on the molecular diagram, which is essentially a graph, the choice of a graph neural network seems particularly suitable. Moreover, because the parameters of a force field are local entities specific to a bond, a valence angle, or a torsion angle, it is natural to use a graph convolutional network based on atomic representations, such as a message-passing neural network (MPNN) where atoms exchange information along bonds in order to update their representations [21]. To avoid redundant information transfers from A to B and then from B to A along a bond AB, a common practice consists of splitting each covalent bond A−B into two directed bonds A→ B and B→A, focusing on directed bond states rather than atom states [22].
In the GB-FF generator, representations for atoms and directed bonds are considered simultaneously. Initial representations of atoms and undirected bonds are obtained by one-hot encoding their categorical attributes, such as atomic symbol, coordination, formal charge, hybridization, chirality, or aromaticity for atoms, as well as bond order, conjugation, ring membership, and stereochemistry for bonds. The initial representation of a directed bond A→B is then obtained by concatenating the representations of A, A−B, and B, respectively in this order, which distinguishes it from the representation of the inverse directed bond B→A. Atom and directed bond representations are refined through successive iterations and finally used as input data for feed-forward neural networks. At each iteration, directed bond representations are updated first. Thus, the state of every A→B directed bond is modified based on its current state and the states of adjacent bonds C→A. Then, the state of every atom A is updated using its current state and that of all directed bonds C→A. Every update iteration consists of two steps. The first one is the aggregation of messages based on an attention mechanism. A new representation of every entity (atom or directed bond) is then obtained as a weighted average of current representations of itself and its neighbors, where the weights are obtained through self-attention. The second step consists of refining the representations using a feed-forward network.
This architecture is referred to as a directed graph attention network, or D-GAT [23]. It eventually produces both atomic and directed bond representations. The former are used to predict GAFF parameters for bonds, valence angles, and torsions, as well as atomic van der Waals parameters. The latter are used as input to a charge transfer model to predict the partial atomic charges required to model Coulomb interactions.
In the present work, the GB-FF generator is used as is, i.e., fitted against quantum chemical data for isolated molecules (which determine intramolecular parameters) and molecular dimers (to derive meaningful intermolecular parameters). It should be stressed that no crystal data was used in this parameterization process. Therefore, in its present state, the GB-FF generator is expected to yield suboptimal parameters for accurate crystal modeling. Nevertheless, before undertaking a fine-tuning of this model so that it produces the best possible GAFF parameters for crystal modeling, it is worth examining how the current parameterization performs at providing plausible crystal structures, compared to the transferable force fields widely employed to this goal. Indeed, while GB-FFs obtained using the current version of the generator are optimized to describe isolated molecules and clusters, which is an obvious drawback in the context of crystal modeling, they exhibit a major asset in that the resulting parameters are specific to the compound under study, in contrast to those of transferable force fields, which consist of fixed values transfered between atoms and bonds sharing a common local environment.

2.2. Tinker Simulation Engine

The Tinker modeling package is widely used in the molecular simulation community. This tool is especially versatile as it provides a large variety of models, including classical as well as polarizable force fields. In particular, it can directly use GAFF force fields, including the GB-FFs generated on the fly by the generator sketched in Section 2.1. Multiple flavors of Tinker have been developed by different research groups [16,24,25,26]. In this work, we use version 8.10.6 of Tinker, released in October 2023 [16].
In principle, the theoretical description of thermal expansion entails a considerable computational cost, inherent to its origin in the anharmonic parts of the potential. Therefore, in many research papers and benchmark studies, the authors simply relax the crystal lattices and directly compare the resulting equilibrium structures (corresponding to a temperature of 0 K) with experimental data measured at finite temperature, thus neglecting thermal expansion [12,13,14]. Recent studies reported mean values of the volumetric thermal expansion coefficient close to 170 × 10 6 K 1 [27,28]. Assuming a linear volume increase in the whole temperature range, this corresponds to a crystal volume about 5% larger at 298 K compared to the 0 K value. Therefore, in the present paper, we focus on values divided by 1.05 of the theoretical equilibrium crystal densities.

2.3. USPEX Genetic Algorithm for Crystal Structure Generation

There are few open-source codes for CSP. With regard to those applicable to molecules, Genarris might appear as a natural option to generate trial crystal structures [29]. However, it is tightly integrated with a quantum chemical engine to evaluate energies and forces. Although its recent integration with a machine learning (ML) potential has made it possible to generate candidate structures on a larger scale [30], the accuracy of such deep ML force fields come at the cost of much greater computational expense compared to traditional force fields like GAFF [31]. Therefore, as mentioned in the introduction, we used in this work the well-known USPEX program (https://uspex-team.org), particularly well-established within the CSP community and the result of an international collaboration [17,18,19,20]. More specifically, we used version 10.5.0 of this package. Each calculation was carried out over 10 generations of 30 individuals. For every compound studied, we let USPEX sample all compatible space groups. In every new generation, 35% of the individuals are produced by inheritance, 20% using the random symmetric structure generator, 15% using the topological random generator, 15% by softmutation or coormutation, and finally 15% by mutating orientations of randomly selected molecules. To prevent unphysical molecular overlap, a minimal distance of 2.5 Å was imposed between the geometric centers of molecules, in additional to constraints on interatomic distances. The full list of parameter values for USPEX may be found in the input file provided as Supplementary Materials. They were selected based on previous experience from Bidault et al. in their USPEX-based CSP investigations [32].

2.4. Python Implementation: mol2crystal.py

The workflow sketched in Figure 1 was implemented as a Python script named mol2crystal.py, developed using Python 3.9 and provided as Supplementary Materials to this article. In addition to interfacing the three software components mentioned above, this script relies on the RDKit library version 2024.03.5 (https://www.rdkit.org) to handle auxiliary tasks involving molecular manipulation. For conversion of molecular diagrams to 3D structures, OpenBabel version 3.1.1 (http://openbabel.org) is used, as unrealistic structures were occasionally obtained using RDKit.
In fact, the major obstacle to the high-throughput generation of molecular crystals using USPEX stems from the fact that this package was originally designed for the generation of inorganic crystals from an elemental composition. Although it has long since been extended so as to be applicable to molecular crystals, this requires describing an arbitrary starting conformation of each molecule using a Z-matrix. The automatic generation of a Z-matrix for a given 3D molecular geometry is a trivial task commonly implemented in quantum chemistry software. However, the resulting Z-matrices are not consistent with USPEX, which relies on rotatable torsion angles involved in the Z-matrix to screen molecular conformers. Therefore, it is essential to ensure that adjusting such an angle modifies the molecular conformation without affecting the geometry of the fragments on either side of the rotated bond (Figure 2). To prepare Z-matrixes suitable for CSP, the USPEX team provides a web application available at https://uspex-team.org/online_utilities/zmatrix/ (accessed on 1 September 2025). Unfortunately, such an online tool is not easily integrated into a custom computational pipeline. Moreover, it is unsuitable for research involving confidential or proprietary data. Therefore, mol2crystal.py includes a routine that prepares Z-matrixes, taking care of USPEX constraints by defining the torsion angles as indicated in Figure 2. This makes it possible to generate molecular crystals on a routine basis.
Finally, it may be worth emphasizing that the initial conformation described by the Z-matrix is purely arbitrary. Searching for the most stable conformer of the isolated molecule is not meaningful because the molecule is likely to adopt a different conformation in the crystal phase. The search for the latter is an inherent part of the search for the most stable crystal packing carried out by the USPEX evolutionary algorithm.

3. Results

The first parameter to consider when evaluating the ability of a force field to describe crystal structures is the unit cell volume, or, equivalently, the crystal density ρ . Indeed, a density that is too low implies overestimated intermolecular distances and, consequently, poorly described interactions. In this context, all properties of the crystal are liable to be inaccurately described. Conversely, a theoretical density much higher than experiment is more likely to reflect limitations of the force field employed, or the existence of a crystal polymorph with higher density than the experimental one.
To obtain an overall picture of the relative performance of various methods in predicting ρ data for any given data set, the average relative (signed) deviation from experiment (ARD) is used to identify systematic deviations. The average relative (unsigned) error (ARE) is used to characterize the average performance in predicting ρ . To obtain insight into worst-case scenarios, minimal (MIN) and maximal (MAX) relative errors are reported as well.

3.1. Relaxed Experimental Structures

Before undertaking the prediction of ρ from systematic generation of trial structures, the ability of GB-FFs to describe the observed structures should be established. In other words, the experimental structures should not undergo significant changes upon relaxation to the equilibrium geometry.
For a standard set of 174 CHNO organic crystals initially introduced in 2004 by Rice and Sorescu [33], such a benchmark study was recently reported by Li et al. [13]. These authors compared their newly developed non-empirical polarizable force field (PFF) against a number of well-established models implemented in Materials Studio [11], including COMPASS [34] and DREIDING [35]. This earlier study is presently extended to include the GB-FF approach. The detailed results are compiled in Table S1 . The overall performance of the various approaches in providing equilibrium structures consistent with experiment is summarized in Table 1 when raw equilibrium densities are directly compared to experiment, and in Table 2 when they are divided by 1.05 in view of accounting for thermal expansion.
Using COMPASS or GB-FF, equilibrium densities tend to be larger than experiment, as expected from the lack of thermal effects. However, this is not the case for DREIDING and PFF. Consequently, dividing equilibrium densities by 1.05 improves the agreement with experiment for COMPASS and GB-FF, but deteriorates it for DREIDING and PFF. As clear from a comparison between data in Table 1 and Table 2, including thermal effects brings about significant changes. In particular, this shows that COMPASS actually performs significantly better than DREIDING. This is to be expected in view of the fact that although both models share much similarity regarding their goals, the much enhanced flexibility and heavy parameterization of COMPASS allows for a more accurate description of suble effects regarding interatomic interactions. In addition, COMPASS is regularly updated, making it a particularly well-regarded force field in its category. Finally, as a non-empirical force field design from the ground up on the basis of quantum chemical calculations, including explicit polarizabilities, PFF performs fairly well, outperforming DREIDING.
However, the best predictions for ρ at 298 K are obtained using GB-FF, the only force field that systematically yields values within 10% from the experiment, and an ARE as low as 2.4%, i.e., significantly lower than obtained using the second-best performer, i.e., COMPASS with ARE = 3.3%. Errors with DREIDING and PFF are much larger, with an ARE value close to 10% for DREIDING.
Despite relying on a large number of parameters, COMPASS exhibits specially large errors in some cases, with relative deviations from X-ray density of 17 % for JOTFAZ, a relatively simple bicyclic nitramine, 12 % for PUTCEM, i.e., 2,4,8,10-tetranitrobenzotriazolo-(2,1-a)benzotriazole, over + 10 % for several acyclic nitroalkanes and nitramines, and up to + 24 % for CUGDIR, i.e., octanitrocubane. For the latter molecule, the GB-FF deviation from the experiment is only + 3.5 % . In some cases, the large errors obtained using COMPASS might be due to the fact that Materials Studio automatically assigns default values when some parameters are missing. This is probably the case for PUTCEM, which exhibits a specially unusual structure which formally charged nitrogen atoms in fused aromatic rings. The superior overall performance of GB-FF was not necessarily expected since it does not take advantage of any available crystal data, using only quantum chemical structures of isolated molecules and clusters for the parameterization of the GB-FF generator. This suggests that the introduction of bespoke parameters into the GAFF formalism is even more important than including crystal data in the parameterization process.

3.2. Predicted Crystal Structures

Having established the ability of GB-FFs to reproduce observed crystal structures, we now investigate the ability of USPEX to yield realistic crystal structures when coupled with such models. For the sake of comparison with current established methods, we apply the current workflow to data sets considered in previous studies by Moxnes et al. [12] and Ghule et al. [14]. The former focuses on a small set of well-known explosives whose experimental X-ray structures are available. This will allow us to compare predicted structures with experimental ones. The latter paper considered a data set including 32 non-aromatic and 36 aromatic compounds mostly retrieved from original research papers in energetic materials published after 2004, and are thus absent from the previously considered Li et al. data set. In particular, the Ghule et al. data set includes more challenging or seldom encountered species, including high-nitrogen azide compounds or zwitterionic species. This set is representative of energetic compounds studied in the last two decades. Moxnes et al. as well as Ghule et al. resorted to the PolymorphPredictor for MP calculations, which is a Monte Carlo Simulated Annealing algorithm implemented in Materials Studio.
Moxnes et al. applied the technique to the prediction of crystal density for eight energetic crystals, widely referred to as RDX, TNT, NTO, DNAM, CL-20, DADNE, α -HMX, and β -HMX, with molecular structures shown in the original reference [12]. Since crystal structures have been reported for all eight compounds, we first relaxed them with the help of GB-FF. In a second step, we applied the workflow outlined in Figure 1 to generate crystal structures from the molecular diagrams of the molecules. The results are compiled in Table 3. The raw densities calculated before corrections for thermal expansion can be straightforwardly obtained from the reported ambient values. However, corresponding ARE values are reported, showing a systematic and very significant decrease in the deviations between calculations and experiment upon including thermal expansion.
Not surprisingly, the lowest ARE of 1.7% is obtained for the relaxed experimental structures, in line with the observed ability of the GB-FFs to describe experimental structures. By comparison, the higher ARE of 2.9% obtained for predicted structures using the same GB-FFs reflects that the latter do not match experimental structures, as anticipated from the genuine simplicity of the GAFF formalism. A closer examination of relaxed versus predicted structures reveals that the former are usually higher in energy, albeit possibly by a very small margin (6 kJ/mol for TNT). Therefore, the efficiency of the sampling performed by USPEX is not the issue. The problem is that according to GB-FFs, some hypothetical structures with density substantially different from experiment are lower in energy than the experimental structure. The only crystal in Table 3 for which USPEX yielded a structure higher in energy than the relaxed experimental structure is NTO. Despite the latter being 20 kJ/mol lower in energy, specific efforts to better search the configuration space for this compound, using a population size of up to 95 individuals, did not lead to structures lower in energy than the one obtained using our standard procedure.
Just like Moxnes et al. [12], Ghule et al. used PolymorphPredictor to search for low-energy polymorphs [14]. In addition to DREIDING and COMPASS, they considered alternative force fields that are generally less reliable and/or less suitable for molecular crystals, notably PCFF, which is primarily intended for polymers [36]. We extend this benchmark study to our GB-FF/USPEX workflow. For non-aromatic and aromatic compounds, the results are detailed and compared to previous ones in Tables S2 and Tables S3 , respectively. They are summarized in Table 4.
In contrast to the 32 non-aromatic compounds whose PCFF equilibrium densities significantly differ from experiment (ARE = 4.6%), the 36 aromatic compounds happen to exhibit PCFF equilibrium densities (corresponding in principle to 0 K) that closely match experimental values at 298 K, as reflected by an ARE as small as 2.2%. This was already noted by Ghule et al. [14]. However, this close correspondence necessarily results from a fortuitous error compensation, implying that PCFF tends to underestimate equilibrium densities for aromatic crystals, which compensates for the lack of thermal expansion. Applying the average expansion factor of 1.05 to PCFF equilibrium volumes yields a significantly increased ARE of 4.5%, resulting in an overall ARE of 5.3% for PCFF densities extrapolated to 298 K when both data set are considered, as shown in Table 4. All in all, for the non-aromatic and aromatic data sets, GB-FF performs best, with ARE values of respectively 3.9% and 3.2%, followed by DREIDING (4.9% and 3.5%). In contrast to the results derived from relaxed experimental structures in the Li et al. data set, COMPASS performs worse (6.3% and 7.5%) for both Ghule data sets, which might suggest a lack of transferability of parameters fitted against common fonctional groups to more unusual environments.
Having a fast tool for easily generating realistic crystalline structures from expanded formulas, we then applied it to the molecules in the panel of Li et al., disregarding the experimental structures. The corresponding GB-FF/USPEX results are summarized in Table 1 and Table 2, and detailed in Table S1 . Just like for GB-FF relaxed experimental structures, the densities of predicted 0 K equilibrium structures are, on average, 6% larger than the experiment (Table 1), in line with the 5% increase of crystal volume ongoing from 0 to 298 K. The densities obtained after accounting for temperature are in much better agreement with the measurements, although the corresponding ARE (3.4%) still remains considerably higher than that obtained by relaxing the experimental structures (2.4%). In fact, the GB-FF/USPEX densities are comparable in accuracy to those obtained when the measured structures are relaxed using COMPASS.
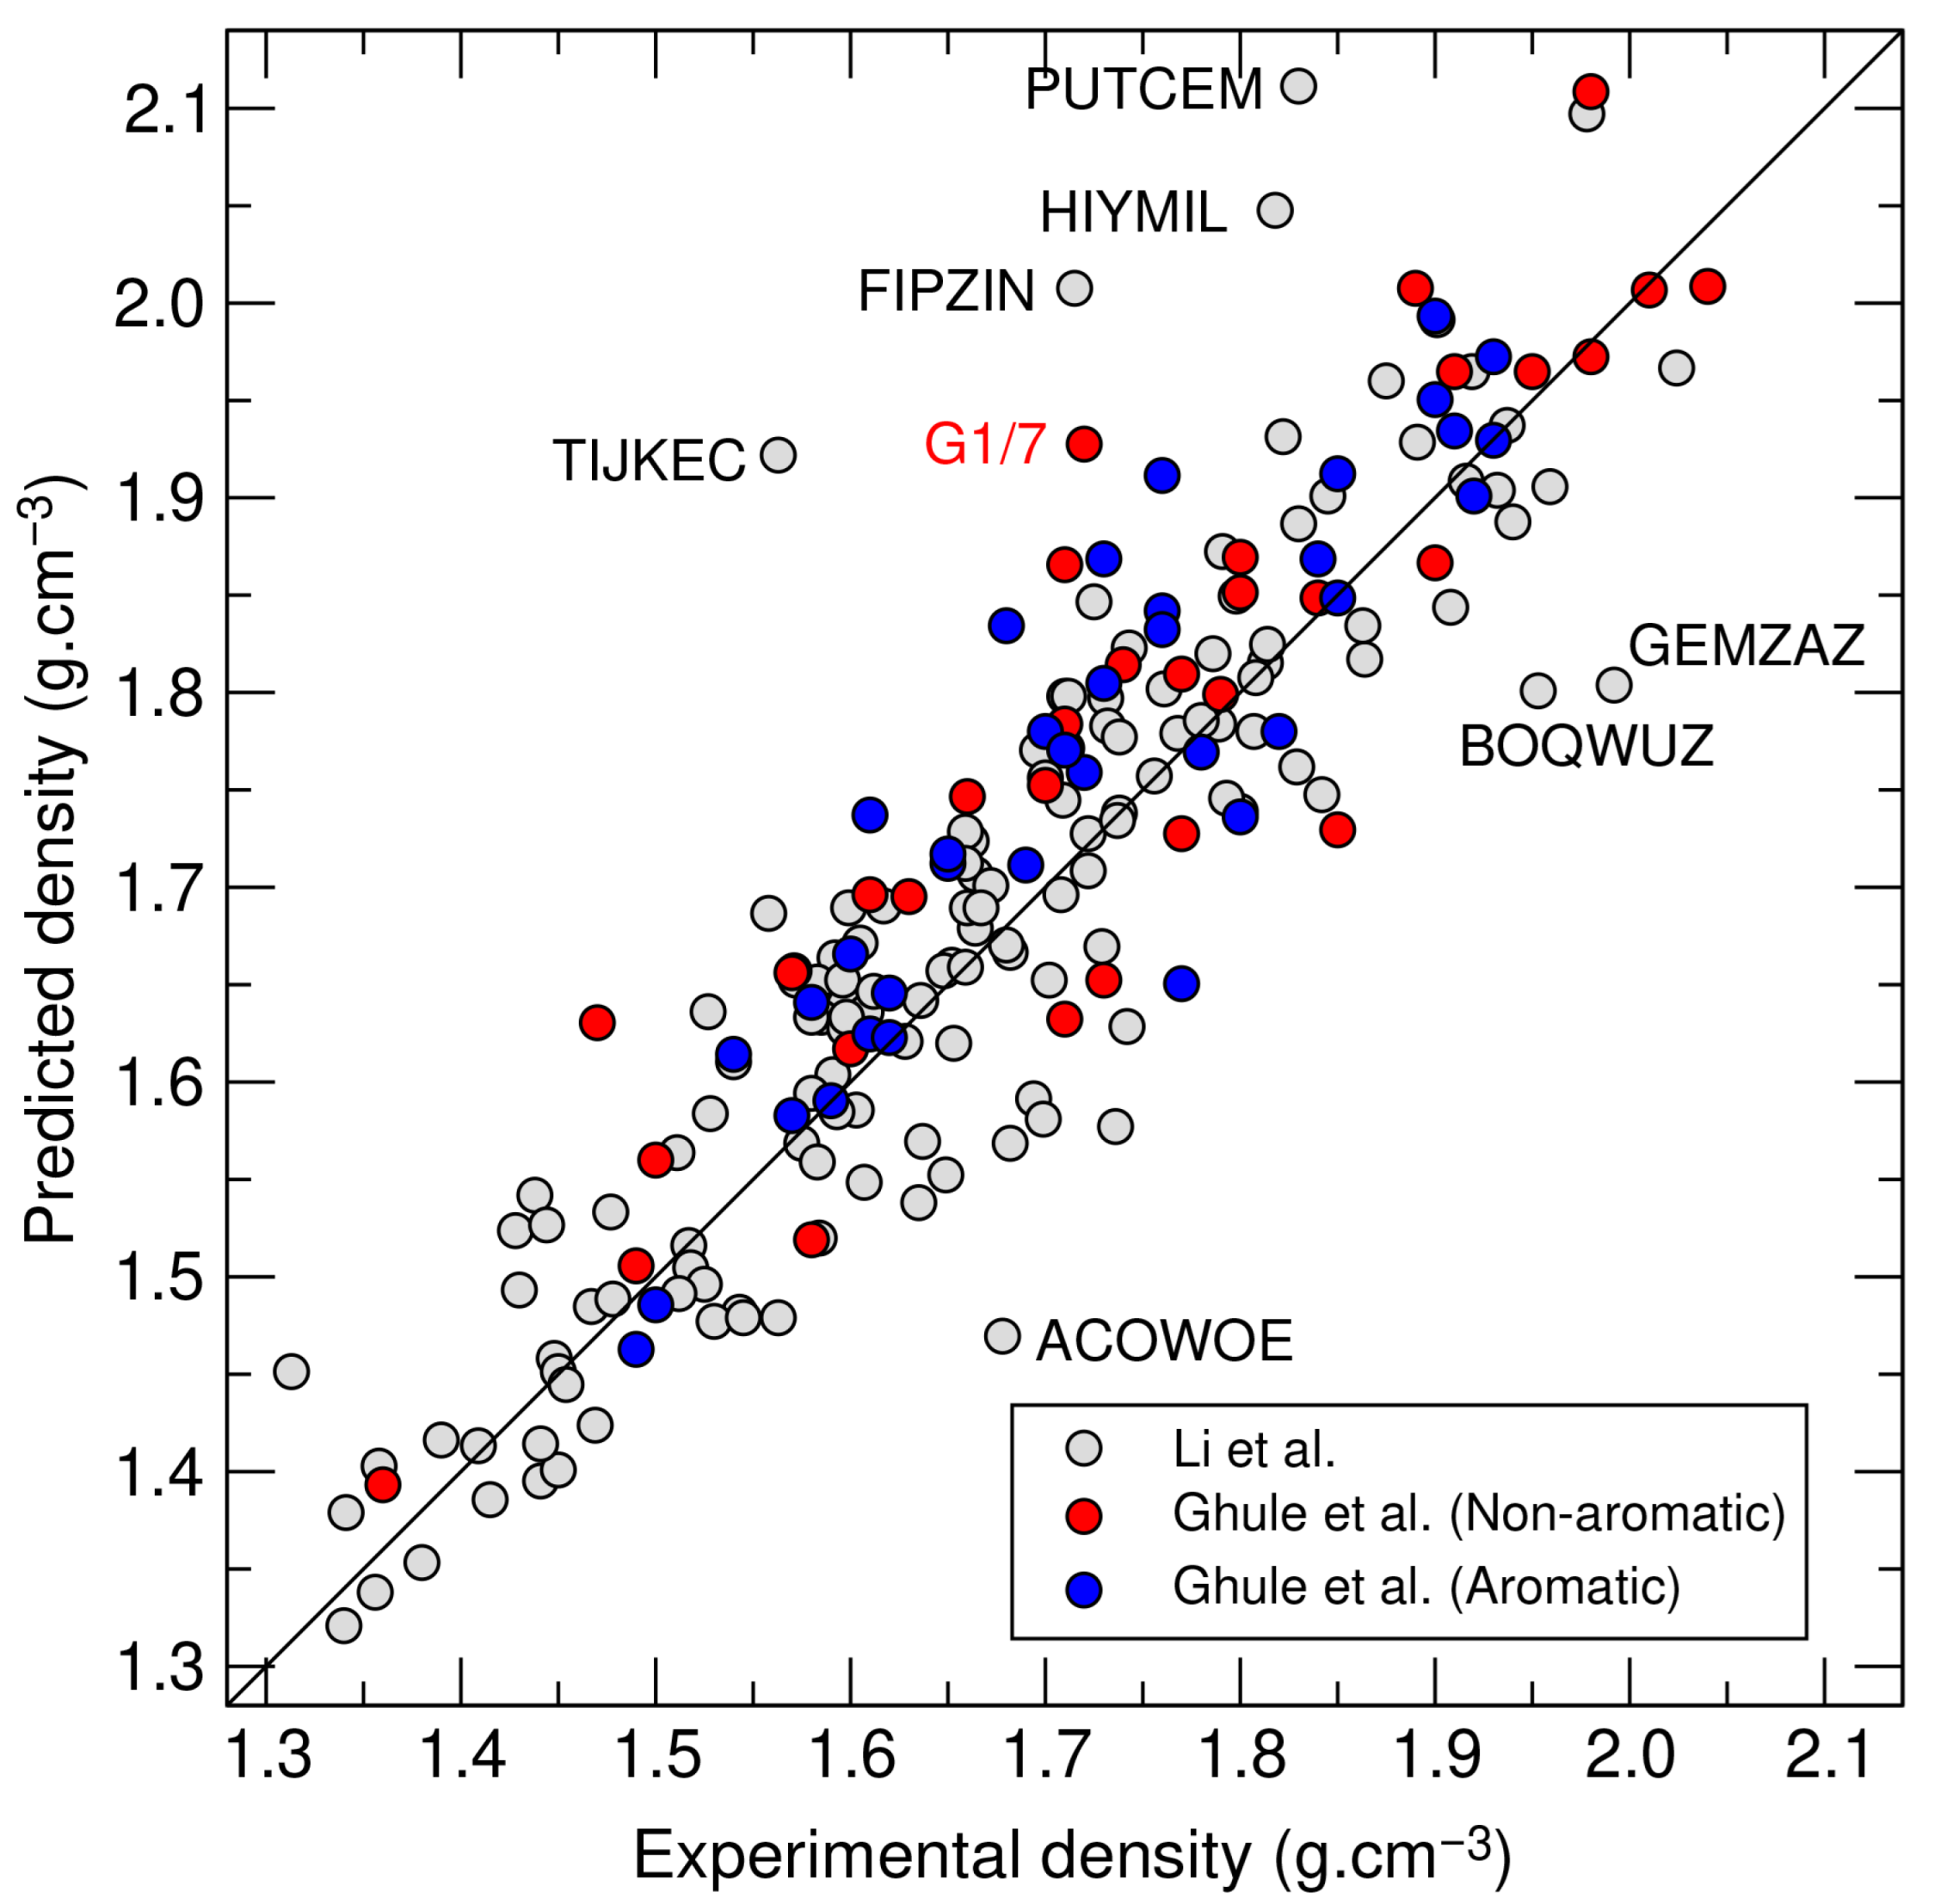
The densities predicted using the current GB-FF/USPEX workflow for the Li and Ghule data sets are plotted against experiment in Figure 3. Despite the good average accuracy of GB-FF/USPEX densities compared to previously obtained data, very large deviations are observed for specific compounds, shown in Figure 4. Underestimated densities are observed for ACOWOE, a small molecule with a 4-membered ring bearing two nitro groups in gemical positions, and BOQWUZ/GEMZAZ, two nitramines sharing a similar structure, with two fused aliphatic 5-membered rings. Overestimated densities are observed for two nitramines bearing azido groups (G1/7 and FIPZIN). TIJKEC is the only compound in the database with a primary ammonium group (− NH 3 + ). In the predicted crystal, the molecule adopts a stretched all-trans conformation favorable for compact packing, whereas the observed structure reveals the molecule assumes a different conformation that brings oppositely charged formal groups on the chain atoms closer together, which is detrimental to packing compactness. Similarly, the overestimated density for FIPZIN is associated with a stretched symmetric conformation, in sharp contrast to that observed. PUTCEM is the only tetrazapentalene compound in the database. In contradiction with experiment, our calculations predict that PUTCEM and HIYMIL form lamellar crystals, which might explain their overestimated densities.
Interestingly, these large errors systematically arise for compounds with unusual structures not represented in the quantum chemical training set used to train the model, especially nitramines. Although the nitramine group (N− NO 2 ) is rather common in the field of energetic materials, it is not represented in current standard quamtum chemical databases where their main focus are on drug-like molecules [37]. The PUTCEM nitroaromatic compound (NAC) is the only outlier deprived of the nitramine group. However, its tetrazapentane structure is even more exotic and unrepresented in the GB-FF training set. This reflects the fact that althought the GB-FF generator can yield GAFF parameters for arbitrary compounds made of the elements in the scope of the model, it appears to be less reliable for unusual chemical functional groups absent from the training set.
The noted correlation between the magnitude of the density deviations and the occurrence of substructures absent from the training set strongly suggests that the main deficiencies of the present approach could probably be remedied by including such substructures into the training set.

3.3. USPEX Convergence

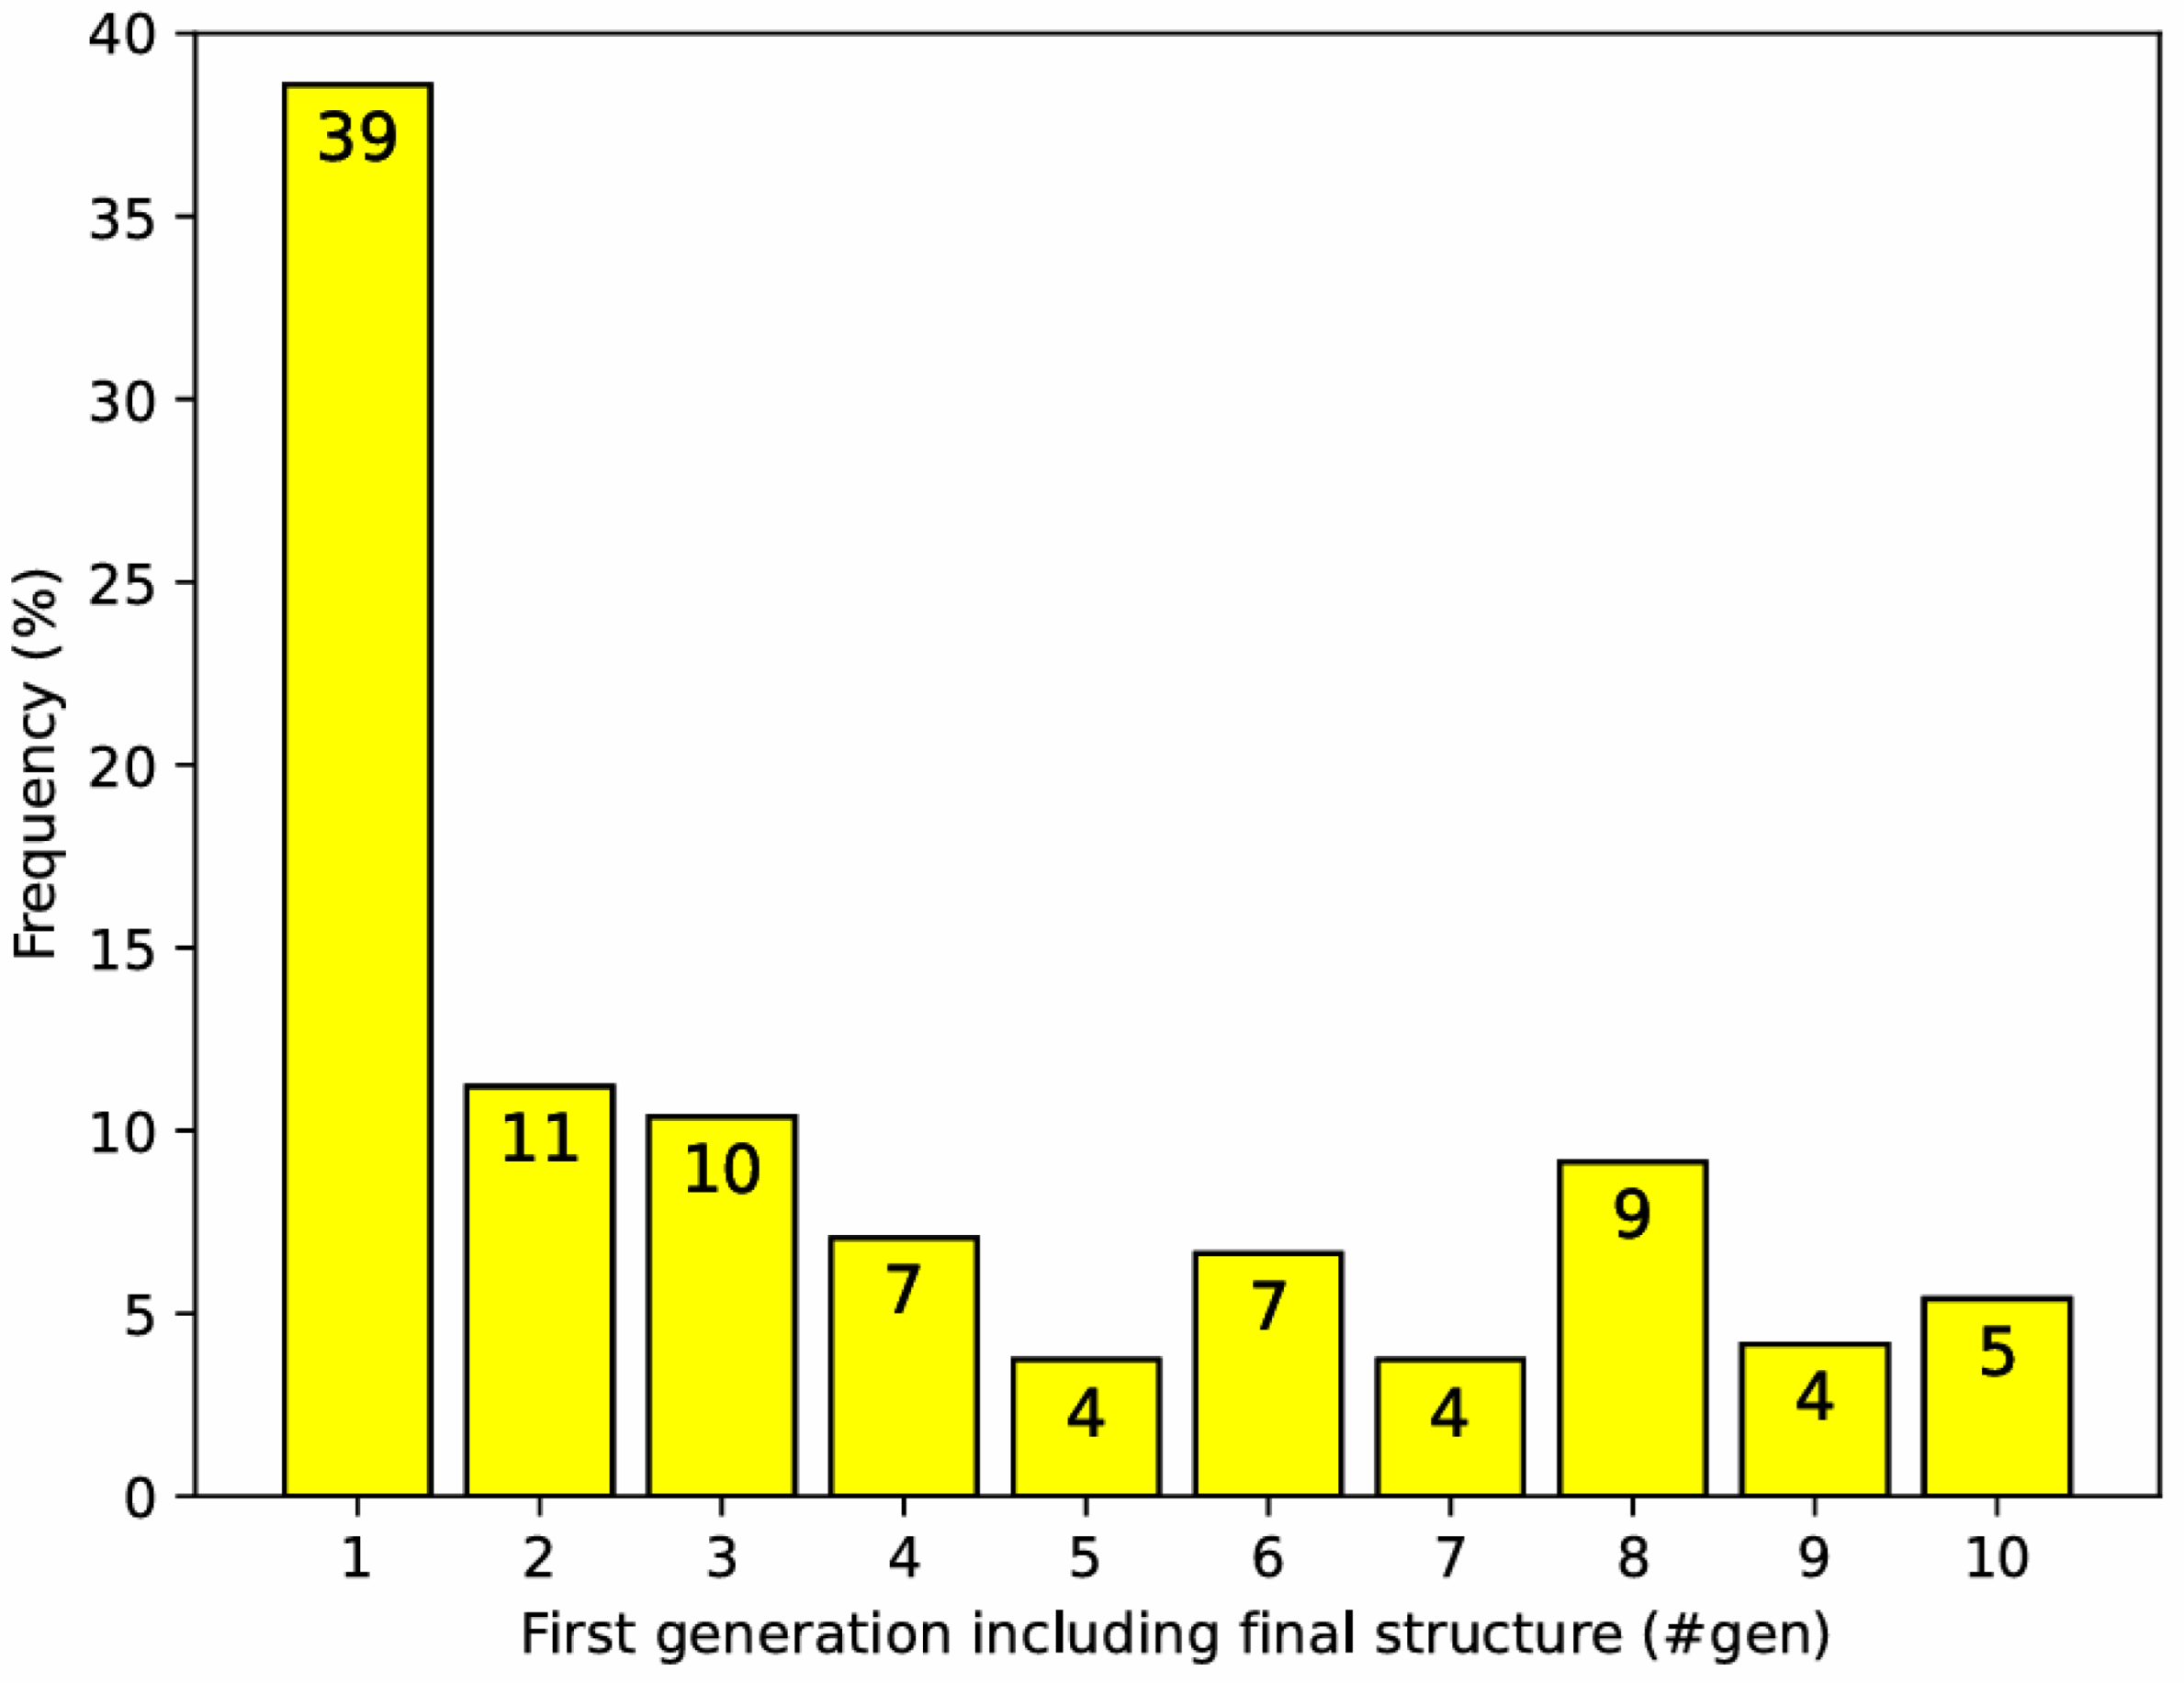
As USPEX is generally used for CSP, along with high-level potentials or ab initio codes, large-scale benchmark studies reporting application of this tool to a large number of different compounds are lacking. Therefore, in this section, for each USPEX run performed, we examine the number of generations (#gen) required to identify the crystal that is ultimately selected as the most stable after 10 generations. The values of #gen are compiled in Table S1, Table S2 and Table S3 for all USPEX runs. Their distribution is shown in Figure 5
Interestingly, the structures ultimately selected after 10 generations were already present in the first generation in almost 40% of the USPEX runs. This encouraging result might suggest that the most stable structure generally appears very early and that evaluating the population over 10 generations is excessive. In fact, this idea is contradicted not only by the accumulated experience from numerous CSP attempts reported in the literature [2] but also by the fact that in nearly 20% of cases, a more stable structure emerges during the last 3 generations, demonstrating the importance of continuing the search far beyond 10 generations. It is also important to keep in mind the extreme simplicity of the potentials generated by GB-FF, which could induce a modification of the potential energy surface topology. In particular, some minima resulting from subtle effects such as induction phenomena or halogen bonding might disappear due to this simplification of the potential, hence possibly leading to a faster convergence of the USPEX search for the lowest energy structure.

4. Discussion

The coexistence of DREIDING and COMPASS in the Materials Studio suite reflects various objectives that may be pursued when developing a force field. Both were developed with the aim of being broadly applicable to a wide range of materials, thanks to extensive parameterization and by leveraging available structural data, particularly from crystal structures. The main difference lies in their analytical expressions. DREIDING is a conventional (class I) force field, in the sense that, just like GAFF, it relies on a limited number of terms to describe the energy of a system: harmonic terms for bonds and valence angles, sinusoidal terms for torsion angles, and Lennard–Jones potentials for non-bonded interactions, optionally complemented by Coulombic terms.
In contrast, COMPASS is a class II force field, implying a much higher complexity, with anharmonic terms for bonds and angles, as well as a multitude of cross-terms coupling bond–bond, bond–angle, and angle–angle interactions. This comes with extensive parameterization, allowing this model to satisfactorily describe a broad range of organic, inorganic, and polymeric materials in liquid, amorphous, and crystal phases.
The specificity of DREIDING compared to alternative simple force fields like GAFF lies in the fact that all quantities involved in the energy expression are derived from atomic parameters, which allowed the model to be parameterized against the whole periodic table. This comes at the cost of reduced flexibility, which is prone to limit the accuracy that may be obtained from this model. Turning to more flexible expression for the energy E makes it possible to more accurately describe interatomic interactions, as done with COMPASS. The price to pay includes more complex parametrization process, reduced generality, and more time-consuming simulations.
Interestingly, according to present benchmark calculations, GB-FF not only combines the advantages of these two force fields but also provides significantly improved accuracy. This is particularly notable given that its development does not involve any crystal structural data, but rather relies entirely on quantum chemical calculations of isolated molecules and clusters. This result emphasizes the potential of advanced machine learning techniques in providing relevant parameters for classical force fields.
Finally, on the practical side, it should be kept in mind that crystal densities derived from MP calculations are still less reliable on average than values calculated using analytic expression for the crystal volume based either on quantum chemical descriptors [38,39,40] or just atom counts [41,42]. However, notwithstanding their superior average performance, the latter exhibit inherent limitations in that they do not consider the role of molecular shape, which is especially important for large and complex molecules, which tend to exhibit low packing coefficient. In contrast, being more physical, the present approach has the potential to describe crystal structures for molecules of any size. With further improvement in the force field, this could lead to progress in the prediction of density and other crystal properties. In a first step, such improvement could be obtained by training the GB-FF generator in providing parameters specifically suited to the description of crystal structures. In a second step, it could be trained in parameterizing more complex energy expressions than the simple GAFF formalism.

5. Conclusions

The fully automatic generation of plausible crystal structures from molecular diagrams, based exclusively on tools freely available online as well as the Python script provided as Supplementary Materials, is demonstrated. In the current version of this workflow, a simple GAFF-type force field is parameterized on the fly using a recent neural network-based technique. At present, this tool is configured to yield suitable parameters for modeling isolated molecules as well as intermolecular forces within molecular aggregates, which necessarily limits the accuracy for describing crystals. Nevertheless, as it stands, the procedure yields a twofold decrease of the average relative error obtained from the built crystal structures, compared to earlier results obtained using a standard approach based on PolymorphPredictor and widely used transferable force fields designed with materials in mind. Thus, it already provides a low-cost alternative to proprietary software packages commonly used to build plausible crystals structures.
As a short-term perspective, reparameterizing the GB-FF generator against an extended database including functional groups commonly encountered in energetic materials should remedy the main deviations observed in this work. On the other hand, as is widely known, empirical force fields like GAFF do not explicitly describe specifically quantum interactions such as those arising from exchange integrals, nor do they capture non-additive interactions like induction forces. These interactions are implicitly taken into account through parameter adjustment based on experimental or ab initio data. However, Tinker has the advantage of being highly versatile. In particular, it allows for the use of different types of potentials, both classical and polarizable. Obviously, it would also be interesting to reparameterize the system against equilibrium structures of molecular crystals, which should in principle provide even better accuracy.

Supplementary Materials

The following supporting information can be downloaded: https://www.mdpi.com/article/10.3390/aichem1010002/s1, mol2crystal.py: Python script used in this work for the routine generation of crystal polymorphs from molecular diagrams; USPEX_input.zip: USPEX input to be extracted into the directory indicated by the variable USPEX_INP in the script mol2crystal.py; SupplementaryMaterials.pdf: miscellaneous information regarding how to install and run mol2crystal.py; Tables_S1_S2_S3.xlsx: Tables S1–S3 with full details of the present results.

Funding

This research received no external funding.

Data Availability Statement

All data used in this study is provided as Supplementary Materials.

Acknowledgments

The author is grateful to Xavier Bidault (Ref. [32]) for sharing his experience with USPEX and providing valuable hints and information regarding the cost and performance of low-end quantum chemical methods.

Conflicts of Interest

The authors declare no conflicts of interest.

Abbreviations

The following abbreviations are used in this manuscript:
GB-FFGraph-Based Force Field
D-GATDirected Graph Attention Network
USPEXUniversal Structure Predictor: Evolutionary Xtallography
CCDCCambridge Crystallographic Data Center
CSPCrystal Structure Prediction
MPMolecular Packing
GAFFGeneralized Amber Force Field

References

  1. Gavezzotti, A. Are Crystal Structures Predictable? Acc. Chem. Res. 1994, 27, 309–314. [Google Scholar] [CrossRef]
  2. Hunnisett, L.M.; Nyman, J.; Francia, N.; Abraham, N.S.; Adjiman, C.S.; Aitipamula, S.; Alkhidir, T.; Almehairbi, M.; Anelli, A.; Anstine, D.M.; et al. The seventh blind test of crystal structure prediction: Structure generation methods. Acta Crystallogr. Sect. B Struct. Sci. Cryst. Eng. Mater. 2024, 80, 517–547. [Google Scholar] [CrossRef]
  3. Zhou, D.; Bier, I.; Santra, B.; Jacobson, L.D.; Wu, C.; Garaizar Suarez, A.; Almaguer, B.R.; Yu, H.; Abel, R.; Friesner, R.A.; et al. A robust crystal structure prediction method to support small molecule drug development with large scale validation and blind study. Nat. Commun. 2025, 16, 2210. [Google Scholar] [CrossRef] [PubMed]
  4. Holden, J.R.; Du, Z.; Ammon, H.L. Prediction of possible crystal structures for C-, H-, N-, O-, and F-containing organic compounds. J. Comput. Chem. 1993, 14, 422–437. [Google Scholar] [CrossRef]
  5. van Eijck, B.P.; Kroon, J. Upack program package for crystal structure prediction: Force fields and crystal structure generation for small carbohydrate molecules. J. Comput. Chem. 1999, 20, 799–812. [Google Scholar] [CrossRef]
  6. Beaucamp, S.; Bernand-Mantel, A.; Mathieu, D.; Agafonov, V. Ab initio solid-state heats of formation of molecular salts from ion packing and crystal modelling: Application to ammonium crystals. Mol. Phys. 2004, 102, 253–258. [Google Scholar] [CrossRef]
  7. Khakimov, D.V.; Pivina, T.S. Salts of ethylenediamine and diethylenetriamines: Modeling of crystal structure and estimation of enthalpies of formation. Russ. Chem. Bull. 2025, 74, 354–360. [Google Scholar] [CrossRef]
  8. Alberga, D.; Ciofini, I.; Mangiatordi, G.F.; Pedone, A.; Lattanzi, G.; Roncali, J.; Adamo, C. Effects of Substituents on Transport Properties of Molecular Materials for Organic Solar Cells: A Theoretical Investigation. Chem. Mater. 2016, 29, 673–681. [Google Scholar] [CrossRef]
  9. Bhattacharya, L.; Brown, A.; Sharma, S.; Sahu, S. Computational Design of Crescent Shaped Promising Nonfullerene Acceptors with 1,4-Dihydro-2,3-quinoxalinedione Core and Different Electron-withdrawing Terminal Units for Photovoltaic Applications. J. Phys. Chem. A 2022, 126, 7110–7126. [Google Scholar] [CrossRef] [PubMed]
  10. Zhang, K.; Zhang, X.; Fan, J.; Song, Y.; Fan, J.; Wang, C.K.; Lin, L. Novel Deep Red Thermally Activated Delayed Fluorescence Molecule with Aggregation-Induced Emission Enhancement: Theoretical Design and Experimental Validation. J. Phys. Chem. Lett. 2022, 13, 4711–4720. [Google Scholar] [CrossRef] [PubMed]
  11. BIOVIA, Dassault Systèmes. BIOVIA Materials Studio Software; Dassault Systèmes: San Diego, CA, USA, 2022. [Google Scholar]
  12. Moxnes, J.F.; Hansen, F.K.; Jensen, T.L.; Sele, M.L.; Unneberg, E. A Computational Study of Density of Some High Energy Molecules. Propellants Explos. Pyrotech. 2016, 42, 204–212. [Google Scholar] [CrossRef]
  13. Li, X.; Wang, C.; Liu, Y.; Yin, S. Energetic molecule specific polarizable force field. FirePhysChem 2021, 1, 179–184. [Google Scholar] [CrossRef]
  14. Ghule, V.D.; Nirwan, A. Role of forcefield in density prediction for CHNO explosives. Struct. Chem. 2018, 29, 1375–1382. [Google Scholar] [CrossRef]
  15. Chen, G.; Jaffrelot Inizan, T.; Plé, T.; Lagardère, L.; Piquemal, J.P.; Maday, Y. Advancing Force Fields Parameterization: A Directed Graph Attention Networks Approach. J. Chem. Theory Comput. 2024, 20, 5558–5569. [Google Scholar] [CrossRef] [PubMed]
  16. Rackers, J.A.; Wang, Z.; Lu, C.; Laury, M.L.; Lagardère, L.; Schnieders, M.J.; Piquemal, J.P.; Ren, P.; Ponder, J.W. Tinker 8: Software Tools for Molecular Design. J. Chem. Theory Comput. 2018, 14, 5273–5289. [Google Scholar] [CrossRef] [PubMed]
  17. Glass, C.W.; Oganov, A.R.; Hansen, N. USPEX—Evolutionary crystal structure prediction. Comput. Phys. Commun. 2006, 175, 713–720. [Google Scholar] [CrossRef]
  18. Oganov, A.R.; Glass, C.W. Crystal structure prediction using ab initio evolutionary techniques: Principles and applications. J. Chem. Phys. 2006, 124, 244704. [Google Scholar] [CrossRef]
  19. Oganov, A.R.; Lyakhov, A.O.; Valle, M. How Evolutionary Crystal Structure Prediction Works—and Why. Acc. Chem. Res. 2011, 44, 227–237. [Google Scholar] [CrossRef] [PubMed]
  20. Lyakhov, A.O.; Oganov, A.R.; Stokes, H.T.; Zhu, Q. New developments in evolutionary structure prediction algorithm USPEX. Comput. Phys. Commun. 2013, 184, 1172–1182. [Google Scholar] [CrossRef]
  21. Gilmer, J.; Schoenholz, S.S.; Riley, P.F.; Vinyals, O.; Dahl, G.E. Neural message passing for Quantum chemistry. In Proceedings of the 34th International Conference on Machine Learning—Volume 70. JMLR.org, 2017, ICML’17, Sydney, Australia, 6–11 August; 2017; pp. 1263–1272. [Google Scholar]
  22. Heid, E.; Greenman, K.P.; Chung, Y.; Li, S.C.; Graff, D.E.; Vermeire, F.H.; Wu, H.; Green, W.H.; McGill, C.J. Chemprop: A Machine Learning Package for Chemical Property Prediction. J. Chem. Inf. Model. 2023, 64, 9–17. [Google Scholar] [CrossRef] [PubMed]
  23. Chen, G.; Maday, Y. Directed message passing based on attention for prediction of molecular properties. Comput. Mater. Sci. 2023, 229, 112443. [Google Scholar] [CrossRef]
  24. Harger, M.; Li, D.; Wang, Z.; Dalby, K.; Lagardère, L.; Piquemal, J.; Ponder, J.; Ren, P. Tinker-OpenMM: Absolute and relative alchemical free energies using AMOEBA on GPUs. J. Comput. Chem. 2017, 38, 2047–2055. [Google Scholar] [CrossRef]
  25. Lagardère, L.; Jolly, L.H.; Lipparini, F.; Aviat, F.; Stamm, B.; Jing, Z.F.; Harger, M.; Torabifard, H.; Cisneros, G.A.; Schnieders, M.J.; et al. Tinker-HP: A massively parallel molecular dynamics package for multiscale simulations of large complex systems with advanced point dipole polarizable force fields. Chem. Sci. 2018, 9, 956–972. [Google Scholar] [CrossRef]
  26. Adjoua, O.; Lagardère, L.; Jolly, L.H.; Durocher, A.; Very, T.; Dupays, I.; Wang, Z.; Inizan, T.J.; Célerse, F.; Ren, P.; et al. Tinker-HP: Accelerating Molecular Dynamics Simulations of Large Complex Systems with Advanced Point Dipole Polarizable Force Fields Using GPUs and Multi-GPU Systems. J. Chem. Theory Comput. 2021, 17, 2034–2053. [Google Scholar] [CrossRef]
  27. Bond, A.D. A survey of thermal expansion coefficients for organic molecular crystals in the Cambridge Structural Database. Acta Crystallogr. Sect. B Struct. Sci. Cryst. Eng. Mater. 2021, 77, 357–364. [Google Scholar] [CrossRef]
  28. van der Lee, A.; Dumitrescu, D.G. Thermal expansion properties of organic crystals: A CSD study. Chem. Sci. 2021, 12, 8537–8547. [Google Scholar] [CrossRef]
  29. Tom, R.; Rose, T.; Bier, I.; O’Brien, H.; Vázquez-Mayagoitia, A.; Marom, N. Genarris 2.0: A random structure generator for molecular crystals. Comput. Phys. Commun. 2020, 250, 107170. [Google Scholar] [CrossRef]
  30. Kadan, A.; Ryczko, K.; Wildman, A.; Wang, R.; Roitberg, A.; Yamazaki, T. Accelerated Organic Crystal Structure Prediction with Genetic Algorithms and Machine Learning. J. Chem. Theory Comput. 2023, 19, 9388–9402. [Google Scholar] [CrossRef] [PubMed]
  31. Chmiela, S.; Vassilev-Galindo, V.; Unke, O.T.; Kabylda, A.; Sauceda, H.E.; Tkatchenko, A.; Müller, K.R. Accurate global machine learning force fields for molecules with hundreds of atoms. Sci. Adv. 2023, 9, eadf0873. [Google Scholar] [CrossRef] [PubMed]
  32. Bidault, X.; Chaudhuri, S. How Accurate Can Crystal Structure Predictions Be for High-Energy Molecular Crystals? Molecules 2023, 28, 4471. [Google Scholar] [CrossRef] [PubMed]
  33. Rice, B.M.; Sorescu, D.C. Assessing a Generalized CHNO Intermolecular Potential through ab Initio Crystal Structure Prediction. J. Phys. Chem. B 2004, 108, 17730–17739. [Google Scholar] [CrossRef]
  34. Sun, H. COMPASS: An ab Initio Force-Field Optimized for Condensed-Phase Applications. Overview with Details on Alkane and Benzene Compounds. J. Phys. Chem. B 1998, 102, 7338–7364. [Google Scholar] [CrossRef]
  35. Mayo, S.L.; Olafson, B.D.; Goddard, W.A. DREIDING: A generic force field for molecular simulations. J. Phys. Chem. 1990, 94, 8897–8909. [Google Scholar] [CrossRef]
  36. Sun, H.; Mumby, S.J.; Maple, J.R.; Hagler, A.T. An ab Initio CFF93 All-Atom Force Field for Polycarbonates. J. Am. Chem. Soc. 1994, 116, 2978–2987. [Google Scholar] [CrossRef]
  37. Mathieu, D. Molecular Energies Derived from Deep Learning: Application to the Prediction of Formation Enthalpies Up to High Energy Compounds. Mol. Inform. 2021, 41, 2100064. [Google Scholar] [CrossRef]
  38. Kim, C.K.; Cho, S.G.; Kim, C.K.; Park, H.; Zhang, H.; Lee, H.W. Prediction of densities for solid energetic molecules with molecular surface electrostatic potentials. J. Comput. Chem. 2008, 29, 1818–1824. [Google Scholar] [CrossRef]
  39. Politzer, P.; Martinez, J.; Murray, J.S.; Concha, M.C. An electrostatic correction for improved crystal density predictions of energetic ionic compounds. Mol. Phys. 2010, 108, 1391–1396. [Google Scholar] [CrossRef]
  40. Rice, B.M.; Byrd, E.F.C. Evaluation of electrostatic descriptors for predicting crystalline density. J. Comput. Chem. 2013, 34, 2146–2151. [Google Scholar] [CrossRef]
  41. Beaucamp, S.; Mathieu, D.; Agafonov, V. Optimal partitioning of molecular properties into additive contributions: The case of crystal volumes. Acta Crystallogr. Sect. B Struct. Sci. 2007, 63, 277–284. [Google Scholar] [CrossRef] [PubMed]
  42. Wespiser, C.; Mathieu, D. Application of Machine Learning to the Design of Energetic Materials: Preliminary Experience and Comparison with Alternative Techniques. Propellants Explos. Pyrotech. 2023, 48, e202200264. [Google Scholar] [CrossRef]
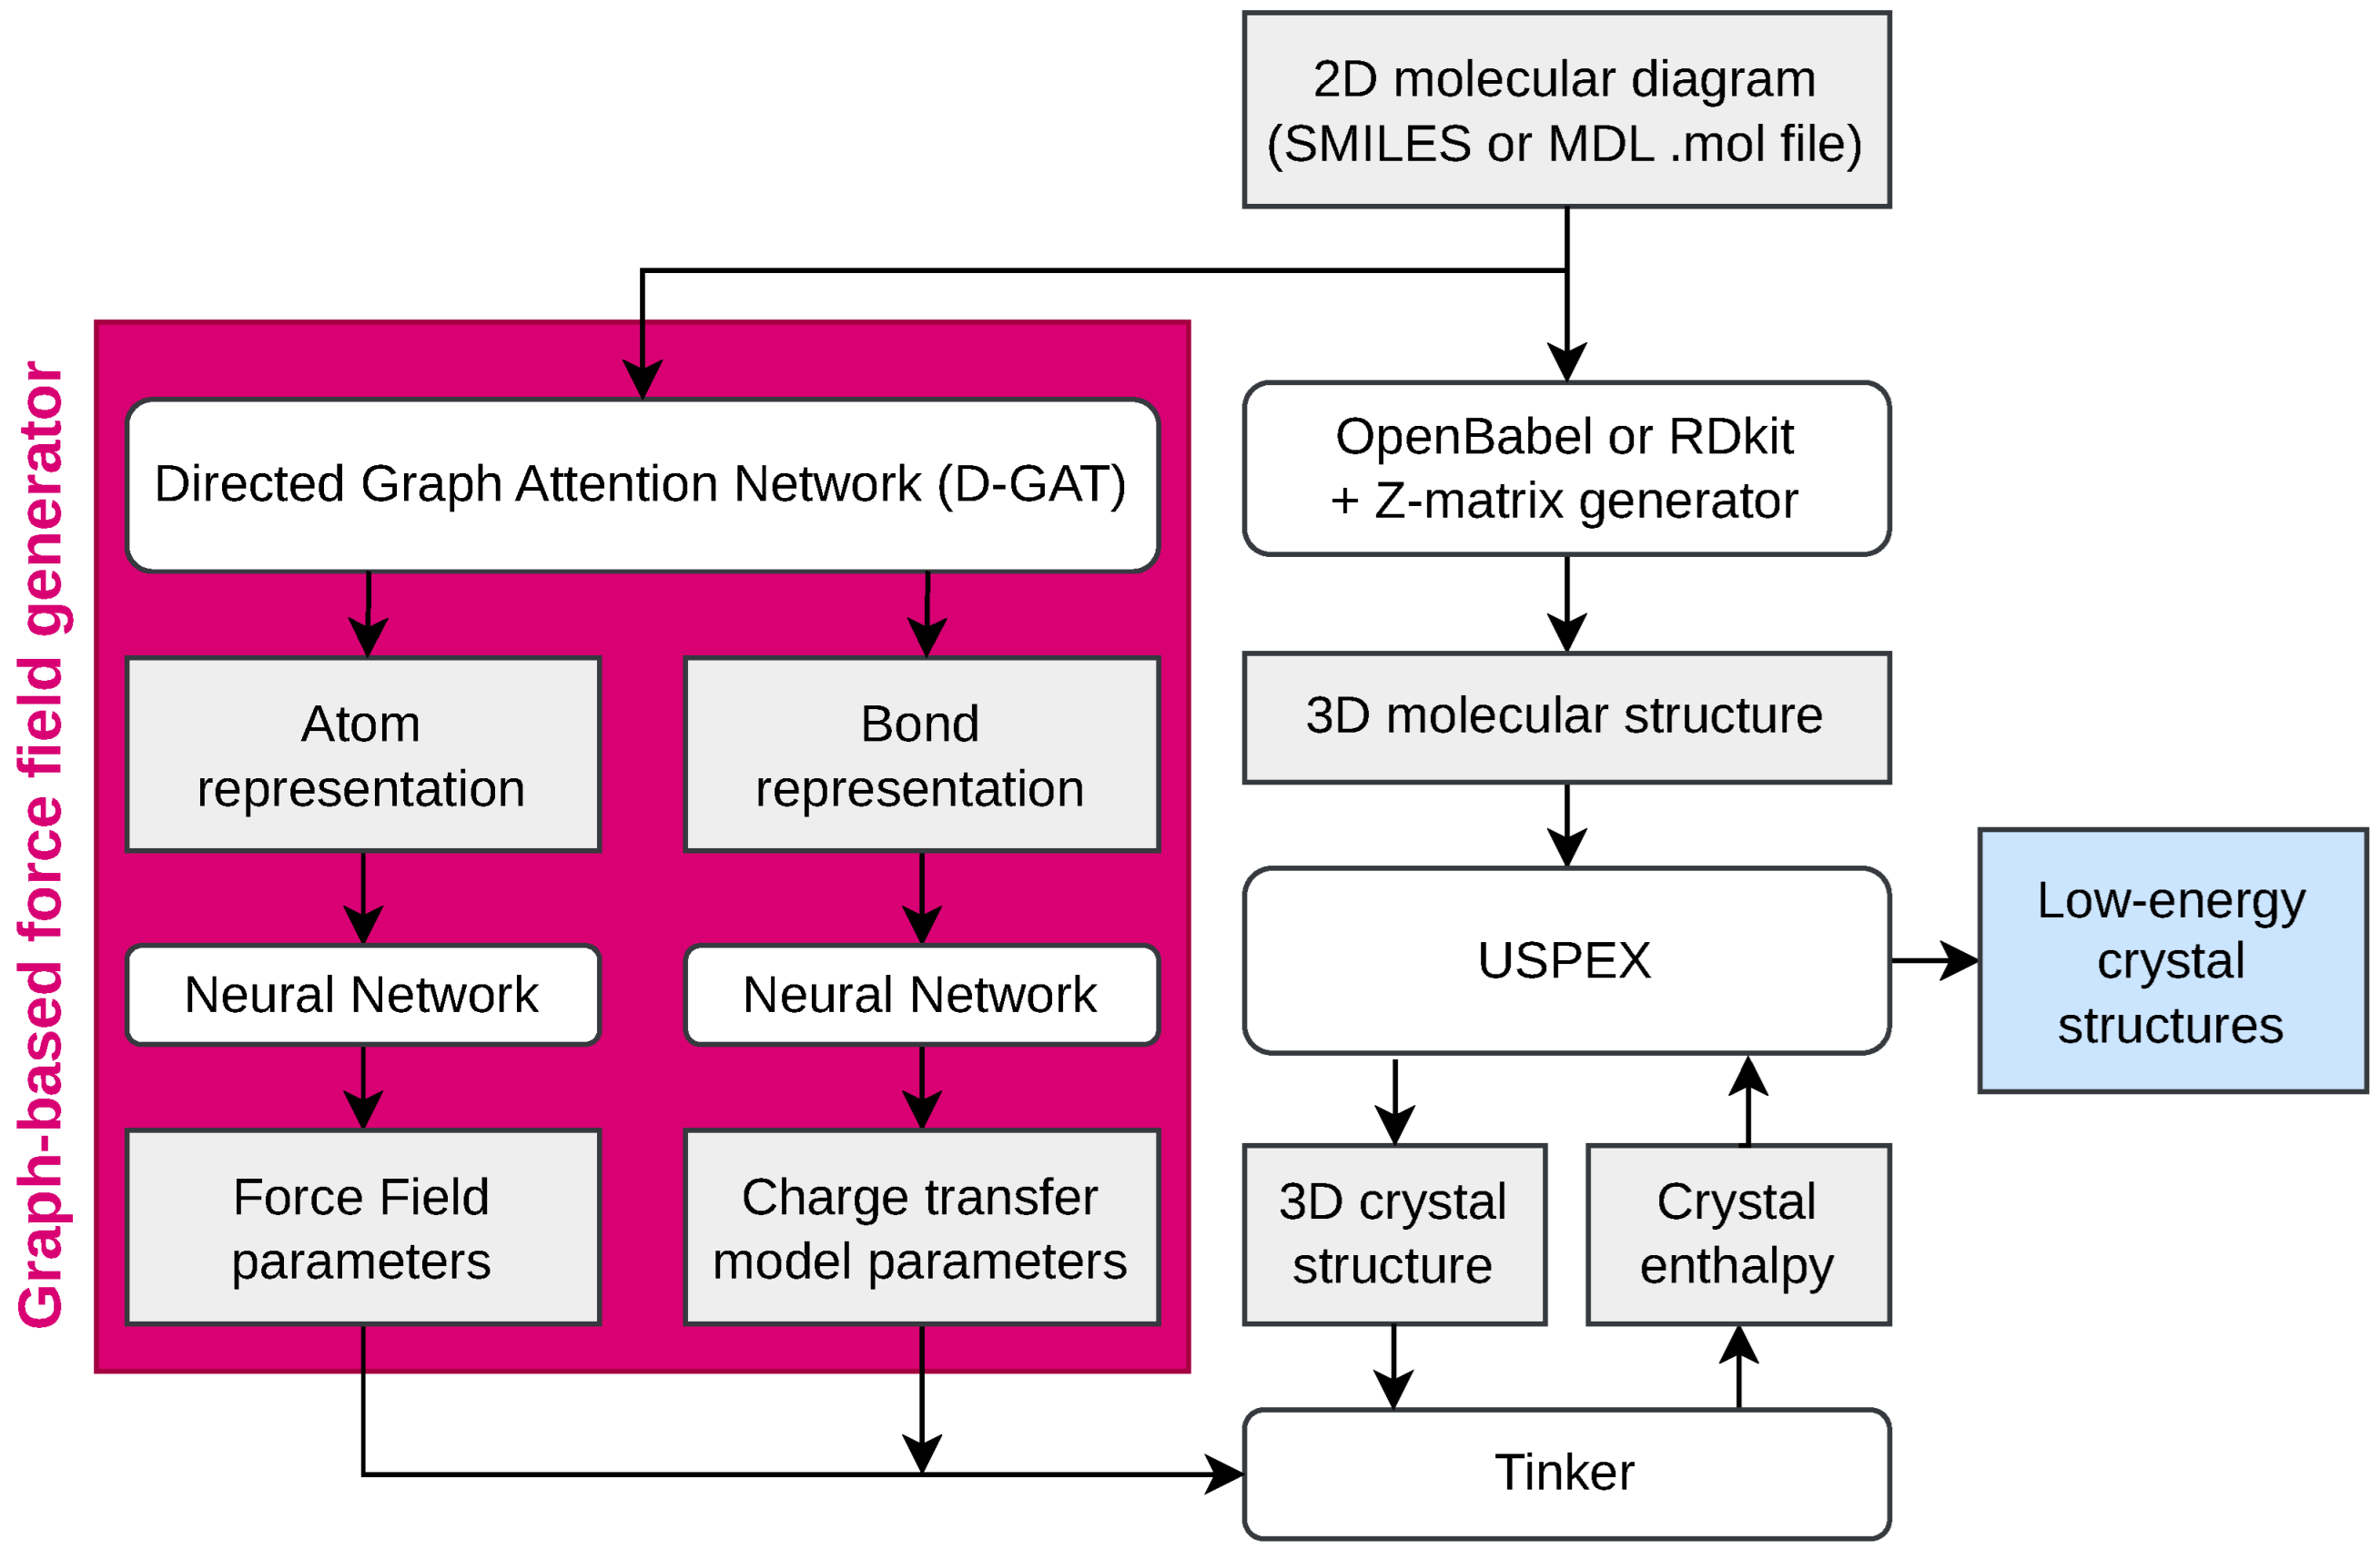
Figure 1. Overview of the current workflow taking advantage of a recent graph-based force field generator [15] for routine conversion of 2D molecular diagrams to low-energy crystal structures.
Aichem 01 00002 g001
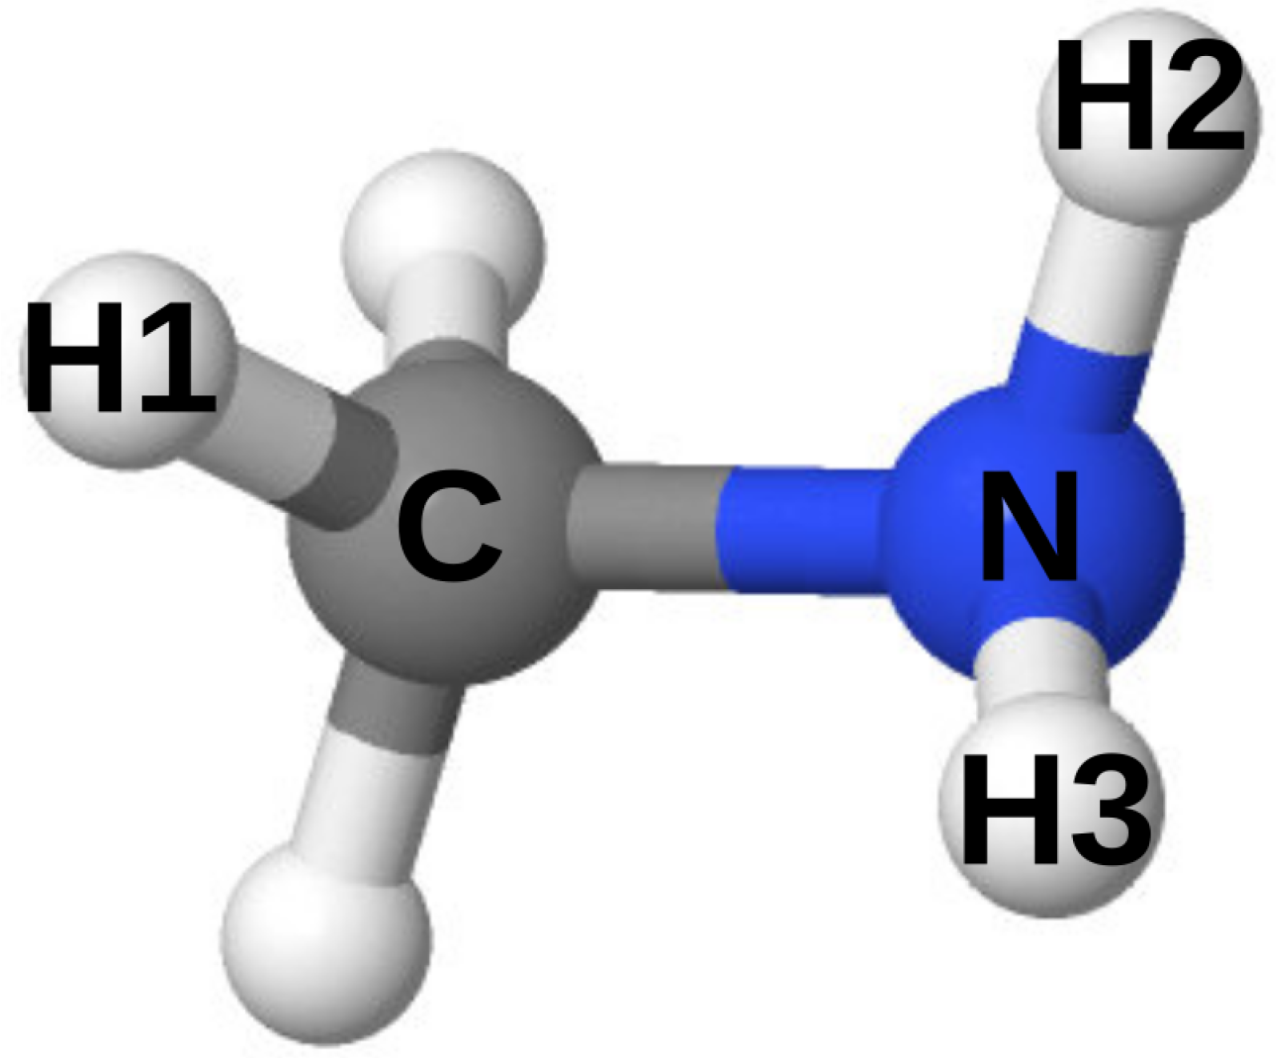
Figure 2. USPEX requirements on Z-matrixes. If the position of atom H2 is defined using the torsion angle H2−N−C−H1, the position of H3 cannot be defined using H3−N−C−H1 because modifying this angle would affect the position of H3 instead of rotating the whole NH 2 group. The script provided with the present paper would use H3−N−C−H2 instead, even though C−H2 does not represent a covalent bond.
Aichem 01 00002 g002
Figure 3. GB-FF/USPEX predicted densities at 298 K plotted against the experiment for compounds from the Li et al. [13] and Ghule et al. [14] data sets. G1/7 stands for compound No.7 in Table 1 from Ghule et al. [14]. The structure of all labeled compounds is shown in Figure 4.
Aichem 01 00002 g003
Figure 4. Molecular structures of outliers shown in Figure 3.
Aichem 01 00002 g004
Figure 5. Distribution of #gen values over 242 USPEX runs carried out in this work to predict the structures of the crystals compiled in the Li and Ghule data sets [13,14]. The numbers in the bars are the frequencies in percents.
Aichem 01 00002 g005
Table 1. Relative deviations (%) between calculated equilibrium density and experiment for the Li et al. data set [13]: minimal, maximal, and average values, as well as average relative unsigned error. The results are for relaxed experimental structures, except for the last row (GB-FF/USPEX), which shows data obtained for USPEX-predicted structures (to be discussed in Section 3.2 below).
ModelMINMAXARDARE
PFF−35.8+9.6−1.24.0
DREIDING−15.3+4.1−5.15.4
COMPASS−13.0+30.4+5.76.4
GB-FF−4.2+12.1+6.16.3
GB-FF/USPEX−8.0+29.0+5.86.2
Table 2. Same data as in Table 1, except that equilibrium densities have been divided by 1.05 to account for thermal expansion.
ModelMINMAXARDARE
PFF−38.9+4.4−5.96.1
DREIDING−19.3−0.8−9.79.7
COMPASS−17.2+24.2+0.73.3
GB-FF−8.8+6.8+1.12.4
GB-FF/USPEX−12.4+23.0+0.83.4
Table 3. Densities in g. cm 3 for the crystals in the Moxnes et al. database [12], along with relative % deviations between calculations and the experiment (in parentheses). Computed values were predicted using PolymorphPredictor (P.P.) along with COMPASS, and USPEX along with GB-FF. Relaxed values were obtained upon relaxation of observed polymorphs using GB-FF. The experimental value for DNAM was extrapolated from 150 K to 298 K assuming an expansion coefficient of 170 × 10 6 K 1 .
CompoundCSDSpaceExp.COMPASSGB-FFGB-FF
CodeGroup (P.P.)(USPEX)(Relaxed)
RDXCTMTNA02Pbca1.821.806(−0.8)1.854(+1.9)1.809(−0.6)
TNTZZZMUC01P21/c1.651.792(+8.6)1.712(+3.8)1.691(+2.5)
NTOQOYJOD05P21/c1.911.960(+2.6)1.965(+2.9)1.911(+0.1)
DNAMQEVVIXPnma1.951.989(+2.0)1.983(+1.7)2.031(+4.1)
CL-20PUBMUUP21/n2.042.065(+1.2)2.012(−1.3)2.034(−0.3)
DADNESEDTUQ03P21/n1.892.021(+6.9)2.023(+7.0)1.955(+3.4)
α -HMXOCHTETFdd21.871.805(−3.5)1.868(−0.1)1.871(+0.1)
β -HMXOCHTET12P21/c1.961.873(−4.4)1.868(−4.7)1.908(−2.6)
ARE from raw equilibrium densities (0 K):6.7 6.4 5.9
ARE from scaled equilibrium densities (298 K):3.8 2.9 1.7
Table 4. Same data as in Table 2 for the Ghule et al. data set: GB-FF is compared to force fields used in this previous work [14].
ModelMINMAXARDARE
PCFF−14.65.6−4.95.3
DREIDING−13.26.6−2.44.1
COMPASS−17.728.45.76.9
GB-FF/USPEX−6.812.12.33.5
Disclaimer/Publisher’s Note: The statements, opinions and data contained in all publications are solely those of the individual author(s) and contributor(s) and not of MDPI and/or the editor(s). MDPI and/or the editor(s) disclaim responsibility for any injury to people or property resulting from any ideas, methods, instructions or products referred to in the content.